High-Redshift Galaxy Candidates at as Revealed by JWST Observations of WHL0137-08
Abstract
We report the discovery of four galaxy candidates observed 450 – 600 Myr after the Big Bang with photometric redshifts between measured using James Webb Space Telescope (JWST) NIRCam imaging of the galaxy cluster WHL013708 observed in 8 filters spanning 0.8–5.0 m, plus 9 Hubble Space Telescope filters spanning 0.4–1.7 m. One candidate is gravitationally lensed with a magnification of , while the other three are located in a nearby NIRCam module with expected magnifications of . Using SED fitting, we estimate the stellar masses of these galaxies are typically in the range = . All appear young with mass-weighted ages Myr, low dust content mag, and specific star formation rates sSFR Gyr-1 for most. One candidate is consistent with an age Myr and a sSFR Gyr-1, as inferred from a strong F444W excess, implying [O iii]+H rest-frame equivalent width 2000 Å, although an older object is also allowed. Another candidate is lensed into an arc 24 long with a magnification of . This arc is the most spatially-resolved galaxy at known to date, revealing structures 30 pc across. Follow-up spectroscopy of WHL013708 with JWST/NIRSpec will be useful to spectroscopically confirm these high-redshift galaxy candidates and to study their physical properties in more detail.
1 Introduction
The James Webb Space Telescope (JWST), with its 6.5m aperture and infrared capabilities (Rigby et al., 2023), has opened a new window to study galaxies in the early universe. In the first weeks of JWST science observation, a wealth of distant galaxy candidates (Naidu et al., 2022a; Castellano et al., 2022; Donnan et al., 2023; Finkelstein et al., 2022; Adams et al., 2023; Atek et al., 2023; Harikane et al., 2023) were reported from the JWST Early Release Observations (ERO; Pontoppidan et al., 2022) and the Cosmic Evolution Early Release Science (CEERS) (Finkelstein et al., 2017) and Through the Looking GLASS (GLASS-JWST) (Treu et al., 2022) Early Release Science (ERS) programs that surpass the distance record set by the Hubble Space Telescope (HST) at (Oesch et al., 2016). These independent studies have revealed an unexpectedly large abundance of bright galaxies (; e.g., Finkelstein et al. 2022; Naidu et al. 2022a; Atek et al. 2023; Furtak et al. 2023) that could pose a challenge to our current models of galaxy formation (Naidu et al., 2022b; Ferrara et al., 2023; Harikane et al., 2023). Similarly, some candidates were reported to have surprisingly large stellar masses (Labbé et al., 2023) in apparent tension with CDM (Boylan-Kolchin, 2023; Lovell et al., 2023) unless these galaxies have lower masses (Endsley et al., 2023; Steinhardt et al., 2023) or incorrect redshifts.
Simulations suggest we should not have expected to find overly massive galaxies in early JWST observations, but rather that we have likely only discovered the youngest, most actively star forming galaxies given imaging depths to date of AB mag 29 (Mason et al., 2023). Analyses of these candidates observed in JWST imaging further reveal young stellar ages Myr (Whitler et al., 2023; Furtak et al., 2023), younger than the median ages Myr measured at slightly lower redshifts (Leethochawalit et al., 2023; Endsley et al., 2023). Evidence that some of these galaxies are extremely young, Myr, is provided by very strong emission lines in NIRSpec spectroscopy (Carnall et al., 2023; Tacchella et al., 2023; Trussler et al., 2023), with flux excesses also clearly observed in photometry, especially when imaging is available in four NIRCam long-wavelength filters F277W, F356W, F410M, and F444W.
Gravitational lensing by massive galaxy clusters can address these problems in some detail as it provides magnified distant galaxies, boosting their luminosity and revealing small-scale structures that would otherwise be unobservable. Using these “cosmic telescopes”, surveys such as CLASH (Postman et al., 2012), the Hubble Frontier Fields (Lotz et al., 2017), and RELICS (Coe et al., 2019) have revealed hundreds of galaxy candidates in the reionization epoch. Using this technique, we have discovered highly magnified (Bradley et al., 2008; Zheng et al., 2012; Hoag et al., 2017; Bouwens et al., 2014; Bradley et al., 2014; Infante et al., 2015; Salmon et al., 2018, 2020) and multiply imaged galaxies (Frye & Broadhurst, 1998; Frye et al., 2008; Coe et al., 2013; Zitrin et al., 2014) at redshifts up to , many of which were the most-distant known galaxy at the time of their discovery. Recent JWST observations of lensing clusters have pushed this frontier even further with many high-redshift candidates detected in ERO observations of the massive galaxy cluster SMACS0723 (Adams et al., 2023; Atek et al., 2023; Morishita & Stiavelli, 2023; Donnan et al., 2023; Harikane et al., 2023) and the GLASS-JWST cluster Abell 2744 (Naidu et al., 2022a; Castellano et al., 2022; Leethochawalit et al., 2023; Donnan et al., 2023; Harikane et al., 2023), with photometric redshifts out to (Atek et al., 2023).
Gravitationally lensed galaxies have allowed us to place strong constraints on the evolution of the galaxy ultraviolet luminosity function and the star formation rate density at (Bouwens et al., 2014; Atek et al., 2015; Ishigaki et al., 2015; Laporte et al., 2015; Livermore et al., 2017; Bouwens et al., 2017; Atek et al., 2018; Bhatawdekar et al., 2019; Bouwens et al., 2022). Gravitational lensing has also provided us the ability to study small-scale structures and star clusters within high-redshift galaxies down to scales of a few parsec (e.g., Vanzella et al., 2022; Meštrić et al., 2022; Welch et al., 2023).
The Reionization Lensing Cluster Survey (RELICS) HST Treasury Program (Coe et al., 2019) was designed to efficiently discover high-redshift galaxy candidates bright enough for follow-up observations with current and future observatories, including the Atacama Large Millimeter/submillimeter Array (ALMA) and JWST. By observing 41 strong lensing galaxy clusters with Hubble and Spitzer, RELICS discovered and studied over 300 high-redshift candidates in the first billion years (Salmon et al., 2020; Strait et al., 2021), including the brightest robust candidates known at , the Sunrise Arc, a 25 long arc at (Salmon et al., 2020), and the most distant spatially-resolved lensed arc, SPT0615-JD1, at (Salmon et al., 2018). Remarkably, the RELICS survey also discovered the gravitationally lensed star WHL0137-LS, nicknamed Earendel, with a photometric redshift (Welch et al., 2022).
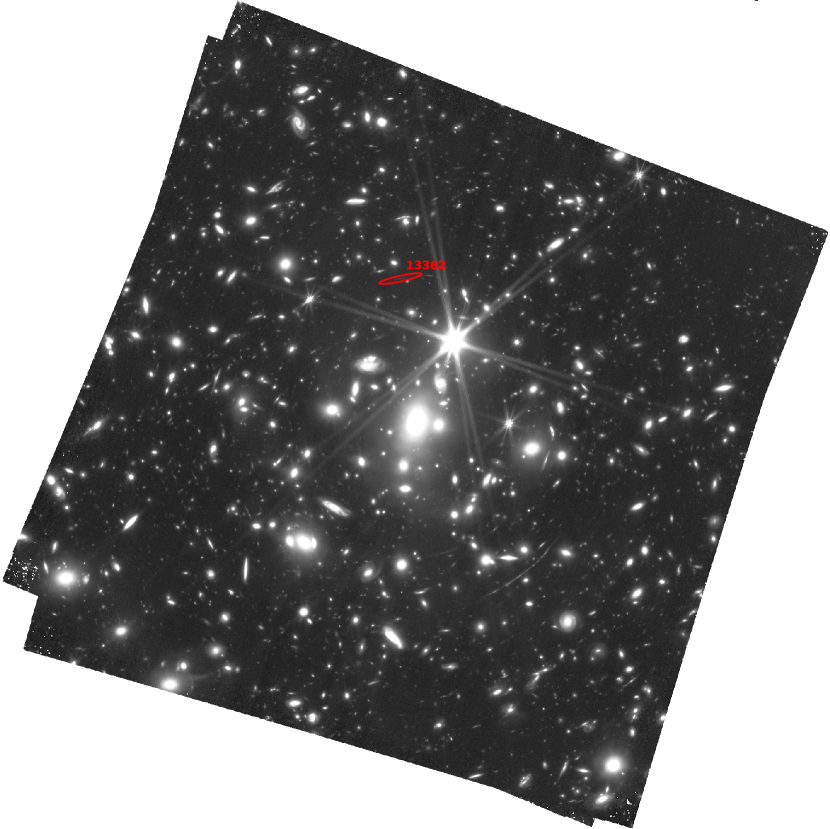
Earendel was discovered within the Sunrise Arc Welch et al. (2023) lensed by the massive galaxy cluster WHL J013719.8–082841 (hereafter WHL013708; RA = 01:37:25.0, Dec = 08:27:23, J2000), which is the focus of this paper. WHL013708 was discovered by Wen et al. (2012) based on photometric redshifts in SDSS-III DR8 (Aihara et al., 2011) and has a spectroscopic redshift of based on two cluster members within Mpc from its brightest cluster galaxy (Wen & Han, 2015). The Planck SZ survey also identified this cluster (WHL-J24.3324-8.477) as the 31st most massive in the Planck PSZ2 catalog with (Planck Collaboration et al., 2016).
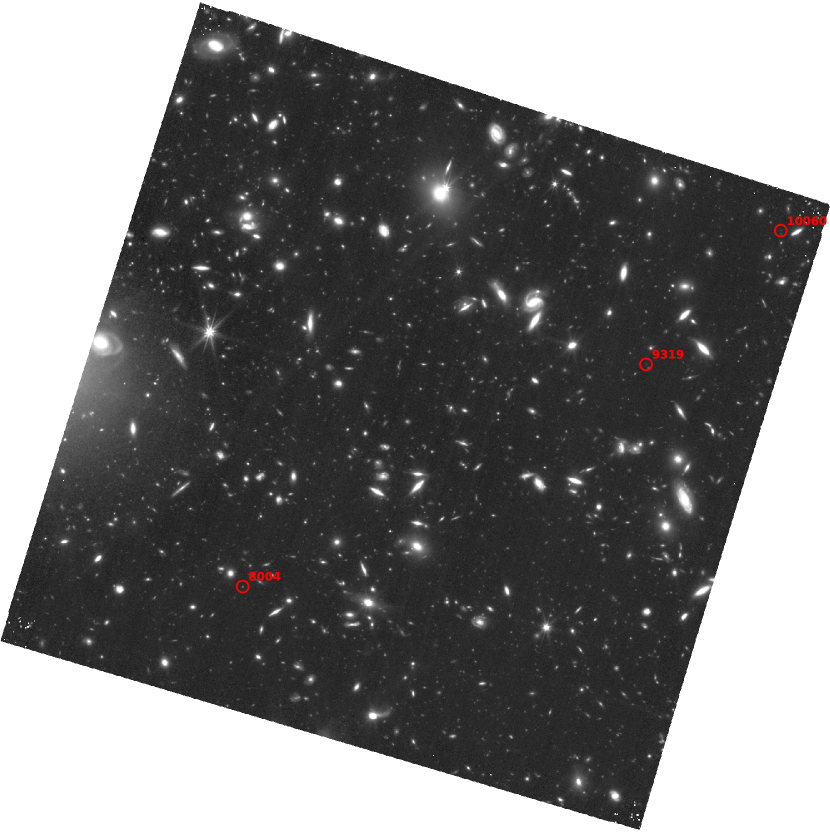
In this paper, we present high-redshift candidates at discovered in JWST NIRCam imaging of WHL013708, obtained primarily to study Earendel (Welch et al., 2022) and the Sunrise Arc in more detail. Our sample includes both a strongly-lensed galaxy candidate discovered behind the cluster and three candidates in the nearby NIRCam module, centered 29 from the cluster center, with weak magnifications of . We use the AB magnitude system, (Oke, 1974; Oke & Gunn, 1983). Where needed, we adopt a Planck 2018 flat CDM cosmology (Planck Collaboration et al., 2020) with km s-1 Mpc-1, , and , for which the universe is 13.8 billion years old and kpc at .
All of the JWST and HST data of WHL013708 are public. Reduced images, catalogs, lens models, and analysis code are available via our website.111https://cosmic-spring.github.io
2 Observations
| Cluster Field | Parallel Field | ||||||||
|---|---|---|---|---|---|---|---|---|---|
| Wavelength | Exposure Time | aa5 limiting AB magnitude in a circular aperture | bb5 limiting flux in a circular aperture | Exposure Time | aa5 limiting AB magnitude in a circular aperture | bb5 limiting flux in a circular aperture | |||
| Camera | Filter | (µm) | (s) | (nJy) | (AB) | (s) | (nJy) | (AB) | |
| HST ACS/WFC | F435W | 0.37–0.47 | 2072 | 27.7 | 29.5 | ||||
| HST ACS/WFC | F475W | 0.4–0.55 | 3988 | 28.5 | 14.9 | ||||
| HST ACS/WFC | F606W | 0.47–0.7 | 2072 | 28.4 | 16.5 | ||||
| HST ACS/WFC | F814W | 0.7–0.95 | 13326 | 28.8 | 10.5 | ||||
| HST WFC3/IR | F105W | 0.9–1.2 | 1411 | 27.9 | 25.4 | ||||
| HST WFC3/IR | F110W | 0.9–1.4 | 10047 | 29.4 | 6.17 | ||||
| HST WFC3/IR | F125W | 1.1–1.4 | 711 | 27.3 | 42.8 | ||||
| HST WFC3/IR | F140W | 1.2–1.6 | 711 | 27.5 | 37.0 | ||||
| HST WFC3/IR | F160W | 1.4–1.7 | 1961 | 27.9 | 25.5 | ||||
| JWST NIRCam | F090W | 0.8–1.0 | 4208 | 28.6 | 13.3 | 2104 | 28.4 | 16.0 | |
| JWST NIRCam | F115W | 1.0–1.3 | 4208 | 28.6 | 12.6 | 2104 | 28.4 | 15.5 | |
| JWST NIRCam | F150W | 1.3–1.7 | 2104 | 28.5 | 14.1 | 2104 | 28.6 | 13.2 | |
| JWST NIRCam | F200W | 1.7–2.2 | 2104 | 28.7 | 11.9 | 2104 | 28.7 | 11.7 | |
| JWST NIRCam | F277W | 2.4–3.1 | 4208 | 29.5 | 5.6 | 2104 | 29.3 | 6.7 | |
| JWST NIRCam | F356W | 3.1–4.0 | 4208 | 29.7 | 5.0 | 2104 | 29.4 | 6.1 | |
| JWST NIRCam | F410M | 3.8–4.3 | 2104 | 28.7 | 11.6 | 2104 | 28.8 | 11.2 | |
| JWST NIRCam | F444W | 3.8–5.0 | 2104 | 29.1 | 8.1 | 2104 | 29.1 | 8.1 | |
2.1 JWST Data
We obtained JWST NIRCam imaging of WHL013708 (GO 2282, PI Coe) in July 2022 and January 2023 as part of a program to further study Earendel and the Sunrise Arc. The first epoch of NIRCam observations cover eight filters (F090W, F115W, F150W, F200W, F277W, F356W, F410M, and F444W) spanning with 2104 s of exposure time in each filter. The NIRCam imaging was obtained over two fields separated by 40.5″, covering 10.2 arcmin2 in total. For the first epoch, the WHL013708 cluster was centered on NIRCam module B while NIRCam module A obtained observations on a nearby field centered 29 northwest of the cluster center. For the second epoch, the NIRCam observations cover four filters (F090W, F115W, F277W, and F356W) with 2104 s of exposure time in each filter. The observations for the second epoch were obtained 185∘ from the first epoch. The cluster was again centered on NIRCam module B, while NIRCam module A obtained observations on another nearby field southeast of the cluster center. Because this second parallel field has imaging only in 4 filters, we do not use it in this analysis.
Each exposure uses the SHALLOW4 readout pattern with ten groups and one integration. We use the INTRAMODULEBOX dither pattern with four dithers to fill the 5″ gaps in the short wavelength detectors and to maximize the area with full exposure time. The dither pattern also mitigates the effects of bad pixels and image artifacts and also improves the spatial resolution of the resampled/drizzled images.
2.2 HST Data
The RELICS HST Treasury program (GO 14096; Coe et al., 2019) obtained the first HST imaging of the galaxy cluster WHL013708 in 2016 with three orbits of ACS (F435W, F606W, and F814W) and two orbits of WFC3/IR (F105W, F125W, F140W, and F160W) data spanning . Two follow-up HST imaging programs (GO 15842 and GO 16668; PI: Coe) have thus far obtained an additional 5 orbits of HST ACS imaging in F814W, 2 orbits in F475W, and 4 orbits with WFC3/IR in F110W. Two more orbits of WFC3/IR F110W data are yet to be obtained from the Earendel monitoring program (GO 16668). The HST data cover only the cluster field.
3 Methods
3.1 Data Reduction
We retrieved the pipeline-calibrated HST data and the JWST level-2 imaging products and processed them using grizli222https://github.com/gbrammer/grizli (version 1.8.12) reduction pipeline (Brammer et al., 2022). The calibrated HST optical and near-infrared data were obtained from Complete Hubble Archive for Galaxy Evolution (CHArGE) (Kokorev et al., 2022). The grizli image reduction process is described in Valentino et al. (2023). The JWST data were processed with version 1.9.6 of the calibration pipeline with latest CRDS context jwst_1093.pmap, which includes the most recent photometric calibrations based on in-flight data.
For the JWST data, the grizli reduction pipeline applies a correction to reduce the effect of noise and masks “snowballs”333https://jwst-docs.stsci.edu/data-artifacts-and-features/snowballs-artifact that are are caused by large cosmic ray impacts to the NIRCam detectors. The grizli pipeline also includes a correction for faint, diffuse stray light features, called “wisps”444https://jwst-docs.stsci.edu/jwst-near-infrared-camera/nircam-features-and-caveats/nircam-claws-and-wisps that are present at the same detector locations in NIRCam images. These stray-light features are most prominent in the NIRCam A3, B3, and B4 detectors in the F150W and F200W data. A “wisp” template was subtracted from each of these detectors for both the F150W and F200W data.
The grizli pipeline aligns the HST and JWST data to a common world coordinate system registered to the GAIA DR3 catalogs (Gaia Collaboration et al., 2021). The fully-calibrated images in each filter were combined and drizzled to a common pixel grid using astrodrizzle (Koekemoer et al., 2003; Hoffmann et al., 2021). The HST and JWST NIRCam long-wavelength (LW) filters (F277W, F356W, F410M, and F444W) were drizzled to a grid of 004 per pixel while the JWST short-wavelength NIRCam filters (F090W, F115W, F150W, and F200W) were drizzled to a grid of 002 per pixel.
These grizli reduced images are available publicly, alongside images and catalogs from other JWST programs with public data.555https://jwst-grizli.s3.amazonaws.com/sunrise-new/sunrise-v2_index.html
3.2 Photometric Catalogs
To produce the photometric catalogs, the NIRCam SW images were first rebinned to a pixel scale of 004 per pixel, placing the images for all 17 filters on the same pixel grid. Sources were then identified in a detection image comprised of a weighted sum of the F277W, F356W, and F444W NIRCam LW images using photutils (Bradley, 2023) image-segmentation tools. Visual inspection of the segmentation image revealed a long lensed arc that had been segmented into five separate components. Therefore, we combined the separate arc segments into a single source before performing photometry.
Source fluxes were measured with photutils in flexible elliptical Kron apertures with a scale factor of 1.5. The size of the elliptical Kron aperture is calculated for each source by multiplying the Kron scale factor by the Kron radius, which is calculated independently for each source using the first-order moment of its flux distribution. It has been shown that measuring colors in small elliptical apertures accurately recovers the colors of distant galaxies (Finkelstein et al., 2022, 2023). We then performed a second run of photutils on the detection image using Kron apertures with a scale factor of 2.5. An aperture correction to the total flux for the small apertures was estimated as the ratio between the flux in the larger aperture and that in the smaller aperture for each source. We then applied this aperture correction the fluxes and uncertainties for all filters.
3.3 Photometric Redshifts
We derive initial photometric redshifts using eazypy (Brammer et al., 2008), which fits the observed photometry of each galaxy using a set of templates added in a non-negative linear combination. We use the photometry measured in elliptical Kron apertures with a scale factor of 1.5. Both JWST and HST photometry is included in the photometric redshift calculations for the WHL013708 cluster field, while only JWST photometry is used for the Module A field. The photometric redshifts were calculated using a template set comprised of the 12 “tweak_fsps_QSF_12_v3” templates derived from the Flexible Stellar Population Synthesis (FSPS) library (Conroy et al., 2009, 2010; Conroy & Gunn, 2010), which include a range of galaxy types (e.g., star-forming, quiescent, dusty) and realistic star formation histories (e.g., bursty, slowly rising, slowly falling). To these FSPS templates, we add six templates from (Larson et al., 2022) that span bluer colors than he fiducial FSPS templates. These additional templates were found to provide better photometric-redshift accuracies for bluer galaxies at (Larson et al., 2022). We allow the redshifts to span from , in steps of 0.01. Because we are just beginning to explore galaxies at these epochs, the high-redshift luminosity function, especially at the bright end, is not well-known at . Therefore, we adopt a flat luminosity prior, similar to recent similar to recent JWST high-redshift studies (e.g., Finkelstein et al., 2022; Adams et al., 2023; Finkelstein et al., 2023), to prevent bias against the selection of bright high-redshift galaxies.
3.4 High-Redshift Candidate Selection
We select our initial sample of high-redshift candidate galaxies using a combination of criteria using both signal-to-noise and photometric redshift measurements. Measuring photometric redshifts using SED fitting is a well-established method for selecting high-redshift galaxy candidates that simultaneously uses the photometry in all bands (e.g., Bradley et al., 2014; Salmon et al., 2020; Finkelstein et al., 2022; Naidu et al., 2022c; Adams et al., 2023; Donnan et al., 2023; Finkelstein et al., 2023). The photometric signal-to-noise (SNR) criteria are used to both ensure non-detections in filters blueward of Lyman- and to ensure robust photometric detections in multiple filters redward of the Lyman- break, which minimizes spurious noise detections. We also visually inspect each candidate galaxy in each filter image and its best-fit SED to remove detector artifacts and other spurious sources such as diffraction spikes, misidentified parts of larger galaxies, and spurious noise close to the detector edge.
We use a criteria similar to Finkelstein et al. (2023) to select our initial sample of high-redshift candidates while minimizing contamination from low-redshift interlopers:
-
•
A SNR of to ensure non-detections blueward of Lyman- in all of the following filters: F435W, F475W, F606W, F814W, and F090W.
-
•
A SNR of in at least two the following filters: F115W, F150W, F200W, F277W, F356W, and F444W to reduce spurious sources.
-
•
Best-fit photometric redshift measured by eazypy of
-
•
Integral of the eazypy posterior redshift probability () at of
-
•
of the best-fit eazypy spectral-energy distribution (SED) of
We also require additional non-detections as a function of the redshift selection window as follows. For the sample, we require the F115W SNR . For the sample, we require the F115W and F150W SNR . These filters are bluer than Lyman- at these corresponding redshifts.
Additionally, we ran eazypy restricting the maximum redshift to . We then calculate the difference of the best-fit for these “low-redshift” solutions and the best-fit for the high-redshift solutions. For our high-redshift sample, we require a conservative , ruling out the low-redshift model at significance (Harikane et al., 2023).
As a further check, we also calculated photometric redshifts using eazypy with the recently-added SFHZ templates. These templates have redshift-dependent star formation histories (SFH) that disfavor star formation starting earlier than the age of the universe at a given epoch. We excluded candidates from our high-redshift sample where these templates prefer a low-redshift () solution.
4 Results and Discussion
4.1 High-Redshift Sample
Our final sample consists of four high-redshift galaxy candidates. One of the candidates lies in the WHL013708 cluster field, while the remaining three are located in the nearby parallel field. As measured by eazypy, three of the candidates are at , while the remaining candidate was identified in the selection.
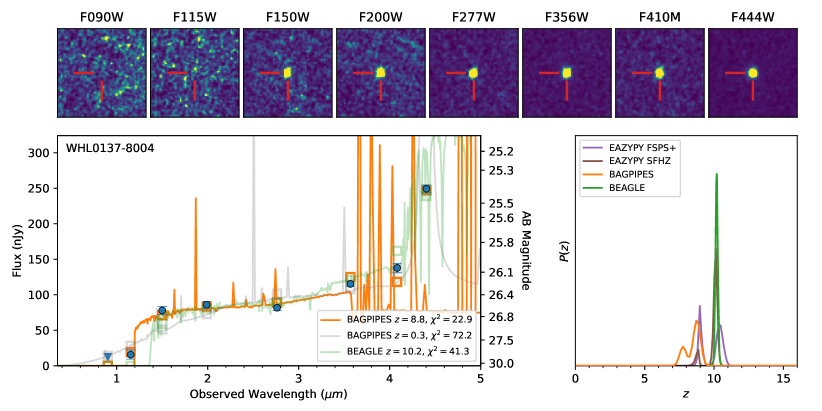
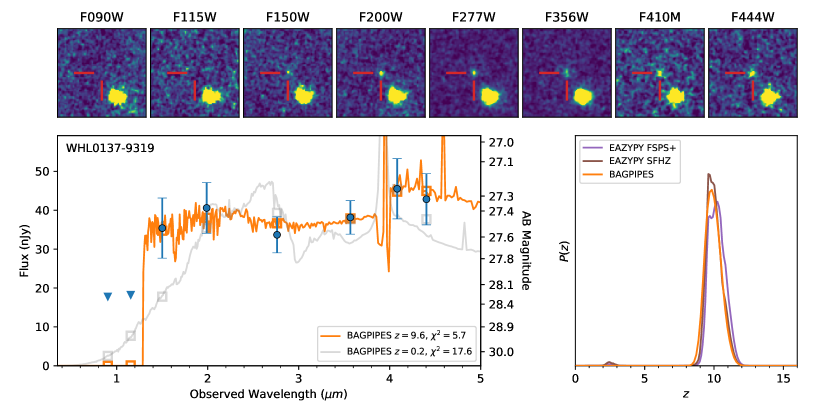
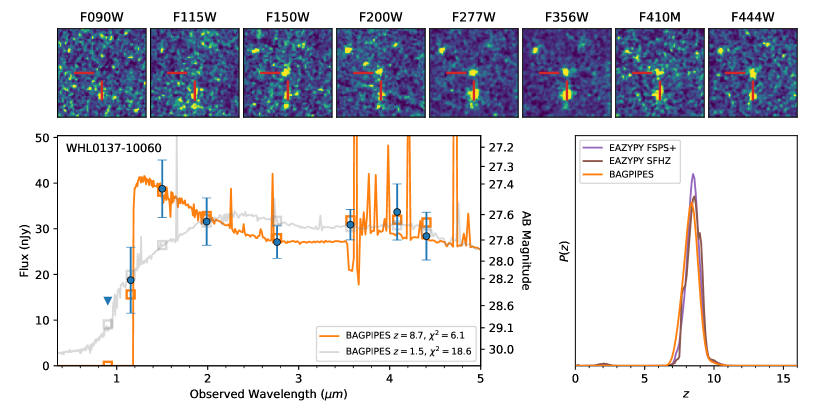
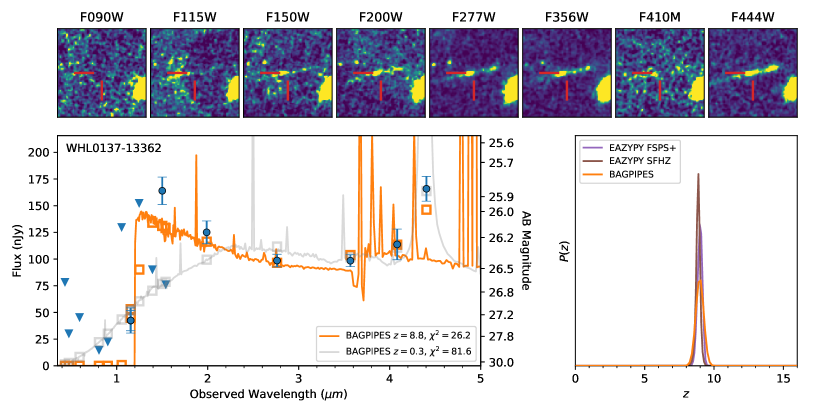
The measured (uncorrected for magnification) JWST photometry of our high-redshift candidates is presented in Table 2. For the lensed high-redshift candidate in the cluster field, we also present its measured (uncorrected for magnification) HST photometry in Table 3. In Figures 3 – 4 we present cutout images, the best-fit SEDs, and the posterior redshift distributions, , for each candidate. The posterior redshift distributions include plots for eazypy (for both the FSPS+(Larson et al., 2022) and SFHZ template sets), bagpipes, and beagle. We plot in Figures 3 – 4 the bagpipes best-fit high-redshift () SED along with the best-fit low-redshift SED constrained with redshift .
We estimate the amplitude of the Lyman- break in these candidates as 2.8, , , and magnitudes, which are significant breaks (factors of in flux ratios). The upper limits were calculated using the measured flux uncertainty for the non-detection blueward of the break. Our measured break colors are larger than the break amplitude of 0.5 mag used to select high-redshift candidates in (Atek et al., 2023), comparable to the 1.7 mag used to select candidates in (Castellano et al., 2022), and consistent with the 1.5 ( selection) and 1.4 ( selection) break color criterion in (Bouwens et al., 2023), who all used color-color selection criteria to select their high-redshift candidates.
| Object ID | RA | Dec | F090W | F115W | F150W | F200W | F277W | F356W | F410M | F444W |
|---|---|---|---|---|---|---|---|---|---|---|
| WHL0137-08004 | ||||||||||
| WHL0137-09319 | ||||||||||
| WHL0137-10060 | ||||||||||
| WHL0137-13362aaLensed candidate with a magnification of . Other candidates (located in the nearby field) are estimated to have magnifications of . |
Note. — Observed fluxes, uncorrected for magnification.
| Object ID | F105W | F110W | F125W | F140W | F160W | F435W | F475W | F606W | F814W | |
|---|---|---|---|---|---|---|---|---|---|---|
| WHL0137-13362 |
Note. — Observed fluxes, uncorrected for magnification.
4.2 Magnifications
To estimate source magnifications, we use the lens models constructed to analyze Earendel and the Sunrise Arc published in Welch et al. (2022) and which were made publicly available.666https://relics.stsci.edu/lens_models/outgoing/whl0137-08/ These models were generated using four independent lens modeling software packages: Light-Traces-Mass (LTM, Zitrin et al., 2009, 2015; Broadhurst et al., 2005), Glafic (Oguri, 2010), WSLAP+ (Diego et al., 2005, 2007), and Lenstool (Jullo et al., 2007; Jullo & Kneib, 2009). Due to a lack of multiply-imaged sources in this cluster, the slope of the lensing potential in these models varies by a factor of six, which adds considerable uncertainty to our magnification estimates. For further details about each model, please see Welch et al. (2022). The ratio of the source-plane area at of the lensed cluster field to the nearby parallel field ranges from 0.24 to 0.85 (ratios of 0.24, 0.29, 0.68, and 0.85 for the four models). The large range is reflective of the uncertainty in the slope of the lensing potential.
One candidate in our sample is strongly lensed by the WHL013708 galaxy cluster, while the other three candidates, located in the nearby NIRCam module, are expected to have only weak magnifications of . The lensed candidate is WHL0137–ID13362 with a . At this redshift, our lens models yield a magnification in the range from , with an arithmetic mean value of . The mean magnification for this candidate is quoted in Tables 3, 4, and 5.
4.3 Galaxy Sizes
We measure the half-light radius of the three unlensed candidates in the sample from the deeper detection image using the SourceCatalog class in photutils. The half-light radius is calculated relative to the “total” flux measured in elliptical Kron apertures with a Kron factor of 2.5. The derived sizes for WHL0137–ID8004, WHL0137–ID9319, and WHL0137–ID10060 are 3.3, 4.0, and 3.3 pixels (0.13″, 0.16″, and 0.13″), respectively. Therefore, all three sources are spatially resolved, being larger than the NIRCam F444W PSF full-width at half maximum of 0145 (00725 radius). The lensed sourced, WHL0137–ID13362, is also spatially resolved, stretched into a 24-long arc by the effects of gravitational lensing. The morphology of the arc is discussed in more detail in Section 4.6.
Assuming the estimated bagpipes photometric redshifts (see Table 4) of the three unlensed sources, they have physical sizes of 0.60, 0.67, and 0.61 kpc, respectively. These sizes are comparable to the galaxy sizes found in the GLASS-JWST survey ranging from kpc in F444W (Yang et al., 2022) and the CEERS survey, with sizes ranging from kpc in F200W (Finkelstein et al., 2023).
4.4 Spectral Energy Distribution (SED) Fitting
4.4.1 bagpipes
For each galaxy in our high-redshift sample, we estimate its physical properties using SED fitting. We performed SED fitting using the Bayesian Analysis of Galaxies for Physical Inference and Parameter EStimation (bagpipes; Carnall et al., 2018) Python package and the BayEsian Analysis of GaLaxy sEds (beagle; Chevallard & Charlot, 2016) tool with redshift as a free parameter.
bagpipes generates model galaxy spectra over the multidimensional space of physical parameters and fits these to the photometric data using the multinest nested sampling algorithm (Feroz & Hobson, 2008; Feroz et al., 2009; Feroz & Skilling, 2013). bagpipes uses the stellar population synthesis models from the 2016 version of the BC03 (Bruzual & Charlot, 2003) models. These models were generated using a Kroupa (2002) initial mass function (IMF) and include nebular line and continuum emission based on Cloudy (Ferland et al., 2013), with the logarithm of ionization parameter ( U) allowed to vary between to . We perform our SED fitting using a delayed exponentially declining SFH where the star formation rate (SFR) is of the form SFR. Models assuming a constant star formation rate yield younger ages and higher sSFRs, as discussed below in §4.5.
For SED fits constrained to be at low redshift (, we assume a Calzetti law (Calzetti et al., 2000) for dust attenuation. For SED fits constrained to be a high redshift (), we assume a Small Magellanic Cloud (SMC) dust law (Salim et al., 2018). For both cases, we also include a second component to the dust model that includes birth-cloud dust attenuation that is a factor of two larger around H ii regions as in the general ISM within the galaxy’s first 10 Myr. We allow dust extinction to range from = magnitudes and we vary metallicity in logarithmic space from . Formation ages vary from 1 Myr to the age of the universe.
4.4.2 beagle
We also perform SED fitting on each candidate galaxy using the beagle tool (Chevallard & Charlot, 2016) with simplified version of the configuration, fit parameters, and parameter space used in Atek et al. (2023) and Furtak et al. (2023). beagle uses SED templates by Gutkin et al. (2016), which also combine the 2016 version of the BC03 stellar population synthesis models with Cloudy to account for nebular emission. The templates include ionization parameters varying from to . These templates all assume a Chabrier (2003) IMF and model the intergalactic attenuation using the Inoue et al. (2014) attenuation curves. As with bagpipes, we assume a delayed exponential SFH, but with the possibility of an ongoing star-burst over the last 10 Myr. This allows for maximum flexibility of the SFH to be either rising or declining with a maximum at . We account for dust attenuation by assuming an SMC-like dust attenuation law (Pei, 1992), which has been found to fit high-redshift galaxies best at low metallicities (Capak et al., 2015; Reddy et al., 2015, 2018; Shivaei et al., 2020). Due to the relatively large number of free parameters, we fix the metallicity to while the stellar mass, current SFR, maximal stellar age and dust attenuation are allowed to vary freely in the ranges , , and respectively.
| Object ID | aaMean magnification and uncertainties based on multiple independent lens models. Candidates in the nearby field are estimated to have magnifications of . | bbPhotometric redshift with 2 uncertainties, using the Calzetti dust law (Calzetti et al., 2000). | ccPhotometric redshift restricted to with 2 uncertainties, using the SMC dust law (Salim et al., 2018). | SFRddStar formation rate during the past 100 Myr. | sSFR/Gyr-1 | AgeeeMass-weighted age for the delayed star formation history. | ffFormation time in Myr after the Big Bang based on the mass-weighted age. | ||
|---|---|---|---|---|---|---|---|---|---|
| Myr | mag | Myr | |||||||
| WHL0137-08004 | 556 | ||||||||
| WHL0137-09319 | 392 | ||||||||
| WHL0137-10060 | 518 | ||||||||
| WHL0137-13362 | 406 |
Note. — Physical parameter results are quoted for high-redshift solutions restricting . We quote the median and the range of the joint posterior distributions for each galaxy. We have modeled star formation histories as exponential delayed model. If constant star formation histories are assumed, age estimates decrease and sSFR increases. For the lensed source, stellar masses and SFRs are corrected for the mean magnification. Multiply these values by to apply a different magnification. We did not propagate magnification uncertainties to those parameter uncertainties.
| Object ID | aaMean magnification and uncertainties based on multiple independent lens models. Candidates in the nearby field are estimated to have magnifications of . | SFR | sSFR/Gyr | AgebbMass-weighted age in Myr. | ccRest-frame UV slope. | ddRest-frame absolute UV magnitude in the band that contains 1500 Å at the galaxy’s photometric redshift. | |||
|---|---|---|---|---|---|---|---|---|---|
| /yr | Myr | mag | |||||||
| WHL0137-08004 | |||||||||
| WHL0137-09319 | |||||||||
| WHL0137-10060 | |||||||||
| WHL0137-13362 |
Note. — Results are quoted as the median and the range of the joint posterior distributions for each galaxy. For the lensed source, stellar masses and SFRs are corrected for magnification. Multiply these values by to apply a different magnification. We did not propagate magnification uncertainties to those parameter uncertainties.
4.5 Physical Properties
The derived physical properties for our candidate high-redshift galaxies using bagpipes and beagle are presented in Tables 4 and 5, respectively. The bagpipes physical parameter results are quoted for high-redshift solutions restricted to . For WHL0137–ID13362, we divide by its mean magnification (see Section 4.2) to calculate intrinsic stellar mass and SFR.
We estimate intrinsic stellar masses of for all galaxies with bagpipes and all but one with beagle. The bagpipes SFRs range from , with specific star formation rates (sSFRs) of Gyr-1 ( Gyr-1). The beagle SFRs range from , with sSFRs of Gyr-1. Note that bagpipes considers the most recent 100 Myr of star formation while beagle considers the most recent 10 Myr (sSFR results capped at 100 Gyr-1).
In most cases, the SED fitting reveals relatively young ages of Myr. The exception is the beagle fit for WHL0137–ID08004 (discussed below), which has a age of 236 Myr. Median age estimates from bagpipes are typically 76 Myr, while beagle median ages are typically younger 34 Myr. Switching bagpipes to a constant star formation history (CSFH) also results in younger median ages typically 22 Myr.
For all candidates, we also find low dust content with , as expected due to the relatively blue rest-frame UV slopes in our sample of to (see Table 5).
The beagle SED fits of WHL0137–ID08004 have the largest stellar mass with = coupled with the lowest star formation rate of . This is a result of beagle fitting the red F410M F444W = 0.6 color as a Balmer break (see Figure 3; top), with an older mass-weighted age of Myr. On the other hand, bagpipes fits this galaxy as an extremely young ( Myr) galaxy with a high sSFR rate of Gyr-1 and strong inferred [O iii]+H emission (rest-frame equivalent width of Å). The bagpipes fit yields a more typical mass of = .
The lensed galaxy WHL0137–ID13362 also has a red F410M F444W color of 0.4. For this candidate, both bagpipes and beagle fit this galaxy with a SED template containing strong [O iii]+H optical emission lines. beagle gives a young age of 34 Myr, while bagpipes yields a slightly older age of 132 Myr.
4.5.1 SED Fitting Limitations
It is important to note that these physical property results rely on SED fitting to the broadband photometry, which is primarily in the rest-frame UV of these candidate high-redshift galaxies. This rest-frame wavelength regime is not ideally suited to investigate galaxy parameters because it primarily probes very massive and short-lived stars in a galaxy, which may not compose the bulk of its stellar mass. Because of limited rest-frame optical photometry, we expect to SED fitting to underestimate the stellar masses. In particular, Furtak et al. (2021) showed that SED-fitting to only UV photometry can underestimate stellar masses by up to 0.6 dex. Likewise, fitting primarily to rest-frame UV photometry can lead to some degeneracies between the stellar mass, SFR, and age (Furtak et al., 2023).
While the SED fitting results of bagpipes and beagle are relatively consistent, they differ significant for WHL0137–ID8004, leading to completely different interpretations. As discussed above, bagpipes fits this galaxy with very strong [O iii]+H optical emission lines, while beagle fits this galaxy with a strong Balmer break. These fitting differences result in highly uncertain physical properties for this galaxy, with the stellar mass differing by 1.4 dex, the SFR differing by 2.4 , and the mass-weighted age differing by 234 Myr (either extremely young or relatively old).
We also emphasize that given the large magnification uncertainties for WHL0137–ID13362, due to the lack of a multiply-imaged sources in the WHL013708 cluster, the intrinsic stellar mass and SFR of this galaxy are highly uncertain. As a result, in addition to the SED fitting uncertainties shown in Tables 4 and 5, the derived stellar mass and SFR can vary systematically by factors of .
4.6 A gravitationally-lensed arc at
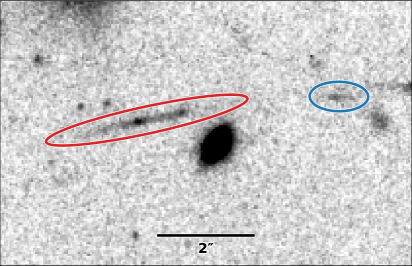
The lensed high-redshift candidate, WHL0137–ID13362, is stretched into an arc 24 long by the effects of strong gravitational lensing. The arc has at least two bright knots of unevenly distributed star formation (see Figure 5). This candidate has a lensed F200W AB magnitude of . Assuming a magnification of (; see Section 4.2), its intrinsic F200W AB magnitude is .
The bagpipes and beagle SED fitting results for WHL0137–ID13362 yield a photometric redshift of . The redshift posterior distribution (see Figure 4) for all SED fitting codes, including eazypy, shows a very narrow distribution peaked at .
Additional NIRSpec multi-object spectroscopy observations using the microshutter assembly were obtained in December 2022 (GO 2282: PI Coe). While these observations were obtained primarily to study Earendel and the Sunrise Arc in more detail, we were also able to put a slitlet on the arc WHL0137–ID13362. The NIRSpec prism spectroscopy covers with with 3720 s of exposure time. The NIRSpec data reveal H and [O iii] 4959, 5007 emission lines at , confirming this high-redshift galaxy (Vikaeus et al. in prep).
After correcting for magnification, the bagpipes results yield a stellar mass of = and a star formation rate of . The galaxy is relatively young with a mass-weighted age of Myr and a formation redshift of ( Myr). The beagle results yield a nearly identical stellar mass of = and a lower star formation rate of . beagle gives an even younger mass-weighted age of Myr and a formation redshift of ( Myr).
With a photometric redshift of (), WHL0137–ID13362 is the most spatially-resolved galaxy at this redshift known to date. Only SPT0615-JD1, the gravitationally lensed 25 long arc, is more distant at (Salmon et al., 2018). We show a cutout image of WHL0137–ID13362 from the JWST detection image in Figure 5. Assuming a primarily linear and tangential magnification of , the intrinsic size of the arc is 1.4 kpc at . Given the F150W point-spread function full width at half maximum of 0.05″ ( pc at ), we can resolve 30 pc scales in this galaxy.
Unfortunately, WHL013708 has no multiple image constraints in the northeast section of the cluster, where we find this arc. This adds considerable uncertainty to predictions of counter image locations. While some models (Lenstool) predict two merging images of the arc, and a third image near the cluster center, other models (LTM) predict no counter images. Although it is not the case with the current lens models, it is possible that the two knots in the arc could be multiple images if the critical curve happens to pass through the arc. Despite the lensing uncertainties, we have identified a promising counter image (WHL0137–ID06156) to the west of the arc (RA = 24.3539132∘, Dec = 8.44778165∘, J2000) with a similar color. While this source is 1.8 mag fainter than the arc, eazypyestimates its , which very closely agrees with the redshift of the main arc. Additional lens modeling is ongoing to further investigate this possibility.
4.7 Number Counts
In this dataset, the lensed field yielded one candidate, fewer than the three identified in the nearby blank field. While this difference may simply be due to small number statistics, we explore other possible reasons.
As discussed in §4.2, lensing reduces the area of the source plane at high redshifts. Using our cluster lens models, we estimate the ratio of the source-plane area at of the lensed cluster field to the nearby parallel field ranges from . Because of a lack of multiply-imaged sources, the lens models have large uncertainties, yielding a factor of 3.5 difference in the source-plane area at high-redshift.
Furthermore, there are more bright foreground galaxies in the cluster field than the blank field. The galaxy cluster can also hamper detections somewhat, though advanced methods can model and/or filter out the brighter cluster light to recover many faint distant galaxies (e.g., Livermore et al., 2017; Bhatawdekar & Conselice, 2021). Using the regions of segmentation image without source detections, we find that the blank area of the cluster field is 9% smaller than the parallel field (3.9 vs. 4.3 arcmin2). Taken together, the high-redshift source plane area in the cluster field may be times smaller than the parallel field. Assuming a similar surface number density of high-redshift sources over the two fields (although this is not necessarily the case due to cosmic variance), we would expect reduction in the number of high-redshift sources in the lensed field by the same factors.
Our results identify one high-redshift candidate in the cluster field, WHL0137–ID13362, which with a delensed magnitude of 28.4 (F200W) would have been detected without lensing. Thus, our number count ratio between the two fields of 0.33 is consistent with the range of . However, this does not consider the effect of lensing magnification bias (e.g., Broadhurst et al., 1995). In a flux-limited sample, the lensed field, due to the magnification effect, probes galaxies from a fainter source population than the unlensed field.
At , faint number counts in lensed fields should roughly match those in blank fields (e.g., Coe et al., 2015), given the observed steep faint-end slope of the UV luminosity function (LF) (e.g., Bradley et al., 2012; Bouwens et al., 2022). At higher redshifts , we expect steeper LF faint-end slopes, increasing the advantage for lensing to reveal faint galaxies at these redshifts. More detailed analyses injecting artificial sources and measuring completeness will be required of this and other fields to quantify the lensing advantage at and higher redshifts. Confirmed suppression of lensed number counts could indicate LF faint-end slopes hovering around rather than steepening as expected from both simulations and trends at lower redshifts. However, we can draw no conclusions given the very small samples sizes presented in this paper.
4.8 Possible Sources of Contamination
Low-mass stars, extreme emission-line galaxies (EELG), and photometric scatter of red low-redshift galaxies can all be sources of contamination for high-redshift galaxy selections. While low-mass stars and brown dwarfs can have similar colors as high-redshift galaxies (e.g., Yan et al., 2003; Ryan et al., 2005; Wilkins et al., 2014), we can rule out the possibility of contamination from these sources because all of our candidates are resolved (see §4.3). Galaxies with extremely strong emission lines can sometimes also mimic high-redshift galaxies, especially in cases with fewer filters longward of the spectral break (Atek et al., 2011; van der Wel et al., 2011; Brammer et al., 2013). With our multiband dataset, we have six filters redward of the break and our SED models are flexible to include extreme emission lines (as in the case of our beagle fit to WHL0137–ID8004, which implies [O iii]+H rest-frame equivalent width 2000 Å).
Low-redshift red and dust-obscured galaxies can also be a source of contamination, where their strong Balmer breaks can be confused with a Lyman- break. Using HST data, Bouwens et al. (2011) found that the contamination rates of low-redshift interlopers can be up to 40%. However, this can be somewhat mitigated by having many filters redward of the break. Red or dusty low-redshift interlopers are expected to have red colors longward of break, which is not the case for three of our candidates. Three of our candidates have very blue SED longward of the break, with continuum slopes of . The remaining candidate, WHL0137–ID8004, has a redder continuum slope of . The SED fitting results differ significantly, fitting the redder continuum either very strong emission lines or a Balmer break, leading to completely different interpetations for this galaxy. However, SED fits constrained to low redshifts () provide much poorer solutions for this galaxy.
As part of our sample selection, we ran addition SED fits in which we force the photometric redshifts to to determine if the breaks (and fluxes in all bands) can be fit well by a low-redshift solution. Our selection criteria require a conservative difference of at least 9 between the low-redshift and high-redshift solutions, indicating much poorer fits for the low-redshift solutions and ruling them out at significance (Harikane et al., 2023).
We also consider the possibility that we may have detected more high-redshift candidates in the parallel field because it lacks HST coverage in bluer filters, which might have helped rule out low-redshift interlopers. To explore this possibility, we re-ran eazypy on the sources in the lensed field using only their fluxes in the JWST NIRCam filters, excluding the photometry in all HST filters. After performing the identical selection criteria as the parallel field, we find only one additional high-redshift candidate. This would suggest that our contamination rate is not significantly affected due to the lack of HST photometry in the parallel field. Formally, inclusion of the HST data excludes 50% of our candidates in the lensed field, but this represents only one galaxy. Strong conclusions cannot be drawn from this small sample size.
While our high-redshift sample selection criteria are designed to minimize contamination from low-redshift interlopers, the possibility remains that some of our candidates are at lower redshifts. Spectroscopic confirmation, like that obtained for WHL0137–ID13362, is needed to definitively measure the redshifts of these candidates.
5 Conclusions
We present a search for very high-redshift galaxies in the first JWST NIRCam observations of the lensing cluster WHL013708 and a nearby parallel field centered 29 from the cluster center. Combined with RELICS HST observations, the JWST and HST observations of WHL013708 include imaging in 17 filters spanning in which we use to search for high redshift galaxies.
Our final sample of high-redshift candidate galaxies consists of four candidates with photometric redshifts . Note that while our initial eazypy selection was restricted to , the bagpipes and beagle photometric redshift for one of the candidates (WHL0137–ID10060) is at . One candidate, WHL0137–ID13362, lies in the cluster field, while the remaining three are located in the nearby parallel field.
One candidate, WHL0137–ID13362, is magnified to AB mag 26.2 and stretched into an arc 24 long by the effects of strong gravitational lensing. The JWST data reveal at least two bright knots of unevenly distributed star formation within the arc. This candidate also has a magnification as determined from four independent lens models of the WHL013708 galaxy cluster. WHL0137–ID13362 is the most spatially-resolved galaxy at known to date, similar in length to the candidate SPT0615-JD1 (Salmon et al., 2018). Recent JWST NIRSpec observations spectroscopically confirm this galaxy at (Vikaeus et al. in prep).
We perform SED fitting to the photometry of these galaxies using the independent SED-fitting codes bagpipes and beagle to estimate the physical properties of our candidates. We find stellar masses typically in the range = , specific star formation rates sSFR Gyr-1, young mass-weighted ages Myr, low dust content with values , and rest-frame UV slopes of to . We note that the stellar masses and SFR of the lensed galaxy WHL0137–ID13362 are highly uncertain because of magnification uncertainties.
Other JWST analyses have estimated similarly young ages Myr for candidates (Whitler et al., 2023; Furtak et al., 2023). Discovering such young galaxies is consistent with expectations from simulations given our image depths down to AB mag 29 (Mason et al., 2023). Deeper JWST imaging is required to reveal older (and thus fainter) 100 Myr populations at , perhaps typical for the more numerous fainter galaxies in the early universe. Likewise, JWST/NIRSpec observations will be needed to spectroscopically confirm three of these high-redshift galaxy candidates and to study their physical properties in more detail.
6 Acknowledgments
Based on observations with the NASA/ESA/CSA James Webb Space Telescope obtained from the Mikulski Archive for Space Telescopes (MAST) at the Space Telescope Science Institute (STScI), which is operated by the Association of Universities for Research in Astronomy (AURA), Incorporated, under NASA contract NAS5-03127. Support for Program number JWST-GO-02282 was provided through a grant from the STScI under NASA contract NAS5-03127. The data described here may be obtained from the MAST archive at https://dx.doi.org/10.17909/cqfq-5n80 (catalog doi:10.17909/cqfq-5n80). Also based on observations made with the NASA/ESA Hubble Space Telescope, obtained at STScI, which is operated by AURA under NASA contract NAS5-26555. The HST observations are associated with programs HST-GO-14096, HST-GO-15842, and HST-GO-16668. Cloud-based data processing and file storage for this work is provided by the AWS Cloud Credits for Research program. The Cosmic Dawn Center is funded by the Danish National Research Foundation (DNRF) under grant #140. AZ and LF acknowledge support by Grant No. 2020750 from the United States-Israel Binational Science Foundation (BSF) and Grant No. 2109066 from the United States National Science Foundation (NSF), and by the Ministry of Science & Technology, Israel.
References
- Adams et al. (2023) Adams, N. J., Conselice, C. J., Ferreira, L., et al. 2023, MNRAS, 518, 4755, doi: 10.1093/mnras/stac3347
- Aihara et al. (2011) Aihara, H., Allende Prieto, C., An, D., et al. 2011, ApJS, 193, 29, doi: 10.1088/0067-0049/193/2/29
- Astropy Collaboration et al. (2018) Astropy Collaboration, Price-Whelan, A. M., Sipőcz, B. M., et al. 2018, AJ, 156, 123, doi: 10.3847/1538-3881/aabc4f
- Astropy Collaboration et al. (2022) Astropy Collaboration, Price-Whelan, A. M., Lim, P. L., et al. 2022, ApJ, 935, 167, doi: 10.3847/1538-4357/ac7c74
- Atek et al. (2018) Atek, H., Richard, J., Kneib, J.-P., & Schaerer, D. 2018, MNRAS, 479, 5184, doi: 10.1093/mnras/sty1820
- Atek et al. (2011) Atek, H., Siana, B., Scarlata, C., et al. 2011, ApJ, 743, 121, doi: 10.1088/0004-637X/743/2/121
- Atek et al. (2015) Atek, H., Richard, J., Jauzac, M., et al. 2015, ApJ, 814, 69, doi: 10.1088/0004-637X/814/1/69
- Atek et al. (2023) Atek, H., Shuntov, M., Furtak, L. J., et al. 2023, MNRAS, 519, 1201, doi: 10.1093/mnras/stac3144
- Bhatawdekar & Conselice (2021) Bhatawdekar, R., & Conselice, C. J. 2021, ApJ, 909, 144, doi: 10.3847/1538-4357/abdd3f
- Bhatawdekar et al. (2019) Bhatawdekar, R., Conselice, C. J., Margalef-Bentabol, B., & Duncan, K. 2019, MNRAS, 486, 3805, doi: 10.1093/mnras/stz866
- Bouwens et al. (2023) Bouwens, R., Illingworth, G., Oesch, P., et al. 2023, MNRAS, 523, 1009, doi: 10.1093/mnras/stad1014
- Bouwens et al. (2022) Bouwens, R. J., Illingworth, G., Ellis, R. S., et al. 2022, ApJ, 931, 81, doi: 10.3847/1538-4357/ac618c
- Bouwens et al. (2017) Bouwens, R. J., Oesch, P. A., Illingworth, G. D., Ellis, R. S., & Stefanon, M. 2017, ApJ, 843, 129, doi: 10.3847/1538-4357/aa70a4
- Bouwens et al. (2011) Bouwens, R. J., Illingworth, G. D., Oesch, P. A., et al. 2011, ApJ, 737, 90, doi: 10.1088/0004-637X/737/2/90
- Bouwens et al. (2014) Bouwens, R. J., Bradley, L., Zitrin, A., et al. 2014, ApJ, 795, 126, doi: 10.1088/0004-637X/795/2/126
- Boylan-Kolchin (2023) Boylan-Kolchin, M. 2023, Nature Astronomy, 7, 731, doi: 10.1038/s41550-023-01937-7
- Bradley (2023) Bradley, L. 2023, astropy/photutils: 1.8.0, 1.8.0, Zenodo, doi: 10.5281/zenodo.7946442
- Bradley et al. (2008) Bradley, L. D., Bouwens, R. J., Ford, H. C., et al. 2008, ApJ, 678, 647, doi: 10.1086/533519
- Bradley et al. (2012) Bradley, L. D., Trenti, M., Oesch, P. A., et al. 2012, ApJ, 760, 108, doi: 10.1088/0004-637X/760/2/108
- Bradley et al. (2014) Bradley, L. D., Zitrin, A., Coe, D., et al. 2014, ApJ, 792, 76, doi: 10.1088/0004-637X/792/1/76
- Brammer et al. (2022) Brammer, G., Strait, V., Matharu, J., & Momcheva, I. 2022, grizli, 1.5.0, Zenodo, doi: 10.5281/zenodo.6672538
- Brammer et al. (2008) Brammer, G. B., van Dokkum, P. G., & Coppi, P. 2008, ApJ, 686, 1503, doi: 10.1086/591786
- Brammer et al. (2013) Brammer, G. B., van Dokkum, P. G., Illingworth, G. D., et al. 2013, ApJ, 765, L2, doi: 10.1088/2041-8205/765/1/L2
- Broadhurst et al. (2005) Broadhurst, T., Benítez, N., Coe, D., et al. 2005, ApJ, 621, 53, doi: 10.1086/426494
- Broadhurst et al. (1995) Broadhurst, T. J., Taylor, A. N., & Peacock, J. A. 1995, ApJ, 438, 49, doi: 10.1086/175053
- Bruzual & Charlot (2003) Bruzual, G., & Charlot, S. 2003, MNRAS, 344, 1000, doi: 10.1046/j.1365-8711.2003.06897.x
- Calzetti et al. (2000) Calzetti, D., Armus, L., Bohlin, R. C., et al. 2000, ApJ, 533, 682, doi: 10.1086/308692
- Capak et al. (2015) Capak, P. L., Carilli, C., Jones, G., et al. 2015, Nature, 522, 455, doi: 10.1038/nature14500
- Carnall et al. (2018) Carnall, A. C., McLure, R. J., Dunlop, J. S., & Davé, R. 2018, Monthly Notices of the Royal Astronomical Society, 480, 4379, doi: 10.1093/mnras/sty2169
- Carnall et al. (2023) Carnall, A. C., Begley, R., McLeod, D. J., et al. 2023, MNRAS, 518, L45, doi: 10.1093/mnrasl/slac136
- Castellano et al. (2022) Castellano, M., Fontana, A., Treu, T., et al. 2022, ApJ, 938, L15, doi: 10.3847/2041-8213/ac94d0
- Chabrier (2003) Chabrier, G. 2003, PASP, 115, 763, doi: 10.1086/376392
- Chevallard & Charlot (2016) Chevallard, J., & Charlot, S. 2016, MNRAS, 462, 1415, doi: 10.1093/mnras/stw1756
- Coe et al. (2015) Coe, D., Bradley, L., & Zitrin, A. 2015, ApJ, 800, 84, doi: 10.1088/0004-637X/800/2/84
- Coe et al. (2013) Coe, D., Zitrin, A., Carrasco, M., et al. 2013, ApJ, 762, 32, doi: 10.1088/0004-637X/762/1/32
- Coe et al. (2019) Coe, D., Salmon, B., Bradač, M., et al. 2019, ApJ, 884, 85, doi: 10.3847/1538-4357/ab412b
- Conroy & Gunn (2010) Conroy, C., & Gunn, J. E. 2010, ApJ, 712, 833, doi: 10.1088/0004-637X/712/2/833
- Conroy et al. (2009) Conroy, C., Gunn, J. E., & White, M. 2009, ApJ, 699, 486, doi: 10.1088/0004-637X/699/1/486
- Conroy et al. (2010) Conroy, C., White, M., & Gunn, J. E. 2010, ApJ, 708, 58, doi: 10.1088/0004-637X/708/1/58
- Diego et al. (2005) Diego, J. M., Protopapas, P., Sandvik, H. B., & Tegmark, M. 2005, MNRAS, 360, 477, doi: 10.1111/j.1365-2966.2005.09021.x
- Diego et al. (2007) Diego, J. M., Tegmark, M., Protopapas, P., & Sandvik, H. B. 2007, MNRAS, 375, 958, doi: 10.1111/j.1365-2966.2007.11380.x
- Donnan et al. (2023) Donnan, C. T., McLeod, D. J., Dunlop, J. S., et al. 2023, MNRAS, 518, 6011, doi: 10.1093/mnras/stac3472
- Endsley et al. (2023) Endsley, R., Stark, D. P., Whitler, L., et al. 2023, MNRAS, 524, 2312, doi: 10.1093/mnras/stad1919
- Ferland et al. (2013) Ferland, G. J., Porter, R. L., van Hoof, P. A. M., et al. 2013, Rev. Mexicana Astron. Astrofis., 49, 137. https://arxiv.org/abs/1302.4485
- Feroz & Hobson (2008) Feroz, F., & Hobson, M. P. 2008, MNRAS, 384, 449, doi: 10.1111/j.1365-2966.2007.12353.x
- Feroz et al. (2009) Feroz, F., Hobson, M. P., & Bridges, M. 2009, MNRAS, 398, 1601, doi: 10.1111/j.1365-2966.2009.14548.x
- Feroz & Skilling (2013) Feroz, F., & Skilling, J. 2013, in American Institute of Physics Conference Series, Vol. 1553, Bayesian Inference and Maximum Entropy Methods in Science and Engineering: 32nd International Workshop on Bayesian Inference and Maximum Entropy Methods in Science and Engineering, ed. U. von Toussaint, 106–113, doi: 10.1063/1.4819989
- Ferrara et al. (2023) Ferrara, A., Pallottini, A., & Dayal, P. 2023, MNRAS, 522, 3986, doi: 10.1093/mnras/stad1095
- Finkelstein et al. (2017) Finkelstein, S. L., Dickinson, M., Ferguson, H. C., et al. 2017, The Cosmic Evolution Early Release Science (CEERS) Survey, JWST Proposal ID 1345. Cycle 0 Early Release Science
- Finkelstein et al. (2022) Finkelstein, S. L., Bagley, M. B., Arrabal Haro, P., et al. 2022, ApJ, 940, L55, doi: 10.3847/2041-8213/ac966e
- Finkelstein et al. (2023) Finkelstein, S. L., Bagley, M. B., Ferguson, H. C., et al. 2023, ApJ, 946, L13, doi: 10.3847/2041-8213/acade4
- Frye & Broadhurst (1998) Frye, B., & Broadhurst, T. 1998, ApJ, 499, L115, doi: 10.1086/311361
- Frye et al. (2008) Frye, B. L., Bowen, D. V., Hurley, M., et al. 2008, ApJ, 685, L5, doi: 10.1086/592273
- Furtak et al. (2021) Furtak, L. J., Atek, H., Lehnert, M. D., Chevallard, J., & Charlot, S. 2021, MNRAS, 501, 1568, doi: 10.1093/mnras/staa3760
- Furtak et al. (2023) Furtak, L. J., Shuntov, M., Atek, H., et al. 2023, MNRAS, 519, 3064, doi: 10.1093/mnras/stac3717
- Gaia Collaboration et al. (2021) Gaia Collaboration, Brown, A. G. A., Vallenari, A., et al. 2021, A&A, 649, A1, doi: 10.1051/0004-6361/202039657
- Gutkin et al. (2016) Gutkin, J., Charlot, S., & Bruzual, G. 2016, MNRAS, 462, 1757, doi: 10.1093/mnras/stw1716
- Harikane et al. (2023) Harikane, Y., Ouchi, M., Oguri, M., et al. 2023, ApJS, 265, 5, doi: 10.3847/1538-4365/acaaa9
- Hoag et al. (2017) Hoag, A., Bradač, M., Trenti, M., et al. 2017, Nature Astronomy, 1, 0091, doi: 10.1038/s41550-017-0091
- Hoffmann et al. (2021) Hoffmann, S. L., Mack, J., Avila, R., et al. 2021, in American Astronomical Society Meeting Abstracts, Vol. 53, American Astronomical Society Meeting Abstracts, 216.02
- Infante et al. (2015) Infante, L., Zheng, W., Laporte, N., et al. 2015, ApJ, 815, 18, doi: 10.1088/0004-637X/815/1/18
- Inoue et al. (2014) Inoue, A. K., Shimizu, I., Iwata, I., & Tanaka, M. 2014, MNRAS, 442, 1805, doi: 10.1093/mnras/stu936
- Ishigaki et al. (2015) Ishigaki, M., Kawamata, R., Ouchi, M., et al. 2015, ApJ, 799, 12, doi: 10.1088/0004-637X/799/1/12
- JDADF Developers et al. (2022) JDADF Developers, Averbukh, J., Bradley, L., et al. 2022, Jdaviz, 2.10.0, doi: https://doi.org/10.5281/zenodo.5513927
- Jullo & Kneib (2009) Jullo, E., & Kneib, J. P. 2009, MNRAS, 395, 1319, doi: 10.1111/j.1365-2966.2009.14654.x
- Jullo et al. (2007) Jullo, E., Kneib, J. P., Limousin, M., et al. 2007, New Journal of Physics, 9, 447, doi: 10.1088/1367-2630/9/12/447
- Koekemoer et al. (2003) Koekemoer, A. M., Fruchter, A. S., Hook, R. N., & Hack, W. 2003, in HST Calibration Workshop : Hubble after the Installation of the ACS and the NICMOS Cooling System, 337
- Kokorev et al. (2022) Kokorev, V., Brammer, G., Fujimoto, S., et al. 2022, ApJS, 263, 38, doi: 10.3847/1538-4365/ac9909
- Kroupa (2002) Kroupa, P. 2002, Science, 295, 82, doi: 10.1126/science.1067524
- Labbé et al. (2023) Labbé, I., van Dokkum, P., Nelson, E., et al. 2023, Nature, 616, 266, doi: 10.1038/s41586-023-05786-2
- Laporte et al. (2015) Laporte, N., Streblyanska, A., Kim, S., et al. 2015, A&A, 575, A92, doi: 10.1051/0004-6361/201425040
- Larson et al. (2022) Larson, R. L., Hutchison, T. A., Bagley, M., et al. 2022, arXiv e-prints, arXiv:2211.10035, doi: 10.48550/arXiv.2211.10035
- Leethochawalit et al. (2023) Leethochawalit, N., Trenti, M., Santini, P., et al. 2023, ApJ, 942, L26, doi: 10.3847/2041-8213/ac959b
- Livermore et al. (2017) Livermore, R. C., Finkelstein, S. L., & Lotz, J. M. 2017, ApJ, 835, 113, doi: 10.3847/1538-4357/835/2/113
- Lotz et al. (2017) Lotz, J. M., Koekemoer, A., Coe, D., et al. 2017, ApJ, 837, 97, doi: 10.3847/1538-4357/837/1/97
- Lovell et al. (2023) Lovell, C. C., Harrison, I., Harikane, Y., Tacchella, S., & Wilkins, S. M. 2023, MNRAS, 518, 2511, doi: 10.1093/mnras/stac3224
- Mason et al. (2023) Mason, C. A., Trenti, M., & Treu, T. 2023, MNRAS, 521, 497, doi: 10.1093/mnras/stad035
- Meštrić et al. (2022) Meštrić, U., Vanzella, E., Zanella, A., et al. 2022, MNRAS, 516, 3532, doi: 10.1093/mnras/stac2309
- Morishita & Stiavelli (2023) Morishita, T., & Stiavelli, M. 2023, ApJ, 946, L35, doi: 10.3847/2041-8213/acbf50
- Naidu et al. (2022a) Naidu, R. P., Oesch, P. A., van Dokkum, P., et al. 2022a, ApJ, 940, L14, doi: 10.3847/2041-8213/ac9b22
- Naidu et al. (2022b) Naidu, R. P., Oesch, P. A., Setton, D. J., et al. 2022b, arXiv e-prints, arXiv:2208.02794. https://arxiv.org/abs/2208.02794
- Naidu et al. (2022c) Naidu, R. P., Oesch, P. A., van Dokkum, P., et al. 2022c, ApJ, 940, L14, doi: 10.3847/2041-8213/ac9b22
- Oesch et al. (2016) Oesch, P. A., Brammer, G., van Dokkum, P. G., et al. 2016, ApJ, 819, 129, doi: 10.3847/0004-637X/819/2/129
- Oguri (2010) Oguri, M. 2010, PASJ, 62, 1017, doi: 10.1093/pasj/62.4.1017
- Oke (1974) Oke, J. B. 1974, ApJS, 27, 21, doi: 10.1086/190287
- Oke & Gunn (1983) Oke, J. B., & Gunn, J. E. 1983, ApJ, 266, 713, doi: 10.1086/160817
- Pei (1992) Pei, Y. C. 1992, ApJ, 395, 130, doi: 10.1086/171637
- Planck Collaboration et al. (2016) Planck Collaboration, Ade, P. A. R., Aghanim, N., et al. 2016, A&A, 594, A27, doi: 10.1051/0004-6361/201525823
- Planck Collaboration et al. (2020) Planck Collaboration, Aghanim, N., Akrami, Y., et al. 2020, A&A, 641, A6, doi: 10.1051/0004-6361/201833910
- Pontoppidan et al. (2022) Pontoppidan, K. M., Barrientes, J., Blome, C., et al. 2022, ApJ, 936, L14, doi: 10.3847/2041-8213/ac8a4e
- Postman et al. (2012) Postman, M., Coe, D., Benítez, N., et al. 2012, ApJS, 199, 25, doi: 10.1088/0067-0049/199/2/25
- Reddy et al. (2015) Reddy, N. A., Kriek, M., Shapley, A. E., et al. 2015, ApJ, 806, 259, doi: 10.1088/0004-637X/806/2/259
- Reddy et al. (2018) Reddy, N. A., Oesch, P. A., Bouwens, R. J., et al. 2018, ApJ, 853, 56, doi: 10.3847/1538-4357/aaa3e7
- Rigby et al. (2023) Rigby, J., Perrin, M., McElwain, M., et al. 2023, PASP, 135, 048001, doi: 10.1088/1538-3873/acb293
- Ryan et al. (2005) Ryan, R. E., J., Hathi, N. P., Cohen, S. H., & Windhorst, R. A. 2005, ApJ, 631, L159, doi: 10.1086/497368
- Salim et al. (2018) Salim, S., Boquien, M., & Lee, J. C. 2018, ApJ, 859, 11, doi: 10.3847/1538-4357/aabf3c
- Salmon et al. (2018) Salmon, B., Coe, D., Bradley, L., et al. 2018, ApJ, 864, L22, doi: 10.3847/2041-8213/aadc10
- Salmon et al. (2020) —. 2020, ApJ, 889, 189, doi: 10.3847/1538-4357/ab5a8b
- Shivaei et al. (2020) Shivaei, I., Reddy, N., Rieke, G., et al. 2020, ApJ, 899, 117, doi: 10.3847/1538-4357/aba35e
- Steinhardt et al. (2023) Steinhardt, C. L., Kokorev, V., Rusakov, V., Garcia, E., & Sneppen, A. 2023, ApJ, 951, L40, doi: 10.3847/2041-8213/acdef6
- Strait et al. (2021) Strait, V., Bradač, M., Coe, D., et al. 2021, ApJ, 910, 135, doi: 10.3847/1538-4357/abe533
- Tacchella et al. (2023) Tacchella, S., Johnson, B. D., Robertson, B. E., et al. 2023, MNRAS, 522, 6236, doi: 10.1093/mnras/stad1408
- Treu et al. (2022) Treu, T., Roberts-Borsani, G., Bradac, M., et al. 2022, ApJ, 935, 110, doi: 10.3847/1538-4357/ac8158
- Trussler et al. (2023) Trussler, J. A. A., Adams, N. J., Conselice, C. J., et al. 2023, MNRAS, 523, 3423, doi: 10.1093/mnras/stad1629
- Valentino et al. (2023) Valentino, F., Brammer, G., Gould, K. M. L., et al. 2023, ApJ, 947, 20, doi: 10.3847/1538-4357/acbefa
- van der Wel et al. (2011) van der Wel, A., Straughn, A. N., Rix, H. W., et al. 2011, ApJ, 742, 111, doi: 10.1088/0004-637X/742/2/111
- Vanzella et al. (2022) Vanzella, E., Castellano, M., Bergamini, P., et al. 2022, A&A, 659, A2, doi: 10.1051/0004-6361/202141590
- Welch et al. (2022) Welch, B., Coe, D., Zackrisson, E., et al. 2022, ApJ, 940, L1, doi: 10.3847/2041-8213/ac9d39
- Welch et al. (2023) Welch, B., Coe, D., Zitrin, A., et al. 2023, ApJ, 943, 2, doi: 10.3847/1538-4357/aca8a8
- Wen & Han (2015) Wen, Z. L., & Han, J. L. 2015, ApJ, 807, 178, doi: 10.1088/0004-637X/807/2/178
- Wen et al. (2012) Wen, Z. L., Han, J. L., & Liu, F. S. 2012, ApJS, 199, 34, doi: 10.1088/0067-0049/199/2/34
- Whitler et al. (2023) Whitler, L., Endsley, R., Stark, D. P., et al. 2023, MNRAS, 519, 157, doi: 10.1093/mnras/stac3535
- Wilkins et al. (2014) Wilkins, S. M., Stanway, E. R., & Bremer, M. N. 2014, MNRAS, 439, 1038, doi: 10.1093/mnras/stu029
- Yan et al. (2003) Yan, H., Windhorst, R. A., & Cohen, S. H. 2003, ApJ, 585, L93, doi: 10.1086/374371
- Yang et al. (2022) Yang, L., Morishita, T., Leethochawalit, N., et al. 2022, ApJ, 938, L17, doi: 10.3847/2041-8213/ac8803
- Zheng et al. (2012) Zheng, W., Postman, M., Zitrin, A., et al. 2012, Nature, 489, 406, doi: 10.1038/nature11446
- Zitrin et al. (2009) Zitrin, A., Broadhurst, T., Umetsu, K., et al. 2009, MNRAS, 396, 1985, doi: 10.1111/j.1365-2966.2009.14899.x
- Zitrin et al. (2014) Zitrin, A., Zheng, W., Broadhurst, T., et al. 2014, ApJ, 793, L12, doi: 10.1088/2041-8205/793/1/L12
- Zitrin et al. (2015) Zitrin, A., Fabris, A., Merten, J., et al. 2015, ApJ, 801, 44, doi: 10.1088/0004-637X/801/1/44