Late-time H/He-poor circumstellar interaction in the type-Ic supernova SN 2021ocs: an exposed oxygen-magnesium layer and extreme stripping of the progenitor111Based on observations collected at the European Organisation for Astronomical Research in the Southern Hemisphere under ESO programme 108.2282.001.
Abstract
Supernova (SN) 2021ocs was discovered in the galaxy NGC 7828 () within the interacting system Arp 144, and subsequently classified as a normal type-Ic SN around peak brightness. VLT/FORS2 observations in the nebular phase at 148 d reveal that the spectrum is dominated by oxygen and magnesium emission lines of different transitions and ionization states: O I, [O I], [O II], [O III], Mg I, and Mg II. Such a spectrum has no counterpart in the literature, though it bears a few features similar to those of some interacting type Ibn and Icn SNe. Additionally, SN 2021ocs showed a blue color, mag, after the peak and up to late phases, atypical for a type-Ic SN. Together with the nebular spectrum, this suggests that SN 2021ocs underwent late-time interaction with an H/He-poor circumstellar medium (CSM), resulting from the pre-SN progenitor mass loss during its final 1000 days. The strong O and Mg lines and the absence of strong C and He lines suggest that the progenitor star’s O-Mg layer is exposed, which places SN 2021ocs as the most extreme case of massive progenitor star’s envelope stripping in interacting SNe, followed by type-Icn (stripped C-O layer) and Ibn (stripped He-rich layer) SNe. This is the first time such a case is reported in the literature. SN 2021ocs emphasizes the importance of late-time spectroscopy of SNe, even for those classified as normal events, to reveal the inner ejecta and progenitor star’s CSM and mass loss.
1 Introduction
Stripped-envelope supernovae (SESNe) include a broad variety of events, all of which show little or no hydrogen in the spectrum. SNe type Ic are deficient of H and He, hence the progenitors are traditionally thought to be Wolf-Rayet (WR) stars (e.g. Woosley et al., 1995). The progenitor stars of SESNe require significant mass loss in order to remove the outer H envelope. Stellar winds, binary interaction, and eruptions are among the prominent mechanisms (see e.g. Smith, 2014, for a review). A highly massive single star () is required to form a WR star through wind stripping. This casts doubt if there is sufficient number of WR stars to explain the observed rate of SESNe, which implies that a significant number of SESNe must have come from lower-mass stars in close binary systems (e.g. Yoon et al., 2010; Smith et al., 2011).
The SN progenitor mass loss may result in a circumstellar medium (CSM), which may interact with the SN ejecta after the explosion. SNe interacting with H-free CSM are rare, nevertheless modern surveys have discovered a sample of them, which are now classified into types Ibn (He-rich CSM) and Icn (H/He-poor CSM). Some of these objects are thought to be explosions of genuine massive WR stars (Pastorello et al., 2007; Smith, 2017; Gal-Yam et al., 2022), or less massive stars (Sanders et al., 2013; Dessart et al., 2022; Pellegrino et al., 2022; Davis et al., 2022), within a dense CSM.
SN 2021ocs was discovered by the Asteroid Terrestrial-impact Last Alert System (ATLAS) survey (Tonry et al., 2018; Smith et al., 2020) on 2021-05-30 (UTC time used throughout) as ATLAS21ptp, in the host galaxy NGC 7828 (, Tully-Fisher distance modulus mag; Theureau et al., 2007, through NED222The NASA/IPAC Extragalactic Database (NED), http://ned.ipac.caltech.edu/). The host galaxy is interacting with a smaller galaxy NGC 7829, forming the ring galaxy system Arp 144. No meaningful pre-discovery upper limit exists as the object was emerging from solar conjunction at the time of discovery. The transient was subsequently reported to the Transient Name Server (TNS333https://www.wis-tns.org/object/2021ocs) by the Zwicky Transient Facility (ZTF, Bellm et al., 2019) and Pan-STARRS1 (Chambers et al., 2016) surveys as ZTF21abhrpia and PS21hlk, respectively. Spectral classification reported to the TNS suggests that SN 2021ocs is a type-Ic SN around one to two weeks after maximum light (Huber, 2021). Here we report additional spectral observations of SN 2021ocs obtained at late time (148 d after light curve peak)444The spectrum and light curves are available as the Data behind the Figure (DbF)..
2 Observations and Data Reduction
The classification spectrum of SN 2021ocs was obtained on 2021-06-13 using the SNIFS spectrograph (Lantz et al., 2004) at the 2.2 m University of Hawaii telescope on Mauna Kea, as part of the Spectroscopic Classification of Astronomical Transients (SCAT) survey (Tucker et al., 2022). Late-time spectroscopy of SN 2021ocs was conducted on the night of 2021-10-26, as part of the FORS+ Survey of Supernovae in Late Times program (FOSSIL, Kuncarayakti et al. in prep.), using the FORS2 instrument (Appenzeller et al., 1998) attached to the ESO Very Large Telescope (VLT) at Cerro Paranal Observatory, Chile. FOSSIL targets all observable CCSNe brighter than mag in the photospheric phase, which are expected to be 21-22 mag or brighter when observed in the nebular phase, with the goal of obtaining nebular spectra for a large sample of objects in a magnitude-limited, unbiased way.
We used FORS2 with grism 300V and the 1.6” slit, achieving a wide wavelength coverage of 3500–9500 Å and a spectral resolution of measured from the narrow sky emission lines. The sky conditions were photometric with seeing around 0.5” during the length of the integration. The spectroscopic observations were obtained with s exposures, accompanied with 20 s g-band imaging under 0.75” seeing conditions. Spectrophotometric standard stars were observed using the same grism setting. The data were reduced using the ESOReflex (Freudling et al., 2013) pipeline following standard procedures. The excellent seeing conditions allowed reasonable background subtraction during the spectrum extraction, evidenced by the absence of narrow host galaxy emission lines.
The g-band photometry of FORS2 was measured with our own PSF photometry code. Synthetic photometry was performed on the nebular spectrum to derive the g and r synthetic magnitudes; the obtained color was then applied to the g-band photometry from imaging to produce an r-band magnitude to be used in the light curve. In addition to the FORS2 gr imaging, photometry was obtained from a number of sources. Public ATLAS forced photometry in the o and c bands was obtained from the ATLAS Forced Photometry server555https://fallingstar-data.com/forcedphot/, and ZTF g and r-band photometry through the ZTF forced photometry service666https://ztfweb.ipac.caltech.edu/cgi-bin/requestForcedPhotometry.cgi (Masci et al., 2019). Forced photometry data from the PanSTARRS1 survey are used, yielding i and w-band photometry.
3 Results and Discussion
3.1 Early spectrum and light curve
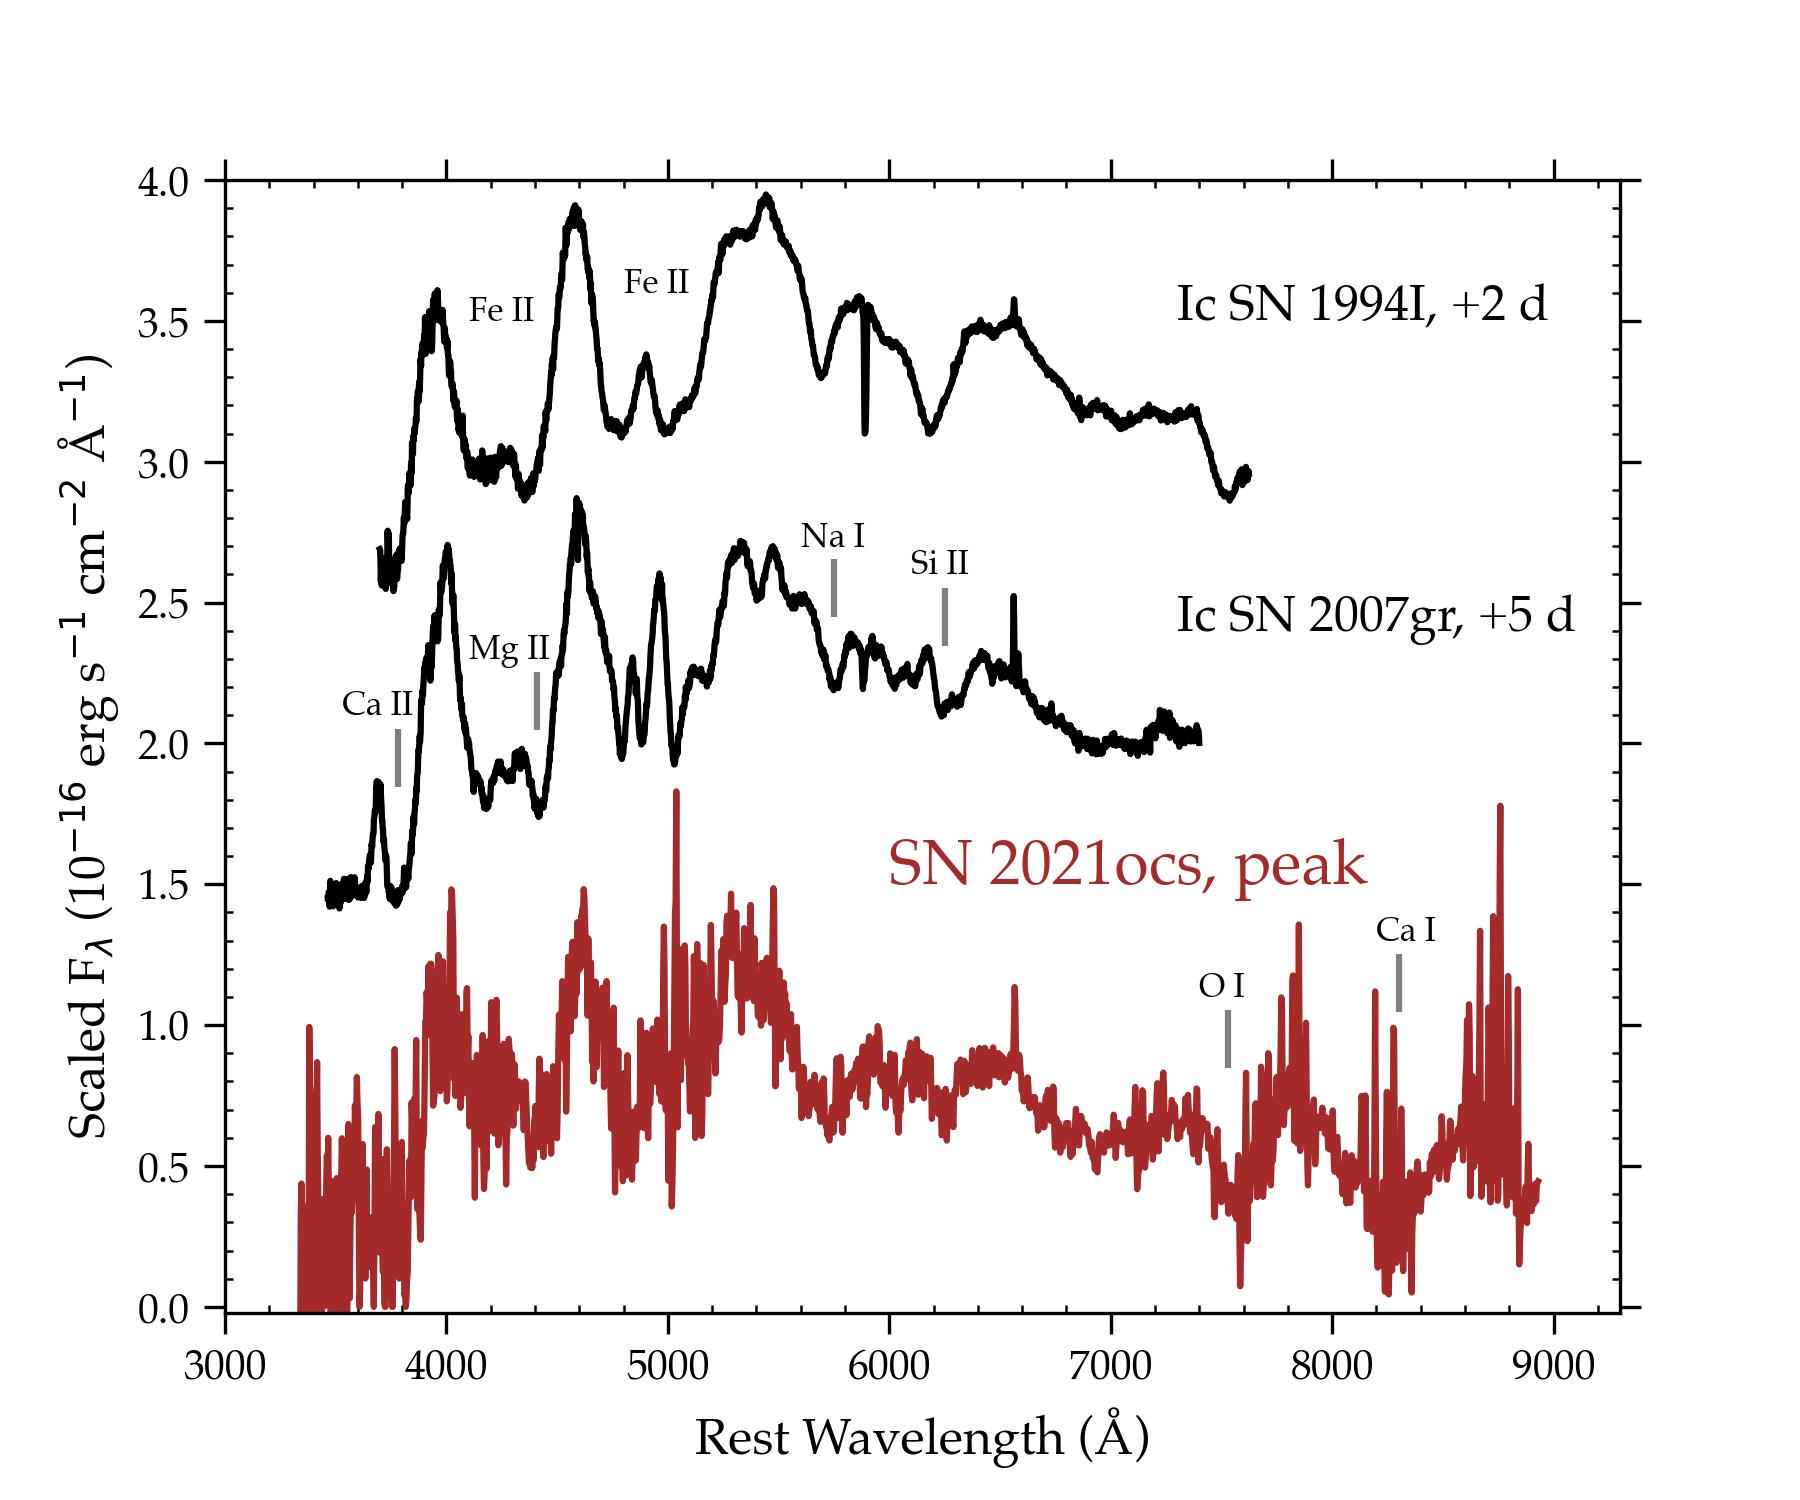
The classification of SN 2021ocs as a type-Ic SN around the light curve peak (Huber, 2021) was obtained using the SNID tool (Blondin & Tonry, 2007). Figure 1 shows a comparison between SN 2021ocs and the well-studied type-Ic SNe, SN 1994I and SN 2007gr, as two of the best matches obtained by SNID. SN 2021ocs appears similar to normal type-Ic SNe around the light curve peak. The lack of narrow Na I D absorption line in the spectrum (cf. SN 1994I where the narrow absorption line is strong, and weaker in SN 2007gr) suggests that the amount of intervening extinction is minimal. Henceforth, we assume no host galaxy extinction for SN 2021ocs. The reported foreground extinction for NGC 7828 is similarly negligible as it is at the level of the photometric uncertainty, mag (Schlafly & Finkbeiner, 2011, via NED).
While the light curves of SN 2021ocs are not very well sampled, the earliest data points from ATLAS suggest that it was rising in brightness (Figure 2a), and the subsequent epochs indicate that it declined steadily, as is typical for most SESN light curves, though with slight fluctuations. Comparing to the templates of early-time light curves of SNe Ib/c (Taddia et al., 2015), it appears that the peak of the light curve occurred around a week after the brightest point in the photometry, which implies that the classification spectrum was taken within 1-2 weeks from the peak brightness, consistent with the phase determined from spectral matching. The comparison between the light curves and the templates suggests that SN 2021ocs peaked around mag, which is fainter than most SESNe, but still within the range of the previously observed objects (Taddia et al. 2015; Zheng et al. 2022, also see e.g. Perley et al. 2020, Figure 7). Alternatively, the peak could have occurred during the solar conjunction before the first detections, which would imply that the light curve could be broader and more luminous. However, in this case the classification spectrum would suggest a considerably older phase. This alternative scenario cannot be ruled out, but requires strong additional assumptions on the early spectral evolution in order to be consistent with the classification spectrum.
In Figure 2b, the light curves of SN 2021ocs are compared with those of SN 2007gr777Obtained from the Open Astronomy Catalog API, https://github.com/astrocatalogs/OACAPI. and H-poor interacting SNe (see section 3.3). Assuming typical early SN Ic evolution, SN 2021ocs shows a gradual decline after the light curve peak. In general, SN 2021ocs shows slower decline compared to the Ibn/Icn population, although there exist individual objects that exhibit significantly broader light curves (e.g. Ben-Ami et al., 2014; Kool et al., 2021).
While the light curve peak brightness and width are unlikely to diverge significantly compared to the bulk of SESNe, SN 2021ocs appears to be peculiarly blue from the first detections in and bands up until late phases888Note that there is no -band detection in the ZTF public data stream, see e.g. https://alerce.online/object/ZTF21abhrpia.. The host-subtracted photometry from ZTF, and the FORS2 photometry, indicate mag throughout the evolution following the light curve peak. Such a blue color is not normally seen in regular SESNe at epochs post peak. Indeed, even at 2-3 weeks before maximum light, such a blue color is rare, and the color index usually stays mag throughout the SN evolution (e.g. Taddia et al., 2015; Zheng et al., 2022).
During the decay phase, the light curves show possible flattening leading to a tail phase slope shallower than the 56Co decay rate assuming complete -ray trapping (Figure 2b, inset). A decay rate slower than 56Co decay indicates that the light curve is not powered solely by radioactive decay, and thus may be powered also by other processes e.g. late-time ejecta-CSM interaction (e.g. Maeda et al., 2015; Dessart et al., 2022) or magnetar spin-down (e.g. Afsariardchi et al., 2021). The blue color is reminiscent of the interaction-powered type-Ibn SNe (see e.g. Ho et al., 2021, Figure 12), suggesting that a similar powering mechanism is likely to be at play.
3.2 Nebular spectrum
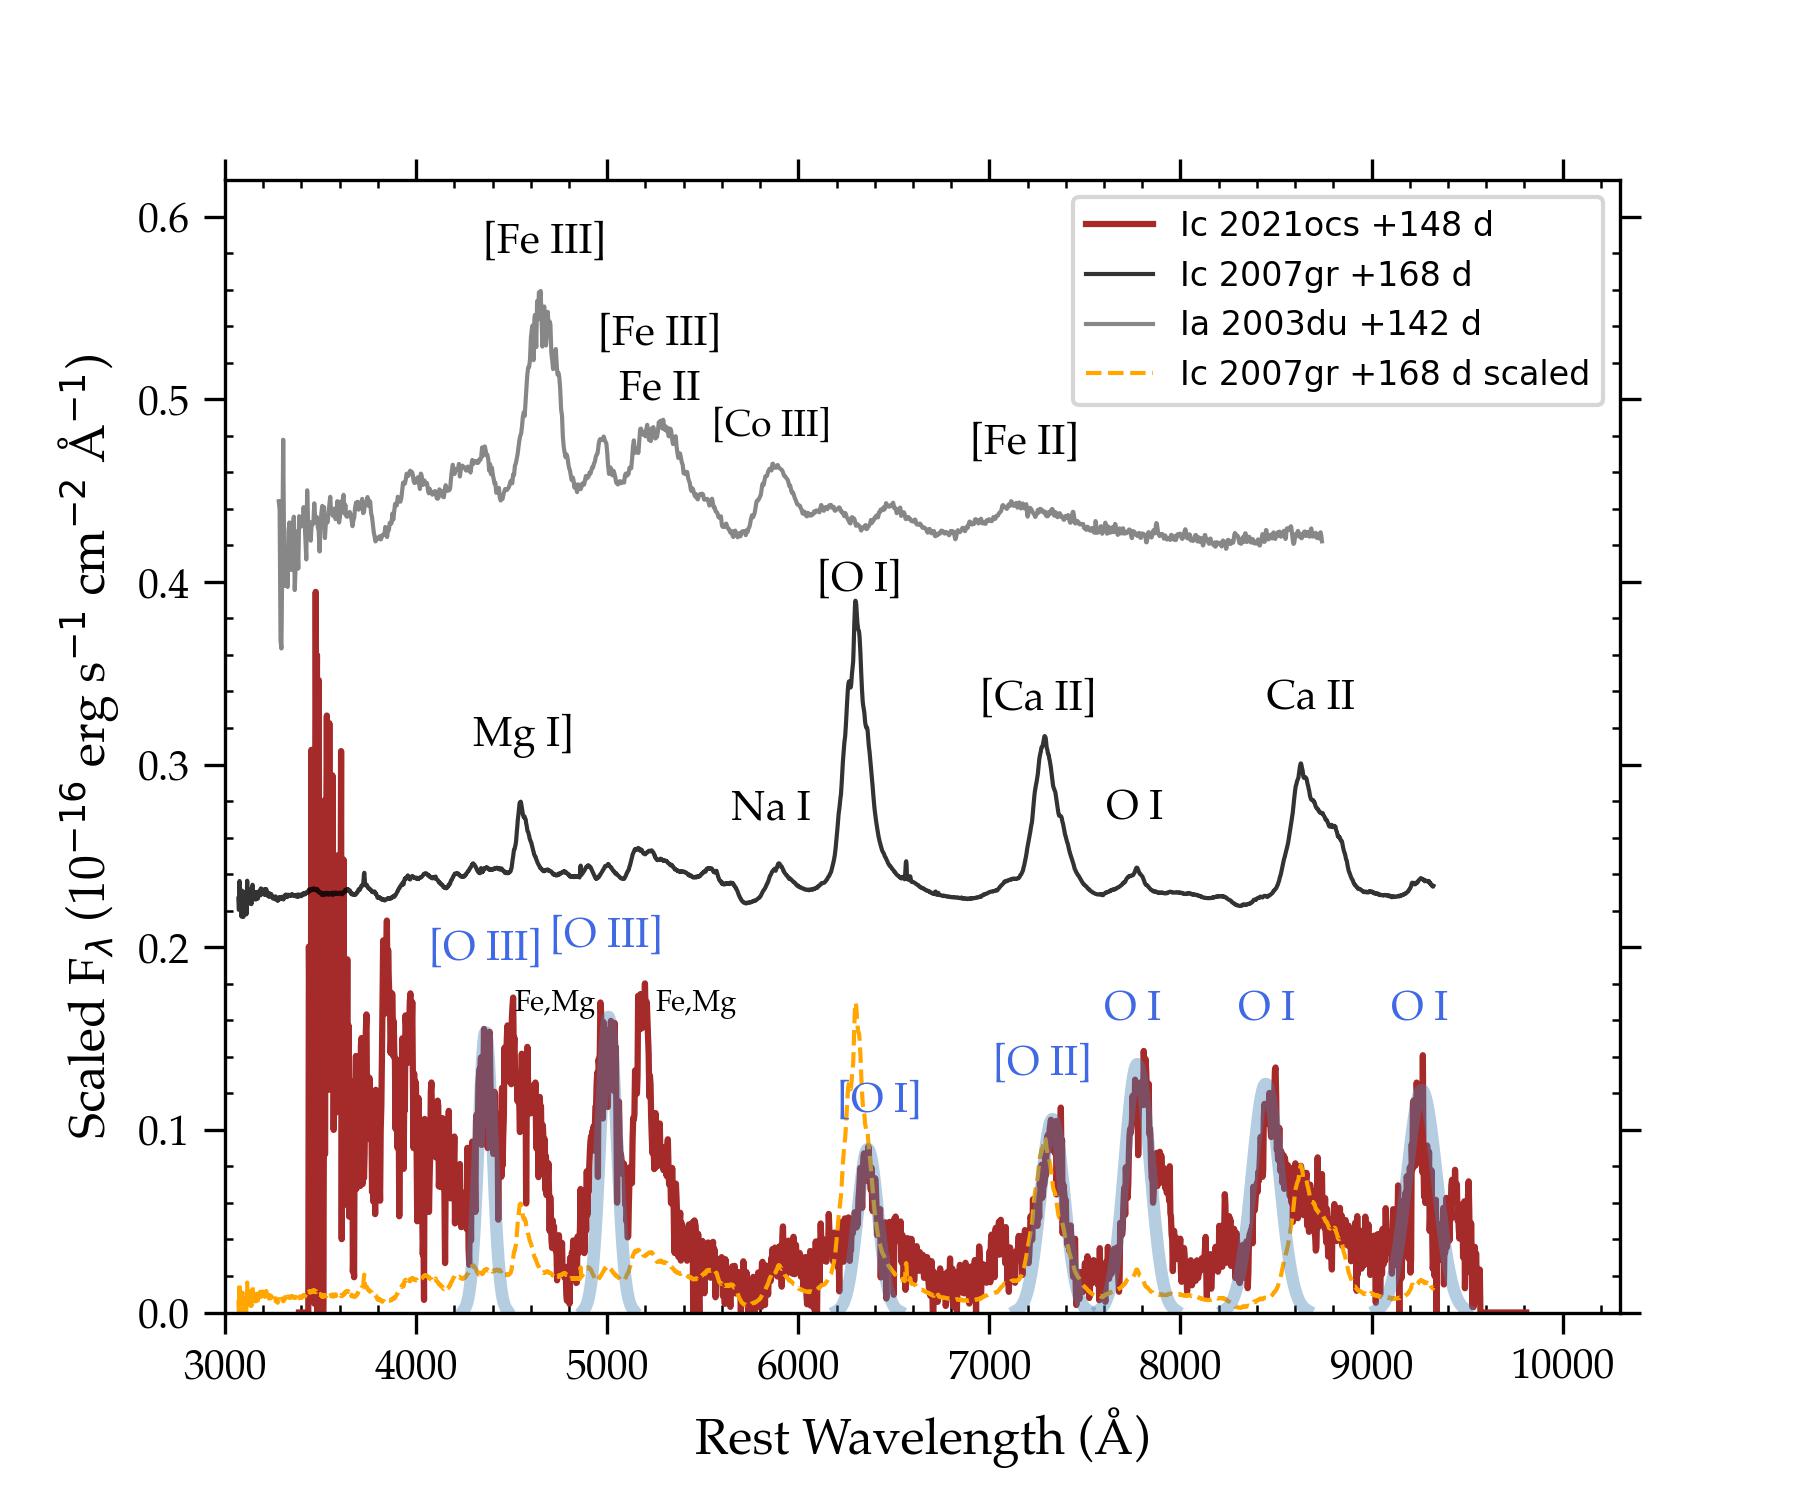
The nebular spectrum of SN 2021ocs, obtained +148 d after the o-band peak, shows characteristics not regularly seen in an SESN nebular spectrum. While the latter is typically dominated by strong emission lines of [O I] doublet, [Ca II] doublet, and Ca II triplet, SN 2021ocs shows a spectrum with more than five emission lines of similar strength across the spectrum (Figure 3). Such a spectrum has never been seen among SESN nebular spectra in the literature (Fang et al., 2022; Prentice et al., 2022; Taubenberger et al., 2009), suggesting a very rare occurrence rate of under . It is also markedly different compared to the nebular spectra of type-Ia SNe, which are dominated by Fe-peak elements (e.g. Taubenberger et al., 2013). Strong H emission lines are absent in SN 2021ocs, which supports the initial SESN classification. The emission lines in the spectrum may be attributed to different transitions and ionization states of O, i.e. O I, [O I], [O II], and [O III], with similar line widths of km s-1 (FWHM, full-width at half-maximum). The commonly seen [O I] doublet is present, possibly superposed on a broader base extending to km s-1 which may be attributed to Fe II (Dessart et al., 2021). [O II] is present and likely to be blended with the commonly seen [Ca II] . It is clear that the [O I] and [Ca II] lines are not the strongest lines in the nebular spectrum, which is atypical for SESNe. Furthermore, the flux ratio of [O I] to [Ca II] is typically for type-Ic SNe (e.g. Fang et al., 2022), which is not the case in SN 2021ocs.
In the red part of the spectrum, three permitted O I emission lines are seen at 7774, 8446, and 9263999These lines are themselves multiplets of several oxygen transitions.. While the O I 7774 is weak in SESN nebular spectra, it is exceptionally strong in SN 2021ocs, suggesting high density conditions. This line is possibly contaminated by Mg I 7877, 7896 in the red shoulder (Figure 4). The 8446 line is similarly contaminated by the broad Ca II triplet on the red side (see comparison with scaled SN 2007gr in Figure 3), although the peak is still clearly prominent. The [O I] 9263 line is blended with Mg II . The peak intensities of the [O I] 8446 and 9263 lines are similar to the O I 7774 line. In typical SESNe, these two redder lines are either very weak or missing. These three O I lines are considered as the most persistent lines of oxygen in the optical and near-infrared regimes, as they appear over a broad range of conditions in spectroscopic experiments (Sansonetti & Martin, 2005).
In the blue, two broad [O III] emission lines are seen, the 4959, 5007 doublet and 4363. They are accompanied with broader emission lines on the red side ( 4600 Å, 5200 Å), possibly arising from the Fe I/Fe II complexes (see e.g. Fig. 7 of Dessart et al., 2021), with prominent peaks of Mg I and Mg II at 4481, 4571, and 5170. Broad [O III] at late phase is also seen in a number of interacting SESNe, e.g. SN 1993J (Matheson et al., 2000) and SN 2014C (Milisavljevic et al., 2015). Mg appears conspicuously in the spectrum of SN 2021ocs, with other lines at 3832 (triplet), 8224 (possible blend with [O I] 8221), and 9436 (doublet). The Mg emission lines are seen weakly also in some SNe Ibn such as SN 2006jc (Pastorello et al., 2007).
3.3 Interpretation: CSM interaction or a pulsar wind nebula?
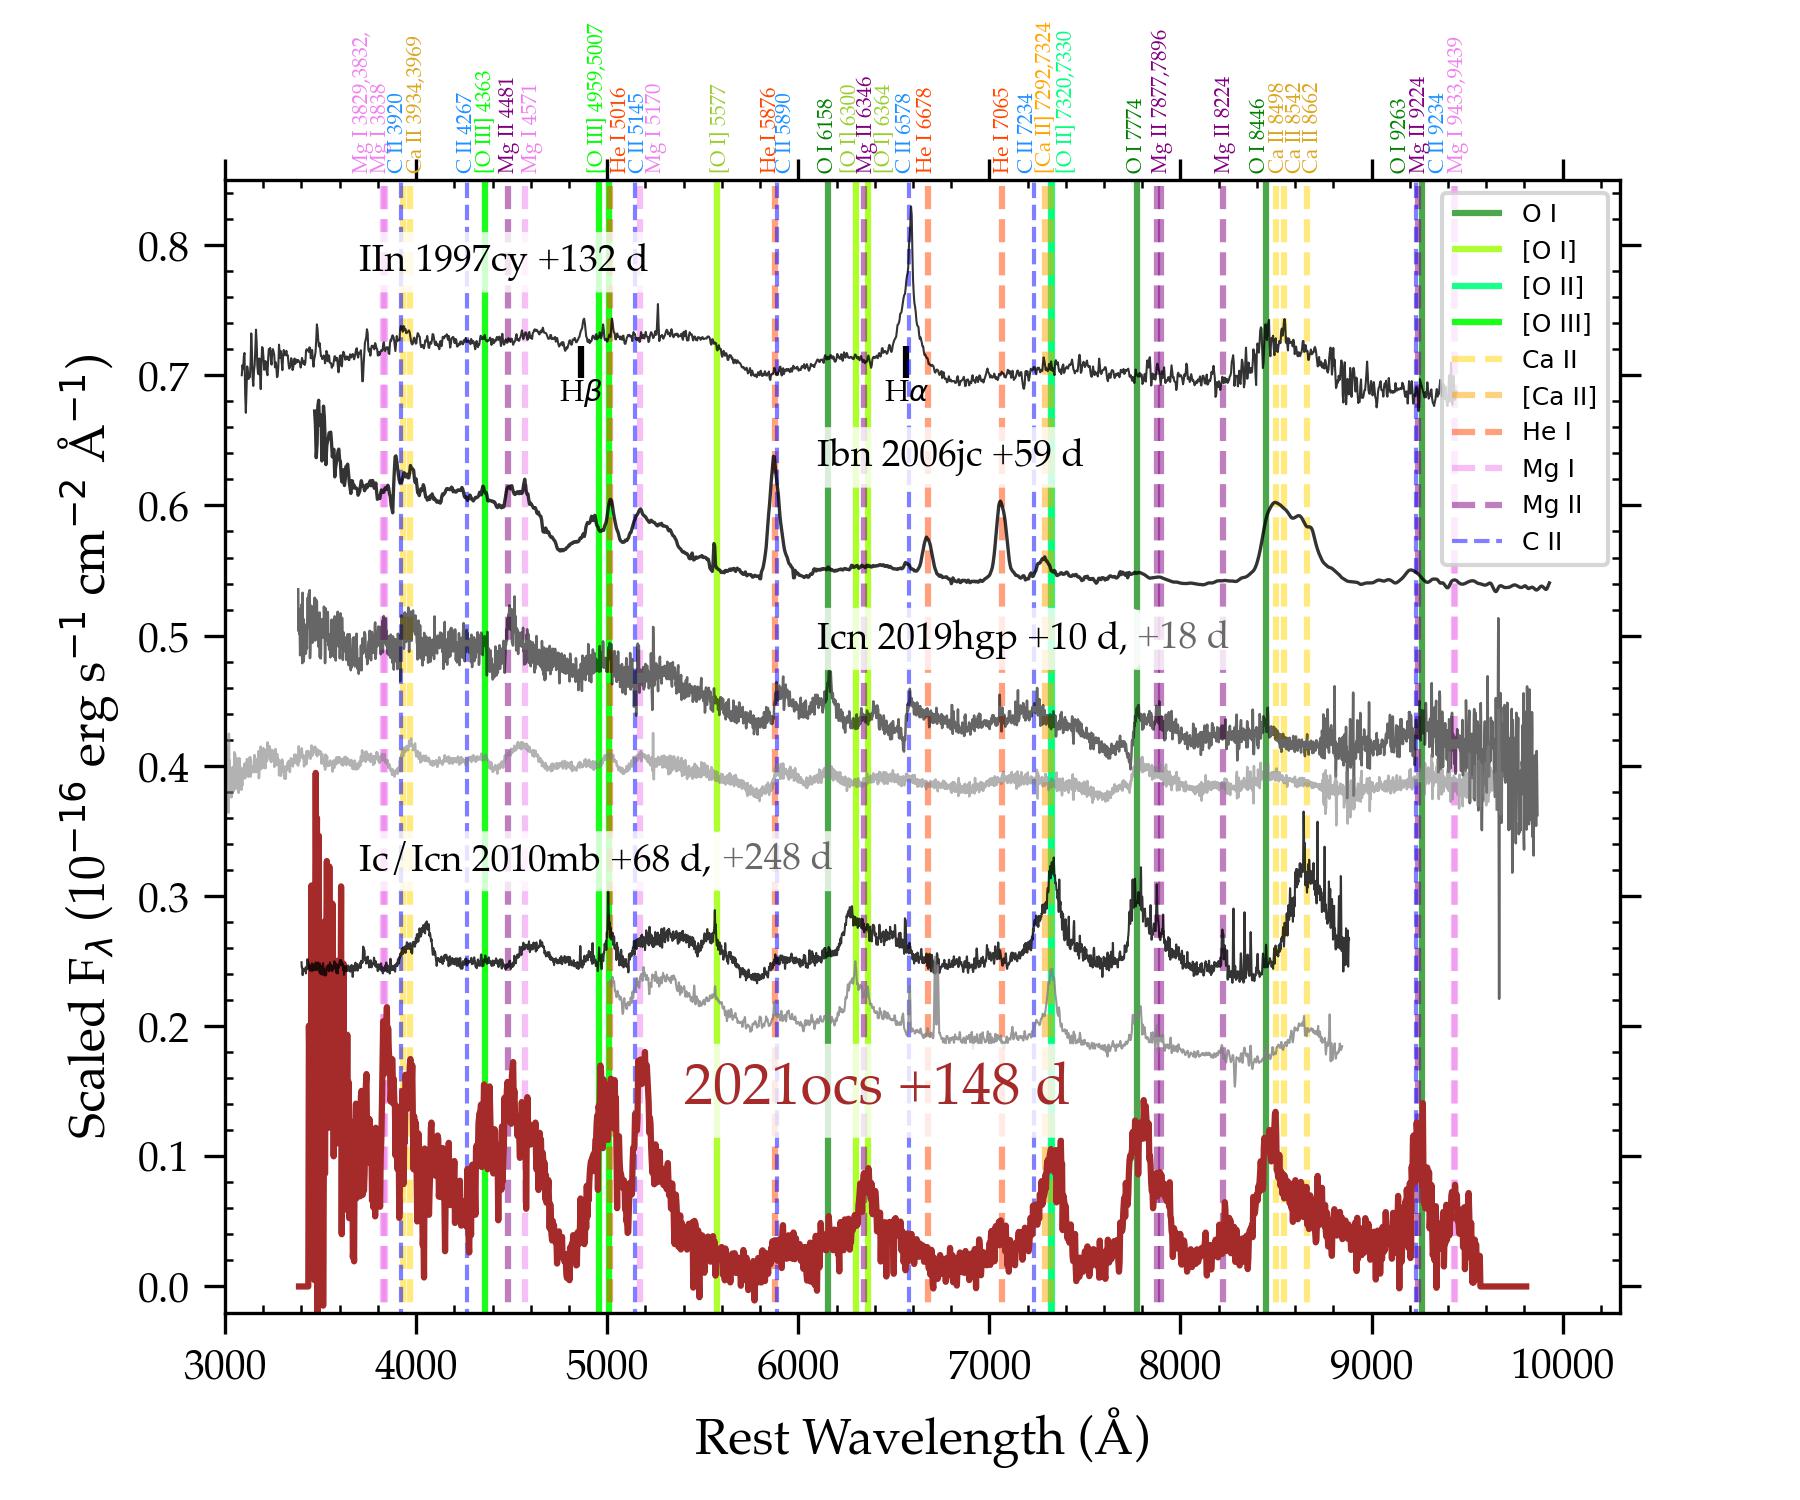
Comparing the nebular spectrum of SN 2021ocs to a number of interacting SNe yields few similarities while the spectrum remains unique and unparalleled in the literature. The blue color and light curve flattening in SN 2021ocs may be explained by CSM interaction, which warrants a spectral comparison with interacting SNe. Figure 4 shows SN 2021ocs spectrum compared to interacting SNe of types IIn, Ibn, and Icn which have relatively good coverage in late phases101010Some objects (i.e. SNe 2006jc and 2019hgp in this case) evolve more rapidly and thus the phases in days are shorter compared to the slower-evolving objects..
The strong narrow H emission lines defining the type-IIn SNe (Schlegel, 1990) are clearly absent in SN 2021ocs. SNe Ibn show prominent narrow He emission lines and a rising blue part of the spectrum (Pastorello et al., 2007), which originates from Fe emission (Dessart et al., 2021, 2022). Similarly this blue rise is also seen in SN 2021ocs, while strong He lines are absent except for the weak He I , and 5876 which is blended with the Na I doublet 5890,5896. Also, He I 5016 may be contaminating the [O III] doublet 4959,5007. The weak He lines in the spectrum of SN 2021ocs suggest that little He is present.
Similar to SNe IIn and Ibn, SNe Icn (Gal-Yam et al., 2022) also show the Fe bumps at late time. In SNe Icn, the initially strong lines of ionized C disappear at later phases to give way to nebular O I lines in the red part of the spectrum. These O I lines are present in SN 2021ocs, which may suggest a connection to SNe Icn which are interpreted as explosions of Wolf-Rayet (WR) stars within a H/He-deficient CSM. Considering the spectra and light curves, it is possible that SN 2021ocs fits this scenario as well, although the CSM interaction did not occur immediately after the explosion. The expanding ejecta interacted with H/He-poor CSM and the interaction drove a reverse shock that ionized the O/Mg-rich outer part of the ejecta. Clumping and inhomogeneity in the ejecta, CSM, and also in the 56Ni distribution, would cause different levels of compression and ionization stages in the gas, which could give rise to the various ionization states seen in the O and Mg emission lines. The absence/weakness of C and He lines sets apart SN 2021ocs from the general population of SN Ibn and Icn.
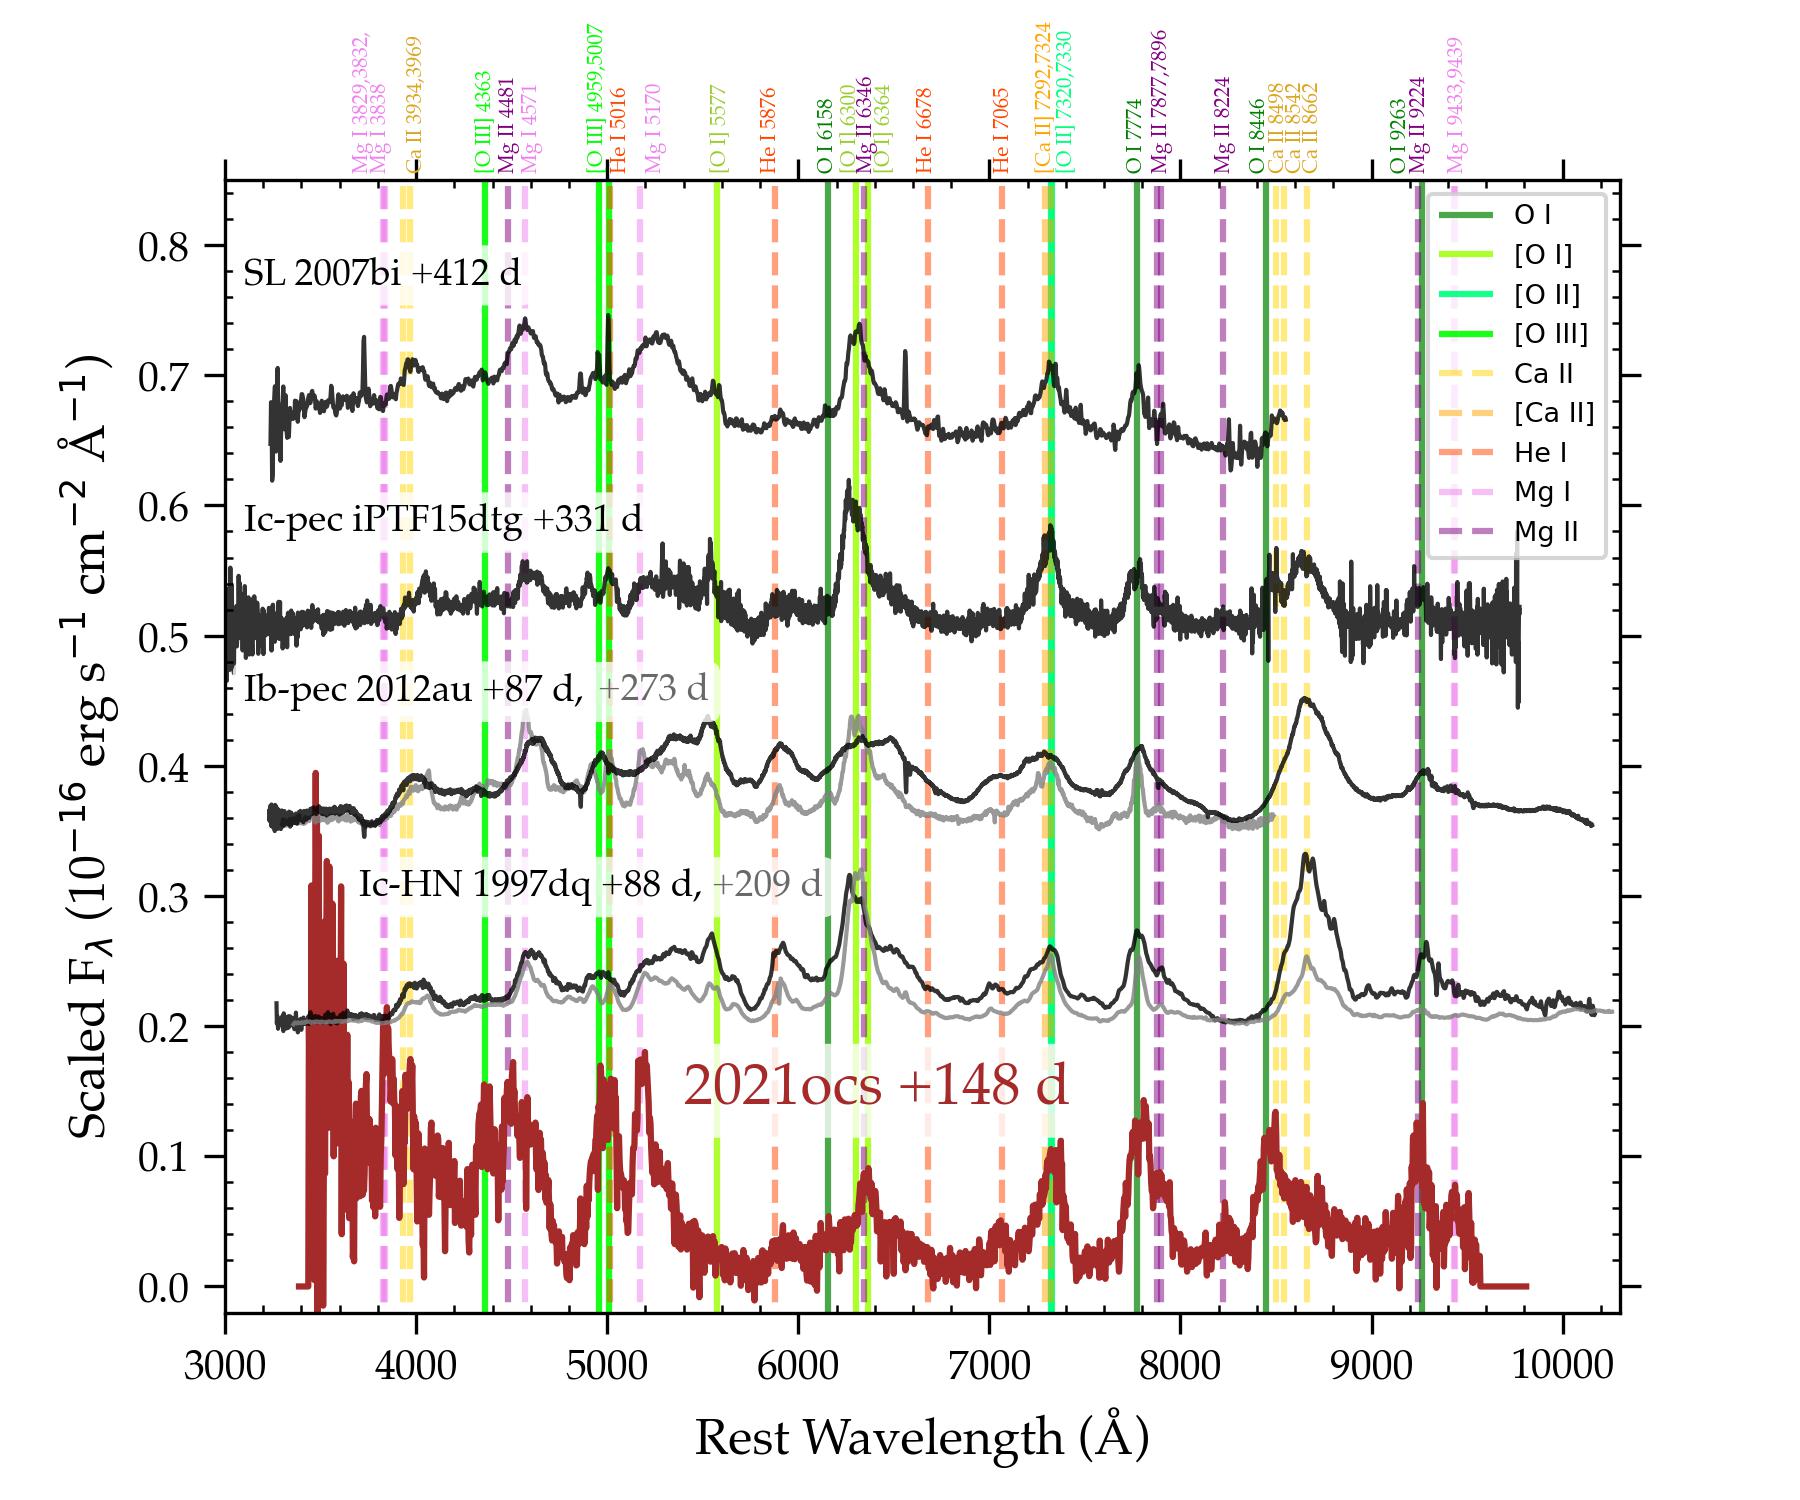
Broad [O III] emission is usually only seen in very late times in CCSNe, a few years after the explosion, and has been interpreted as an evidence of a pulsar/magnetar wind nebula (Chevalier & Fransson, 1992; Milisavljevic et al., 2018) alternatively to CSM interaction. In this case, the line is also accompanied by [O I] and [O II], which is interpreted as different ionization layers by photoionization. The [O III] line is seen in a variety of SESNe including the normal and superluminous ones (Milisavljevic et al., 2018). This subset of objects which show broad late-time [O III] curiously display a narrow ( km s-1) and relatively strong O I 7774 line in the nebular phase around a half to one year post explosion, although in these cases it is neither strong nor accompanied by the same set of lines seen in SN 2021ocs. Figure 5 shows the nebular spectrum of SN 2021ocs compared to such objects. Generally the agreement is poor: while they show similar line profiles in [O II] (sloping blue shoulder, contamination by [Ca II]) and O I 7774 (sloping red shoulder, contamination by Mg II), striking differences are seen in the O I 8446 line, Mg lines redward of 8000 Å, and in the various strong lines in the blue, which all are absent or very weak in the comparison objects. The association of SN 2021ocs with a wind nebula caused by a magnetized central object is therefore weak, and CSM interaction remains as our preferred interpretation of the observed properties in the spectra and light curves. Drawing analogy with type-Ibn/Icn SNe (e.g. Pastorello et al., 2007; Ben-Ami et al., 2014; Ho et al., 2021; Gal-Yam et al., 2022), SN 2021ocs shows a similarly blue color and a rising blue continuum possibly extending to the ultraviolet (cf. interaction models of Dessart & Hillier, 2022), and prominent emission lines of O and Mg, suggesting similar mechanism of CSM interaction. Even with CSM interaction, SN 2021ocs appears to be underluminous ( mag, compared to mag for SNe Ic in the sample of Zheng et al. 2022). This suggests a small amount of 56Ni, which is another similarity to SNe Ibn and Icn.
In SN 2021ocs, the CSM interaction likely occurred past the light curve peak. Clearly, if interaction is present, it cannot be strong early on. A delayed interaction may be interpreted as a detached or low-density nearby CSM, which was surrounding the SN progenitor star at the time of explosion. Furthermore, for the interaction to be dominating at late times, the amount of CSM must be small (see e.g. Dessart et al., 2022). Assuming an ejecta velocity of 10 000 km s-1, if CSM interaction started 50 d after the explosion as inferred from the blue color, then the distance traversed by the unimpeded SN ejecta would be cm from the progenitor star. This inferred CSM distance is similar to those in other interacting SESNe with detached CSM (e.g. SN 2017dio, Kuncarayakti et al. 2018). In the case of SN 2021ocs, as a type-Ic SN its progenitor could have been a carbon-oxygen star with a wind velocity of 1000 km s-1. If the CSM was formed through such a wind, the mass loss probed by the CSM interaction would have occurred 500 d before the SN. At this time, the progenitor star would have just finished the C-shell burning stage and starting Ne burning (Fuller, 2017). The short CSM distance and time before the SN explosion indicate that the SN progenitor star could have been surrounded by CSM at the time of explosion although not as embedded as in the case of SNe Icn/Ibn, which show a rapidly increasing CSM density toward the SN progenitor (steeper than , Maeda & Moriya, 2022). The immediate circumstellar environment of SN 2021ocs, therefore, was relatively clean compared to those of SNe Icn/Ibn, as the explosion was first seen as a normal type-Ic SN without CSM interaction. This suggests that the CSM density was low closer to the progenitor star, implying a possible CSM distribution in a detached torus or disk, clumps, or a shell, which in any case contains a central cavity. Two possible interpretations arise regarding the progenitor mass loss as it approaches the terminal explosion: (1) a low progenitor mass-loss rate, suggesting that mass loss may have become weaker once the stripping reached the inner O-Mg core, or (2) the progenitor ejected some material which pushed away slower CSM in the vicinity, creating a cavity. In either case, SN 2021ocs represents the most extreme case of envelope stripping where the O-Mg layer of the progenitor is exposed. Within the massive star SN ejecta-CSM interaction case, it is positioned at the end of the sequence of CSM build-up resulting from the progenitor stripping: IIn Ibn Icn SN 2021ocs.
4 Summary
This Letter presents photometry and spectroscopy of SN 2021ocs, which yield a peculiar nebular spectrum dominated by O and Mg emission lines. The unique set of emission lines, blue continuum and color, and slowly-declining light curve tail suggest that interaction with a H/He-poor CSM took place in SN 2021ocs. The absence of signs of interaction in the early spectrum suggests that the CSM density close to the progenitor star was low. Comparing with interacting SESNe of types Ibn and Icn, SN 2021ocs appears to be more stripped as the deep O-Mg layer in the progenitor is exposed, and the outer C-O and He-rich layers are stripped away. SN 2021ocs poses yet another challenge to stellar evolution theory, regarding the final phases of evolution of massive stars. With its unique spectral and photometric behavior, it represents a rare case not previously considered. Modeling the evolutionary pathways, mass loss, and explosion of a highly stripped star with an exposed O-Mg layer will provide insights in comparison with the observations. Future observations of transients should consider targets with unusual colors, albeit a spectroscopically normal appearance, in order to uncover similar peculiar objects.
References
- Afsariardchi et al. (2021) Afsariardchi, N., Drout, M. R., Khatami, D. K., et al. 2021, ApJ, 918, 89, doi: 10.3847/1538-4357/ac0aeb
- Appenzeller et al. (1998) Appenzeller, I., Fricke, K., Fürtig, W., et al. 1998, The Messenger, 94, 1
- Bellm et al. (2019) Bellm, E. C., Kulkarni, S. R., Graham, M. J., et al. 2019, PASP, 131, 018002, doi: 10.1088/1538-3873/aaecbe
- Ben-Ami et al. (2014) Ben-Ami, S., Gal-Yam, A., Mazzali, P. A., et al. 2014, ApJ, 785, 37, doi: 10.1088/0004-637X/785/1/37
- Blondin & Tonry (2007) Blondin, S., & Tonry, J. L. 2007, ApJ, 666, 1024, doi: 10.1086/520494
- Chambers et al. (2016) Chambers, K. C., Magnier, E. A., Metcalfe, N., et al. 2016, arXiv e-prints, arXiv:1612.05560. https://arxiv.org/abs/1612.05560
- Chevalier & Fransson (1992) Chevalier, R. A., & Fransson, C. 1992, ApJ, 395, 540, doi: 10.1086/171674
- Davis et al. (2022) Davis, K. W., Taggart, K., Tinyanont, S., et al. 2022, arXiv e-prints, arXiv:2211.05134. https://arxiv.org/abs/2211.05134
- Dessart & Hillier (2022) Dessart, L., & Hillier, D. J. 2022, A&A, 660, L9, doi: 10.1051/0004-6361/202243372
- Dessart et al. (2021) Dessart, L., Hillier, D. J., Sukhbold, T., Woosley, S. E., & Janka, H. T. 2021, A&A, 656, A61, doi: 10.1051/0004-6361/202141927
- Dessart et al. (2022) Dessart, L., John Hillier, D., & Kuncarayakti, H. 2022, A&A, 658, A130, doi: 10.1051/0004-6361/202142436
- Fang et al. (2022) Fang, Q., Maeda, K., Kuncarayakti, H., et al. 2022, ApJ, 928, 151, doi: 10.3847/1538-4357/ac4f60
- Freudling et al. (2013) Freudling, W., Romaniello, M., Bramich, D. M., et al. 2013, A&A, 559, A96, doi: 10.1051/0004-6361/201322494
- Fuller (2017) Fuller, J. 2017, MNRAS, 470, 1642, doi: 10.1093/mnras/stx1314
- Gal-Yam et al. (2009) Gal-Yam, A., Mazzali, P., Ofek, E. O., et al. 2009, Nature, 462, 624, doi: 10.1038/nature08579
- Gal-Yam et al. (2022) Gal-Yam, A., Bruch, R., Schulze, S., et al. 2022, Nature, 601, 201, doi: 10.1038/s41586-021-04155-1
- Ho et al. (2021) Ho, A. Y. Q., Perley, D. A., Gal-Yam, A., et al. 2021, arXiv e-prints, arXiv:2105.08811. https://arxiv.org/abs/2105.08811
- Hosseinzadeh et al. (2017) Hosseinzadeh, G., Arcavi, I., Valenti, S., et al. 2017, ApJ, 836, 158, doi: 10.3847/1538-4357/836/2/158
- Huber (2021) Huber, M. E. 2021, Transient Name Server Classification Report, 2021-2064, 1
- Hunter et al. (2009) Hunter, D. J., Valenti, S., Kotak, R., et al. 2009, A&A, 508, 371, doi: 10.1051/0004-6361/200912896
- Kool et al. (2021) Kool, E. C., Karamehmetoglu, E., Sollerman, J., et al. 2021, A&A, 652, A136, doi: 10.1051/0004-6361/202039137
- Kuncarayakti et al. (2018) Kuncarayakti, H., Maeda, K., Ashall, C. J., et al. 2018, ApJ, 854, L14, doi: 10.3847/2041-8213/aaaa1a
- Lantz et al. (2004) Lantz, B., Aldering, G., Antilogus, P., et al. 2004, in Society of Photo-Optical Instrumentation Engineers (SPIE) Conference Series, Vol. 5249, Optical Design and Engineering, ed. L. Mazuray, P. J. Rogers, & R. Wartmann, 146–155, doi: 10.1117/12.512493
- Maeda & Moriya (2022) Maeda, K., & Moriya, T. J. 2022, ApJ, 927, 25, doi: 10.3847/1538-4357/ac4672
- Maeda et al. (2015) Maeda, K., Hattori, T., Milisavljevic, D., et al. 2015, ApJ, 807, 35, doi: 10.1088/0004-637X/807/1/35
- Masci et al. (2019) Masci, F. J., Laher, R. R., Rusholme, B., et al. 2019, PASP, 131, 018003, doi: 10.1088/1538-3873/aae8ac
- Matheson et al. (2001) Matheson, T., Filippenko, A. V., Li, W., Leonard, D. C., & Shields, J. C. 2001, AJ, 121, 1648, doi: 10.1086/319390
- Matheson et al. (2000) Matheson, T., Filippenko, A. V., Barth, A. J., et al. 2000, AJ, 120, 1487, doi: 10.1086/301518
- Milisavljevic et al. (2018) Milisavljevic, D., Patnaude, D. J., Chevalier, R. A., et al. 2018, ApJ, 864, L36, doi: 10.3847/2041-8213/aadd4e
- Milisavljevic et al. (2015) Milisavljevic, D., Margutti, R., Kamble, A., et al. 2015, ApJ, 815, 120, doi: 10.1088/0004-637X/815/2/120
- Modjaz et al. (2014) Modjaz, M., Blondin, S., Kirshner, R. P., et al. 2014, AJ, 147, 99, doi: 10.1088/0004-6256/147/5/99
- Pastorello et al. (2007) Pastorello, A., Smartt, S. J., Mattila, S., et al. 2007, Nature, 447, 829, doi: 10.1038/nature05825
- Pellegrino et al. (2022) Pellegrino, C., Howell, D. A., Terreran, G., et al. 2022, ApJ, 938, 73, doi: 10.3847/1538-4357/ac8ff6
- Perley et al. (2020) Perley, D. A., Fremling, C., Sollerman, J., et al. 2020, ApJ, 904, 35, doi: 10.3847/1538-4357/abbd98
- Perley et al. (2022) Perley, D. A., Sollerman, J., Schulze, S., et al. 2022, ApJ, 927, 180, doi: 10.3847/1538-4357/ac478e
- Prentice et al. (2022) Prentice, S. J., Maguire, K., Siebenaler, L., & Jerkstrand, A. 2022, MNRAS, 514, 5686, doi: 10.1093/mnras/stac1657
- Sanders et al. (2013) Sanders, N. E., Soderberg, A. M., Foley, R. J., et al. 2013, ApJ, 769, 39, doi: 10.1088/0004-637X/769/1/39
- Sansonetti & Martin (2005) Sansonetti, J. E., & Martin, W. C. 2005, Journal of Physical and Chemical Reference Data, 34, 1559, doi: 10.1063/1.1800011
- Schlafly & Finkbeiner (2011) Schlafly, E. F., & Finkbeiner, D. P. 2011, ApJ, 737, 103, doi: 10.1088/0004-637X/737/2/103
- Schlegel (1990) Schlegel, E. M. 1990, MNRAS, 244, 269
- Shivvers et al. (2019) Shivvers, I., Filippenko, A. V., Silverman, J. M., et al. 2019, MNRAS, 482, 1545, doi: 10.1093/mnras/sty2719
- Smith et al. (2020) Smith, K. W., Smartt, S. J., Young, D. R., et al. 2020, PASP, 132, 085002, doi: 10.1088/1538-3873/ab936e
- Smith (2014) Smith, N. 2014, ARA&A, 52, 487, doi: 10.1146/annurev-astro-081913-040025
- Smith (2017) —. 2017, in Handbook of Supernovae, ed. A. W. Alsabti & P. Murdin, 403, doi: 10.1007/978-3-319-21846-5_38
- Smith et al. (2011) Smith, N., Li, W., Filippenko, A. V., & Chornock, R. 2011, MNRAS, 412, 1522, doi: 10.1111/j.1365-2966.2011.17229.x
- Stanishev et al. (2007) Stanishev, V., Goobar, A., Benetti, S., et al. 2007, A&A, 469, 645, doi: 10.1051/0004-6361:20066020
- Taddia et al. (2019) Taddia, F., Sollerman, J., Fremling, C., et al. 2019, A&A, 621, A64, doi: 10.1051/0004-6361/201833688
- Taddia et al. (2015) Taddia, F., Sollerman, J., Leloudas, G., et al. 2015, A&A, 574, A60, doi: 10.1051/0004-6361/201423915
- Taubenberger et al. (2013) Taubenberger, S., Kromer, M., Pakmor, R., et al. 2013, ApJ, 775, L43, doi: 10.1088/2041-8205/775/2/L43
- Taubenberger et al. (2009) Taubenberger, S., Valenti, S., Benetti, S., et al. 2009, MNRAS, 397, 677, doi: 10.1111/j.1365-2966.2009.15003.x
- Theureau et al. (2007) Theureau, G., Hanski, M. O., Coudreau, N., Hallet, N., & Martin, J. M. 2007, A&A, 465, 71, doi: 10.1051/0004-6361:20066187
- Tody (1986) Tody, D. 1986, in Society of Photo-Optical Instrumentation Engineers (SPIE) Conference Series, Vol. 627, Instrumentation in astronomy VI, ed. D. L. Crawford, 733, doi: 10.1117/12.968154
- Tody (1993) Tody, D. 1993, in Astronomical Society of the Pacific Conference Series, Vol. 52, Astronomical Data Analysis Software and Systems II, ed. R. J. Hanisch, R. J. V. Brissenden, & J. Barnes, 173
- Tonry et al. (2018) Tonry, J. L., Denneau, L., Heinze, A. N., et al. 2018, PASP, 130, 064505, doi: 10.1088/1538-3873/aabadf
- Tucker et al. (2022) Tucker, M. A., Shappee, B. J., Huber, M. E., et al. 2022, arXiv e-prints, arXiv:2210.09322. https://arxiv.org/abs/2210.09322
- Turatto et al. (2000) Turatto, M., Suzuki, T., Mazzali, P. A., et al. 2000, ApJ, 534, L57, doi: 10.1086/312653
- Woosley et al. (1995) Woosley, S. E., Langer, N., & Weaver, T. A. 1995, ApJ, 448, 315, doi: 10.1086/175963
- Yaron & Gal-Yam (2012) Yaron, O., & Gal-Yam, A. 2012, PASP, 124, 668, doi: 10.1086/666656
- Yoon et al. (2010) Yoon, S. C., Woosley, S. E., & Langer, N. 2010, ApJ, 725, 940, doi: 10.1088/0004-637X/725/1/940
- Zheng et al. (2022) Zheng, W., Stahl, B. E., de Jaeger, T., et al. 2022, MNRAS, 512, 3195, doi: 10.1093/mnras/stac723