The temperature-dependence of carrier mobility is not a reliable indicator of the dominant scattering mechanism
Abstract
The temperature dependence of experimental charge carrier mobility is commonly used as a predictor of the dominant carrier scattering mechanism in semiconductors, particularly in thermoelectric applications. In this work, we critically evaluate whether this practice is well founded. A review of 47 state-of-the-art mobility calculations reveals no correlation between the major scattering mechanism and the temperature trend of mobility. Instead, we demonstrate that the phonon frequencies are the prevailing driving forces behind the temperature dependence and can cause it to vary between to even for an idealised material. To demonstrate this, we calculate the mobility of 23,000 materials and review their temperature dependence, including separating the contributions from deformation, polar, and impurity scattering mechanisms. We conclusively demonstrate that a temperature dependence of is not a reliable indicator of deformation potential scattering. Our work highlights the potential pitfalls of predicting the major scattering type based on the experimental mobility temperature trend alone.
Ever since the first theories of semiconductors were developed, the temperature dependence of mobility has been used to understand the quantum behaviour of materials. In 1931, Wilson derived expressions for charge transport in semiconductors under the assumption that lattice vibrations were the major cause of the electronic resistivity [1, 2]. His work proved highly successful at predicting the temperature dependence of mobility in -type germanium and lay the foundation for the modern theory of band conduction in semiconductors [3, 4]. The temperature dependence of experimentally measured Hall mobility is now commonly used as a predictor of the dominant scattering mechanism in thermoelectric materials [5, 6, 7]. Knowledge of the dominant scattering mechanism is often employed to fit models of charge transport including deformation potentials and effective masses, and to obtain estimates of the optimal doping concentration and temperatures that maximise thermoelectric performance [8, 9, 10, 11, 12].
Wilson’s 1931 paper demonstrated that the mobility of a system dominated by acoustic lattice scattering should exhibit a dependence [2, 3, 13]. The same temperature dependence was later demonstrated for optical lattice scattering at high temperatures [14, 15]. Since then, a temperature dependence of has widely been considered an experimental signature of deformation potential scattering. Temperature trends ranging from – are thought to indicate scattering due to polar optical phonons [16, 17, 18], and even more positive coefficients are ascribed to piezoelectric (), alloy (), and impurity () scattering [19, 20, 21]. In all of these cases, the expected temperature trends are derived from highly-simplified models of electronic scattering in systems containing a single isotropic and parabolic band and a single dispersion-less phonon frequency.
State-of-the-art approaches based on density functional perturbation theory combined with Wannier interpolation (DFPT+Wannier) can now calculate the transport properties of semiconductors with predictive accuracy [22, 23, 24]. As the number of materials studied using DFPT+Wannier has grown — at the time of writing this includes over 100 bulk and two-dimensional compounds — an unexpected trend has emerged. Many materials that were thought to be limited by acoustic deformation potential scattering based on the temperature dependence of mobility of have instead been shown to have strong contributions from polar optical and other scattering mechanisms (Fig. 1) [25, 26]. Accordingly, these latest computational results are challenging the commonly held assumption that the temperature dependence of mobility is a reliable indicator of the underlying scattering processes.
In this work, we critically evaluate whether the temperature dependence of carrier mobility is a reliable indicator the dominant scattering type. We review 47 DFPT+Wannier calculations that reveals no correlation between the major scattering mechanism and the temperature trend of mobility. Instead, we demonstrate that the phonon frequencies are largely responsible for the temperature dependence of mobility and can cause it to vary between to even in a simple parabolic band structure. Finally, we extract the temperature dependence of mobility for acoustic deformation potential, polar optical, and impurity scattering in over 23,000 materials that we have calculated using the recently developed amset software [27]. Our results demonstrate that the temperature dependence of mobility should not be used to determine the dominant scattering mechanism. We conclude with the potential pitfalls of assuming the dominant scattering mechanism based on the temperature dependence of mobility alone.
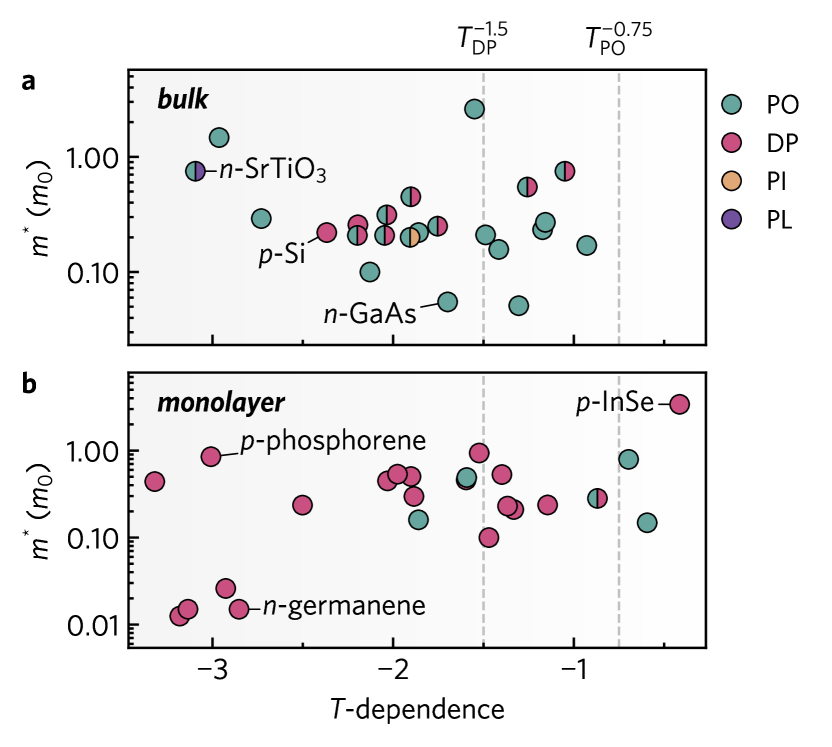
The temperature dependence of mobility calculated by DFPT+Wannier (23 bulk and 24 monolayer materials) shows a wide range of values spanning (-type \ceSrTiO3) to (monolayer -InSe) as presented in Fig. 1. We have distinguished each compound by scattering type, where a particular mechanism is considered dominant if it reduces the mobility by an order of magnitude or more. We find no observable correlation between the dominant scattering mechanism and the temperature trend. For example, most materials exhibit a temperature dependence more negative than . Although this trend is commonly associated with deformation potential scattering, many of these materials are in fact dominated by polar optical phonon scattering. Furthermore, many materials limited by deformation scattering exhibit temperature trends more negative than . These results indicate that the mobility trends derived for idealised scattering in simple parabolic bands are not reliable in most materials.
We note that the majority of bulk materials are dominated by polar optical phonon scattering, whereas the monolayer materials are dominated by deformation potential scattering. However, as most monolayers calculated using DFPT+Wannier to date have been elemental compounds that are inherently non-polar, this trend may not reveal a fundamental difference in the scattering physics between bulk and monolayer systems.
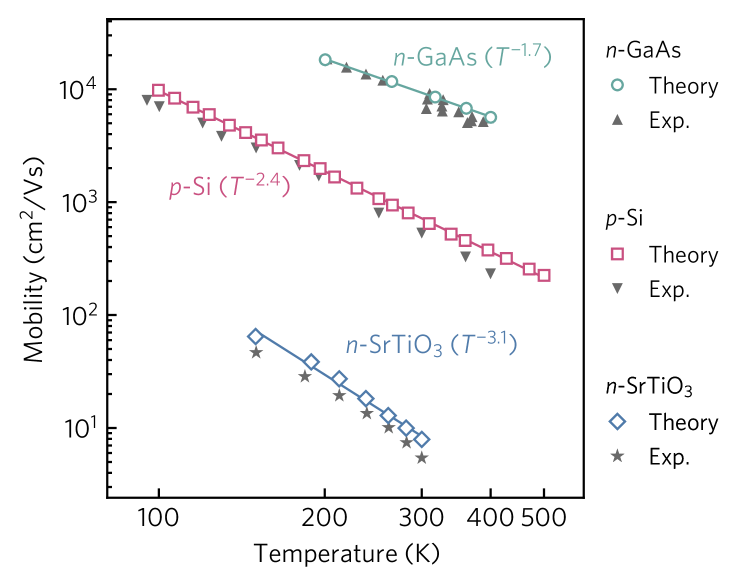
We stress that DFPT+Wannier is a state-of-the-art approach that can yield excellent agreement with experimental Hall effect measurements. This is highlighted in Fig. 2 where we present the calculated and experimental carrier mobilities of -GaAs, -Si, and -\ceSrTiO3. For each material, the theoretical mobility exhibits excellent agreement with both the magnitude and temperature dependence of the experimental measurements. However, in each case the observed temperature trend differs from the trend predicted by the dominant scattering mechanism. For example, -Si exhibits a , despite being dominated by deformation potential scattering, a very large deviation from the nominal dependence. In the following section we examine these materials in more detail with the goal of uncovering why a given scattering type can exhibit a wide range of temperature trends.
GaAs is a classic zinc-blende semiconductor with an isotropic conduction band pocket centered at the -point and scattering dominated by polar optical phonons [24]. Despite its simple band structure and essentially single source of scattering, GaAs exhibits a dependence that is very close to that associated with deformation potential scattering. As we shall demonstrate, the value of is not intrinsic to the dominant scattering mechanism itself but is instead a consequence of the physical properties of GaAs, in particular: (i) its large polar optical phonon frequency and (ii) slight non-parabolicity in the conduction band.
To investigate further, we performed mobility calculations for a single parabolic band with an effective mass = using the amset package [27] and only included polar optical scattering (known to dominate in GaAs). amset has been shown provide scattering rates and mobility within of DFPT+Wannier when benchmarked on 23 semiconductors [27]. Further details on the amset methodology and the calculation procedure are given in Section S3 of the Supplementary Material.
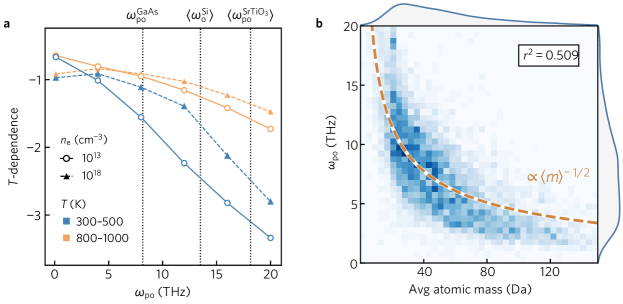
Our transport calculations reveal that systems with smaller phonon frequencies will show a weaker (less negative) temperature dependence of mobility for a fixed temperature range. Indeed, simply adjusting the polar optical phonon frequency can cause the mobility to decay as gradually as ( = ) or as rapidly as () for a single parabolic band at low temperature and doping ( = ; = , Fig. 3a, solid blue line). We note that the temperature dependence for small falls within the range of values broadly associated polar optical phonon scattering (–). When calculations are performed using the polar optical frequency of GaAs ( = ), the mobility exhibits a dependence of close to the experimental trend of . Our analysis indicates that simple compounds composed of light atoms with high-frequency optical modes are likely to exhibit a more negative -dependence of mobility than compounds composed of heavy atoms which generally exhibit low phonon frequencies (as demonstrated in Fig. 3b which reveals the inverse relationship between atomic mass and ).
We note that the temperature dependence of mobility also depends on the temperature and the doping concentration. At higher temperatures, the temperature dependence is weakened (made less negative). For example, at a phonon frequency of the mobility dependence is reduced from between to between (Fig. 3a, solid orange line). Thermoelectric materials generally exhibit optimal performance at degenerate or near degenerate doping (termed “high doping”). A higher doping concentration results in a weakening of the temperature dependence of mobility across all phonon frequencies (Fig. 3a, dashed blue line, ). At high temperature and high doping, the mobility exhibits the weakest temperature dependence and does not become more negative than even at the largest phonon frequencies (Fig. 3a, , , = ). Note, however, that even at high-temperature, high-doping conditions, mobility limited by polar-optical scattering can exhibit a similar temperature dependence as that broadly associated with lattice deformation potential scattering (). In Section S2 of the Supplementary Material, we explicitly investigate the impact of changing the temperature and carrier concentration on the temperature dependence of mobility, and confirm the trends discussed above.
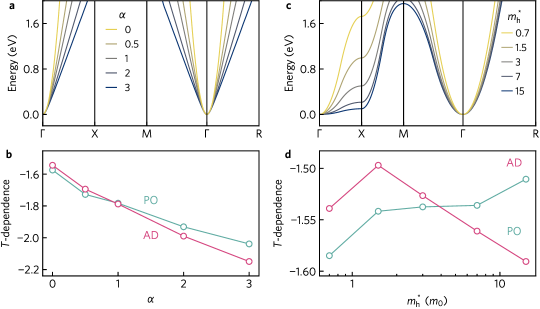
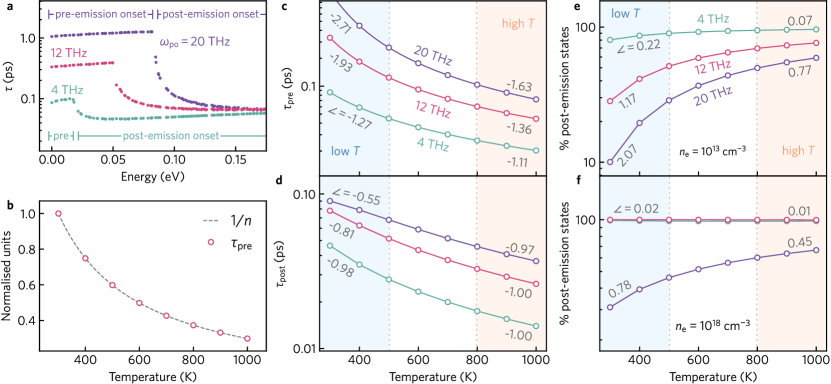
The relationship between phonon frequency and the temperature dependence of mobility arises due to the temperature dependence of the electron lifetimes (). The temperature dependence of the electron lifetimes in turn results from the Bose–Einstein occupation factor of the phonons , where is the reduced Planck’s constant and is the Boltzmann constant. Greater phonon occupation results in decreased electron lifetimes. For example, Fig. 4b reveals the lifetimes of the low energy electronic states (i.e., pre-phonon emission scattering, at energies less than from the conduction band minimum, Fig. 4a) are inversely proportional to the Bose–Einstein phonon occupation. At low temperatures, the phonons will not be sufficiently excited and their population will increase exponentially with temperature, thereby rapidly decreasing the electron lifetimes (see blue region in Fig. 4c) and hence the electron mobility. At higher temperatures, phonon occupation increases roughly linearly with temperature resulting in more gradual decay of electron lifetimes (see orange region in Fig. 4c). The temperature at which the rate of occupation transitions from exponential to linear increase is determined by the phonon frequency. A low frequency () means the phonon occupation increases more linearly and hence the mobility will show a weaker temperature dependence (see teal line [] in Fig. 4c). A higher frequency () means the phonon occupation increases more exponentially with temperature (see purple line [] in Fig. 4c). Accordingly, for a fixed temperature range, the temperature dependence of mobility is less negative in systems with smaller phonon frequencies, exactly as revealed in Fig. 3a.
The weakening in the temperature dependence of mobility at higher temperatures is also explained by the more linear change of phonon occupation in the high temperature regime. There is an additional effect, arising from the ratio of pre- and post-emission onset lifetimes, that reinforces the impact of phonon occupations. This is discussed further in Section S4 of the Supplementary Material.
At higher doping concentrations, the temperature dependence of mobility is also weakened (made less negative). This is because increased doping activates higher energy electronic states (after the emission scattering onset, see pink lines [] in Figs. 4e for low doping and 4f for high doping) whose lifetimes have much weaker temperature dependence. This can be seen in the blue region of Fig. 4d, where the lifetimes of the post-emission electronic states show dramatically reduced temperature dependence (between –) compared to the lower energy pre-emission states (Fig. 4c, –).
Although thus far we have restricted our analysis to polar optical phonon scattering, the same factors will also determine the temperature dependence of systems limited by optical deformation potential scattering, albeit with some caveats. The major complicating factor is that in polar materials, scattering occurs only by polar longitudinal-optical modes near the zone center. Accordingly, often only a few phonon frequencies control the entire scattering, and even just one frequency in the simplest of polar systems. However, in optical deformation potential scattering, both longitudinal and transverse modes across the full Brillouin zone can scatter carriers, leading to a wide spectrum of phonon frequencies that contribute to scattering. Regardless, the overall trends discussed above are expected to hold for any systems dominated by electron-phonon interactions.
With this in mind, we return to the remaining systems previously highlighted, -\ceSrTiO3 and -Si. In each case, the average phonon frequency (polar frequency for \ceSrTiO3) determines the temperature dependence of mobility. In SrTiO3, the mobility is limited by a combination of polar optical and soft-ferroelectric phonons and polaronic effects [43]. The mobility dependence of is one of the most negative in our dataset, and is dominated by two optical phonons, with frequencies and [43]. Using the arithmetic mean of these phonon frequencies () leads to a mobility dependence around as demonstrated in Fig. 3a, very close to the experimental value. The mobility of -type Si exhibits a temperature dependence of and is dominated by optical deformation scattering from phonons with frequencies between [53]. Using the average of the optical mode frequencies () gives rise to an expected mobility dependence of , as illustrated in Fig. 3a. This is in excellent agreement with the experimental trend even though Si is not limited by polar optical phonon scattering, but rather deformation potential scattering. Accordingly, the temperature dependence of mobility in GaAs, Si, and \ceSrTiO3 is controlled almost entirely by the phonon frequencies irrespective of the dominant scattering mechanisms.
It is important to stress that the temperature dependence of mobility also depends on features in the electronic band structure. For example, although GaAs possesses a single isotropic band, it is not perfectly parabolic away from the band edge. By increasing the non-linearity in a single isotropic band quantified by the Kane parameter (), the temperature-dependence of mobility can vary from in the fully parabolic case () to (polar optical limited) and (acoustic deformation limited) in the most non-parabolic band structure explored (). Accordingly, even a simple band structure feature in a single band (without considering degeneracy or multiple band pockets) is capable of modulating the temperature trend of mobility by up to (Fig. 5b). Additionally, the -dependence of polar optical phonon limited and acoustic deformation potential limited mobility is similar (within between the independent mechanisms) across the full range of values, further highlighting the difficulty of assigning a particular scattering mechanism based on the -dependence of mobility alone. In our calculations, all scattering parameters are fixed except that the degree of parabolicity is modulated using the Kane parameter (see Section S3 of the Supplementary Material).
We also find that band anisotropy has a small but non-negligible effect on the temperature dependence (Fig. 5c and d), with the mobility dependence varying by (polar optical) and (acoustic deformation) as anisotropy increases (details on the generation and calculation of anisotropic band structures are given in Section S3 of the Supplementary Material). In Section S3 of the Supplementary Material, we demonstrate that ionized impurity scattering exhibits a similar modulation with non-parabolicity and that these effects also hold at larger doping and temperature regimes and will still play a crucial role in determining the temperature dependence at typical thermoelectric doping levels.
In summary, the following trends are expected to hold in any systems dominated by electron-phonon scattering:
-
Observation 1
Compounds containing lighter elements should generally exhibit stronger (more negative) temperature dependence due to high (as demonstrated in Fig. 3b).
-
Observation 2
The temperature dependence of mobility should weaken (become less negative) at higher temperatures.
-
Observation 3
The temperature dependence of mobility should weaken with doping (barring heavily degenerate doping).
-
Observation 4
Band structure features can modulate the temperature dependence from the idealised value (typically making it more negative) by up to . E.g., from to for the case of non-parabolic bands with polar optical phonon scattering.
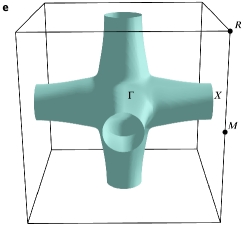
The wide range in the temperature dependence of mobility due to phonon frequency and band structure features clearly indicates that a particular scattering mechanism must not be associated with a nominal -dependence, even at high-doping, high-temperature conditions where it is usually deemed safer to do so. This is highlighted in Fig. 6a, where we present the temperature dependence of 23,000 materials calculated high-throughput using the amset package [27] at both - and -type doping conditions (). The transport dataset was generated using band structures obtained from density functional theory and materials parameters (deformation potentials, elastic and dielectric constants, and phonon frequencies) from machine learning models. As our goal is to simulate a realistic distribution of materials parameters rather than the exact material parameters for specific materials, strict accuracy in the inputs is not essential. Regardless, in Section S5 the Supplementary Material, we validate our machine learning models (generated using automatminer[54]) using cross validation studies. One benefit of amset is that the overall scattering rate can be separated into the contributions from polar optical phonons, acoustic deformation potentials, and ionized impurities, and the mobility calculated separately for each scattering mechanism. We note that amset does not yet implement optical deformation potential scattering, but as previously mentioned, its effect is likely intermediate between polar-optical scattering (owing to inelasticity) and acoustic deformation potential scattering (owing to the participation of phonons across the entire Brillouin zone). Further details on the generation of the amset dataset is provided in Section S5 of the Supplementary Material.
The average -dependence of mobility considering all scattering mechanisms (where the overall scattering rate for a given material is obtained from Matthiessen’s rule as and the subscripts refer to polar optical phonon [PO], acoustic deformation potential [AD] and ionized impurity [II] scattering) is found to be at low temperature () and at high temperature (). When considering only polar optical scattering at low temperatures, the average -dependence is approximately and the broad interquartile range (containing the middle of the distribution) from to highlights the significant variation across materials for a single scattering type. The distribution of polar optical scattering overlaps considerably with acoustic deformation potential scattering, which has an average of but a tighter interquartile range from to . The average temperature dependence of ionized impurity scattering limited mobility is found to be . This weakly positive temperature dependence (indicating that mobility weakly increases with temperature, Fig. 6a) can be rationalized by considering that at high temperatures the Thomas–Fermi screening length will increase and shield more electronic states from charge centers. In the high-temperature regime, the average polar optical phonon -dependence is reduced to and the interquartile range narrows to between –. This is in agreement with our previous analysis that predicted weaker temperature dependence at higher temperatures. In this regime, acoustic deformation potential scattering limited mobility has an average trend of which is again close to that from polar optical phonon scattering. In Section S6 of the Supplementary Material, we demonstrate that the same behaviour is also observed at a higher doping concentrations. The broad overlap of polar optical and acoustic deformation potential distributions, even at high temperatures, and nearly indistinguishable mean trends, indicate that identifying the dominant scattering mechanism through the temperature dependence of mobility alone will be highly unreliable. This corroborates the trends of the independent but considerably smaller DFPT+Wannier dataset and highlights the pitfalls of using mobility trends devised for idealised scattering in parabolic band structures. In contrast, we note that impurity scattering is distinguishable from the phonon-mediated scattering mechanisms due to its positive temperature dependence.
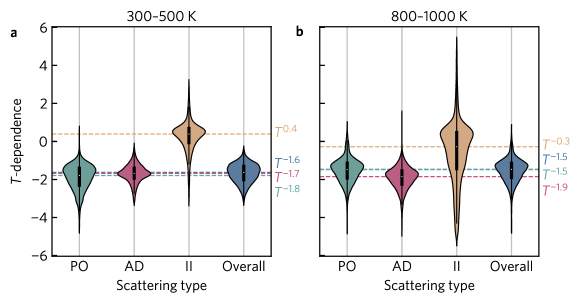
In Fig. 7a, we assess whether our prediction that larger polar optical phonon frequencies correspond to stronger -dependence of mobility holds across the amset dataset. The results are illustrated in the form of a heatmap, where darker colours indicate greater density of materials. There is a clear inverse relationship between polar phonon frequency and the -dependence of mobility, as confirmed by the correlation coefficient of 0.70. Accordingly, the behaviour of the -dependence of mobility with polar optical phonon frequency is observed across a wide range of band structure types beyond the simple parabolic case discussed previously. We note that the distribution of -dependencies broadly agrees with the single parabolic band model presented in Fig. 3a. The parabolic band results provides an upper bound for the temperature dependencies seen from our dataset (we outline a potential origin of this behaviour in Section S7 of the Supplementary Material). For example, a polar optical frequency of corresponds to a in a parabolic band structure, whereas the same phonon frequency gives an average dependence of in the full amset dataset. There is also considerable width to the distribution at a single value of . For example, at = the -dependence varies from to depending on the material. In Section S8 of the Supplementary Material we investigate whether common band structure features (such as band edge degeneracy, effective mass, Fermi surface complexity factor [55], and band width) can explain the additional variation in temperature dependence at a particular . We find that no single feature or combination of features can explain the additional variation and therefore posit that the -dependence must be controlled by a complex interplay between band structure effects, wave function overlaps, and the behaviour of the scattering rates across the band structure.
Noticeably, we find that the average atomic mass exhibits a reasonable correlation () to the –dependence of mobility limited by polar optical phonon scattering (Fig. 7b). This arises due to the relationship between average atomic mass and polar phonon frequency revealed in Fig. 3b. Accordingly, the composition alone can be used as as a rough guide to the temperature dependence of mobility, without needing to know the phonon frequencies (which typically requires first principles calculations or neutron diffraction measurements).
Lastly, we briefly discuss the potential consequences of inferring the dominant scattering mechanism from the temperature dependence of experimental mobility alone. Most commonly, the major scattering mechanism is used to optimize and understand thermoelectric materials. For example, a -dependence of is often assumed to indicate deformation potential scattering and has led many researchers to fit oversized deformation potentials in an effort to reproduce the experimental mobility. Egregious examples include SnSe [56], PbTe [57], and \ceBiCuSeO [58], in which the mobility dependence of has lead to enormous fitted deformation potentials of (SnSe and BiCuSeO) and (PbTe), over larger than those calculated from density functional theory [27, 59]. Rather, first-principles scattering rate calculations recently revealed that polar optical phonon scattering is approximately an order of magnitude stronger than deformation potential scattering in each of these materials and dictates both the magnitude and temperature dependence of mobility [25, 26, 59]. The dominant scattering mechanism also controls the optimal doping and temperature necessary to maximise the thermoelectric figure of merit [18]. Accordingly, incorrect identification of the primary scattering processes can stymie efforts to engineer greater performance.
In conclusion, we demonstrated that the temperature dependence of mobility does not correlate with the dominant scattering mechanism as previously assumed. Instead, the phonon frequencies are the major factor that control the temperature dependence. For systems dominated by electron-phonon coupling, we expect the following trends to hold: i) materials with lighter elements should exhibit stronger (more negative) temperature dependence due to their larger phonon frequencies; ii) the temperature dependence of mobility should weaken at higher temperatures and larger doping concentrations; and iii) band structure features such as non-parabolicity can cause a reasonable modulation of the temperature dependence. These trends hold across simple parabolic band structures and a dataset of 23,000 materials covering a diverse range of band structure and scattering properties. Our work conclusively demonstrates that a temperature dependence of is not a reliable indicator of deformation potential scattering and assuming as such can lead to a flawed understanding of electron transport and optimal thermoelectric performance.
Acknowledgements
The authors thank Xin Chen for helpful discussions. The authors thank Hao Zhang for graciously sharing additional supplementary data files. This work was funded and intellectually led by the U.S. Department of Energy (DOE) Basic Energy Sciences (BES) program — the Materials Project — under grant no. KC23MP. This research used resources of the National Energy Research Scientific Computing Center, which is supported by the Office of Science of the U.S. Department of Energy under Contract no. DEAC02-05CH11231. Lawrence Berkeley National Laboratory is funded by the DOE under award DE-AC02- 05CH11231.
References
- Wilson [1931a] A. H. Wilson, The theory of electronic semi-conductors, Proc. R. Soc. Lond. A 133, 458 (1931a).
- Wilson [1931b] Wilson, The theory of electronic semi-conductors. - II, Proc. R. Soc. Lond. A 134, 277 (1931b).
- Sommerfeld and Bethe [1933] A. Sommerfeld and H. Bethe, Elektronentheorie der Metalle, in Aufbau Der Zusammenhängenden Materie (Springer Berlin Heidelberg, Berlin, Heidelberg, 1933) pp. 333–622.
- Debye and Conwell [1954] P. P. Debye and E. M. Conwell, Electrical Properties of N-Type Germanium, Phys. Rev. 93, 693 (1954).
- Pei et al. [2012] Y. Pei, H. Wang, and G. J. Snyder, Band Engineering of Thermoelectric Materials, Adv. Mater. 24, 6125 (2012).
- Lee et al. [2014] Y. Lee, S.-H. Lo, C. Chen, H. Sun, D.-Y. Chung, T. C. Chasapis, C. Uher, V. P. Dravid, and M. G. Kanatzidis, Contrasting role of antimony and bismuth dopants on the thermoelectric performance of lead selenide, Nat. Commun. 5, 3640 (2014).
- Plirdpring et al. [2012] T. Plirdpring, K. Kurosaki, A. Kosuga, T. Day, S. Firdosy, V. Ravi, G. J. Snyder, A. Harnwunggmoung, T. Sugahara, Y. Ohishi, H. Muta, and S. Yamanaka, Chalcopyrite CuGaTe2: A High-Efficiency Bulk Thermoelectric Material, Adv. Mater. 24, 3622 (2012).
- Zhang et al. [2016] J. Zhang, L. Song, G. K. H. Madsen, K. F. F. Fischer, W. Zhang, X. Shi, and B. B. Iversen, Designing high-performance layered thermoelectric materials through orbital engineering, Nat. Commun. 7, 10892 (2016).
- Ren et al. [2020] Q. Ren, C. Fu, Q. Qiu, S. Dai, Z. Liu, T. Masuda, S. Asai, M. Hagihala, S. Lee, S. Torri, T. Kamiyama, L. He, X. Tong, C. Felser, D. J. Singh, T. Zhu, J. Yang, and J. Ma, Establishing the carrier scattering phase diagram for ZrNiSn-based half-Heusler thermoelectric materials, Nat. Commun. 11, 3142 (2020).
- Mante et al. [2017] P.-A. Mante, C. C. Stoumpos, M. G. Kanatzidis, and A. Yartsev, Electron–acoustic phonon coupling in single crystal CH3NH3PbI3 perovskites revealed by coherent acoustic phonons, Nat. Commun. 8, 14398 (2017).
- Liu et al. [2018] Z. Liu, J. Mao, J. Sui, and Z. Ren, High thermoelectric performance of -MgAgSb for power generation, Energy Environ. Sci. 11, 23 (2018).
- Toberer et al. [2010] E. S. Toberer, A. F. May, B. C. Melot, E. Flage-Larsen, and G. J. Snyder, Electronic structure and transport in thermoelectric compounds AZn2Sb2 (A = Sr, Ca, Yb, Eu), Dalton Trans. 39, 1046 (2010).
- Bardeen and Shockley [1950] J. Bardeen and W. Shockley, Deformation potentials and mobilities in non-polar crystals, Phys. Rev. 80, 72 (1950).
- Conwell [1967] E. M. Conwell, High Field Transport in Semiconductors (Academic press Inc., London New York, 1967) p. 153.
- Rode [1975] D. Rode, Chapter 1 Low-Field Electron Transport, in Semiconductors and Semimetals, Vol. 10 (Elsevier, 1975) pp. 1–89.
- Ehrenreich [1957] H. Ehrenreich, Electron scattering in InSb, J. Phys. Chem. Solids 2, 131 (1957).
- Ehrenreich [1959] H. Ehrenreich, Screening effects in polar semiconductors, J. Phys. Chem. Solids 8, 130 (1959).
- Pöhls et al. [2021] J.-H. Pöhls, S. Chanakian, J. Park, A. M. Ganose, A. Dunn, N. Friesen, A. Bhattacharya, B. Hogan, S. Bux, A. Jain, A. Mar, and A. Zevalkink, Experimental validation of high thermoelectric performance in RECuZnP2 predicted by high-throughput DFT calculations, Mater. Horiz. 8, 209 (2021).
- Krishnamurthy et al. [1985] S. Krishnamurthy, A. Sher, and A.-B. Chen, Generalized Brooks’ formula and the electron mobility in SixGe1-x alloys, Appl. Phys. Lett. 47, 160 (1985).
- Rode [1971] D. L. Rode, Electron Transport in InSb, InAs, and InP, Phys. Rev. B 3, 3287 (1971).
- Yu and Cardona [2010] P. Y. Yu and M. Cardona, Fundamentals of Semiconductors, Graduate Texts in Physics (Springer Berlin Heidelberg, Berlin, Heidelberg, 2010).
- Poncé et al. [2018] S. Poncé, E. R. Margine, and F. Giustino, Towards predictive many-body calculations of phonon-limited carrier mobilities in semiconductors, Phys. Rev. B 97, 121201 (2018).
- Poncé et al. [2020] S. Poncé, W. Li, S. Reichardt, and F. Giustino, First-principles calculations of charge carrier mobility and conductivity in bulk semiconductors and two-dimensional materials, Rep. Prog. Phys. 83, 036501 (2020).
- Lee et al. [2020] N.-E. Lee, J.-J. Zhou, H.-Y. Chen, and M. Bernardi, Ab initio electron-two-phonon scattering in GaAs from next-to-leading order perturbation theory, Nat. Commun. 11, 1607 (2020).
- Ma et al. [2018] J. Ma, Y. Chen, and W. Li, Intrinsic phonon-limited charge carrier mobilities in thermoelectric SnSe, Phys. Rev. B 97, 205207 (2018).
- Cao et al. [2018] J. Cao, J. D. Querales-Flores, A. R. Murphy, S. Fahy, and I. Savić, Dominant electron-phonon scattering mechanisms in n-type PbTe from first principles, Phys. Rev. B 98, 205202 (2018).
- Ganose et al. [2021a] A. M. Ganose, J. Park, A. Faghaninia, R. Woods-Robinson, K. A. Persson, and A. Jain, Efficient calculation of carrier scattering rates from first principles, Nat. Commun. 12, 2222 (2021a).
- Bushick et al. [2020] K. Bushick, K. A. Mengle, S. Chae, and E. Kioupakis, Electron and hole mobility of rutile GeO2 from first principles: An ultrawide-bandgap semiconductor for power electronics, Appl. Phys. Lett. 117, 182104 (2020).
- Ding et al. [2021] J. Ding, C. Liu, L. Xi, J. Xi, and J. Yang, Thermoelectric transport properties in chalcogenides ZnX (X=S, Se): From the role of electron-phonon couplings, J. Materiomics 7, 310 (2021).
- Ge et al. [2020] Y. Ge, W. Wan, Y. Ren, F. Li, and Y. Liu, Phonon-limited electronic transport of two-dimensional ultrawide bandgap material h-BeO, Appl. Phys. Lett. 117, 123101 (2020).
- Huang et al. [2020] Q. Huang, J. Ma, D. Xu, R. Hu, and X. Luo, High thermoelectric figure of merit in monolayer Tl2O from first principles, J. Appl. Phys. 128, 185111 (2020).
- Li et al. [2019] W. Li, S. Poncé, and F. Giustino, Dimensional Crossover in the Carrier Mobility of Two-Dimensional Semiconductors: The Case of InSe, Nano Lett. 19, 1774 (2019).
- Ma et al. [2020a] J. Ma, F. Meng, D. Xu, R. Hu, and X. Luo, Electron mobility and mode analysis of scattering for -Ga2O3 from first principles, J. Phys. Condens. Matter 32, 465704 (2020a).
- Ma et al. [2020b] J. Ma, F. Meng, J. He, Y. Jia, and W. Li, Strain-Induced Ultrahigh Electron Mobility and Thermoelectric Figure of Merit in Monolayer -Te, ACS Appl. Mater. Interfaces 12, 43901 (2020b).
- Meng et al. [2019] F. Meng, J. Ma, J. He, and W. Li, Phonon-limited carrier mobility and temperature-dependent scattering mechanism of 3C-SiC from first principles, Phys. Rev. B 99, 045201 (2019).
- Park et al. [2019] J. Park, Y. Xia, and V. Ozoliņš, High Thermoelectric Power Factor and Efficiency from a Highly Dispersive Band in Ba2BiAu, Phys. Rev. Applied 11, 014058 (2019).
- Park et al. [2020] J. Park, Y. Xia, A. M. Ganose, A. Jain, and V. Ozoliņš, High Thermoelectric Performance and Defect Energetics of Multipocketed Full Heusler Compounds, Phys. Rev. Applied 14, 024064 (2020).
- Poncé et al. [2019] S. Poncé, M. Schlipf, and F. Giustino, Origin of Low Carrier Mobilities in Halide Perovskites, ACS Energy Lett. 4, 456 (2019).
- Su et al. [2020] Y. Su, S. Cao, L.-B. Shi, and P. Qian, Phonon-limited mobility for novel two-dimensional semiconductors of BC3 and C3N: First-principles calculation, Appl. Surf. Sci. 531, 147341 (2020).
- Wu et al. [2020] Y. Wu, B. Hou, Y. Chen, J. Cao, C. Ma, H. Shao, Y. Zhang, Z. Lu, H. Zhu, Z. Fang, R. Zhang, and H. Zhang, Towards accurate predictions of carrier mobilities and thermoelectric performances in 2D materials (2020), arXiv:2010.05219 [cond-mat.mtrl-sci] .
- Zhao et al. [2018] Y. Zhao, Z. Dai, C. Zhang, C. Lian, S. Zeng, G. Li, S. Meng, and J. Ni, Intrinsic electronic transport and thermoelectric power factor in n-type doped monolayer MoS2, New J. Phys. 20, 043009 (2018).
- Zhao et al. [2020a] Y. Zhao, C. Lian, S. Zeng, Z. Dai, S. Meng, and J. Ni, Anomalous electronic and thermoelectric transport properties in cubic Rb3AuO antiperovskite, Phys. Rev. B 102, 094314 (2020a).
- Zhou and Bernardi [2019] J.-J. Zhou and M. Bernardi, Predicting charge transport in the presence of polarons: The beyond-quasiparticle regime in SrTiO3, Phys. Rev. Research 1, 033138 (2019).
- Hicks and Manley [1969] H. Hicks and D. Manley, High purity GaAs by liquid phase epitaxy, Solid State Commun. 7, 1463 (1969).
- Rode and Knight [1971] D. L. Rode and S. Knight, Electron Transport in GaAs, Phys. Rev. B 3, 2534 (1971).
- Wolfe et al. [1970] C. M. Wolfe, G. E. Stillman, and W. T. Lindley, Electron Mobility in High-Purity GaAs, J. Appl. Phys. 41, 3088 (1970).
- Logan and Peters [1960] R. A. Logan and A. J. Peters, Impurity Effects upon Mobility in Silicon, J. Appl. Phys 31, 122 (1960).
- Ludwig and Watters [1956] G. W. Ludwig and R. L. Watters, Drift and Conductivity Mobility in Silicon, Phys. Rev. 101, 1699 (1956).
- Morin and Maita [1954] F. J. Morin and J. P. Maita, Electrical Properties of Silicon Containing Arsenic and Boron, Phys. Rev. 96, 28 (1954).
- Jacoboni et al. [1977] C. Jacoboni, C. Canali, G. Ottaviani, and A. Alberigi Quaranta, A review of some charge transport properties of silicon, Solid-State Electron. 20, 77 (1977).
- Cain et al. [2013] T. A. Cain, A. P. Kajdos, and S. Stemmer, La-doped SrTiO3 films with large cryogenic thermoelectric power factors, Appl. Phys. Lett. 102, 182101 (2013).
- Ganose et al. [2021b] A. Ganose, A. Searle, A. Jain, and S. Griffin, IFermi: A python library for Fermi surface generation and analysis, JOSS 6, 3089 (2021b).
- Li et al. [2021] Z. Li, P. Graziosi, and N. Neophytou, Deformation potential extraction and mobility calculations in silicon from first principles (2021), arXiv:2104.08998 [cond-mat.mtrl-sci] .
- Dunn et al. [2020] A. Dunn, Q. Wang, A. Ganose, D. Dopp, and A. Jain, Benchmarking materials property prediction methods: The Matbench test set and Automatminer reference algorithm, npj Comput Mater 6, 138 (2020).
- Gibbs et al. [2017] Z. M. Gibbs, F. Ricci, G. Li, H. Zhu, K. Persson, G. Ceder, G. Hautier, A. Jain, and G. J. Snyder, Effective mass and Fermi surface complexity factor from ab initio band structure calculations, Npj Comput. Mater. 3, 1 (2017).
- Chen et al. [2014] C.-L. Chen, H. Wang, Y.-Y. Chen, T. Day, and G. J. Snyder, Thermoelectric properties of p-type polycrystalline SnSe doped with Ag, J. Mater. Chem. A 2, 11171 (2014).
- Wang et al. [2013] H. Wang, E. Schechtel, Y. Pei, and G. J. Snyder, High Thermoelectric Efficiency of n-type PbS, Adv. Energy Mater. 3, 488 (2013).
- Fan et al. [2017] D. D. Fan, H. J. Liu, L. Cheng, J. Zhang, P. H. Jiang, J. Wei, J. H. Liang, and J. Shi, Understanding the electronic and phonon transport properties of a thermoelectric material BiCuSeO: A first-principles study, Phys. Chem. Chem. Phys. 19, 12913 (2017).
- Zhao et al. [2020b] T. Zhao, Q. D. Gibson, L. M. Daniels, B. Slater, and F. Corà, Prediction of higher thermoelectric performance in BiCuSeO by weakening electron–polar optical phonon scattering, J. Mater. Chem. A 8, 25245 (2020b).