Extraction of Pion Transverse Momentum Distributions from Drell-Yan data
The MAP Collaboration111The MAP acronym stands for “Multi-dimensional Analyses of Partonic distributions”. It refers to a collaboration aimed at studying the three-dimensional structure of hadrons. The public codes released by the collaboration are available at https://github.com/MapCollaboration.
Abstract
We map the distribution of unpolarized quarks inside a unpolarized pion as a function of the quark’s transverse momentum, encoded in unpolarized Transverse Momentum Distributions (TMDs). We extract the pion TMDs from available data of unpolarized pion-nucleus Drell–Yan processes, where the cross section is differential in the lepton-pair transverse momentum. In the cross section, pion TMDs are convoluted with nucleon TMDs that we consistently take from our previous studies. We obtain a fairly good agreement with data. We present also predictions for pion-nucleus scattering that is being measured by the COMPASS Collaboration.
I Introduction
The pion is the simplest of all hadrons and together with the nucleon constitutes one of the most fundamental entities in the visible Universe. In the Standard Model, both particles are built as bound states of the quark and gluon degrees of freedom of Quantum ChromoDynamics (QCD). However, in this context the pion plays a unique role since it is the Goldstone boson of chiral symmetry breaking. Therefore, it is extremely important to investigate its internal structure and understand how the latter is responsible of the macroscopic differences between the bound state of a pion and of a nucleon (see, e.g., Ref. Horn and Roberts (2016) for a review).
The internal structure of the pion can be described in terms of Parton Distribution Functions (PDFs). Starting from the 1990s, PDFs have been extracted from data in various papers Gluck et al. (1992); Sutton et al. (1992); Gluck et al. (1998, 1999); Wijesooriya et al. (2005); Aicher et al. (2010); Barry et al. (2018); Novikov et al. (2020); Cao et al. (2021); Barry et al. (2021); Bourrely et al. (2022). In spite of this extensive literature, the structure of the pion is known to a much less extent than that of the proton, due to the scarcity of data on high-energy scattering processes involving pions.
While PDFs describe the distribution of quarks and gluons as a function of only their momentum component longitudinal to the parent hadron, Transverse Momentum Distributions (TMDs) describe the distribution in three-dimensional momentum space. If the knowledge of the one-dimensional structure of the pion is limited, almost nothing is known about its three-dimensional structure. Model calculations of pion TMDs have been discussed in Refs. Pasquini and Schweitzer (2014); Noguera and Scopetta (2015); Lorcé et al. (2016); Bacchetta et al. (2017a); Ceccopieri et al. (2018); Ahmady et al. (2019); Kaur and Dahiya (2021); Shi et al. (2020).
The extraction of TMDs from data is based on TMD factorization theorems and is more challenging than that of collinear PDFs. For proton TMDs, factorization theorems have been proven for Semi-Inclusive Deep-Inelastic Scattering (SIDIS), for Drell-Yan (DY) lepton-pair production in hadronic collisions, and for semi-inclusive electron-positron annihilations (see Ref. Collins (2013) and references therein). Recently, very accurate studies of proton unpolarized TMDs have been released Bacchetta et al. (2017b); Scimemi and Vladimirov (2018); Bertone et al. (2019); Scimemi and Vladimirov (2020); Bacchetta et al. (2020); Bury et al. (2022); Bacchetta et al. (2022), some of which are based on a global analysis of such processes. For pion TMDs, data are available only for the DY process and only two analyses have been published Wang et al. (2017); Vladimirov (2019).
In this paper, we present an extraction of unpolarized pion quark TMDs by analyzing for the first time the whole set of available data for the DY lepton-pair production in -nucleus collisions, obtained from the E615 Stirling and Whalley (1993) and E537 Anassontzis et al. (1988) experiments. The cross section differential in the lepton-pair transverse momentum can be written as a convolution of a unpolarized proton TMD and a unpolarized pion TMD. For the proton TMD, we use the result recently obtained by the MAP collaboration Bacchetta et al. (2022) and we extract the pion TMD from data using the same formalism. With respect to Ref. Vladimirov (2019), we use more data and different prescriptions for the implementation of TMD evolution. With respect to Ref. Wang et al. (2017), we use more data, a higher theoretical accuracy, a up-to-date extraction of the proton TMDs, and we consistently use the same Collins–Soper kernel for proton and pion TMDs.
II Formalism
In the DY process
| (1) |
the collision between two hadrons and with four-momenta and , respectively, and center-of-mass energy squared , produces a neutral vector boson with four-momentum and large invariant mass . The vector boson eventually decays into a lepton and an antilepton with four-momenta constrained by momentum conservation, . The cross section of this process can be written in terms of two structure functions , . Being the mass of the incoming hadrons and the transverse component of the vector boson momentum, in the kinematic region where and the structure function is suppressed. Therefore, the cross section can be expressed as
| (2) |
where is the electromagnetic coupling, is the pseudorapidity of the vector boson, , is the hard factor and is the Fourier transform of the unpolarized TMD PDF for flavor ,222For the definition of the Fourier transform see Ref. Bacchetta et al. (2022). which depends on the renormalization and rapidity scales and , respectively. The summation over in Eq. (2) runs over the active quarks and antiquarks at the hard scale , with the corresponding electroweak charges Bacchetta et al. (2022).
The dependence of on the scales and arises from the removal of the ultraviolet and rapidity divergences in its operator definition. In the renormalization scheme, it turns out that the choice of the initial scale (with the Euler constant) greatly simplifies the expression of Bacchetta et al. (2020). However, in order to prevent from becoming larger than at small and/or hitting the Landau pole at large it is necessary to introduce an ad-hoc prescription to avoid these limits. Then, the TMD PDF can be simply rewritten as Bacchetta et al. (2020)
| (3) | |||||
which effectively defines the nonperturbative part of the TMD PDF.
For the collision of a pion and a nucleus (that in first approximation is described as a collection of free nucleons), the cross section of Eq. (2) involves the TMD PDFs and of a quark in the proton and in the pion, respectively. As for the proton, we use for the recent global extraction of the MAP Collaboration Bacchetta et al. (2022) at next-to-next-to-next-leading-logarithm (N3LL) accuracy, adopting the same prescription and the same parametrization of the nonperturbative part . As for the pion, for we consistently retain the same prescription and the same nonperturbative component of the Collins–Soper evolution kernel as in Ref. Bacchetta et al. (2022), but we use the following expression for :
| (4) |
where is an arbitrary starting scale that we choose to be 1 GeV, and is a parameter taken from Ref. Bacchetta et al. (2022), as mentioned above. The -dependence of the width is given by
| (5) |
with . In conclusion, we have a total of 3 free parameters to fit to data: , and .
III Data selection
In this Section we describe the experimental data included in our analysis. We consider data from the two DY experiments (E615 Stirling and Whalley (1993) and E537 Anassontzis et al. (1988)) that used beams impinging on tungsten targets. The coverage of these data in the - plane is shown in Fig. 1.

Since our study is based on TMD factorization, which is applicable only in the kinematical region , we apply to the data sets the following cut:
| (6) |
This cut is slightly different from the analogous one used in the proton TMD extraction: since the availability of data is limited, this cut is a good compromise between the necessity of including more data and the necessity of staying within the limits of applicability of TMD factorization.
In order to avoid the kinematical region of invariant masses around the resonance, we also exclude those bins of the DY experiment E615 for which . The numbers of experimental data before and after the application of these cuts are reported in Table 1, together with other useful details regarding the experimental processes, like the definition of the observables and the values of and .
| Experiment | Observable | [GeV] | range [GeV] | range | |||
| E615 | 155 | 74 | 21.8 | 4.05 - 13.05 | 8 | 0.0 - 1.0 | |
| E537 | 150 | 64 | 15.3 | 4.0 - 9.0 | 10 | -0.1 - 1.0 |
Each of the considered data sets has systematic and statistical uncertainties. The statistical uncertainties are quite large for both E537 (8%) and E615 (16%). We choose to treat them as uncorrelated, while we treat the systematic uncertainties as fully correlated. For small , the TMD PDFs can be matched onto the related collinear PDFs. Therefore, we must consider the systematic uncertainties induced by the choice of the collinear PDFs. Consistently with Ref. Bacchetta et al. (2022), for the proton TMD PDF we choose the PDF parametrization MMHT2014 Harland-Lang et al. (2015); for the pion we use the xFitter20 one Novikov et al. (2020). We compute the PDF uncertainties by using the Hessian method, and we consider 80% of them as fully correlated while the remaining 60% as uncorrelated, as already done in Ref. Bacchetta et al. (2022).
IV Results
In this section, we present the results for the extraction of the unpolarized quark TMD PDFs in a pion from a fit of all the existing DY data involving pions (see Sec. III). Since collinear sets for pion PDFs are presently available only at next-to-leading-order (NLO) accuracy, the TMD PDFs can be extracted at an accuracy that we defined as N3LL- (similarly to Ref. Bacchetta et al. (2022)), i.e., all ingredients are at N3LL accuracy, apart from the evolution of the collinear PDFs.
The error analysis is performed with the so-called bootstrap method, by fitting an ensemble of 200 replicas of experimental data. For consistency with Ref. Bacchetta et al. (2022), we used the proton TMD PDFs extracted in the fit of Ref. Bacchetta et al. (2022) and we associate the –th replica of quark TMD PDFs in the pion to the same replica in the set of quark TMD PDFs in the proton.
IV.1 Fit quality
When using the bootstrap method, the full statistical information is contained in the whole set of 200 replicas of the extracted TMD PDFs. Nevertheless, we choose as the most representative indicator of the quality of our fit the value of the best fit to the unfluctuated data, (also referred as the central replica).
It is possible to decompose the value of as the sum of two different contributions Bacchetta et al. (2022),
| (7) |
where is the contribution of uncorrelated uncertainties and the penalty is related to correlated uncertainties.
The breakup of into its components, normalized to the number of data points surviving the kinematical cuts (), is reported in Tab. 2 for the two experimental sets included in this analysis.
| Experiments | ||||
| E537 | 64 | 1.00 | 0.57 | 1.57 |
| E615 | 74 | 0.31 | 1.22 | 1.53 |
| Total | 138 | 0.63 | 0.92 | 1.55 |
We note that the global reported in Tab. 2 suggests that the comparison between data and theory is strongly affected by normalization errors. In fact, the partial values of indicate that the description of the shape of the experimental data is very good (almost perfect for the E615 data set), but there is a systematic disagreement between data and theory in the normalization, which induces high values in the penalty . Since theoretical errors related to the collinear PDFs uncertainty of both pion and proton are not larger than 5-8, we think that such a large value of the penalty is given by the correlated systematic uncertainties of the experimental data sets (). This conclusion is compatible with the findings of Ref. Vladimirov (2019), where the same issue was remarked for the E615 dataset. Since low-energy fixed-target DY data are properly described in global fits of unpolarized proton TMDs (see, e.g., Refs. Bacchetta et al. (2022, 2020); Bacchetta et al. (2017b); Bertone et al. (2019)), this normalization issue does not seem to be related to the fact that E615 and E537 experiments were done at low invariant masses . In Ref. Vladimirov (2019), it was pointed out that the observed issue could be related to a wrong normalization of the experimental data.
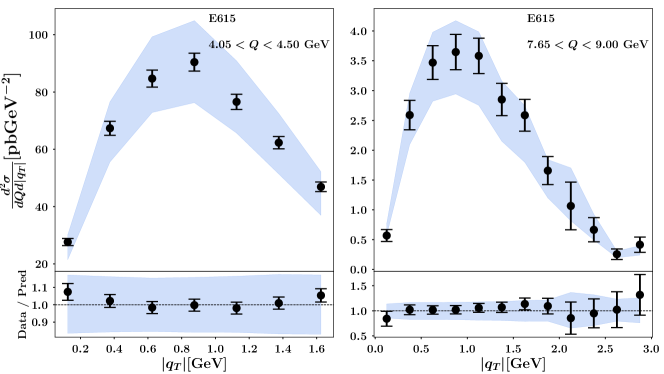
In Fig. 2, we show the comparison between the result of our fit (colored band) and experimental data (black points) for a selection of bins of the E615 data set. In the upper panels, the differential DY cross section is shown as a function of the transverse momentum of the virtual vector boson, in the lower panels the ratio between theory and data is displayed. The uncertainty bands correspond to the 68 Confidence Level (CL), built by excluding the largest and smallest 16 of the replicas. As mentioned above, we note that the shape of the experimental data is very well reproduced. The large error band reflects the large correlated systematic errors of the considered data set.

In Fig. 3, we show the same kind of comparison as in the previous figure but for the E537 data set. Again, in the upper panels we compare the uncertainty bands at 68% CL from our fit with experimental data (black points) for the DY cross section as function of for two different bins; the lower panels contain the ratio between fit results and data.
The overall quality of the fit of E537 data is slightly worse than the E615 one. The very similar value of in this case is the result of different partial contributions. The component due to uncorrelated uncertainties is three times larger than in the E615 case and gives the largest contribution to . This is reflected in Fig. 3 where the data points at low are not well described by our fit. This discrepancy could be related to the lack of flexibility of our parametrization of the nonperturbative part of the quark TMD PDF in the pion. We explored different models for in Eq. (4), but with no significant change in the final outcome. On the other side, the contribution of the penalty is less than half of the E615 one. Indeed, the correlated systematic uncertainties of the E537 data set are much smaller and signal that the normalization problem between theory and data is less strong. This is reflected in much smaller uncertainty bands of the fit results, as shown in Fig. 3.
We also explored the behaviour of our fit when reducing the accuracy of the theoretical description. As expected, the worsens (at N2LL, , at NLL, ) but it shows a nice convergence to the N3LL result in Tab. 2, when reading in reverse order. Moreover, the best values of free parameters remain always within the uncertainty bands, indicating that our fit results are stable.
IV.2 TMD distributions
We now discuss the quark TMD PDFs in the pion extracted from our fit at N3LL-. In Tab. 3, we list the resulting average values and standard deviations of the three fitting parameters that describe the arbitrary nonperturbative part of the TMD PDF in Eqs. (4) and (5). The errors are very large and the parameters are not very well constrained. As mentioned above, the same quality of results is obtained by testing different models of nonperturbative parametrizations. Hence, we conclude that the current set of experimental data is not very sensitive to these degrees of freedom and more data are needed to better constrain them.
| Parameter | Average |
| 0.47 0.12 | |
| 4.50 2.25 | |
| 4.40 1.34 |
In agreement with Ref. Vladimirov (2019), we also find that there are strong correlations among the three different parameters. This feature points again toward the need for new experimental data to better constrain the quark TMDs in the pion.
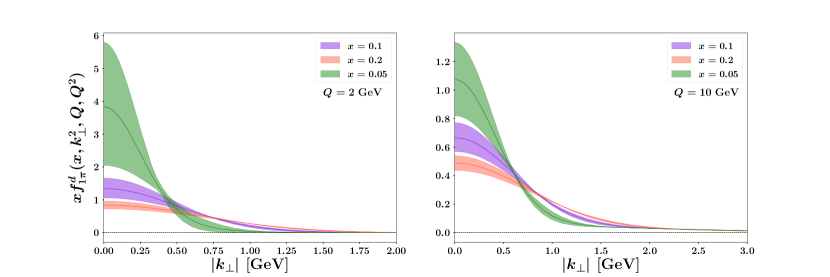
In Fig. 4, we show the unpolarized TMD PDF for a quark in at GeV (left panel) and 10 GeV (right panel) as a function of the quark transverse momentum for three different values of = 0.05, 0.1, and 0.2. We select these three values of in order to show the TMD PDF in the region covered by the experimental measurements (see Fig. 1). The error bands correspond to the 68 CL. They reflect the uncertainty on the fitting parameters of Eq. (4) that are determined by propagating the error in the collinear PDFs of both the pion and the proton. However, since we used only the central member of the set of collinear PDFs to perform the fit, the integral in of all TMD replicas is fixed, i.e., their value at is the same. As a consequence, the uncertainty related to collinear PDFs is only partially accounted in the plots.
We notice that in both the left and right panels of Fig. 4 the TMD PDF at = 0.05 shows the largest error band, particularly at small values of . This kinematic region is at the boundary of the phase space covered by the considered experiments. Future data from the COMPASS Collaboration are expected to play an important role in improving this picture.
The mean squared transverse momentum of quarks in the pion at GeV and corresponds to the parameter of our fit and turns out to be , somewhat larger than the corresponding quantity for the proton (see Fig. 16 or Ref. Bacchetta et al. (2022)). Therefore, our analysis indicates that the TMD of quarks in the pion is wider than that in the proton.
IV.3 Predictions at COMPASS kinematics
The COMPASS Collaboration has recently released data for (un)polarized azimuthal asymmetries in the (polarized) pion–induced Drell–Yan processes Aghasyan et al. (2017); Lien and Chumakov (2022), and will probably release in the near future also data for the unpolarized cross section.
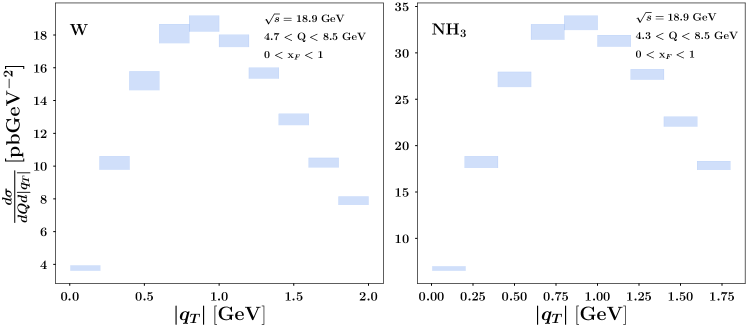
In Fig. 5, we show theoretical predictions based on our fit for the unpolarized pion–nucleus DY cross section as function of the virtual vector boson transverse momentum . The left panel refers to the tungsten () nucleus, while the right panel to the ammonia molecule (NH3). The kinematics is the same of Ref. Lien and Chumakov (2022) and is similar to the one covered in Fig. 1 by the experimental data analyzed in our fit. The uncertainty bands at 68% CL are evidently large, indicating that the available information we have on the internal structure of the pion is not sufficient to make accurate predictions. Hopefully, the upcoming COMPASS data for the pion–nucleus DY process will help to better constrain TMD PDFs in the pion, in particular shedding light on the normalization issue between theory and data.
V Conclusions and outlook
In this paper, we have presented an extraction of the unpolarized quark TMD PDF in the pion, based for the first time on the analysis of the whole set of available data for the production of DY lepton pairs in -nucleus collisions from the E615 Stirling and Whalley (1993) and E537 Anassontzis et al. (1988) experiments. Our data set includes 138 data points that can reasonably be described in the TMD formalism, in terms of TMD PDFs of the proton and of the pion. The information about the proton is fixed according to a recent extraction from the MAP collaboration Bacchetta et al. (2022), based on the analysis of a much larger data set. We modeled the pion TMD PDF as a simple Gaussian with an -dependent width, described by three free parameters in total.
We obtained a fairly good description of the data, with a global per data point of 1.55. We emphasize that about 60% of this value comes from fully correlated normalization errors.
The TMD PDFs obtained by our fit, illustrated in Fig. 4, are naturally affected by larger error bands compared to proton TMD PDFs, even using a simple and rigid functional form.
Our results can be used also to make predictions for future measurements. For instance, we provided predictions for the unpolarized cross section in pion–nucleus DY collisions at the COMPASS kinematics.
Acknowledgements.
We thank Barbara Pasquini for discussions related to the structure of the pion and Riccardo Longo for discussions concerning COMPASS predictions. This work is supported by the the European Union’s Horizon 2020 programme under grant agreement No. 824093 (STRONG2020). CB is supported by the DOE contract DE-AC02-06CH11357.References
- Horn and Roberts (2016) T. Horn and C. D. Roberts, J. Phys. G 43, 073001 (2016), eprint 1602.04016.
- Gluck et al. (1992) M. Gluck, E. Reya, and A. Vogt, Z. Phys. C 53, 651 (1992).
- Sutton et al. (1992) P. J. Sutton, A. D. Martin, R. G. Roberts, and W. J. Stirling, Phys. Rev. D 45, 2349 (1992).
- Gluck et al. (1998) M. Gluck, E. Reya, and M. Stratmann, Eur. Phys. J. C 2, 159 (1998), eprint hep-ph/9711369.
- Gluck et al. (1999) M. Gluck, E. Reya, and I. Schienbein, Eur. Phys. J. C 10, 313 (1999), eprint hep-ph/9903288.
- Wijesooriya et al. (2005) K. Wijesooriya, P. E. Reimer, and R. J. Holt, Phys. Rev. C 72, 065203 (2005), eprint nucl-ex/0509012.
- Aicher et al. (2010) M. Aicher, A. Schafer, and W. Vogelsang, Phys. Rev. Lett. 105, 252003 (2010), eprint 1009.2481.
- Barry et al. (2018) P. C. Barry, N. Sato, W. Melnitchouk, and C.-R. Ji, Phys. Rev. Lett. 121, 152001 (2018), eprint 1804.01965.
- Novikov et al. (2020) I. Novikov et al., Phys. Rev. D 102, 014040 (2020), eprint 2002.02902.
- Cao et al. (2021) N. Y. Cao, P. C. Barry, N. Sato, and W. Melnitchouk (Jefferson Lab Angular Momentum), Phys. Rev. D 103, 114014 (2021), eprint 2103.02159.
- Barry et al. (2021) P. C. Barry, C.-R. Ji, N. Sato, and W. Melnitchouk (Jefferson Lab Angular Momentum (JAM)), Phys. Rev. Lett. 127, 232001 (2021), eprint 2108.05822.
- Bourrely et al. (2022) C. Bourrely, W.-C. Chang, and J.-C. Peng, Phys. Rev. D 105, 076018 (2022), eprint 2202.12547.
- Pasquini and Schweitzer (2014) B. Pasquini and P. Schweitzer, Phys. Rev. D 90, 014050 (2014), eprint 1406.2056.
- Noguera and Scopetta (2015) S. Noguera and S. Scopetta, JHEP 11, 102 (2015), eprint 1508.01061.
- Lorcé et al. (2016) C. Lorcé, B. Pasquini, and P. Schweitzer, Eur. Phys. J. C 76, 415 (2016), eprint 1605.00815.
- Bacchetta et al. (2017a) A. Bacchetta, S. Cotogno, and B. Pasquini, Phys. Lett. B 771, 546 (2017a), eprint 1703.07669.
- Ceccopieri et al. (2018) F. A. Ceccopieri, A. Courtoy, S. Noguera, and S. Scopetta, Eur. Phys. J. C 78, 644 (2018), eprint 1801.07682.
- Ahmady et al. (2019) M. Ahmady, C. Mondal, and R. Sandapen, Phys. Rev. D 100, 054005 (2019), eprint 1907.06561.
- Kaur and Dahiya (2021) N. Kaur and H. Dahiya, Int. J. Mod. Phys. A 36, 2150052 (2021), eprint 1908.08657.
- Shi et al. (2020) C. Shi, K. Bednar, I. C. Cloët, and A. Freese, Phys. Rev. D 101, 074014 (2020), eprint 2003.03037.
- Collins (2013) J. Collins, Foundations of perturbative QCD, vol. 32 (Cambridge University Press, 2013), ISBN 978-1-107-64525-7, 978-1-107-64525-7, 978-0-521-85533-4, 978-1-139-09782-6.
- Bacchetta et al. (2017b) A. Bacchetta, F. Delcarro, C. Pisano, M. Radici, and A. Signori, JHEP 06, 081 (2017b), [Erratum: JHEP 06, 051 (2019)], eprint 1703.10157.
- Scimemi and Vladimirov (2018) I. Scimemi and A. Vladimirov, Eur. Phys. J. C 78, 89 (2018), eprint 1706.01473.
- Bertone et al. (2019) V. Bertone, I. Scimemi, and A. Vladimirov, JHEP 06, 028 (2019), eprint 1902.08474.
- Scimemi and Vladimirov (2020) I. Scimemi and A. Vladimirov, JHEP 06, 137 (2020), eprint 1912.06532.
- Bacchetta et al. (2020) A. Bacchetta, V. Bertone, C. Bissolotti, G. Bozzi, F. Delcarro, F. Piacenza, and M. Radici, JHEP 07, 117 (2020), eprint 1912.07550.
- Bury et al. (2022) M. Bury, F. Hautmann, S. Leal-Gomez, I. Scimemi, A. Vladimirov, and P. Zurita (2022), eprint 2201.07114.
- Bacchetta et al. (2022) A. Bacchetta, V. Bertone, C. Bissolotti, G. Bozzi, M. Cerutti, F. Piacenza, M. Radici, and A. Signori (2022), eprint 2206.07598.
- Wang et al. (2017) X. Wang, Z. Lu, and I. Schmidt, JHEP 08, 137 (2017), eprint 1707.05207.
- Vladimirov (2019) A. Vladimirov, JHEP 10, 090 (2019), eprint 1907.10356.
- Stirling and Whalley (1993) W. J. Stirling and M. R. Whalley, J. Phys. G 19, D1 (1993).
- Anassontzis et al. (1988) E. Anassontzis et al., Phys. Rev. D 38, 1377 (1988).
- Harland-Lang et al. (2015) L. A. Harland-Lang, A. D. Martin, P. Motylinski, and R. S. Thorne, Eur. Phys. J. C 75, 204 (2015), eprint 1412.3989.
- Aghasyan et al. (2017) M. Aghasyan et al. (COMPASS), Phys. Rev. Lett. 119, 112002 (2017), eprint 1704.00488.
- Lien and Chumakov (2022) Y.-H. Lien and A. Chumakov, SciPost Phys. Proc. p. 028 (2022), URL https://scipost.org/10.21468/SciPostPhysProc.8.028.