Beam deflection and negative drag in a moving nonlinear medium
Abstract
Light propagating in a moving medium with refractive index other than unity is subject to light drag. While the light drag effect due to the linear refractive index is often negligibly small, it can be enhanced in materials with a large group index. Here we show that the nonlinear refractive index can also play a crucial role in propagation of light in moving media and results in a beam deflection that might be confused with the transverse drag effect. We perform an experiment with a rotating ruby crystal which exhibits a very large negative group index and a positive nonlinear refractive index. The negative group index drags the light opposite to the motion of the medium. However, the positive nonlinear refractive index deflects the beam towards the motion of the medium and hinders the observation of the negative drag effect. Hence, we show that it is necessary to measure not only the transverse shift of the beam, but also its output angle to discriminate the light-drag effect from beam deflection — a crucial step missing in earlier experiments.
Introduction
Propagation of light in moving media has been studied for more than two centuries Fresnel (1818); Fizeau (1860); Balazs (1955); Parks and Dowell (1974); Leonhardt and Piwnicki (2001); Artoni et al. (2001); Götte et al. (2007); Carusotto et al. (2003); Leonhardt and Piwnicki (2000); Khan et al. (2021); Qin et al. (2020). Upon propagation, the trajectory of light can be manipulated through self-action effects Chiao et al. (1964); Fibich and Gaeta (2000), beam deflection Meyer and Amer (1990); Dixon et al. (2009), photon drag Gibson et al. (1970); Yee (1972); Gibson and Kimmitt (1980) and many other phenomena. The photon drag effect was hypothesized by Fresnel Fresnel (1818), and then experimentally observed by Fizeau Fizeau (1860). Fizeau’s landmark experiment measured the shift of interference fringes within an interferometer containing a tube with moving water. These shifts in the fringes supported the idea that light is dragged in moving media. This phenomenon has gained increasing interest in the field of optics and is indeed still investigated in modern day research Grinberg and Luryi (1988); Wieck et al. (1990); Artoni et al. (2001); Strekalov et al. (2004); Götte et al. (2007); Davuluri and Rostovtsev (2012); Kazemi and Mahmoudi (2018); Khan et al. (2021). Photon drag can be longitudinal or transverse, i.e., along or perpendicular to the light propagation direction respectively. This article focuses on transverse rotary photon drag Franke-Arnold et al. (2011), distinctly different than longitudinal drag, given by
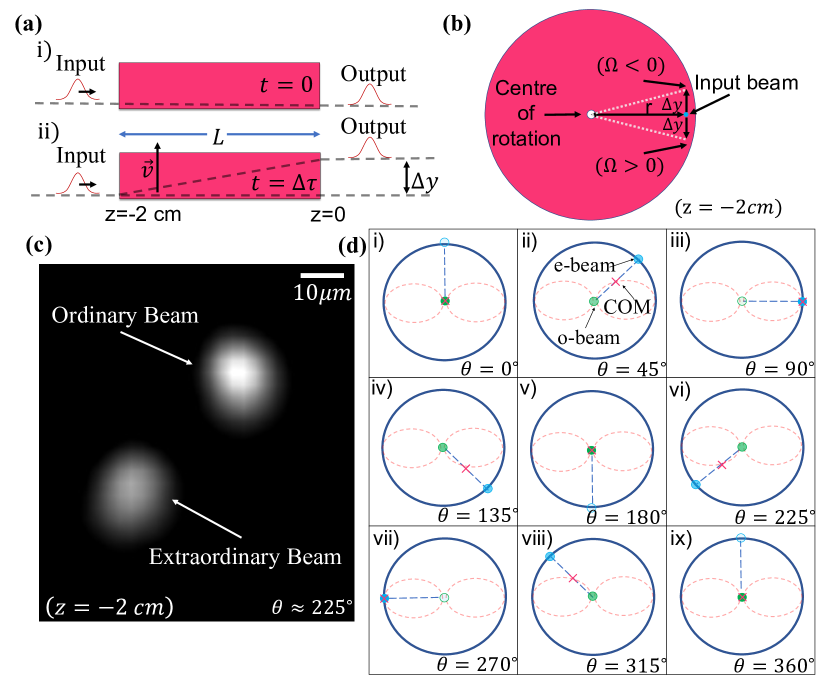
| (1) |
with the speed of the medium, the speed of light in vacuum, the length of the medium, and the group and phase indices, respectively. Photon drag scales linearly with group index. Typically phase and group indices are not large, and therefore do not create large transverse shifts. Recent studies show larger shifts using slow light media(i.e. large group indices) Franke-Arnold et al. (2011); Kazemi and Mahmoudi (2018); Qin et al. (2020); Safari et al. (2016). Figure 1a) sketches the light propagation in a medium of length in two cases, a) a stationary medium, and b) a medium moving transversely with speed . Experimentally, rotation is more feasible than linear motion. The beam is incident on the medium at a distance from the center of rotation, and using a slow light medium with , the transverse drag can be simplified to
| (2) |
where is the rotational speed of the medium. Note that the beam size is much smaller than the medium radius, .
Large group indices are often achieved by employing a nonlinear phenomena such as coherent population oscillations (CPO) and electromagnetically induced transparency (EIT), that produce or even larger. However, as we show below, in the presence of a strong saturating beam, one must consider nonlinear deflection in a moving medium which can be larger than and confused with the photon-drag effect. In a nonlinear medium, the impinging light can saturate the transition and locally change the refractive index of the medium. When the response of the medium is not instantaneous, as the medium moves in the transverse direction, the imprinted refractive index profile is dragged along with the motion of the medium Therefore, in a moving nonlinear medium, location of peak index change is shifted with respect to the center of the impinging light. Thus, the light sees a gradient in the refractive index and deflects at an angle. The sign of this nonlinear deflection depends on the sign of the nonlinear refractive index and the direction of motion of the medium. In a typical nonlinear interaction with positive nonlinear refractive index, where self-focusing is observed, the beam deflects towards the motion of the medium and thus resembles a positive photon-drag effect. In nonlinear deflection the output beam leaves the moving medium at an angle with respect to the input beam, while in the photon-drag effect the output beam is in parallel to the input beam. Therefore, one can distinguish the nonlinear deflection from the drag effect by measuring the output angle of the beam. While the enhanced photon-drag effect depends on the group index including any nonlinear contribution (see Eq. (2)), the nonlinear deflection depends on the nonlinear refractive index of the medium. Thus, it seems that one should be able to achieve a large enhancement in the drag effect with negligible nonlinear deflection. However, according to the Kramers-Kronig relation, a large group index often is associated with a sluggish response Toll (1956). Therefore, if the large group index is achieved through a nonlinear interaction, one has to be careful with the nonlinear deflection and measure the output angle, a critical step missing in previous works Franke-Arnold et al. (2011); Jones (1972); Leach et al. (2008). In this article, we use a rotary ruby rod to study the nonlinear light propagation in a moving medium. In a similar fashion to alexandrite Bigelow et al. (2003), ruby exhibits a large negative group index () at wavelength 473 nmSafari (2022). Hence, according to Eq. (2) one expects to observe a large negative photon-drag effect in which the position of the beam shifts in the direction opposite to the motion of the medium.
Nevertheless, since ruby also exhibits nonlinear refraction, the beam deflects towards the direction motion of the medium due to nonlinear deflection. Because of the birefringence of the crystal, the input beam splits into ordinary (o) and extra-ordinary (e) beams which separate upon propagation in the crystal. The e-beam revolves with the rotation of the ruby rod. Moreover, the propagation of the o- and e-beam are coupled through the nonlinear interaction in ruby which creates an attractive force between the beams and further complicates their trajectory. We study this trajectory experimentally and simulate the propagation using nonlinear Schrodinger equations. Due to the simultaneous presence of birefringence, intensity-dependent photon drag, and strong nonlinearity, ruby can serve as a solid-state platform rich in physics with potential applications to beam steering Boccia et al. (2009); Golub (1992), polarization detection Allen et al. (1963); Gong et al. (2010), image rotationLeach et al. (2008); Franke-Arnold et al. (2011) , and potential for solitonic behaviour with associated applications Hasegawa (2000); Ablowitz et al. (2000); Kivshar and Luther-Davies (1998).
Methods
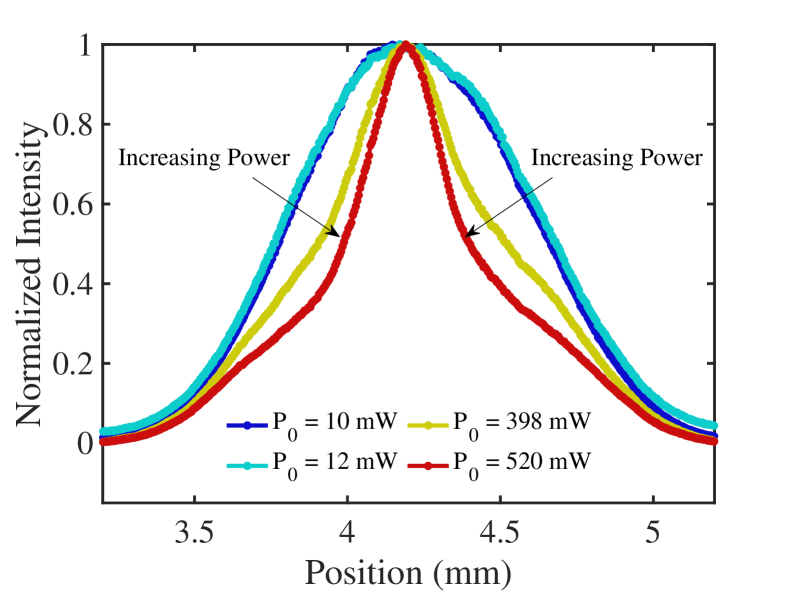
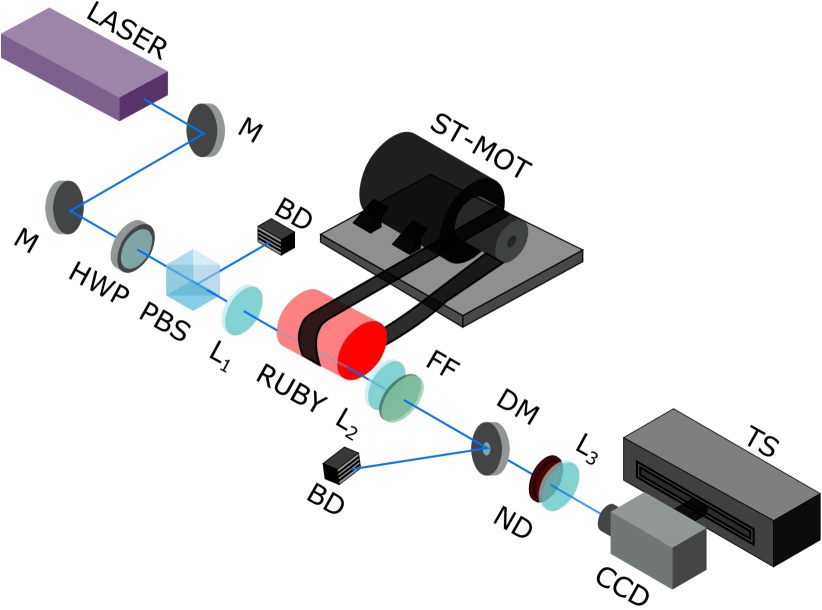
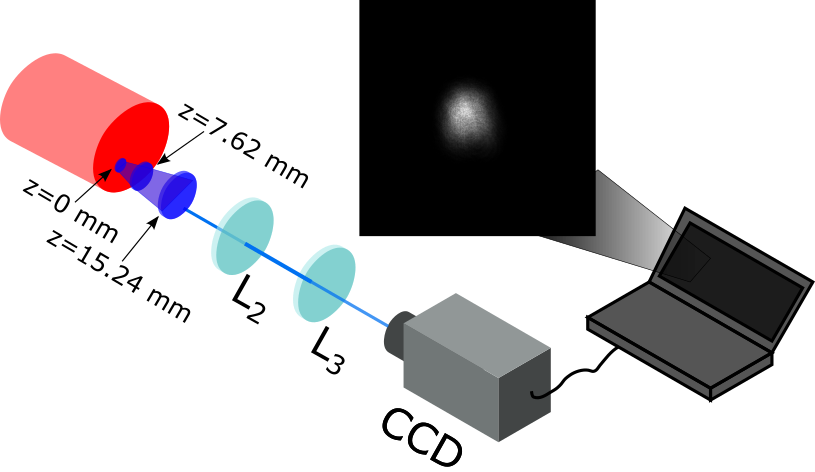
The laser source used in the experiment, as shown in Fig. 2, is a continuous-wave (CW) diode-pumped solid-state laser operating at 473 nm with an output power of 520 mW. We control the power of the laser beam using half-wave plate and polarizing-beam splitter. We use a 2-cm-long ruby rod, 9 mm in diameter, with a Cr3+ doping concentration of 5%. We focus the laser beam onto the front face of the crystal using a plano-convex lens of focal length mm, resulting in a 20 m beam diameter located near the edge (0.1 mm away) of the ruby crystal face far from the center of rotation. The ruby was mounted in a hollow spindle whose rotation was controlled by a stepper motor and belt. The back face of the crystal was imaged onto a CCD camera using a 4-f lens system.
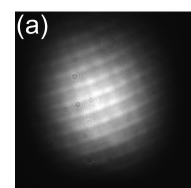
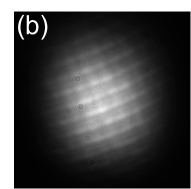
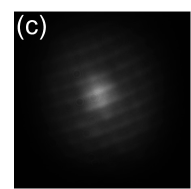
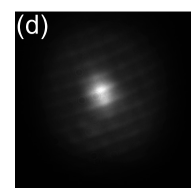
Shining linearly polarized light onto the rotary birefringent medium, the light sees two refractive indices upon propagation, , and , respectively. Without any influence of nonlinearity or photon drag, the two beams (o- and e-beams) then propagate with a finite angle separation of mrad, known as birefringent walk-off. The relative beam intensity reaches maxima and minima each quarter turn of the crystal (i.e., ). The beam input is aligned such that, regardless of crystal orientation, the o-beam propagates directly through the crystal, while the e-beam revolves about the o-beam. We track the motion of the average position of these two beams with an approach using the center of mass (COM), represented as a red “x” in Fig. 1d. The COM is representing the centre of intensity distribution. This method is used since transverse beam profiles become larger on propagation and begin to overlap. Figure 1c) shows a distinct Gaussian beam shape at cm. In contrast, the o and e beams are mostly overlapped at the crystal back face, cm where transverse shifts are measured.
Results
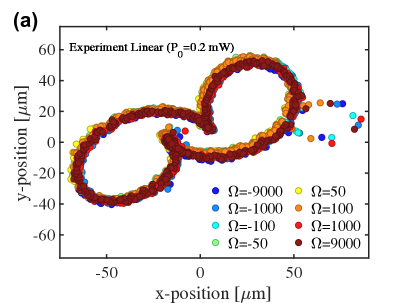
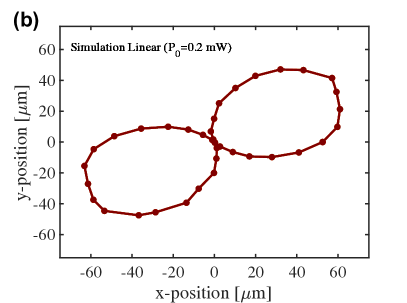
We measure the COM at for rotational speeds of , and deg/s in clockwise (positive) and counterclockwise (negative) directions at three different input powers of 0.2 mW, 100 mW, and 520 mW, corresponding to weak, moderate, and intense illumination, respectively. We plot the COM trajectories for an input laser power of 0.2 mW, considered as the linear regime in Fig. 3. We observe that all speeds trace out figure-eights and do not drift transversely.
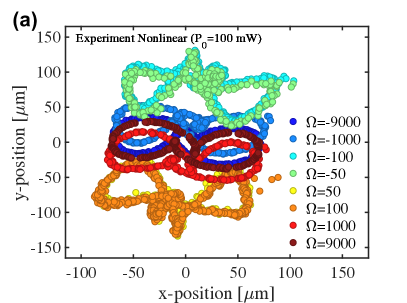
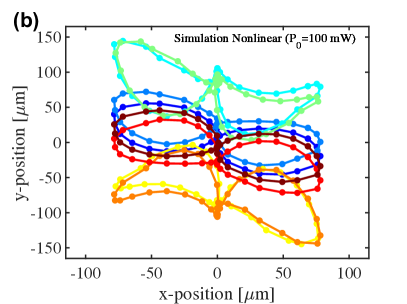
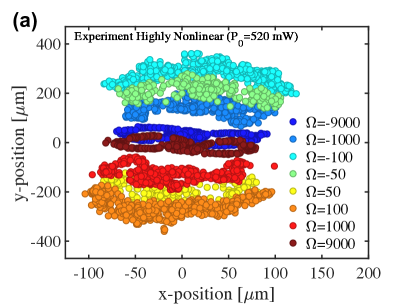
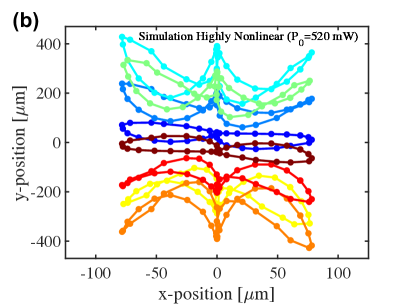
Figures 4 and 5 show COM trajectories in nonlinear and highly nonlinear regimes. At low speeds ( deg/s), the o- and e- beams couple to each other causing significant variation in the traces of the COM upon rotation. Increasing intensity increases the thermal gradient impressed on the crystal drastically modifying the transverse beam shape. At high speeds, the deviations from a figure-eight-like pattern start to average out for input power of mW and resemble those of the linear results, with the trajectories transversely shifted from one another based on the rotation speed. This is further seen in the highly nonlinear regime mW, but at a slower pace due to more noise. With lower speeds, one notes that the figure-eight-like COM trajectories knot near the center as a result of the nonlinear coupling of the o- and e- beams. Simulations are compared showing agreement in the traced patterns, and magnitudes of transverse shift, to be discussed in more detail later in this article.
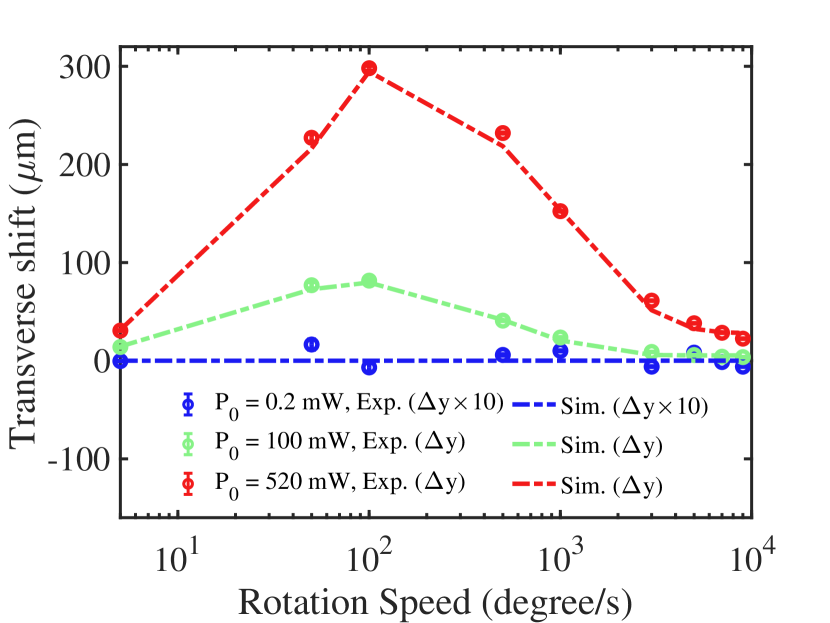
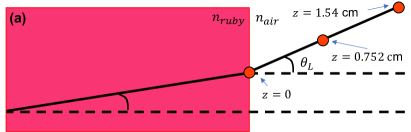
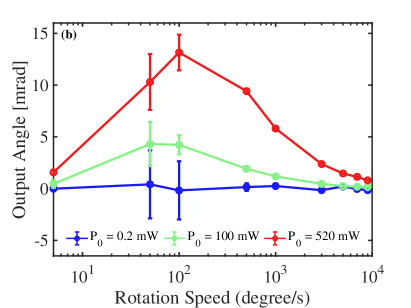
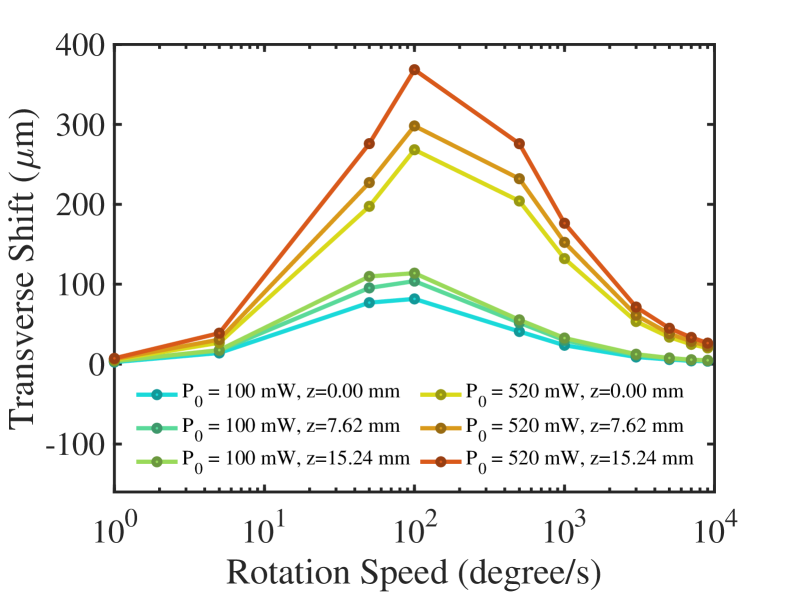
We extract the average position of these COM trajectories over an integer number of full rotations. Figure 6 shows the rotation speed dependence of the extracted transverse shift at for linear, nonlinear and highly nonlinear regimes. The linear regime ( mW) shows a shift of a few microns. There is no clear scaling with rotation in the linear regime, however nonlinear regimes indeed show a trend similar to that of a log-normal distribution centered around deg/s. Nonlinear regimes show significant increases in the magnitude of transverse shift (), showing that the observed shift is mainly nonlinear. Transverse spatial shift is comprised of the nonlinear photon drag and nonlinear deflection. While the photon-drag shifts the beam in the transverse direction in parallel to the input beam, the nonlinear deflection deflects the beam at an angle. Thus, we distinguish the effects by measuring the transverse position at as well as at two locations after the crystal to find the output angle (see Fig. 7a). This angle is calculated from the difference in average transverse position of the COM at different z positions, shown in Fig. 7b. As expected from nonlinear deflection, this angle is intensity- and rotation speed- dependent. Therefore, the measurement of the angle confirms that the transverse shift observed at the end of the crystal is not only a result of the photon drag effect, but also nonlinear deflection. It is important to note that by moving the camera closer to the crystal one can image the input face of the crystal at which a seemingly negative drag is observed, i.e. the beams appear to be shifted opposite directions to the motion of the crystal. However, we highlight that such a measurement simply extrapolates the output beams towards the input face of the crystal. In reality, one images through a nonlinear medium, which is overlooked by the extrapolation. Indeed, to understand the position at the crystal input face, one must take care of the nonlinear effects on imaging to know the position accurately. Nonetheless, the extrapolation leads to a seemingly negative drag effect as a consequence of the large output angle due to nonlinear deflection. Therefore, in any measurement of the transverse drag effect, it is crucial to measure the output angle to obtain an accurate result.
Discussion
A. Nonlinear refraction
Intense linearly polarized light in rotating birefringent medium causes o- and e-beams both experience nonlinear refraction as the maximum intensity continuously moves between them creating a moving index gradient. The gradient leads to nonlinear coupling between the beams, where the local index variation pulls one beam toward the other with the higher refractive index, locally distorting the figure-eight-like COM trajectory. The distortions are dictated by the rotation speed, where the speed controls the amount of time that beam imprints an index gradient on the crystal.
The beam coupling increases in strength up to a with decreasing rotation speed. The strongest coupling is seen at low speeds when the beams have sufficient time to imprint the maximum nonlinear index. On the other hand, higher rotation speeds imprint less gradient, blurring the effect of nonlinear refraction and non-distorted figure-eight-like trajectories are recovered.
The regimes of rotations speeds are following sampling timescales based on two different origins: 1) Optical (slow) and 2) Thermal (fast). Often optical timescales are faster than thermal, but the optical response is attributed to CPO Franke-Arnold et al. (2011) is on the order of 3-5 ms which is proportional to the faster rotation speeds. As for slow rotation speeds, these sampling timescales are like thermal nonlinearities on the order of several hundred s.
We model the temporal dynamics in these two regimes using a phenomenological fit consisting of two decaying exponentials, to be discussed later in this article, where we take analogy to spatial self-steepening De Oliveira et al. (1992); Hernández et al. (2020). That is, the beam is shifted due to the rotation speed acting on the group index, and therefore the group velocity. The rotation speed samples the dynamics representing a non-instantaneous temporal response of the system. The index gradient due to nonlinear refraction is discussed in the supplementary materials and how this is applied to a stationary medium in steady-state forming a Townes profile.
B. Simulations
To better understand the experimental results, we model and simulate nonlinear propagation of linearly polarized light through a 2-cm-long rotating birefringent ruby rod, where o- and e-beams are created and vary in relative intensity upon rotation. Due to the weak birefringence typically associated with ruby and intense illumination, these two beams couple to each other upon rotation. Both beams are modelled using the nonlinear Schrödinger equation where we apply a split-step Fourier method and propagate the two with a coupling term containing a nonlinear response function. Following the derivation of Marcucci et al. Marcucci et al. (2019), we write wave equations for the medium using a Kerr-type nonlinearity of thermal origin. Rotation and birefringence are also included Conti et al. (2005). Furthermore, a term for the effective group index is incorporated into the coupled equations which is intensity- and rotation speed-dependent.
Using our theoretical framework, including the phenomenological fit convoluted with nonlinear propagation, we were able to accurately simulate the amount of transverse shift, and the transverse movement of the center of mass of the beams observed in experiment. We develop a set of generalized coupled nonlinear Schrodinger equations, written as follows
| (3) |
| (4) | ||||
where the fields and represent the o- and e- beams, are the o- and e-beam wave vectors, are the o- and e-beam refractive indices, respectively. Furthermore, is the tilt angle, is the transverse Laplacian operator, and is the nonlocal Kerr-type nonlinearity that contains the coupling term in the kernel function Marcucci et al. (2019). One notes that the nonlinear deflection term works on the derivative of the field rather than the field directly like that of nonlinear refraction. When adding dispersion to the nonlinear Schrodinger equation, one includes this effect as , which becomes when considering a continuous-wave laser rather than pulses. This term will drive the nonlinear deflection that is measured at the crystal back face, where as in Eq. (7).
The magnitude of the nonlinear deflection is proportional to the magnitude of the effective group index, controlled by the intensity and rotation speed. The rotation speed changes the conditions for how quickly the heat dissipates through the crystal, and thus the magnitude of the index gradient. If the speeds are sufficiently slow, the index gradient stays relatively constant and causes an increasing amount of transverse shift. Typically the time scale needed to deflect the beam is always very short (i.e. , however once the maximum amount of transverse shift is met, i.e deg/s, the crystal starts rotating faster than the timescale needed to form the index gradient. Typically, Thus, as we increase the rotation speed, the beam sees less of an index gradient and therefore experiences less transverse shift. The curve associated transverse shift versus rotation speed is comprised of two decaying exponentials centered about degs/s. The decay rates of these two exponentials gives rise to asymmetric distribution about degs/s. For slow speeds, the index gradient impressed on the crystal is not blurred leading to a slower decay rate. At higher speeds, the beam is sampling only some of the index gradient drastically changing the magnitude, and thus the decay rate is faster. This is shown in Fig. 6, where the behaviour is not symmetric about deg/s.
We draw analogy to a self-steepened pulse to explain the asymmetry of the transverse shift versus rotation speed. In a self-steepened pulse, the group velocity travels at different speeds dependent on the intensity. As such, different parts of the pulse travel at speeds according to the group velocity. Higher intensities are seen at the peak of the pulse that gives rise to large group index, and thus a slower group velocity. At the wings of the pulse, the intensity is lower and the group velocity is larger. This causes the pulse to become asymmetric in time, and thus the material response will have an asymmetric response in time. The rotation speed controls the amount of time that maximum intensity is in a given area, and therefore the index gradient will have asymmetric temporal response as well. As a result, the amount of transverse shift will also change asymmetrically.
A phenomenological fit for the transverse shift, , was created using the experimental data in Fig. 6 which shows an exponential dependence between the rotation speed and the amount of transverse shift (see Supplementary Materials). The phenomenological fit has form of a decaying exponential, and thus we can represent the maximum imprinted nonlinear group index as , where is the input intensity and is a characteristic time of the decay of the nonlinear response, which we ascribe to thermal diffusion as the dominant thermal contribution to the nonlinear response. This maximum group index gradient will change the size of the effective group index. Let us write the time in terms of the rotation speed as , where is the rotation speed, is a characteristic rotation speed, and we rewrite the transverse shift to be
| (5) |
where is the distance from the center of the crystal to the beam position, and is the effective group index written as
| (6) |
We can look at the time-average response of the effective group index for a given speed. Therefore, if we break up the average temporal response into a fast and slow contribution, we can write the effective group index as
| (7) |
where m2/W, and and are scaling factors equal to 0.97 and 0.94, respectively. These values are similar to those when considering the peak power of a Gaussian pulse. and refer to the inverse time scales of the slow and fast parts of the interaction, where . The slow and fast timescales are ms, and s, respectively. These two timescales follow the timescale of the lifetime of the excited ions 3 to 5 ms Franke-Arnold et al. (2011), and the typical timescale of thermal diffusion (s) Doiron and Haché (2004). Equation (7) can be seen plotted in the supplementary materials.
Fast and slow time scales modify the magnitude of the effective group index, representing an approximate non-instantaneous response. The nonlinear response of the medium is indeed non-instantaneous, but this approach to good approximation represents the dynamics in the system while alleviating computational expense when one includes a non-instantaneous response into simulations. Equation (7) is then introduced into a generalized nonlinear Schrödinger equation, and nonlinear propagation is simulated to investigate the transverse COM trajectories, and extract the amount of transverse shift. We further incorporate other nonlinear effects on the output amount of transverse shift experienced by the beam COM. These results are shown in Figs. 3, 4, and 5, achieving good agreement amongst the trajectories and the transverse shift due to photon drag and nonlinear deflection.
From Eq. 3 and 4, we represent the static nonlinear refraction as an index gradient that takes the form
| (8) | ||||
where , . Here, and are the Cartesian coordinates of an arbitrary position within the space where the nonlinear kernel function acts. The nonlinear potential in the laboratory’s frame depends on the crystal’s response function Marcucci et al. (2019), which is given by the thermal properties of the material
| (9) |
and .
A further explanation of the theoretical modeling of light propagation through a moving nonlinear medium is discussed by Hogan et al.Hogan et al. (2022). Upon propagating two beams through the crystal, we extract two main parameters as a function of the input intensity, and rotation speed: 1) the position of the COM in the transverse plane, and 2) the transverse shift (overall average position of the COM trajectories) experienced by the beams at the back face of the crystal. The COM trajectories and the values of the transverse shift are determined for a variety of crystal rotation speeds, and the three powers used in experiment with the addition of the phenomenological fit in the drift term as a modified effective group index. Results of the simulations are presented in the Figs. 3, 4, and 5 for direct comparison to experimental data.
Conclusion
We have demonstrated experimentally and through simulation that a 2-cm long rotating ruby crystal illuminated with 473-nm light produces a transverse shift as a result of nonlinear photon drag and nonlinear deflection. In rotating saturable media with self-focusing nonlinear refraction, one must measure the output angle to distinguish nonlinear deflection and transverse photon drag. We note that even if the medium presents large negative group indices, nonlinear deflection can dominate over negative drag when nonlinear refraction is large and positive. The maximum transverse shift is found to be found to be m, and the maximum angular shift is found to be found to be mrad at the back face of the crystal (). Moreover, exotic trajectories were observed experimentally for the center of mass of the beam in the transverse plane at the crystal back face, and reproduced in simulation with good agreement. Since the position of transverse profile of the beam is controllable by the rotation speed of the crystal and input intensity of the beam, one can imagine applications in beam-steering and image rotation, as well as understanding the resilience of state of polarization to the motion of the medium.
Funding
This work was supported by the Canada Research Chairs program and the National Science and Engineering Research Council of Canada (NSERC). A.S. acknowledges the support of NSERC [funding reference number PDF - 546105 - 2020]. B.B. also acknowledges the support of the Banting postdoctoral fellowship of NSERC. R.W.B. also acknowledges support by the US Office of Naval Research.
Acknowledgments
The authors would like to thank Xiaoqin Gao for valuable advice on making figures and structural formatting of the manuscript.
Disclosures
The authors declare no conflicts of interest.
Data Availability Statement
The reader can email the corresponding author, Ryan Hogan, for any code that may be needed for their purpose. He can be contacted at rhoga054@uottawa.ca. We will respond to reasonable requests for the code.
Author contributions statement
A.S. conceived the experiment, R.H. and A.S. conducted the experiment, R.H. and B.B. analysed the results, G.M. and R.H. developed theory and conducted simulations, R.H. wrote the article and R.B supervised this work. All authors reviewed the manuscript.
Supplemental Document
See Supplement 1 for supporting content.
References
- Fresnel (1818) A Fresnel, “Lettre d’augustin fresnel à françois arago sur l’influence du mouvement terrestre dans quelques phénomènes d’optique.” Annales de Chimie et de Physique 9, 57–66; 286 (1818).
- Fizeau (1860) MH Fizeau, “XXXII. On the effect of the motion of a body upon the velocity with which it is traversed by light,” The London, Edinburgh, and Dublin Philosophical Magazine and Journal of Science 19, 245–260 (1860).
- Balazs (1955) Nandor L Balazs, “The propagation of light rays in moving media,” JOSA 45, 63_2–64 (1955).
- Parks and Dowell (1974) WF Parks and JT Dowell, “Fresnel drag in uniformly moving media,” Physical Review A 9, 565 (1974).
- Leonhardt and Piwnicki (2001) U Leonhardt and P Piwnicki, “Slow light in moving media,” Journal of Modern Optics 48, 977–988 (2001).
- Artoni et al. (2001) M Artoni, I Carusotto, GC La Rocca, and F Bassani, “Fresnel light drag in a coherently driven moving medium,” Physical Review Letters 86, 2549 (2001).
- Götte et al. (2007) Jörg B Götte, Stephen M Barnett, and Miles Padgett, “On the dragging of light by a rotating medium,” Proceedings of the Royal Society A: Mathematical, Physical and Engineering Sciences 463, 2185–2194 (2007).
- Carusotto et al. (2003) I. Carusotto, M. Artoni, G. C. La Rocca, and F. Bassani, “Transverse fresnel-fizeau drag effects in strongly dispersive media,” Phys. Rev. A 68, 063819 (2003).
- Leonhardt and Piwnicki (2000) Ulf Leonhardt and Paul Piwnicki, “Relativistic effects of light in moving media with extremely low group velocity,” Physical review letters 84, 822 (2000).
- Khan et al. (2021) Ayub Khan, Sayed Arif Ullah, MS Abdul Jabar, and Bakht Amin Bacha, “Fizeau’s light birefringence dragging effect in a moving chiral medium,” The European Physical Journal Plus 136, 1–13 (2021).
- Qin et al. (2020) Tian Qin, Jianfan Yang, Fangxing Zhang, Yao Chen, Dongyi Shen, Wei Liu, Lei Chen, Xiaoshun Jiang, Xianfeng Chen, and Wenjie Wan, “Fast-and slow-light-enhanced light drag in a moving microcavity,” Communications Physics 3, 1–8 (2020).
- Chiao et al. (1964) Raymond Y Chiao, E Garmire, and Charles H Townes, “Self-trapping of optical beams,” Physical Review Letters 13, 479 (1964).
- Fibich and Gaeta (2000) Gadi Fibich and Alexander L Gaeta, “Critical power for self-focusing in bulk media and in hollow waveguides,” Optics letters 25, 335–337 (2000).
- Meyer and Amer (1990) Gerhard Meyer and Nabil M Amer, “Optical-beam-deflection atomic force microscopy: The nacl (001) surface,” Applied Physics Letters 56, 2100–2101 (1990).
- Dixon et al. (2009) P Ben Dixon, David J Starling, Andrew N Jordan, and John C Howell, “Ultrasensitive beam deflection measurement via interferometric weak value amplification,” Physical review letters 102, 173601 (2009).
- Gibson et al. (1970) AF Gibson, MF Kimmitt, and AC Walker, “Photon drag in germanium,” Applied Physics Letters 17, 75–77 (1970).
- Yee (1972) Jick H Yee, “Theory of photon-drag effect in polar crystals,” Physical Review B 6, 2279 (1972).
- Gibson and Kimmitt (1980) AF Gibson and MF Kimmitt, “Photon drag detection,” Infrared and Millimeter Waves 3, 181–217 (1980).
- Grinberg and Luryi (1988) Anatoly A Grinberg and Serge Luryi, “Theory of the photon-drag effect in a two-dimensional electron gas,” Physical Review B 38, 87 (1988).
- Wieck et al. (1990) AD Wieck, H Sigg, and K Ploog, “Observation of resonant photon drag in a two-dimensional electron gas,” Physical review letters 64, 463 (1990).
- Strekalov et al. (2004) Dmitry Strekalov, Andrey B Matsko, Nan Yu, and Lute Maleki, “Observation of light dragging in a rubidium vapor cell,” Physical review letters 93, 023601 (2004).
- Davuluri and Rostovtsev (2012) Sankar Davuluri and Yuri V Rostovtsev, “Controllable enhanced dragging of light in ultradispersive media,” Physical Review A 86, 013806 (2012).
- Kazemi and Mahmoudi (2018) Seyedeh Hamideh Kazemi and Mohammad Mahmoudi, “Phase-controlled photon drag in a slow-light moving medium,” arXiv preprint arXiv:1810.00560 (2018).
- Franke-Arnold et al. (2011) Sonja Franke-Arnold, Graham Gibson, Robert W Boyd, and Miles J Padgett, “Rotary photon drag enhanced by a slow-light medium,” Science 333, 65–67 (2011).
- Safari et al. (2016) Akbar Safari, Israel De Leon, Mohammad Mirhosseini, Omar S Magaña-Loaiza, and Robert W Boyd, “Light-drag enhancement by a highly dispersive rubidium vapor,” Physical review letters 116, 013601 (2016).
- Toll (1956) John S Toll, “Causality and the dispersion relation: logical foundations,” Physical review 104, 1760 (1956).
- Jones (1972) Reginald Victor Jones, “’fresnel aether drag’in a transversely moving medium,” Proceedings of the Royal Society of London. A. Mathematical and Physical Sciences 328, 337–352 (1972).
- Leach et al. (2008) J Leach, AJ Wright, JB Götte, JM Girkin, L Allen, S Franke-Arnold, SM Barnett, and MJ Padgett, ““aether drag” and moving images,” Physical review letters 100, 153902 (2008).
- Bigelow et al. (2003) Matthew S Bigelow, Nick N Lepeshkin, and Robert W Boyd, “Superluminal and slow light propagation in a room-temperature solid,” Science 301, 200–202 (2003).
- Safari (2022) Akbar Safari, “manuscript in preparation,” TBD (2022).
- Boccia et al. (2009) L Boccia, I Russo, G Amendola, and G Di Massa, “Tunable frequency-selective surfaces for beam-steering applications,” Electronics letters 45, 1213–1215 (2009).
- Golub (1992) I Golub, “Beam deflection and ultrafast angular scanning by a time-varying optically induced prism,” Optics communications 94, 143–146 (1992).
- Allen et al. (1963) Robert D Allen, James Brault, and Robert D Moore, “A new method of polarization microscopic analysis: I. scanning with a birefringence detection system,” The Journal of cell biology 18, 223–235 (1963).
- Gong et al. (2010) Jie-Qiong Gong, Hai-Gang Zhan, Da-Zhao Liu, et al., “A review on polarization information in the remote sensing detection,” Spectroscopy and Spectral Analysis 30, 1088–1095 (2010).
- Hasegawa (2000) Akira Hasegawa, “An historical review of application of optical solitons for high speed communications,” Chaos: An Interdisciplinary Journal of Nonlinear Science 10, 475–485 (2000).
- Ablowitz et al. (2000) Mark J Ablowitz, Gino Biondini, and Lev A Ostrovsky, “Optical solitons: perspectives and applications,” Chaos: An Interdisciplinary Journal of Nonlinear Science 10, 471–474 (2000).
- Kivshar and Luther-Davies (1998) Yuri S Kivshar and Barry Luther-Davies, “Dark optical solitons: physics and applications,” Physics reports 298, 81–197 (1998).
- De Oliveira et al. (1992) JR De Oliveira, Marco A de Moura, J Miguel Hickmann, and ASL Gomes, “Self-steepening of optical pulses in dispersive media,” JOSA B 9, 2025–2027 (1992).
- Hernández et al. (2020) Santiago M Hernández, J Bonetti, N Linale, Diego Fernando Grosz, and Pablo Ignacio Fierens, “Soliton solutions and self-steepening in the photon-conserving nonlinear schrödinger equation,” Waves in Random and Complex Media , 1–17 (2020).
- Marcucci et al. (2019) Giulia Marcucci, Davide Pierangeli, Silvia Gentilini, Neda Ghofraniha, Zhigang Chen, and Claudio Conti, “Optical spatial shock waves in nonlocal nonlinear media,” Advances in Physics: X 4, 1662733 (2019).
- Conti et al. (2005) Claudio Conti, Marco Peccianti, and Gaetano Assanto, “Spatial solitons and modulational instability in the presence of large birefringence: The case of highly nonlocal liquid crystals,” Physical Review E 72, 066614 (2005).
- Doiron and Haché (2004) Serge Doiron and Alain Haché, “Time evolution of reflective thermal lenses and measurement of thermal diffusivity in bulk solids,” Applied optics 43, 4250–4253 (2004).
- Hogan et al. (2022) Ryan Hogan, G Marcucci, Akbar Safari, Nicholas A. Black, Boris Braverman, Jeremy Upham, and Robert W. Boyd, “manuscript in preparation,” TBD (2022).
- Lee and Lee (1990) Hak Kyu Lee and Sang Soo Lee, “Measurements of the anisotropic nonlinear refractive-index coefficients of ruby,” Optics letters 15, 54–56 (1990).
- Moll et al. (2003) KD Moll, Alexander L Gaeta, and Gadi Fibich, “Self-similar optical wave collapse: observation of the townes profile,” Physical review letters 90, 203902 (2003).
Supplementary Materials
Transverse shift at different longitudinal positions
Transverse drag, centre of mass (COM) trajectories, and the output angle were measured at the crystal back face ( mm) for a variety of rotation speeds in the linear ( mW), nonlinear ( mW), and highly nonlinear regimes ( mW). A schematic of these positions can be seen in Fig. 8. The CCD can image at different points using a translation stage with range of 25.4 mm from . A set of measurements was taken at each z position, consisting of three powers, mW, mW, and mW for rotation speeds between 1-9000 deg/s. The data sets were then analyzed to extract the transverse shift, the output angle, and COM trajectories. The output angle was calculated by measuring the beam position at several z-planes and the amount of shift along y to find the angle. The angle is directly calculated
| (10) |
Using the values for the transverse shifts as and the difference between the z-positions along propagation , one can calculate the output angle seen in the main text. This therefore shows that the output angle is tuned by the rotation speed, and the intensity of the beam since . We also study the transverse shift at different z-positions in the nonlinear and highly nonlinear cases, seen in Fig. 9. The transverse shift grows along the direction of propagation. The spacing between curves is non-uniform for different rotation speeds is a clear indicator that the output angle is changed by the nonlinear response of the medium. The transverse shift is plotted in Fig. 9 for powers of , and mW. We exclude the linear regime mW since it is on the order of the system noise. One can see that in the limits of high or low rotation speed, the amount of transverse shift is roughly equal in magnitude. It is only in the region mid-range of speeds where the spacing is very non-uniform. One can represent the data in a different way by plotting the amount of transverse shift versus z-position. This can help understand what is going on inside the crystal where imaging of nonlinear systems creates ambiguity in the measurements. One could extrapolate the function back to the crystal front face mm and see the trajectory along z. For the case of deg/s, using linear regression shows a non-zero value at the crystal front face showing evidence that the beam propagation is deviating a straight-line and could be curved based on the nonlinear response of the system. Figures 10, 11(a), and 11(b) show the extrapolation of the transverse shift along the z-direction. The progression of these beams should follow a linear regression as the drag is calculated taking an average position of the COM trajectories, which follows a straight line. Instead, as stated before, taking a linear regression gives non-zero values for certain rotation speeds, and thus the trajectory of the beam along z could be curved, or deflected due to a moving index gradient via the nonlinear refraction.
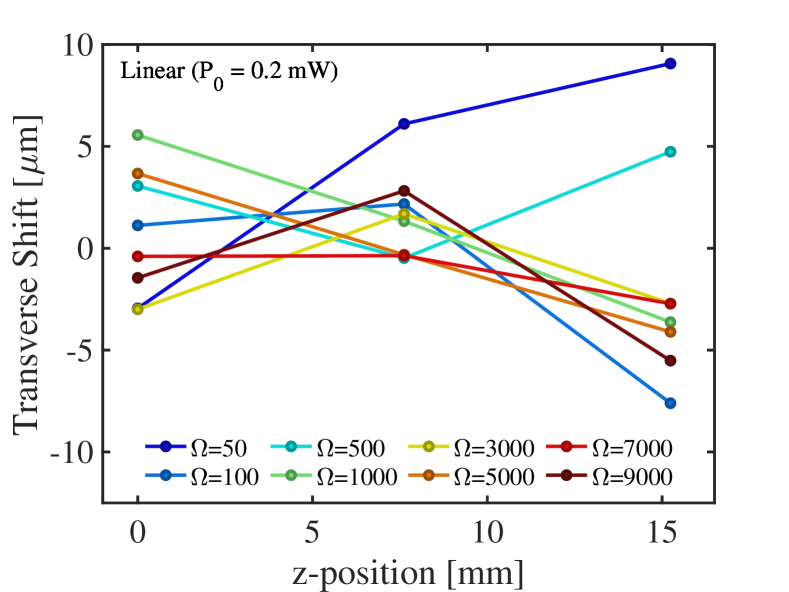
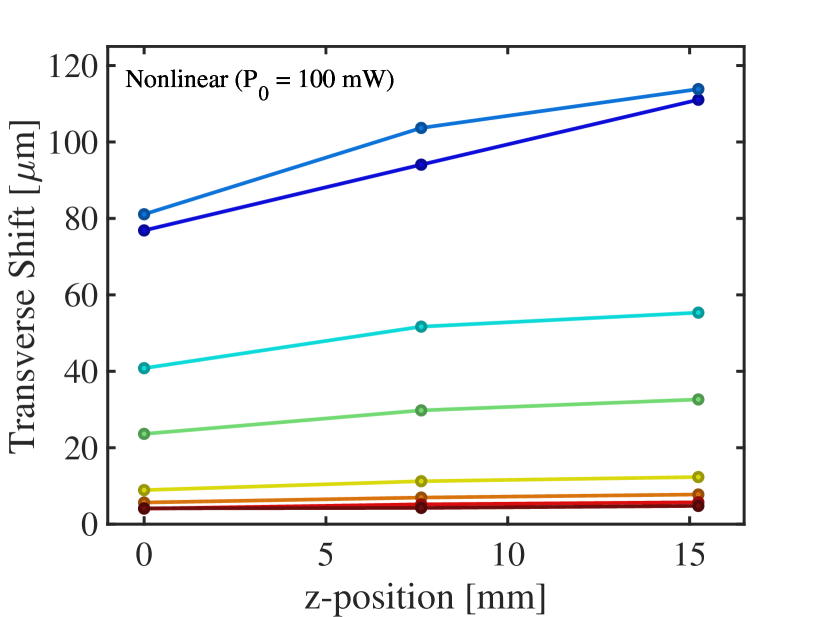
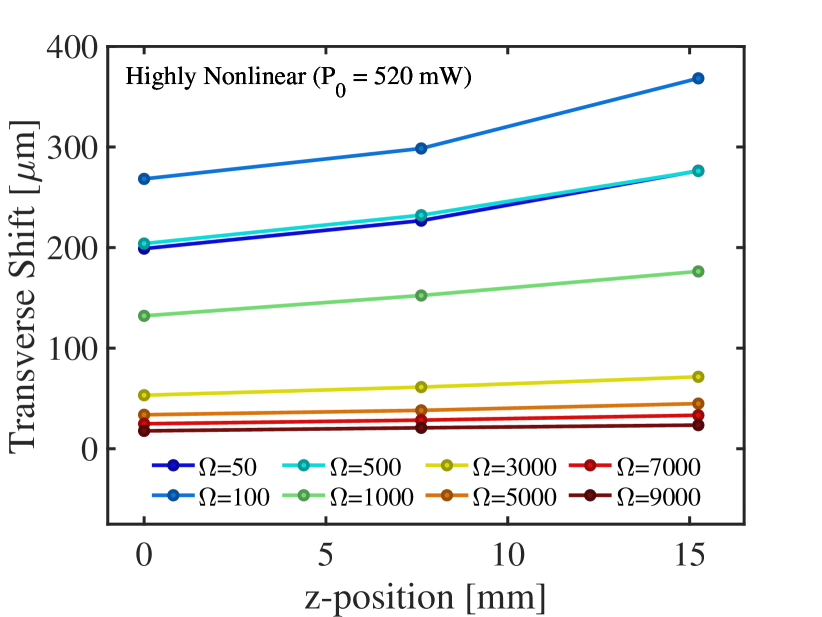
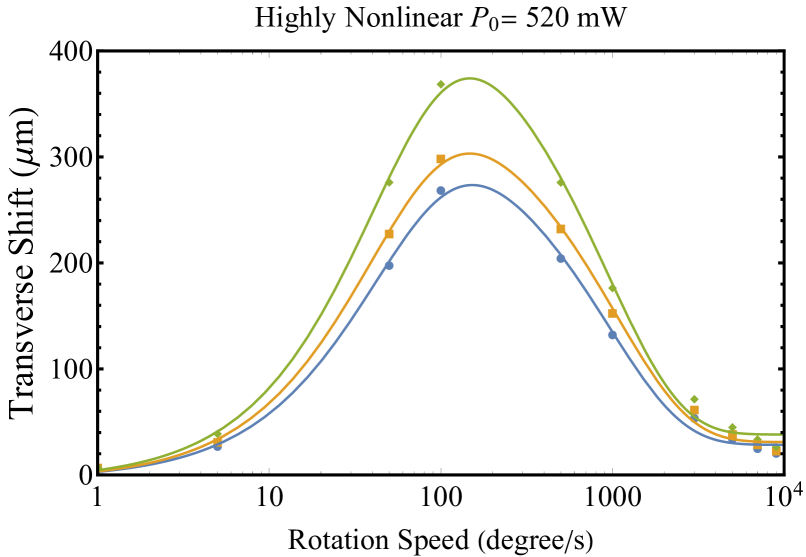
Figure (10) shows the transverse shift along z for various rotation speeds from 50 to 9000 deg/s in the linear regime ( mW). The traces along z for different rotation speeds agrees with the results of the main text. There is indeed no discernable behaviour that can be extracted and the variation is on the order of the system noise. amount of transverse shift in the highly nonlinear regime ( mW). We indeed see the linear behaviour in the highly nonlinear regime is consistent with the COM travelling in a straight line. The magnitudes of the output angle are much larger due to the larger nonlinear response within the crystal. Although the curves slightly deviate from straight lines, this can be attributed to the measurement error in our system.
Fitting function for effective group index
We create a continuous fitting function consisting of the sum of two exponentials, and an offset constant to fit the transverse shift. The transverse shift is plotted in Fig. 12 for the highly nonlinear regime mW for three positions along z: in blue, mm, in yellow, and mm in green. Plots for the nonlinear regime ( mW) are not shown here but follow similar behaviour of smaller magnitude. The form of the fitting function is , where a, b, c, d, and f are fitting constants. In the case of creating a continuous function, one can see that the maximum drag should be closer to deg/s, rather than the discrete points that suggest 100 degs/s. It is clear that the two exponentials indeed fit the discrete points taken at low to high rotation speeds and provides strong evidence that the transverse shift scales exponentially. Table 1 shows the fit parameters for each position along z for an input power of 520 mW. We see that the behaviour follows two exponentials with an offset constant value fits well with our data. This is then used with the simulations parameters to understand the full system and the nonlinear propagation within and after the crystal. The fitting function acts on a higher order component of the generalized nonlinear Schrodinger equation seen in the main text, manipulating the effective group index.
Townes profile formation and nonlinear refraction estimation
Although the system is considered instantaneous in this work, it is of interest to study the time response of the system and the ability to reach steady-state. When the ruby crystal is stationary, i,e. deg/s, the time response of the system can stabilize and reach steady-state where interesting solutions to wave-propagation are possible. A self-focusing nonlinearity was observed in a stationary version of this experiment, and thus nonlinear refraction contributes to transverse shifting of the beam due to nonlinear deflection. The index gradient impinged on the crystal would move with the rotation of the crystal causing the beam to follow in the direction of higher index. The magnitude of this gradient is
| (11) | ||||
where is the nonlinear refractive index, is the power, and is the beam waist. The value of is not known at 473 nm, however the value was measured at 532 nm and used in this calculation as an order of magnitude estimation Lee and Lee (1990). Fig. 13 shows evidence to formation of a well-known soliton solution, the Townes Profile. This supports the fact that there is a self-focusing nonlinearity in our system, and further studies are needed to quantify the value of and fit the Townes profile.
| Fitting Parameters | |||||
|---|---|---|---|---|---|
| Position (mm) | |||||
| 0 | 28.4 | 334 | 46.3 | 302 | 959 |
| 7.52 | 31.0 | 362 | 42.7 | 326 | 1052 |
| 15.24 | 38.1 | 456 | 44.7 | 412.8 | 937 |
The beam waist used here was much bigger than that of the one used in the transverse drag experimental data, and thus the timescale to reach equilibrium is much longer. Fig. 13 suggests that nonlinear refraction is strong enough to match the amount of diffraction in the system and stabilize into a steady-state solution. Here, the change in waist should be equivalent to the change in index due to the nonlinear refraction. Further work is needed to measure these values, but it is clear that the self-focusing length scale is on the order of the diffraction length scale. Furthermore, the non-instantaneous response of the system will be the subject of a further study to understand how the timescale can affect the amount of transverse shift. Furthermore, once the beam reaches steady-state, the transverse beam profile reaches a form of the Townes profile. Since the system is using a continuous-wave laser passing through a 2-cm-long solid-state ruby rod, forming a soliton is interesting as most solitons are created using pulsed lasers that propagate over several metres. Moreover, it would be of interest to see if solitons are also subject to drag and can propagate without breaking up.