Abstract
The Atacama Large Millimeter/submillimeter Array with the planned electronic upgrades will deliver an unprecedented amount of deep and high resolution observations. Wider fields of view are possible with the consequential cost of image reconstruction. Alternatives to commonly used applications in image processing have to be sought and tested. Advanced image reconstruction methods are critical to meet the data requirements needed for operational purposes. Astrostatistics and astroinformatics techniques are employed. Evidence is given that these interdisciplinary fields of study applied to synthesis imaging meet the Big Data challenges and have the potentials to enable new scientific discoveries in radio astronomy and astrophysics.
keywords:
Inverse Problems; Bayesian Inference; Machine Learning; Image Analysis; Radio Astronomyxx \issuenumx \articlenumberx \historyReceived: June 2022; Accepted: September 2022; Published: date \NewEnvironmyequation
|
|
(1) |
Bayesian and Machine Learning Methods in the Big Data era for astronomical imaging \AuthorFabrizia Guglielmetti1, Philipp Arras2, Michele Delli Veneri3, Torsten Enßlin2, Giuseppe Longo4, Lukasz Tychoniec1, Eric Villard1 \AuthorNamesFabrizia Guglielmetti, Philipp Arras, Michele Delli Veneri, Tosten Ensslin, Giuseppe Longo, Lukasz Tychoniec, Eric Villard \corresFabrizia Guglielmetti; fgugliel@eso.org \firstnoteSubmitted to International Workshop on Bayesian Inference and Maximum Entropy Methods in Science and Engineering, IHP, Paris, July 18-22, 2022.
1 Introduction
The Atacama Large Millimeter/submillimeter Array (ALMA) Wootten and Thompson (2009) is an aperture synthesis telescope consisting of 66 high-precision antennas.
Sensitive and high-resolution imaging is accomplished employing up to fifty antennas, characterized by 12-meter dishes (12-m Array).
The remaining sixteen antennas compose the ALMA Compact Array (ACA), tailored for wide-field imaging. ACA is characterized by four 12-m antennas
for total power observations and twelve 7-m dishes (7-m Array) for interferometric observations.
Each antenna is equipped with eight different receiver bands, covering a wavelength range from 3.6 (ALMA band 3) to 0.32 mm (ALMA band 10),
corresponding to a frequency range of 84-950 GHz.
Antennas of the 12-m Array can be positioned in a number of different configurations with longest baselines ranging 0.16-16.2 km, which are crucial
in determining the image quality and spatial resolution:
at the highest frequencies in the most extended configurations, the spatial angular resolution reaches 5 mas at 950 GHz Cortes, P. and et al (2021).
The Array is capable of providing single field and mosaics of pointings.
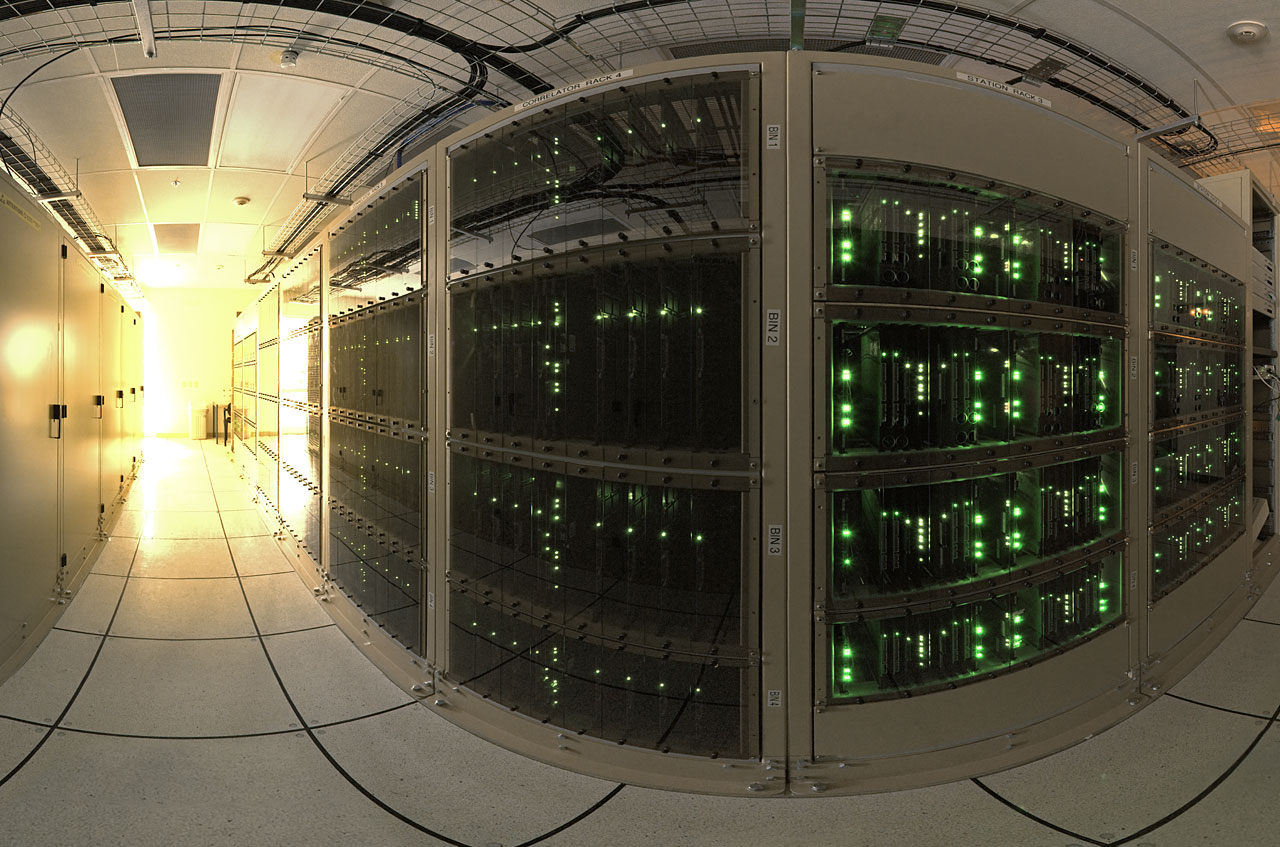
To make interferometric images, signals from each antenna pair are compared times per second within
the ALMA correlator.
Equipped with a set of correlator modes, ALMA allows both continuum and spectral line observations simultaneously.

ALMA is undergoing further developments to boost the Full Operation capabilities. In the near future, ALMA band 1 Huang and et al (2016) and band 2 Yagoubov, P. and et al (2020) will be installed on each antenna broadening the receiver bandwidth to cover a total wavelength range of 8.5-0.32 mm (35-950 GHz). Moreover, the ALMA2030 Development Roadmap Carpenter et al. (2020) has been approved to keep ALMA as a world leading facility. The vision of ALMA2030 accounts for: (1) Broaden the instantaneous bandwidth of the receivers, upgrade the associated electronics and the correlator to process the entire bandwidth; (2) Improve the ALMA Archive for the end users; (3) Extension of the maximum baseline length by a factor 2-3. Another innovative aspect is the design of an array configuration employing all 66 antennas. These advancements will enable the following key science drivers: Origins of the Planets, Origins of Chemical Complexity (with improved continuum imaging) and Origins of the Galaxies. For instance, the study of the Sunyaev–Zel’dovich effect will be enabled to probe the physics of galaxy clusters with the goal of detecting cluster substructures through high resolution and high-sensitivity observations.
Currently ALMA is generating 1 TB of scientific data daily. Within the next decade, at least one order of magnitude of increased daily data rate
is foreseen Carpenter et al. (2020). The planned electronic upgrades (receivers and correlator) will improve ALMA sensitivity and observing efficiency.
In terms of imaging products, ALMA will produce single field and mosaic cubes of at least two orders of magnitude larger than the current
cube size in the GB regime.
Since the number of observed spectral lines at once will be duplicated, advanced algorithms are needed to provide shorter processing time while
handling larger data volume. Additionally, the imaging algorithms must provide robust and reliable results to reduce human intervention.
Sparse sampling, sky and instrumental responses, pervasive presence of noise increase complexities to the demanding task of image reconstruction.
The ALMA development study “Bayesian Adaptive Interferometric Image Reconstruction Methods” is providing an initial exploration of concepts that may be of
interest to ALMA development in the long term.
Using real and simulated data sets, we investigate how to employ Bayesian and Machine Learning techniques to tackle the mentioned challenges.
Specifically for real ALMA data we make use of Science Verification (SV) data. SV is a process by which data quality is assured for scientific analysis.
Observations of a small number of selected astronomical objects are taken with a low number () of antennas.
For ALMA simulated data we make use of the Common Astronomy Software Applications (CASA) McMullin et al. (2007), the software package ordinarly used to calibrate, image and
simulate ALMA data.
The performance of a Bayesian and a supervised Machine Learning (ML) techniques is discussed in view of the
pipeline developments in the ALMA2030 era.
2 ALMA and the ill-posed inverse problem
Data contained in ALMA images are affected by the pervasive presence of noise, sparse sampling and instrumental responses. The inverse problem of extracting astrophysically interesting information from the observed sky brightness is ill–posed, in the sense that the solution is not unique or it is not stable under perturbations on the data. Perturbation caused by noise can create large deviations in the solution being sought. ALMA interferometric image reconstruction is a demanding task.
The observed data are visibilities of the sky brightness distribution collected by each antenna and correlated for given baseline.
There is one complex visibility (amplitude, phase) for each spectral channel, each correlation and every polarization product.
The visibilities are recorded in integrations with timestamps, one for each baseline. A set of consecutive integrations observing the same celestial direction
(field) forms a scan. A set of scans characterizes an observation. The metadata (or measurement set) contains additional information as known sources
in the field of view, spectral lines, weather (as water vapor in the atmosphere, temperature).
The data analysis requires the visibilities and metadata concerning the antennas (as positions, diameters), the feeds on the antennas (as sensitivity,
position), the spectral window setup (frequencies, noise, etc).
Ideally, i.e. if the spatial Fourier domain is complete and regularly filled, the inverse Fourier transform of the ensemble of calibrated visibilities provides the transformation function to move from the spatial frequency domain (in units of
flux density ) to the image plane (in units of surface brightness ) Taylor et al. (1999), Guglielmetti et al. (2019): .
In practice, the spatial Fourier domain is partially and irregularly filled. The inverse problem becomes Fourier Synthesis inverse problem.
The resulting dirty image is corrupted by the incomplete sampling and the instrumental point spread function (dirty beam) , with the dirty beam being a function of the uv sampling.
The dirty beam is the instrumental response of an observation and it is characterized by strong sidelobes corrupting the image.
Deconvolution of the dirty image from the dirty beam results in an image with a flux distribution corrupted by an additional instrumental response, named primary beam .
The primary beam expresses the sensitivity of the instrument as a function of direction, with typically being most sensitive at the phase centre and dropping off away from the pointing
direction. The primary beam effects are, traditionally, removed by dividing the deconvolved image by an average primary beam pattern.
The effect of this process in the final corrected image is increased image noise towards the map edge.
Sampling and point spread functions vary with the observation setup.
2.1 RESOLVE for Bayesian signal inference
Given the ill-posedness of the imaging task, the RESOLVE algorithm (Junklewitz et al., 2016; Greiner et al., 2016; Arras et al., 2018) reconstructs images from the detected signal assuming a Gaussian likelihood and a Fourier space response function. The detected signal is described by the measurement equation , with describing the real sky signal corrupted by the instrumental response and additional noise contaminating the real sky signal. The statistical description of the real brightness distribution occurs by inferring the most probable signal given the measured visibility function . Information field theory (Enßlin et al., 2009; Enßlin, 2013) is used connecting statistical field theory and Bayesian inference. The posterior probability density function of the celestial signal given the observed data is related to the information Hamiltonian :
| (2) |
where the partition function and . is the path integral defined as the continuum limit of the
product of integrals over every image pixel Arras et al. (2018). Additionally, the technique is capable of inferring the signal covariances of the sky brightness distribution,
the noise level of each data point and the power spectra of . Products of the data analysis are the reconstructed signal and uncertainty maps, the power spectrum and estimates of the initial input parameters.
Originally designed to detect spatially extended source brightness distributions Junklewitz et al. (2016), RESOLVE was subsequently delivered with a speed up procedure while introducing
a Bayesian estimation of the measurement uncertainty of the visibilities into the imaging Greiner et al. (2016). In Arras et al. (2018), the optimization procedure of the technique was refined
allowing the noise level of each data point to be learned simultaneously with the map reconstruction. The main advantage is convergence speed up to the optimal solution in a high-dimensional space.
Calibration and imaging procedures were introduced as one unique algorithm by Arras (2021), allowing for error propagation.
RESOLVE comes with its own python library (see e.g. Reinecke et al. ) and the software is continuously evolving.
RESOLVE proved to be superior for extended and faint emission detection on the Very Large Array radio data with respect to the traditional CLEAN method Arras et al. (2021). CLEAN is a CASA task
composed by several operating modes, allowing for the generation of images from visibilities and the reconstruction of a sky model (McMullin et al., 2007; Guglielmetti et al., 2019). Applications
of RESOLVE on ALMA data and simulated ALMA data can be found in Tychoniec (2022), this conference proceedings, where a comparison with CLEAN is provided.
|
|
 |
 |
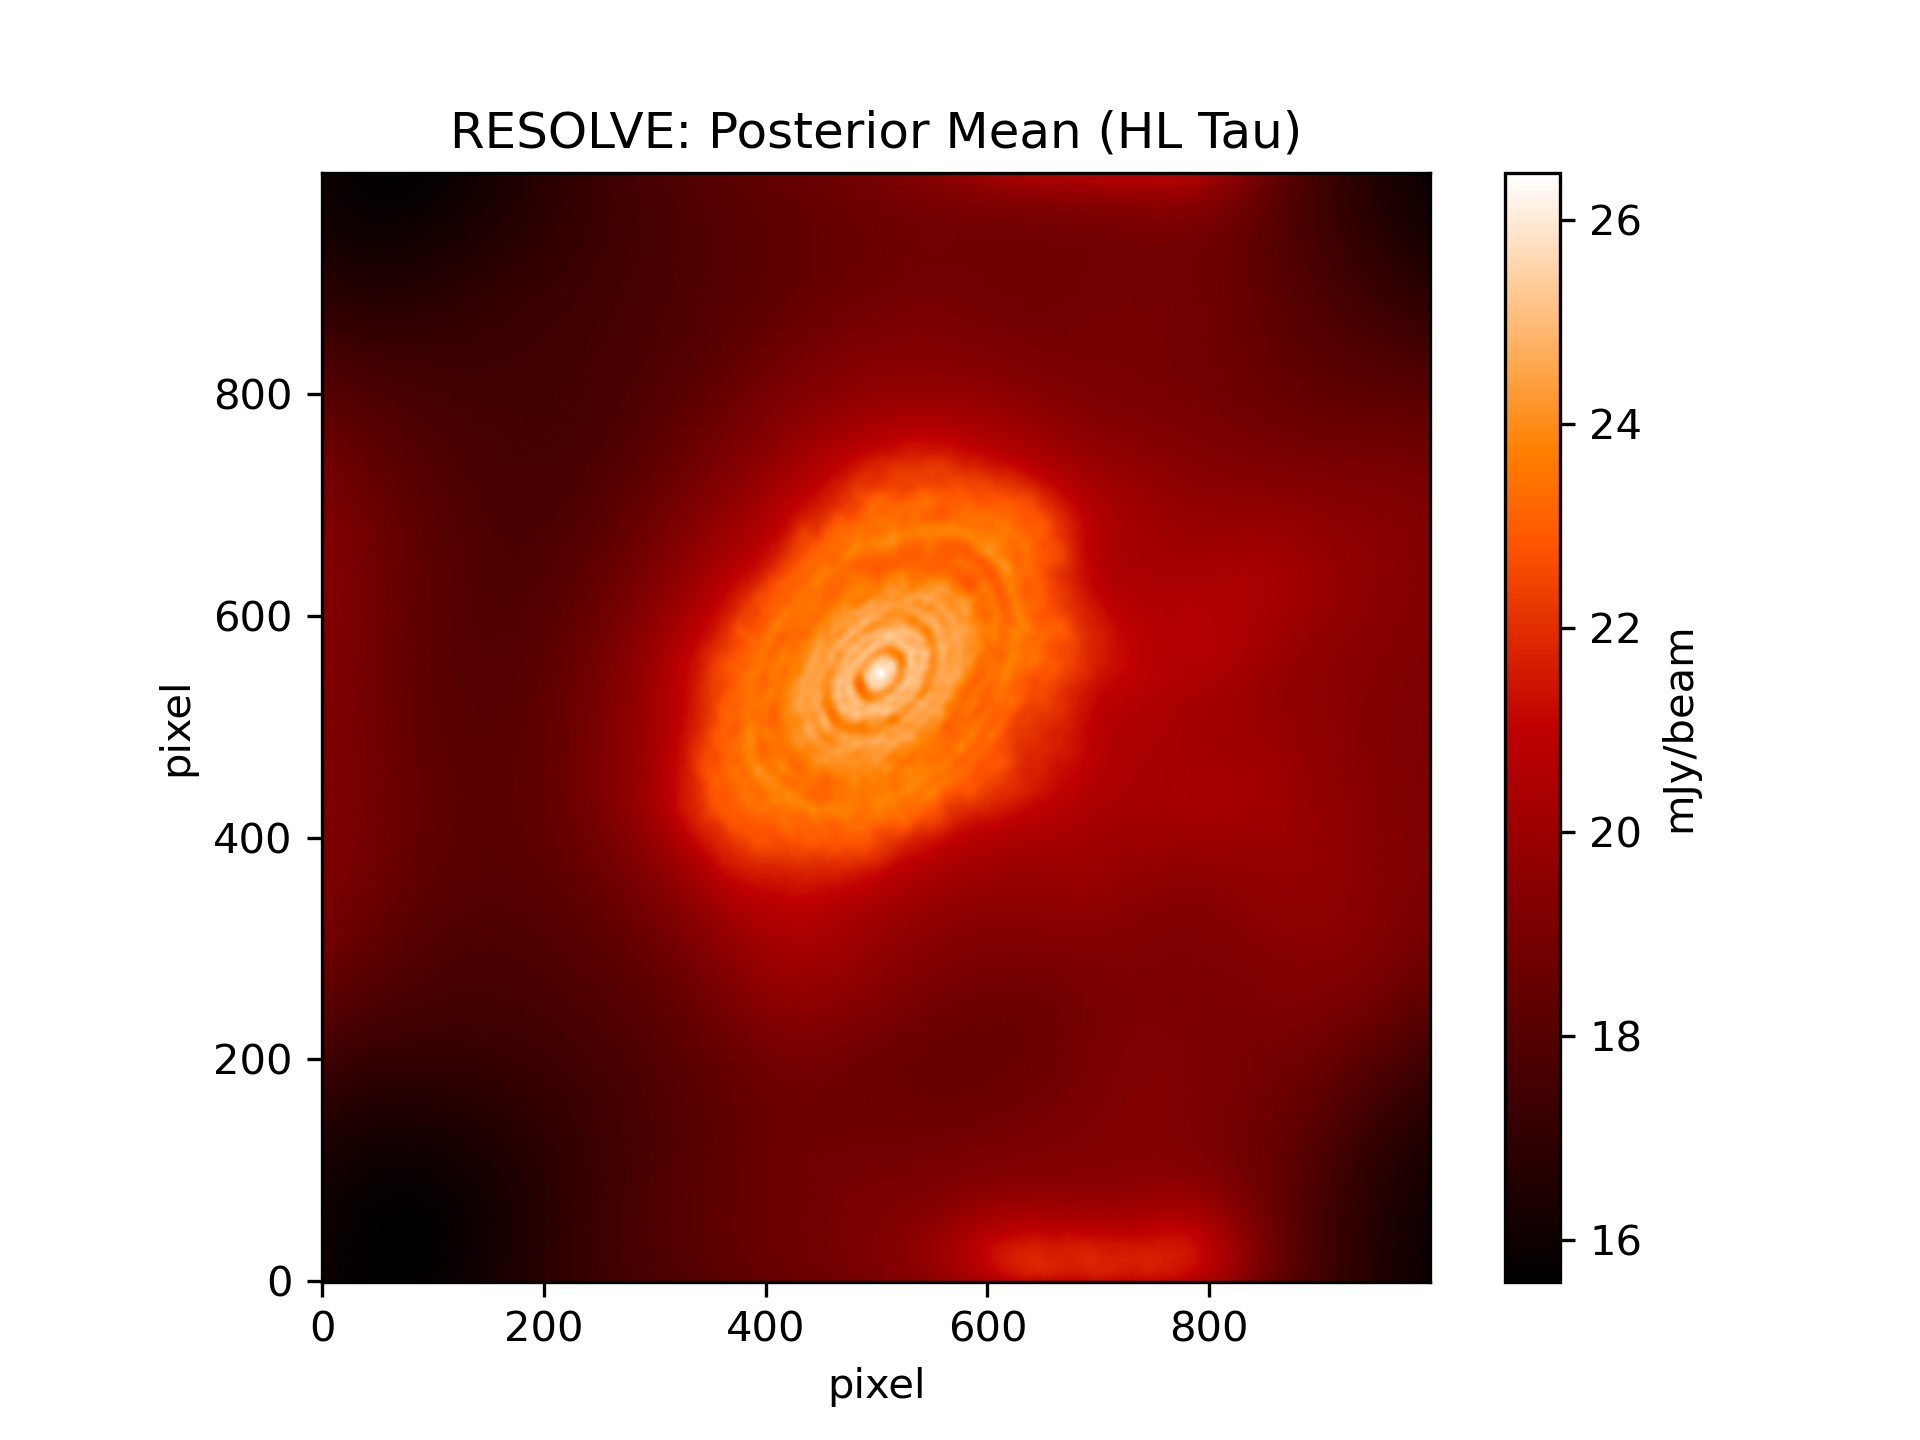
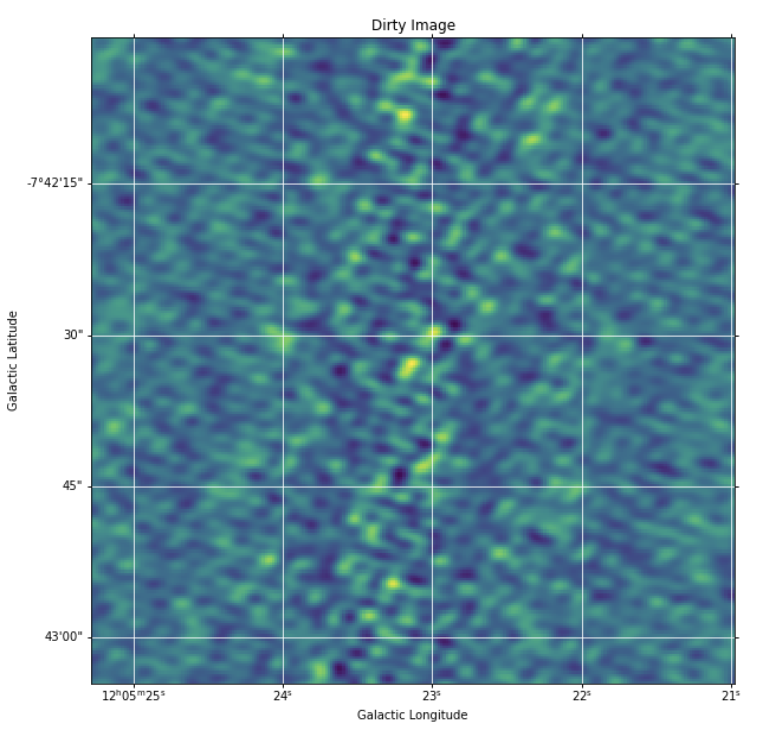
In Fig. 2, an application of RESOLVE on ALMA SV data is shown. HL Tau (, J2000) Brogan and et al (2015)
was observed in 2014 with long baselines (up to 15.2 km) employing about 30 antennas. This science target was observed for 4.5 hours allowing for
good sampling and reaching a very high angular resolution ( arcsec). Although RESOLVE is employed on a quarter of the available
band 6 data,
this application is showing the remarkable morphology of the protoplanetary disk, with patterns of alternating bright and dark rings,
confirming the finding in Brogan and et al (2015). RESOLVE is a Bayesian algorithm providing not a single reconstructed image, but a probability distribution
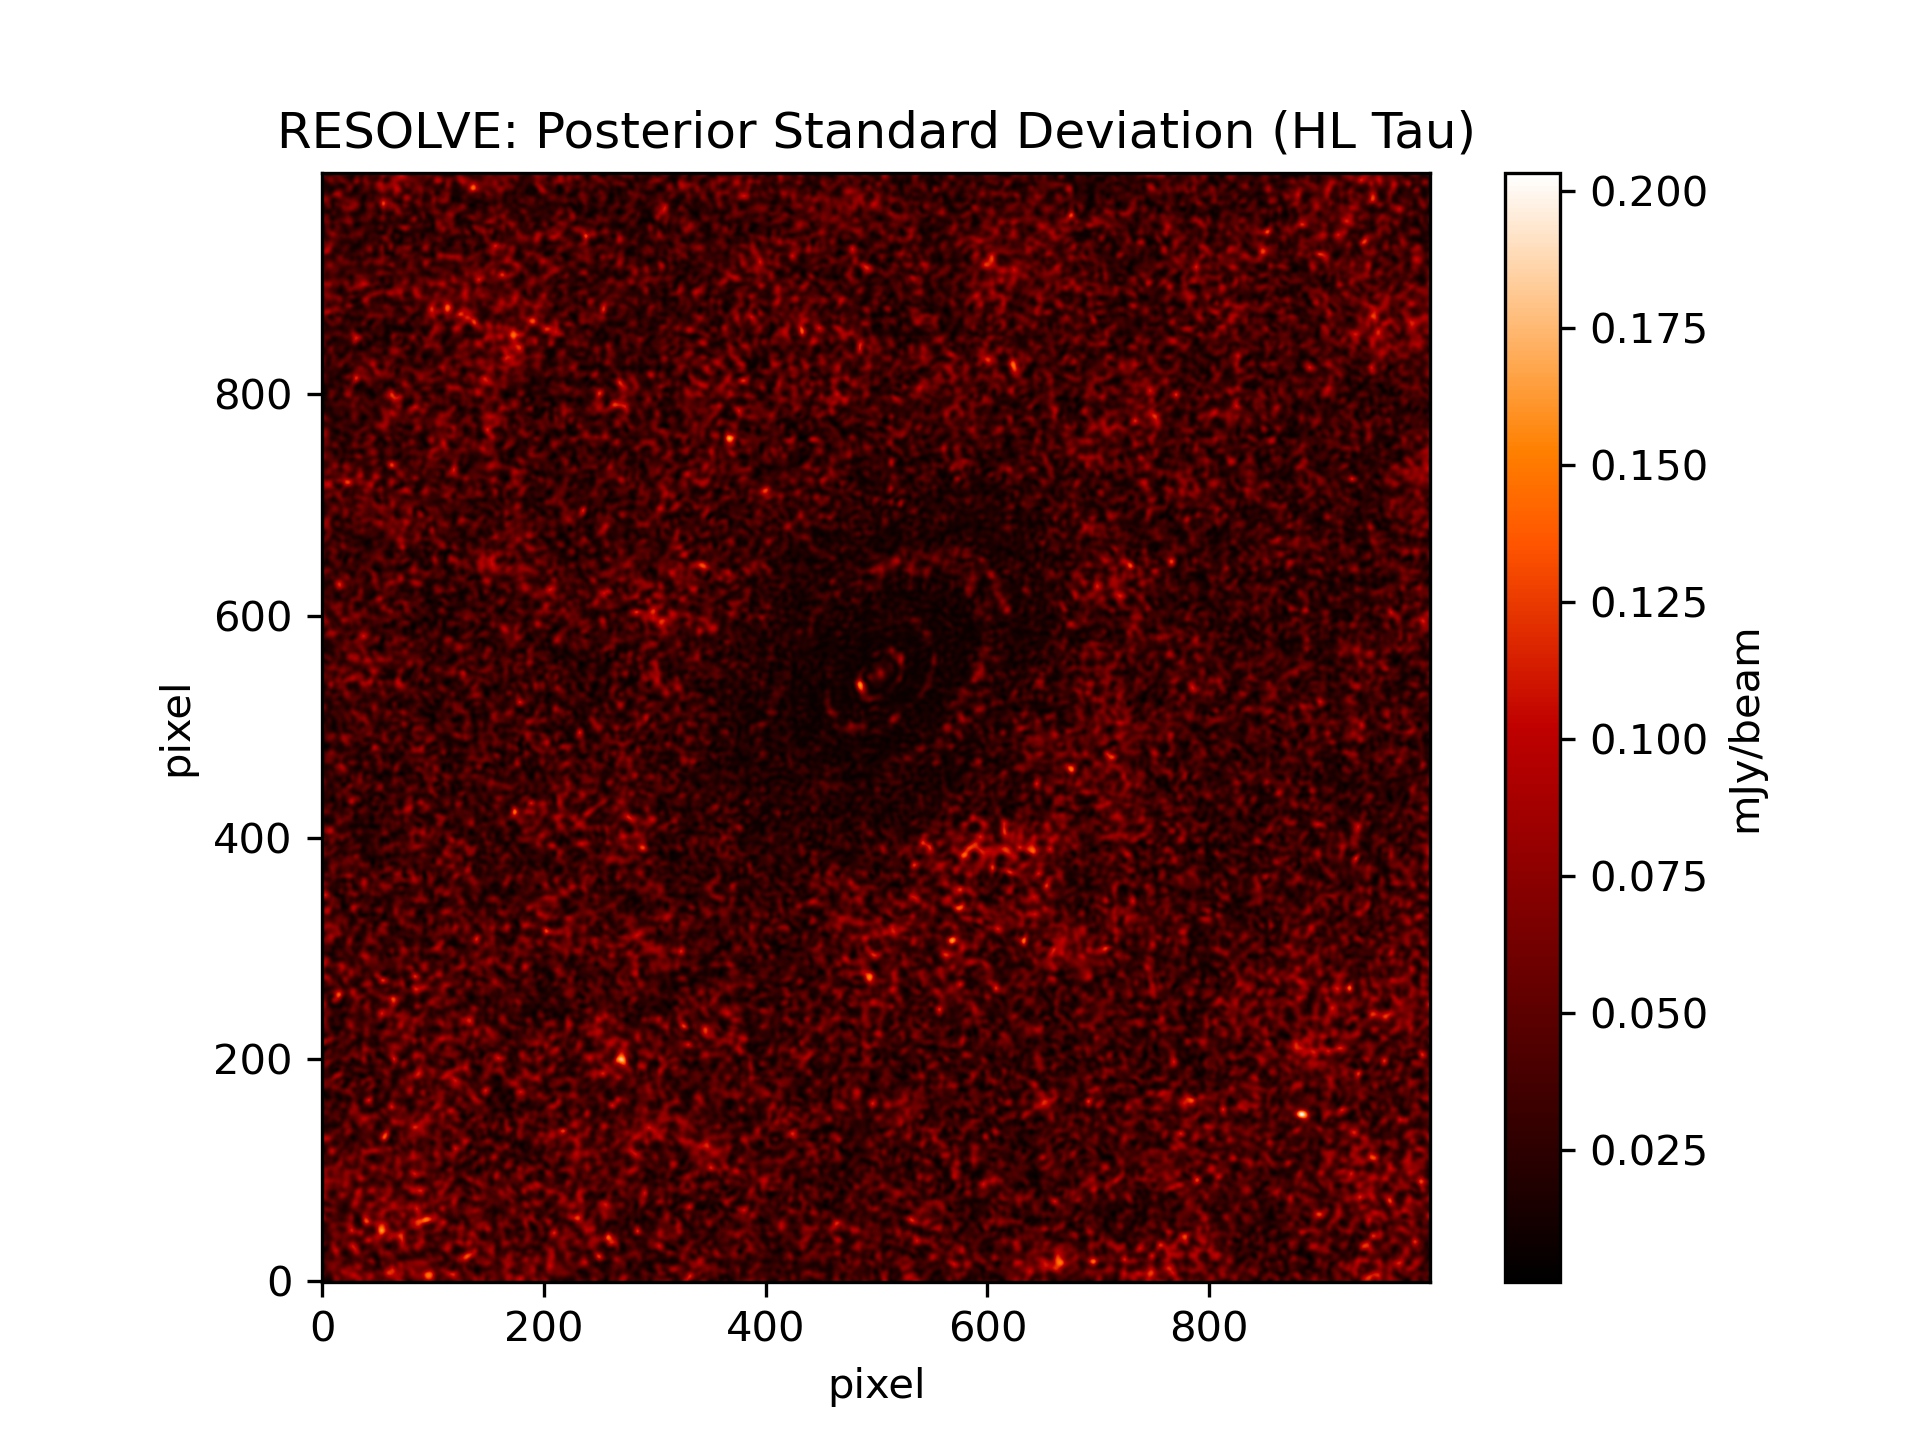
of all possible image configurations. It follows that the image reconstruction, shown in the upper left, is the posterior mean representation. The uncertainty map of the
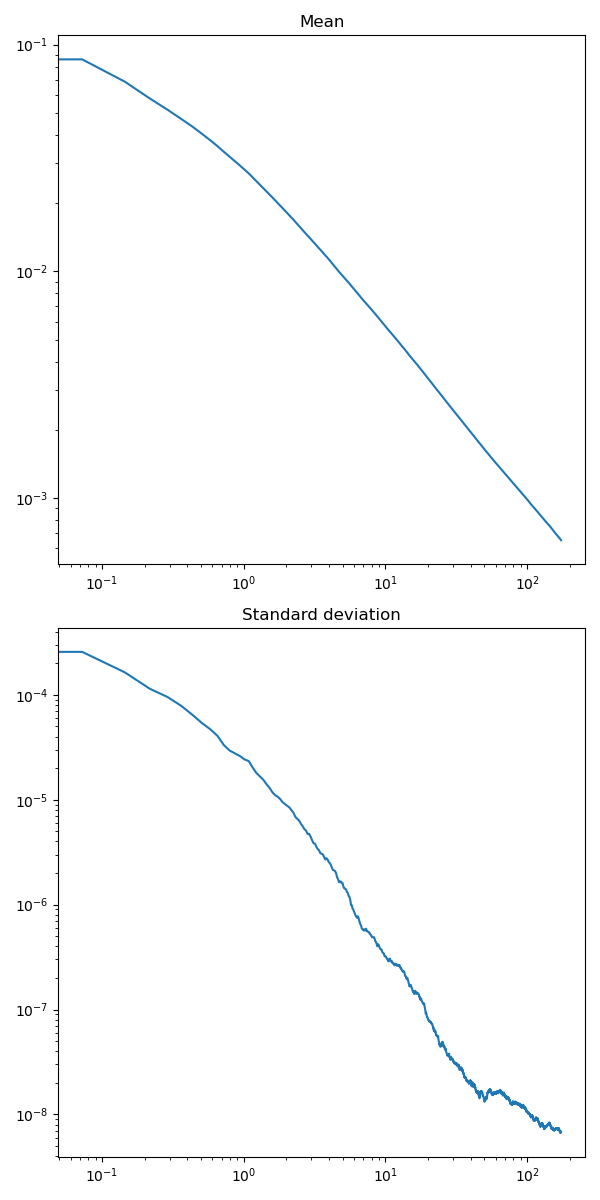
reconstructed sky image by RESOLVE is provided (lower left image). RESOLVE learns from the data the power spectrum with the sky brightness.
The posterior mean power spectrum of the log-sky brightness distribution is shown in the upper right image: the power spectrum of the process that generated the signal as a function of spatial frequency Junklewitz et al. (2016). The estimated uncertainty on the mean power spectrum is shown below (lower right image).
Because of the algorithm design, RESOLVE provides the tools for data combination (data fusion). This technique has the potential to achieve successfully the data combination challenge when the signal of all 66 ALMA antennas will form one unique data set as in view of the ALMA2030 roadmap.
2.2 Deep learning for fast image reconstruction
Supervised machine learning (ML) techniques provide powerful tools to quickly analyse large datasets and to support for easier collection and storage.
In particular, deep learning (DL) algorithms have been widely applied in many areas of astronomy due to the capacity to automate feature selection 201 (2019).
The DL Pipeline Delli Veneri (2022) (paper submitted) is developed to detect and characterize sources in ALMA cubes.
The idea is to learn the underlying features from the ALMA dirty image cubes ().
An architecture of several ML methods compose the DL Pipeline (Fig. 3): Blobs Finder, Deep GRU and ResNet.
Convolutional architectures (Blobs Finder and ResNets) are used to process spatial information. Recurrent Neural Network (Deep GRU) is employed to process
sequential information.
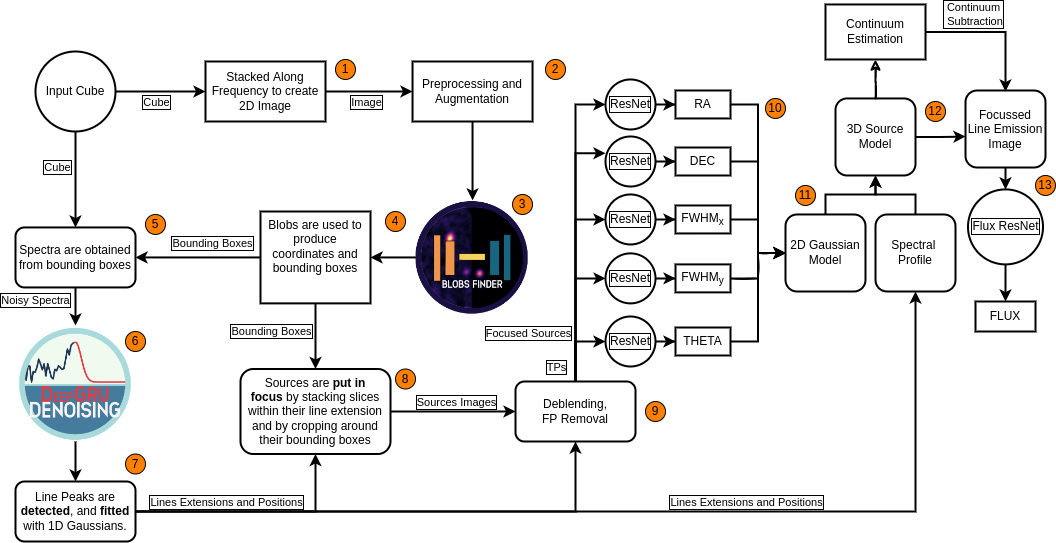
Blobs Finder is a 2D Deep Convolutional Autoencoder. Blobs Finder is used to detect sources in the ALMA images.
The Autoencoder is composed by an input encoder, performing image compression into a lower dimensional latent space, and an output decoder that decompresses from the latent space.
The latent space simplifies the data representation for the purpose to find patterns.
Image reconstruction occurs by decompressing the lower dimensional latent space, that forces the model to learn the most relevant features in the images: sources, point spread function, noise.
Blobs Finder addresses the deconvolution problem: , where is the dirty image produced integrating the ALMA
dirty cube along the frequency, represents the true sky representation,
is the intrumental response and is any additional noise.
Each detected source is analysed in frequency space in the dirty cube with the Deep Gated Recurrent Unit (GRU). Deep GRU is a Recurrent Neural Network, suited for
sequential data analysis. Deep GRU allows for internal memory about the received input with a consequent high predictive power.
It denoises the spectra extracted from the detected sources in search for (emission or absorption) lines.
Spurious signal is removed and each detected source goes through the final step.
The Residual Neural Networks (ResNet), a class of Deep Convolutional Neural Networks, are used to predict source parameters, including flux estimates.
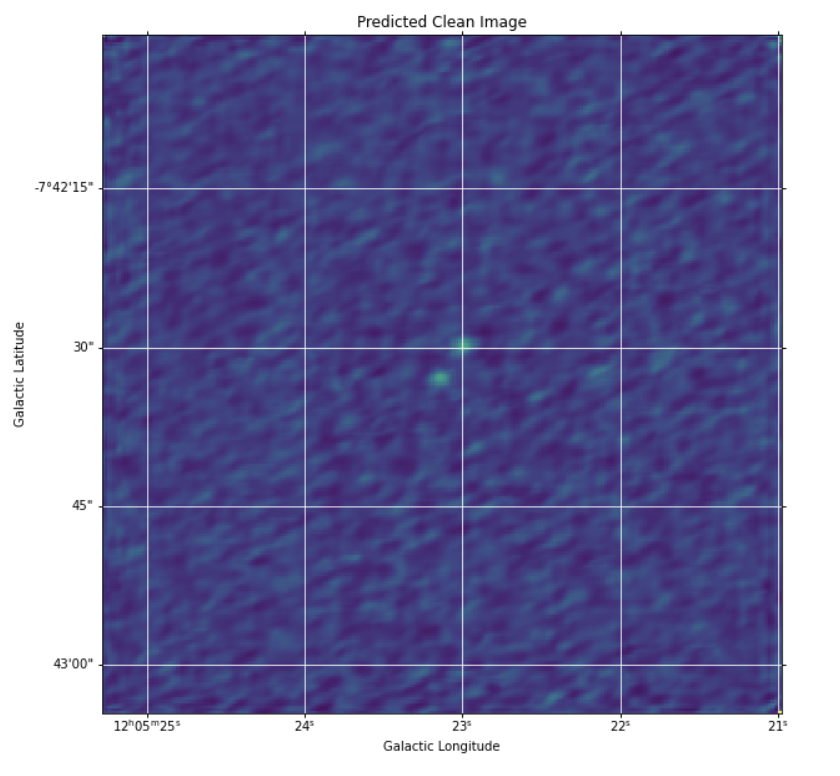
ALMA SV interferometric data are used to test the capabilities of the DL pipeline. In Fig. 4, left, the field targeting BR1202-0725 Carniani and et al (2013) observed with 18 12-m diameter antennas in 2012 is shown. The target was observed for a total time of 25 minutes during stable weather conditions and employing a maximum baseline of 280 m. In Fig. 4, right, the detected BR 1202-0725 system with the DL pipeline is shown. The submm galaxy (north) and the quasar (south) are visible () and separated by the noise and point spread function effects. The physical properties of the submm galaxy and of the quasar are summarized in table 1 of Carniani and et al (2013). The source fluxes derived by the DL pipeline agree with the ones reported in Carniani and et al (2013). The computing time for the image restoration occurred in .
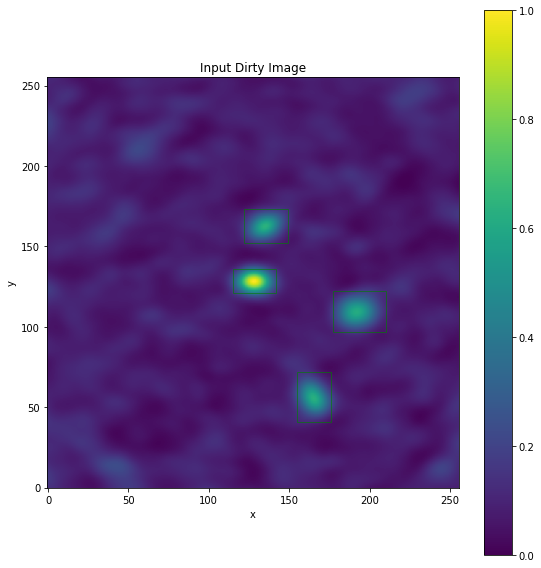
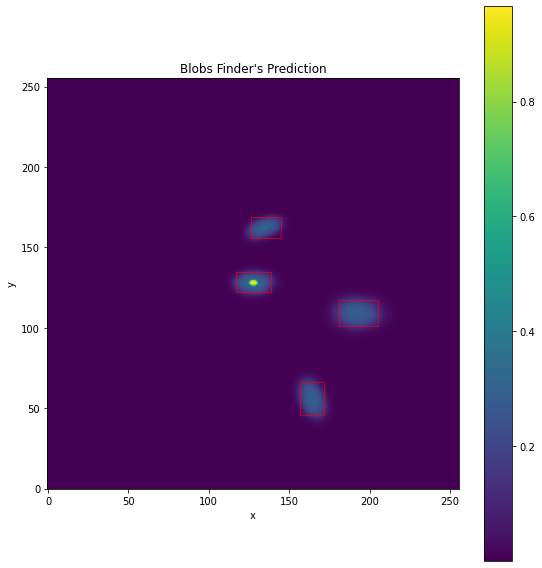
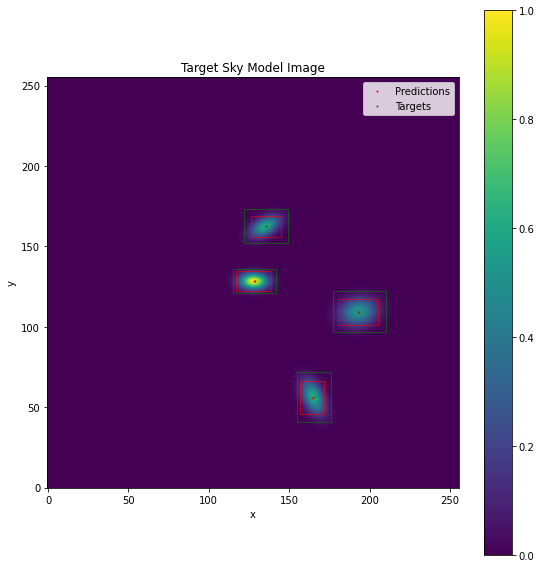
ALMA cubes have been simulated to train the algorithm in detecting galaxies. At least 1000 cubes are generated of which 4/5 are used to train the models, 1/10 to validate the models and 1/10 to test the models performance. In Fig. 5, an example of ALMA simulated dirty cube with four galaxies is shown (on the left). In this example, emission lines are randomly injected in the synthetic ALMA cubes. The image reconstruction obtained with Blobs Finder is at the center, providing a solution very close to the real simulated sky (on the right).
The algorithm is going to be trained in detecting other kinds of celestial signals and to be tested in more complex environments, e.g. serendipitous detection of obscured quasi stellar objects. Advancements on uncertainty quantification are foreseen, modifying the networks and the loss functions to allow for measurement error propagation through the pipeline.
3 Conclusions
Through this study we provide the initial exploration of concepts in the search for novel imaging techniques applicable on large data volume, thus enabling efficiency improvements in data processing while requiring the least amount of human intervention. We employ two distinct software to analyse ALMA data in view of the challenges arised by the ALMA2030 development roadmap. The two techniques are different in nature, one based on astrostatistics the other on astroinformatics Siemiginowska and et al (2019). Both techniques demonstrated to be equipped by essential strengths and by required features the Big Data era is longing.
RESOLVE is a robust algorithm, founded on a principled method. It is designed for the detection of diffuse emission. Complex structures in the celestial signal and point-like sources are well detected. The input parameter values are initialized and estimated by the data during the optimization to the most probable image configuration. The reconstructed images provide for a reliable solution with no need of extra human intervention. RESOLVE was applied on ALMA continuum images. Applications of the technique on ALMA aggregate continuum and cubes are planned. Although RESOLVE is computing expensive, the algorithm delivers in addition to the reconstructed image other informative products (as uncertainty map, power spectrum, final values of the estimated input parameters). These products have the potentials to lay the foundations for designing a fully automated pipeline.
The DL pipeline demonstrated high image fidelity and high-performance computing for image reconstruction on ALMA data cubes. The technique is applied on ALMA dirty cubes, learning from the image the celestial sources, the noise, the instrumental point spread function. It allows for extreme data compression by leveraging both spatial and frequency information. In the near future, the DL pipeline will be applied on continuum images and trained and tested on a large variety of celestial signals. Nonetheless, astroinformatics has the potential to revolutionise data management in Science Archives. ALMA is currently producing roughly 500TB worth of raw-data and reduced data products per year. Currently, 5% of the total data volume in the archive is occupied by images. The DL Pipeline may allow to create images on user demand with a one-click system through a web-interface. Moreover, catalogues creation of stored data per ALMA Cycle is feasible in an automated fashion.
As a conclusive remark, based on the current investigations, RESOLVE is the algorithm of choice for robust diffuse emission and faint source detection while the DL Pipeline implemented within CLEAN will meet the feasibility requirements of ALMA2030 performance algorithm. Because of the planned upgrades, ALMA image analysis strives for algorithms capable of discovering through the data, to adapt when given new data and to get the most out of the data.
This research is supported by an ESO internal ALMA development study investigating interferometric image reconstruction methods.
References
References
- Wootten and Thompson (2009) Wootten, A.; Thompson, A.R. The Atacama Large Millimeter/Submillimeter Array. Proceedings of the IEEE 2009, 97, 1463–1471. doi:\changeurlcolorblack10.1109/JPROC.2009.2020572.
- Cortes, P. and et al (2021) Cortes, P..; et al. ALMA Cycle 8 2021 Technical Handbook, 2021. doi:\changeurlcolorblack10.5281/zenodo.4612218.
- Huang and et al (2016) Huang, Y.; et al. The Atacama Large Millimeter/sub-millimeter Array band-1 receiver. Modeling, Systems Engineering, and Project Management for Astronomy VI; Angeli, G.Z.; Dierickx, P., Eds., 2016, Vol. 9911, Society of Photo-Optical Instrumentation Engineers (SPIE) Conference Series, p. 99111V, [arXiv:astro-ph.IM/1612.00893]. doi:\changeurlcolorblack10.1117/12.2232193.
- Yagoubov, P. and et al (2020) Yagoubov, P..; et al. Wideband 67-116 GHz receiver development for ALMA Band 2. A&A 2020, 634, A46. doi:\changeurlcolorblack10.1051/0004-6361/201936777.
- Carpenter et al. (2020) Carpenter, J.; Iono, D.; Kemper, F.; Wootten, A. The ALMA Development Program: Roadmap to 2030 2020. doi:\changeurlcolorblack10.48550/ARXIV.2001.11076.
- McMullin et al. (2007) McMullin, J.P.; Waters, B.; Schiebel, D.; Young, W.; Golap, K. CASA Architecture and Applications. Astronomical Data Analysis Software and Systems XVI; Shaw, R.A.; Hill, F.; Bell, D.J., Eds., 2007, Vol. 376, Astronomical Society of the Pacific Conference Series, p. 127.
- Taylor et al. (1999) Taylor, G.; Carilli, C.; Perley, R. Synthesis Imaging in Radio Astronomy II. 1999, Vol. 180, Astronomical Society of the Pacific Conference Series.
- Guglielmetti et al. (2019) Guglielmetti, F.; Villard, E.; Fomalont, E. Bayesian Reconstruction through Adaptive Image Notion. Bayesian Inference and Maximum Entropy Methods in Science and Engineering—MaxEnt 2019, 2019, Vol. 33, 8, pp. 95–101.
- Junklewitz et al. (2016) Junklewitz, H.; Bell, M.R.; Selig, M.; Enßlin, T.A. RESOLVE: A new algorithm for aperture synthesis imaging of extended emission in radio astronomy. Astronomy & Astrophysics 2016, 586, [arXiv:astro-ph.IM/1311.5282]. doi:\changeurlcolorblack10.1051/0004-6361/201323094.
- Greiner et al. (2016) Greiner, M.; Vacca, V.; Junklewitz, H.; Enßlin, T.A. fastRESOLVE: fast Bayesian imaging for aperture synthesis in radio astronomy. arXiv e-prints 2016, p. arXiv:1605.04317, [arXiv:astro-ph.IM/1605.04317].
- Arras et al. (2018) Arras, P.; Knollmüller, J.; Junklewitz, H.; Enßlin, T.A. Radio Imaging With Information Field Theory. arXiv e-prints 2018, p. arXiv:1803.02174, [arXiv:astro-ph.IM/1803.02174].
- Enßlin et al. (2009) Enßlin, T.A.; Frommert, M.; Kitaura, F.S. Information field theory for cosmological perturbation reconstruction and nonlinear signal analysis. Physical Review D 2009, 80, 105005, [arXiv:astro-ph/0806.3474]. doi:\changeurlcolorblack10.1103/PhysRevD.80.105005.
- Enßlin (2013) Enßlin, T. Information field theory. Bayesian Inference and Maximum Entropy Methods in Science and Engineering: 32nd International Workshop on Bayesian Inference and Maximum Entropy Methods in Science and Engineering; von Toussaint, U., Ed., 2013, Vol. 1553, American Institute of Physics Conference Series, pp. 184–191, [arXiv:astro-ph.IM/1301.2556]. doi:\changeurlcolorblack10.1063/1.4819999.
- Arras (2021) Arras, P.A. Radio interferometry with information field theory, 2021.
- (15) Reinecke, M.; Steininger, T.; Selig, M. NIFTy – Numerical Information Field TheorY.
- Arras et al. (2021) Arras, P.; Bester, H.L.; Perley, R.A.; Leike, R.; Smirnov, O.; Westermann, R.; Enßlin, T.A. Comparison of classical and Bayesian imaging in radio interferometry. Astronomy & Astrophysics 2021, 646, A84. doi:\changeurlcolorblack10.1051/0004-6361/202039258.
- Tychoniec (2022) Tychoniec, L. Bayesian statistics approach to imaging of aperture synthesis data: RESOLVE meets ALMA. International Conference on Bayesian and Maximum Entropy methods in Science and Engineering, 2022, number 67.
- Brogan and et al (2015) Brogan, C.L.; et al. THE 2014 ALMA LONG BASELINE CAMPAIGN: FIRST RESULTS FROM HIGH ANGULAR RESOLUTION OBSERVATIONS TOWARD THE HL TAU REGION. The Astrophysical Journal 2015, 808, L3. doi:\changeurlcolorblack10.1088/2041-8205/808/1/l3.
- 201 (2019) Realizing the potential of astrostatistics and astroinformatics. Bulletin of the American Astronomical Society, 2019, Vol. 51, p. 233, [arXiv:astro-ph.IM/1909.11714].
- Delli Veneri (2022) Delli Veneri, M. 3D Detection and Characterisation of ALMA Sources through Deep Learning. (submitted to MNRAS) 2022.
- Carniani and et al (2013) Carniani, S.; et al. Strongly star-forming rotating disks in a complex merging system at z = 4.7 as revealed by ALMA. Astronomy & Astrophysics 2013, 559, A29, [arXiv:astro-ph.CO/1308.5113]. doi:\changeurlcolorblack10.1051/0004-6361/201322320.
- Siemiginowska and et al (2019) Siemiginowska, A.; et al. The Next Decade of Astroinformatics and Astrostatistics. Bulletin of the American Astronomical Society 2019, 51, 355, [arXiv:astro-ph.IM/1903.06796].