Ionising Feedback Effects on Star Formation in Globular Clusters with Multiple Stellar Populations
Abstract
Using 3D radiation-hydrodynamical simulations, we study the effects of ionising radiation on the formation of second-generation (SG) stars in Globular Clusters (GCs) with multiple stellar populations. In particular, we focus on massive () and young (40-Myr old) GCs. We consider stellar winds from asymptotic giant branch (AGB) stars, ram pressure, gas accretion onto the cluster, and photoionisation feedback of binary stars. We find that the stellar luminosity is strong enough to warm and ionise the intracluster medium, but it does not lead to a significant gas expulsion. The cluster can thus retain the ejecta of AGB stars and the accreted pristine gas. In addition, efficient cooling occurs in the central region of the cluster within from the formation of first generation stars, leading to the formation of SG stars. Our results indicate that the inclusion of photoionisation does not suppress SG formation, but rather delays it by about . The time delay depends on the density of the pristine gas, so that a denser medium exhibits a shorter delay in star formation. Moreover, photoionisation leads to a modest decrease in the total SG mass, compared to a model without it.
keywords:
Globular clusters: general - stars: formation - methods: numerical - hydrodynamics - radiative transfer1 Introduction
Photometric and spectroscopic studies of globular clusters (GCs) over the past decade have led to the discovery that all old GCs, with a few exceptions such as Ruprecht 106 (e.g. Villanova et al. 2013; Frelijj et al. 2021), are composed of at least two stellar populations with different chemical compositions. The stellar population having the same compositions as field stars at the same metallicity [Fe/H], is referred to as the first generation (FG) or first population (Bastian & Lardo, 2018).
The second generation (SG) or second population, however, shows anomalies in the abundance of light elements, i.e. stars are enriched in He, Na, N and Al and are depleted in C and O (Minniti et al., 1993; Carretta et al., 2009; Gratton et al., 2013). Such anomalous abundances in stars are found to be unique to GCs and an intrinsic property of them. In particular, it is found that almost all old clusters with a present-day mass larger than show an anti-correlation between the abundance of Na and that of O (Carretta et al., 2010). The Na-O anti-correlation and the existence of multiple stellar populations (MSPs), can be considered as the definition of a bona fide GC (e.g. Carretta et al. 2010). It can effectively separate GCs from their younger and less massive counterparts, namely open clusters, which do not show any sign of the Na-O anti-correlation (Pancino et al., 2010; Carretta et al., 2010; Bragaglia et al., 2013; Bragaglia et al., 2014), and therefore are comprised of only a single population of stars.
In a number of GCs, where resolution allows, the abundance anomalies are accompanied by splits in the colour-magnitude diagram (CMD). All these pieces of evidence signify self-enrichment in GCs, where SG stars have formed in a medium composed of pristine (unprocessed) gas111The gas that has the same chemical compositions as the material from which the FG stars are formed., mixed with products of CNO cycling and p-capture processes at high temperatures. The pristine gas can be left over from the formation of FG stars or accreted later on. In either case, it cannot have been polluted with the ejecta of supernovae (SNe) since most present-day GCs show very little spread in heavy elements such as iron (Renzini et al., 2015). Stars in some GCs such as Cen exhibit significant enrichment by SNe. These cases are in minority and are believed to have an exotic origin, i.e. they could be remnants of satellite dwarf galaxies captured by the Milky Way or merging events (e.g. Bekki & Freeman 2003).
The formation of the second generation population is still shrouded in mystery. Some scenarios suggest that they are multiple generations of star formation formed from different materials within star clusters (Bekki et al., 2017; Bekki, 2019). FG stars whose winds are slow enough to be retained in GCs, and have the right chemical compositions to enrich the intracluster medium222This should not be confused with the intracluster medium in the context of galaxy clusters. (ICM) and explain the present-day observed abundance patterns could be the origin of SG stars. Candidates for such FG stars are massive binaries (; de Mink et al. 2009; Szécsi et al. 2018), fast-rotating massive stars (; Decressin et al. 2007a, b; Krause et al. 2013), supermassive stars (; Denissenkov & Hartwick 2014; Denissenkov et al. 2015); asymptotic giant branch (AGB) stars (; D’Ercole et al. 2008; Conroy & Spergel 2011; D’Ercole et al. 2016; Bekki 2017).
Despite being successful in some aspects, all proposed scenarios suffer from several shortcomings. First, none of the scenarios are able to precisely reproduce the observed abundance patterns in GCs with MSPs (Bastian et al., 2015; Renzini et al., 2015). Second, present-day GCs possess approximately equal numbers of FG and SG stars. Assuming a canonical Kroupa (2001) IMF for stars, the ejecta of FG stars and available pristine gas are not sufficient to produce a large number of SG stars. This is referred to as the mass-budget problem. Unless one assumes very extreme conditions such as a binary fraction close to unity, or a significant loss of (only) FG stars ( or more), this problem cannot be readily solved. For example, in the scenarios based on (fast-rotating) massive stars, a substantial amount of gas needs to be present in the GCs and the gas has to be expelled over an extremely short time scale of . As a result, stars within the cluster cannot adjust their overall velocity distribution in response to the instantaneous or impulsive mass loss and the cluster can lose of its FG stars (Khalaj & Baumgardt, 2015, 2016). Such short gas expulsion time scales can only be achieved by powerful agents such as hypernovae and dark remnants (Krause et al., 2013; Khalaj & Baumgardt, 2016). Third, one needs to fine-tune the timing of the formation of SG stars. For example in scenarios based on massive and very massive stars, the SG stars are assumed to be formed within a short time scale of about (Krause et al., 2013) after the formation of FG stars, i.e. before they start exploding as type II SNe. In contrast, in the scenarios based on intermediate-mass stars (such as the AGB scenario) the second population cannot form until after . The last point is also an issue for the scenario of the early-disc accretion set forth by Bastian et al. (2013). Although this scenario does not suffer from the mass-budget problem, the circumstellar discs around accreting stars need to survive for up to (Bastian et al., 2013). In harsh environments, such as GCs with a dense core and strong feedback (Calura et al., 2015), it is not clear whether these discs can survive over such a timescale. Moreover, this scenario predicts a continuous spread of stars in the CMD, whereas the observed GCs show (two or more) distinct evolutionary tracks in the CMD, which is indicative of different episodes of star formation. Therefore, the formation of MSPs in GCs has not been completely solved and remains as an open question.
Among proposed scenarios, the AGB scenario (D’Ercole et al., 2008, 2016) has received much attention in the literature and is the focus of the present paper. According to the standard model of the AGB scenario laid out in D’Ercole et al. (2016), SG stars cannot form until all Type II SNe of the FG stars have gone off and the cluster has expelled the SN ejecta containing Fe-rich material. This corresponds to after the formation of the star cluster (FG stars), i.e. when the massive AGB stars begin injecting their enriched ejecta into the ICM. Concurrently, the cluster accretes pristine gas from the surrounding interstellar medium (ISM) as it moves through its host galaxy. To accrete the required amount of pristine gas for the SG formation, the gravitational potential of the cluster has to overcome the ram pressure exerted by the ISM on the ICM (Lin & Murray, 2007; Conroy & Spergel, 2011). Lin & Murray (2007) showed that if a cluster has a central velocity dispersion greater than both the sound speed of the ISM and the relative cluster-ISM speed, gravity dominates the ram pressure and the cluster can accrete a significant amount of the ISM. The amount of pristine gas accumulated in such a cluster depends on the properties of the ISM and the cluster (Naiman et al., 2011).
Recently, Calura et al. (2019), hereafter (C19), conducted a comprehensive study of the formation of SG stars in a very massive () cluster moving in the ISM based on the standard AGB scenario (D’Ercole et al., 2016). In addition to the ram pressure addressed by previous studies, they took into account other physical processes such as radiative cooling, self-gravity, star formation and stellar winds from AGB stars. In particular, they utilized three-dimensional (3D) hydrodynamic simulations, and demonstrated that a very massive cluster can both retain its AGB ejecta and accrete pristine gas, forming a large number of SG stars. Intriguingly, in their simulations, two sub-populations of SG stars with different helium abundances were formed, which is in agreement with observations. In Yaghoobi et al. (2022) we extended the work of C19 to a range of cluster masses in and showed that a cluster could also form a massive SG. However, this is not the case for a cluster, due to its weaker gravitational potential. After performing approximate corrections for long-term dynamical evolution, we found a positive correlation between the SG fraction and the cluster mass in the simulations done in the high-density () medium. Moreover, we found a similar correlation for the maximum He enhancement of SG stars. Both these results are in agreement with observations (e.g. Lagioia et al. 2019; Milone et al. 2020). Using a similar setup to ours, Lacchin et al. (2021) investigated the role of Type Ia SN explosions in the SG formation and found that these explosions are not able to significantly limit star formation in this high-density medium. All of these findings, imply that the formation of SG stars in the AGB scenario (D’Ercole et al., 2016), needs to occur in dense environments. In spite of this milestone, there are still more physical processes to be incorporated in the simulations, one of the most important ones being related to star formation and the associated stellar radiation.
Massive stars in star clusters radiate with high luminosities at young cluster ages. The emitted photons get absorbed by the ICM gas. This heats up the ICM and increases its pressure (Conroy & Spergel, 2011; Gavagnin et al., 2017; Chantereau et al., 2020). As a result, radiation may play a non-negligible role in the gas expulsion from clusters and inhibiting the formation of SG stars. Chantereau et al. (2020) showed that stellar radiation of present-day GCs can be enough to expel the ICM, including the gas accreted from the ISM and stellar winds, from the cluster. According to the outcome of their simulations, the radiative heating along with ram pressure can explain the observed negligible amount of gas in the core of present-day GCs. Moreover, Kroupa et al. (2018) propose that the ionising feedback of O stars can explain the formation of multiple coeval populations separated in age by about in very young clusters with a mass range of [-]. According to this model, the stellar feedback is able to ionise and expel the residual gas from the centre of the cluster and reduce the FG formation. But the infall of molecular gas can resume star formation within the cluster and form another population. For a very massive cluster, Wünsch et al. (2017) also show that self-shielding against ionising radiation can occur before , resulting in an efficient cooling and then the formation of subsequent generations of stars.
In the case of FG formation from low-mass clouds, Gavagnin et al. (2017) showed that photo-ionisation feedback is able to expel most of the gas within and effectively lowers the star formation efficiency. In addition, it considerably reduces the stellar density of the cluster and limits gas accretion on very massive stars. As a result, star formation is suppressed a few after the cluster formation and the high-mass end of the stellar mass function is suppressed due to radiation. On the other hand, stellar spectral synthesis models (Eldridge et al., 2017; Leitherer et al., 1999; Conroy et al., 2009) show that the luminosity of a population of stars decreases by several orders of magnitude within the first . This fact raises the question of whether star formation in the presence of ionising feedback can be triggered again after this time. Using a simple model, Conroy & Spergel (2011) estimate the role of radiative heating in the formation of SG stars. They predict that only after a delay of several can the gas within a young GC cool down to ideal conditions which trigger SG formation. Such a delay, caused by radiative heating, could pose a severe problem for the AGB scenario (Bastian & Lardo, 2018).
However, the cooling process depends on gas properties that change over the cluster lifetime. For example, the gas density within the core of a massive cluster is expected to increase after (C19), due to the winds of the AGB stars and gas accretion from the ISM. Therefore, an efficient cooling process might also occur before .
The present paper is a follow-up to C19. We investigate the role of stellar radiative feedback in the formation of SG stars in the context of the AGB scenario. We study the role of ionising radiation in the gas accretion and the retention of stellar winds in GCs. The paper is organized as follows. In Section 2 we describe the numerical methods and main assumptions that we use for our simulations. In Section 3, we present the results of our two simulations for different ISM densities and finally in Section 4 we discuss and summarise our results.
| Simulation | MFG | RT | ||
|---|---|---|---|---|
| RT-Infall24 | 21 | On | ||
| RT-Infall23 | 1 | On | ||
| NoRT-Infall24 | 21 | Off | ||
| NoRT-Infall23 | 1 | Off |
2 Model description
We perform our simulations using Ramses-rt (Rosdahl et al., 2013; Rosdahl & Teyssier, 2015), a radiative hydrodynamics extension of Ramses (Teyssier, 2002). The code uses a second-order Godunov scheme to solve the Euler equations and a particle-mesh solver to compute the dynamical evolution of particles. The setup of our simulation is almost the same as C19, but with the difference that we include ionising radiation using the radiative transfer methods described in Rosdahl et al. (2013). To recap, we simulate a cluster with a mass of and a half-mass radius of placed in a homogeneous gas with a uniform density. We consider two models with different ISM (gas) densities of , corresponding to a typical dwarf galaxy (Marcolini et al., 2003), and a density of , corresponding to star-forming galaxies at high redshifts (Wardlow et al., 2017). We refer to these models, including the ionising feedback, as RT-Infall23 and RT-Infall24, respectively. For a better comparison between the results of radiative hydrodynamics simulations (RT) and those of non-radiative (NoRT) cases, we simulate two models without radiation, referred to as NoRT-Infall24 and NoRT-Infall23. Table 1 lists our main simulations and their associated parameters.
In C19, the simulations volume was a cube with a width of . In the current simulations, we find that this volume was too small for the results to converge, due to the photoionisation expansion of gas beyond the boundaries. Therefore, we consider a larger box of so that the regions affected by radiation in our simulations will be better confined within our computational volume. The total volume of our simulation box is . We mesh this box into a coarse grid with a maximum cell size of , corresponding to the minimum level in the Ramses code, and a minimum cell size , i.e. . The code adaptively refines when the total mass inside a cell exceeds . We find this resolution and refinement scheme to be sufficient for our results to convergence. For the sake of simplicity, we model the gravity from the FG stars as a static (Plummer, 1911) potential and omit the dynamical evolution of the FG stars. The total mass of FG stars therefore does not change over time during our runs.
2.1 Initial conditions
Following the AGB model presented in D’Ercole et al. (2016), we start our simulations at after the formation of the cluster. At this time, all SN explosions of FG stars have subsided, resulting in a hot bubble of diffuse gas formed around the cluster. Therefore the bubble is assumed to have already reached a stagnation radius from the cluster center, where the expansion velocity of the bubble is equal to the velocity dispersion of the ISM. This radius is denoted by and depends on the properties of the cluster and ISM, such as cluster mass, ISM density and velocity of the cluster with respect to the ISM (see C19 for more details). Thus the cluster is not initially in direct contact with the ISM as the region inside the hot bubble () is filled with a low-density gas () formed by SNe ejecta and is in hydrostatic equilibrium with the cluster. By ignoring the dynamical instabilities of the bubble such as radiative Rayleigh–Taylor instability (Jacquet & Krumholz, 2011; Yaghoobi & Shadmehri, 2018), we can assume that the cluster traverses the radius of and arrives at the interface of the ISM at time , after which it starts accreting pristine gas from the ISM. In our setup, it is assumed that the relative speed of the cluster with respect to the ISM is and remains constant. This is a typical value for clusters in strongly interacting systems such as the Antennae galaxies (Whitmore et al., 1999; Gilbert & Graham, 2007). Following the approach explained in C19, we estimate the values of to be and for the RT-Infall24 and RT-Infall23 cases, respectively. These time scales are measured from the formation time of the cluster (FG stars). Given that all simulations start at after the FG formation, the cluster reaches the ISM at simulation times of (low density) and (high density).
We perform the simulations in the reference frame of the cluster, i.e. the centre of the cluster always lies still at the centre of the box and ISM gas moves in from the side at the assumed velocity of the cluster after the time of .
2.2 Stellar winds of FG stars
In general, the properties of stellar winds are complex functions of the mass, metallicity, and age of the stars they originate from, i.e. the AGB stars in our case. Our approach to factor the wind ejecta of the AGB stars into our simulations is as follows. Starting from after the formation of FG stars, we progressively inject enriched material into the simulation cells, at a rate which depends on the age and mass of the FG stars in each cell. The rate is given by the following relation
| (1) |
where is the FG mass density as a function of radius from the cluster centre. and is the specific injection rate. For a typical cluster with a canonical Kroupa (2001) IMF, it is given by (Ciotti et al., 1991), where is the time after the FG formation measured in . Following C19, the rate of energy injection into the cells is assumed to be:
| (2) |
where is the one-dimensional velocity dispersion of the cluster, is the wind velocity of the AGB stars and is the local gas velocity (D’Ercole et al., 2008). We assume a wind velocity and a metallicity of .
The ejecta from the AGB stars contain a significant amount of helium as well as products of CNO processes (Renzini et al., 2015; Bastian & Lardo, 2018). However, we only focus on their helium mass fraction , varying from to (Ventura & D’Antona, 2011). We use a passive scalar to follow the He mass fraction of the gas in each cell. The mixing of the AGB ejecta and the accreted pristine gas (with ) results in a gas with intermediate He abundances from which the SG stars can form.
2.3 Star formation
We use the star formation technique developed by Rasera & Teyssier (2006). Stellar particles are formed out of the gas using a standard Schmidt (1959) law based on some specified thresholds. In our setup, when the gas has a temperature less than and it has a converging net flow stars are allowed to form. To ensure that the gas in a cell has the required conditions to trigger the star formation, we also require that the local Jeans’ length is smaller than 4 (finest) cell width, i.e. less than 2 pc. We set a minimum particle mass of and do not allow more than of the cell mass to be converted into a star particle at a given time. According to the resolution assumed in this study, this implies an effective density threshold of for star formation. In star-forming cells, gas is stochastically turned into star particles and they are placed at the centre of the cell. The mass of each stellar particle is determined as an integer multiple of the minimum particle mass, i.e. . Where is drawn from a Poisson distribution, as described in Rasera & Teyssier (2006), so that on average particles form according to the Schmidt (1959) law with a star formation timescale of Gyr. The velocity, metallicity, and He abundance of the star particles are also set to be the same as those of its natal gas. As in C19, the star formation timescale () is assumed to be in our setup.
The IMF of SGs is not known yet. However, it is commonly assumed that the mass of SG stars is lower than (e.g. Renzini et al. 2015; Khalaj & Baumgardt 2015, 2016; Calura et al. 2019; Yaghoobi et al. 2022). In support of this assumption, it is found that the gravitational potential of FG stars can suppress the formation of massive stars and can truncate the IMF of SG stars (Bekki, 2019). Therefore, we assume that the IMF of SG stars is bottom-heavy in our simulations. As a result, SG stars do not turn into Type II SNe. Assuming otherwise yields some issues for the SG formation scenarios to explain the observed results, as strong SNe feedback from massive SG stars suppresses star formation (Calura et al., 2015) after a few . This effect further reduce the number ratio of SG to FG stars, making the mass-budget problem more stringent. In addition, the gas available for star formation can be contaminated by the SN ejecta of SGs, resulting in spreads in heavy elements which is in contradiction with observations.
2.4 Radiative transfer
| Photon group | ||||
|---|---|---|---|---|
| UVHI | 18.2 | 0 | 0 | |
| UVHeI | 33.0 | 0 | ||
| UVHeII | 61.3 |
The Ramses-rt code follows the propagation of radiation and its interactions with the gas via photoionisation and heating. In this code, the radiative transfer equation is dimensionally reduced by taking the first two moments and using the M1 closure to describe the evolution of the radiation flux. The radiation interacts with hydrogen (H) and helium (He) via non-equilibrium thermochemistry and the non-equilibrium ionisation fractions of H and He are followed in every cell. The number of photons injected into every cell from stars is determined by spectral energy distribution (SED) models with respect to the mass, age, and metallicity of each stellar particles, while the photon properties (individual photon energy and cross-section) are set according to a blackbody radiation distribution.
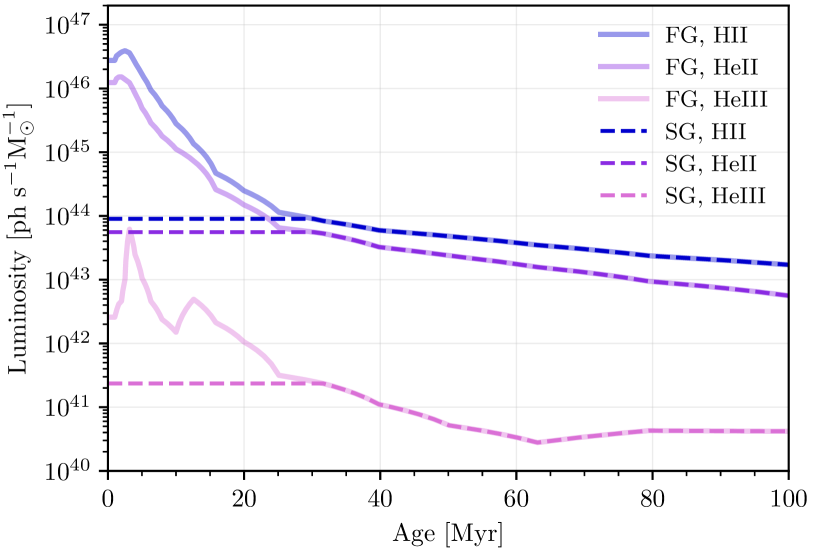
In our simulations, ionising sources include both FG and SG stars. We model the SED of the FG and SG with the binary population and spectral synthesis (BPASS) code (Eldridge et al., 2017). Initially, the FG stars are assumed to have an age of , a metallicity of and a Kroupa (2001) IMF. SG stars are assumed to have the same metallicity and SED, except that their IMF is truncated at , resulting in a constant luminosity of for the SG stars that are younger than . Such a constant luminosity can also be obtained via other spectral models, such as the Starburst99 (Leitherer et al., 1999), for a population with a bottom-heavy IMF.Figure 1 shows the assumed luminosities of FG and SG stars as a function of time in our simulations. We assume three photon groups (HI, HeI and HeII ionising photons) whose properties have been listed in Table 2, according to the assumed SED.
Owing to the explicit RT solver in Ramses-rt, the timestep length scales inversely with the speed of light, which at a full light-speed makes for orders of magnitude shorter (and therefore more) timesteps than in a pure hydro simulation. By adopting a reduced speed of light () in our simulations, Ramses-rt provides us with a moment-based approach that reduces the computational cost. We find that our results have only a marginal dependence (if any at all) on the adopted value for the speed of light.
Besides photoionisation heating, our simulations also include radiative cooling and radiation pressure. We find that the radiation pressure has no effect on SG formation, i.e. all the effects of radiation are from photoionisation heating. The metal cooling process is based on the model described in Sutherland & Dopita (1993) for cooling of gas for H, He and metal lines in temperatures K. For lower temperatures, metal cooling is assumed by Rosen & Bregman (1995) with a temperature floor of K. Finally, we consider a adiabatic index of for the ratio between internal energy and gas pressure.
3 Results
In this section, we present the results of our RT simulations including the radiative stellar feedback of both generations of stars and compare them with their corresponding NoRT cases. We investigate the role of radiation on the retention of He-rich stellar winds, gas accretion from the ISM, and SG formation.
Our simulations consist of two consecutive phases. In phase I, before the infall of pristine gas, the only injection of gas into the box is from AGB ejecta. This gas is immediately exposed to the ionising radiation from FG stars and as a result, the temperature and pressure increase everywhere inside the box. Moreover, the FG radiation is able to expand the ICM via photoionisation heating. In phase II, the cluster reaches the ISM and moves through it. In this phase, radiation in unison with ram pressure opposes the gravitational pull of the cluster (via photoionisation heating). The properties of the cluster and the ISM, such as mass and density, ultimately determine which effect dominates (Chantereau et al., 2020) and how much gas will be accreted. As stated earlier, our simulations start at the onset of the AGB ejecta, i.e. after the formation of the FG stars. They finish at , at the start of the FG Type I SNe. For simplicity, all time instances stated in the following sections are measured from (and this have a final time of ).
3.1 RT-Infall24
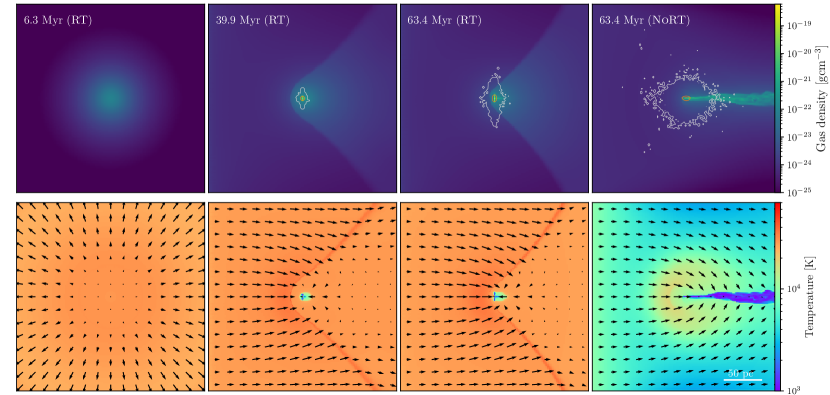
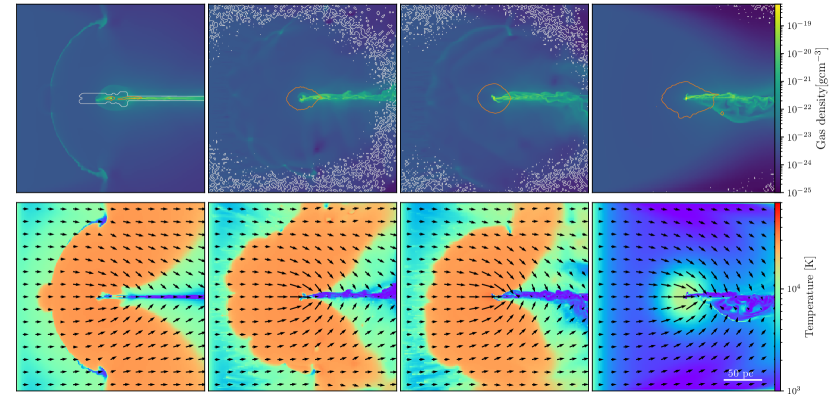
Figure 2 illustrates the time evolution of the gas (and stellar) density, temperature and velocity fields of the RT model over a time interval of . The top two rows correspond to RT-Infall24 and bottom rows correspond to RT-Infall23. For comparison, the last column on the right shows each simulation performed assuming the NoRT model.
The pristine gas reaches the center of the cluster at in RT-Infall24. The first snapshot (the top two panels of the first column) shows a density enhancement due to the injection of the He-rich stellar ejecta in the central region. Moreover, radiative heating has raised the gas temperature to over everywhere in the simulation box, leading to the gas expanding from the centre. Within the first , cooling is not sufficiently strong to overcome photoionisation heating, hence no stars are formed. As the simulation progresses, the luminosity of the FG stars gradually drops (Figure 1) while the gas injected into the box increases the central density considerably, which reduces the efficiency of the radiation in heating the gas. Combined with the fact that the cooling process depends directly on the density squared, this ultimately leads to more efficient cooling at the centre. As a result, the gas in the cluster centre cools down and SG stars start to form from He-rich gas at about in the RT case. By comparison, formation of the SG stars begins at for the NoRT case. Therefore, a delay in the star formation is the first effect of the ionising radiation on SG formation. At this point, the gas is everywhere ionised except in the centre of the box. The formation of the SG stars leads to the emission of new photons. However we find that their role in heating the gas is negligible compared to the FG radiation, since the SG mass is much lower than the FG one (and because the SG is not assumed to contain massive stars, leading to low luminosities for the SG stars). Throughout the infall of pristine gas, the FG radiation has the effect of slowing He-poor gas out which slows down the infall gas velocity. This effect counteracts ram pressure in removing the gas reservoir from the cluster. However, the gas expansion due to photo-ionisation heating causes the cross section (effective surface area) of the gas to increase, making the ram pressure more effective in stripping the ICM. As the ISM passes through the cluster center and gets accumulated, a bow shock is formed behind the cluster.
At a distribution of SG stars is visible around the center of the cluster. As the simulation progresses, the efficiency of radiation in heating the ICM reduces even further. Moreover, the ejecta of the AGB stars become even more diluted with the accreted pristine gas, resulting in the formation of SG stars with lower He abundances. At the final snapshot of our simulation (, the total mass of SG stars has grown to . This is approximately percent of the total SG mass in the NoRT case. Figure 2 shows that SG stars in the NoRT case are more extended than in the RT case. Moreover, in the RT case the ICM is still too hot to form stars, except for the very central dense region of the cluster. A gaseous tail is formed down-flow in the NoRT simulation, but the radiative feedback prevents this from forming in the RT case.
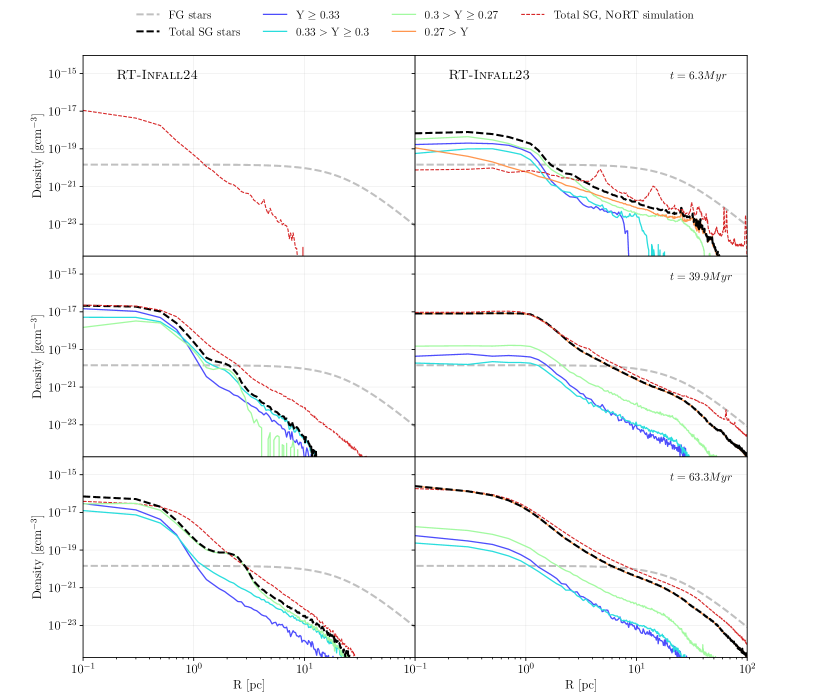
Figure 3 shows density profiles of the FG and the SG stars from the center of the cluster in the same snapshots as in Figure 2. The SG profile is split into components with different helium abundances but we also show the total SG profile, for the RT (black dashed line) and NoRT (red dashed line) cases. The bottom-left panel shows a slight difference between final SG profiles in both cases with and without radiation. The central density for both cases is greater than , which is a typical value in the present-day GCs (e.g. Renzini et al. 2015). Moreover, the SG stars in both the RT and NoRT simulations are more concentrated than the FG stars in the central region (within a radius of ), while they are characterized with .
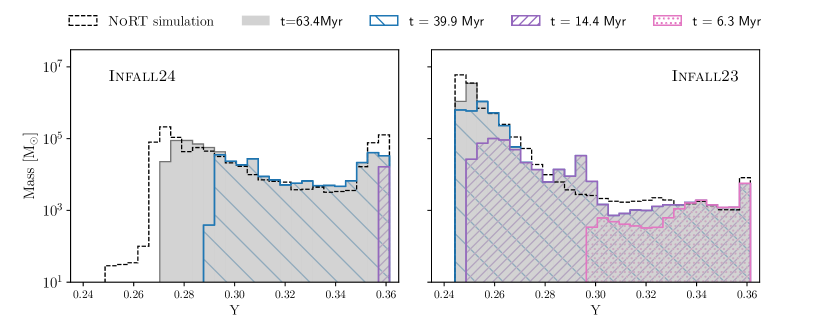
Figure 4 illustrates the mass distribution of SG stars as a function their helium abundances at different times in our simulations. In the RT-Infall24 simulation, as expected, a unimodal distribution takes shape just before the infall reaches the center at , reflecting that the SG stars are formed from pure AGB ejecta. As the simulation progresses and the AGB ejecta are mixed with pristine gas with , the distribution tends towards lower helium abundances. So that another peak at the final time of is formed at , showing that younger SG stars are formed from very diluted AGB materials. Therefore two SG sub-populations with different He abundances can form in the low-density simulation.
3.2 RT-Infall23
We now describe the formation of SG stars for RT-Infall23, where the ISM density is ten times more than that of RT-Infall24. A denser medium yields a stronger ram pressure than in the lower-density model. However, the cluster can still overcome the ram pressure stripping and accrete a significant amount of pristine gas. In this model, the infall starts much sooner than in the RT-Infall24 case ( after the start of the AGB ejecta). This is due to the fact that in a denser ISM, a smaller bubble is formed by Type II SNe of the FG stars (equation 2 in C19). Therefore, the cluster reaches the pristine gas beyond this bubble in a shorter time.
As depicted in the third row of Figure 2, a compact population of SG stars has formed at the centre of the cluster after about . This model forms a tail at , though, it is not as well-established as the tail formed in the NoRT case at the same time. Moreover, a relatively dense and symmetric shell is seen ahead of the cluster that is a result of the photoionisation-heated gas pushing against the incoming gas. This implies that the FG radiation is not strong enough to affect all the gas in the entire simulation box, in contrast to RT-Infall24. The bottom-left panel of Figure 2 shows that the gas temperature in the inner area of this shell is greater than and it is ionised while the gas in outer regions is much colder than to the pristine incoming gas. The motion of the pristine gas can be followed by the arrows on the temperature map in Figure 2. It shows that as the incoming gas flows to the right, and accretes into a dense and cold tail behind the cluster at later times. Moreover, the white contours indicate that the stellar distribution of the SG stars in this model is more extended than in the RT-Infall24 due to the denser infall. The broader distribution in this model can also be seen from the right column panels of Figure 3. The first snapshot shows that almost all the stars have helium abundances higher than , i.e. the gas fuelling the SG formation is enriched by AGB ejecta at this point. Interestingly, the SG stars in the RT-Infall23 are more concentrated toward the centre than in the NoRT simulation at the same time. The reason is that the stronger ram pressure in the latter mitigates the central collapse. The SG density is higher than the FG one at the core, but as the simulation progresses SG stars with lower helium abundance begin to dominate in the central region. A comparison between the final SG profile in the NoRT and RT simulations at the final snapshots reveals that the SG density in the presence of the ionising sources decreases slightly in the outer regions. However, this difference in the central regions is none. As in the RT-Infall24 simulation, the central density for both cases is still greater than , which is in agreement with observations (e.g. Renzini et al. 2015). At the final snapshot, the SG stars dominate in the inner part of the cluster (), compared to the FG profile. This radius is approximately twice larger than that where the SG stars dominate in the low-density simulation.
From the right panel of Figure 4 we can conclude that the final He distribution in our RT-Infall23 simulation is insensitive to the inclusion of radiation feedback. As in the RT-Infall24 simulation, two peaks appear at and in both cases of the RT and NoRT, as a result of forming stars from pure and very diluted AGB ejecta (at the beginning and end of the simulations), respectively. The only obvious difference is that a new peak at starts to form before in the RT run. Our analysis shows that this new peak is formed in the central regions. This indicates that due to a stronger ionising feedback at the centre, the pristine gas accretion (and dilution) process is somewhat weaker than it in the other regions. As a result, a slightly different dilution in the RT case results in this peak. These three helium abundances in the RT-Infall23 simulation can qualitatively be compared with the observed values of massive clusters such as (Piotto et al., 2007; Milone et al., 2017), in which three populations have been found with , , and . Finally, the total SG mass formed in this high-density simulation is about , which is percent of that formed in the corresponding NoRT simulation.
3.3 Role of ionising radiation in SG star formation
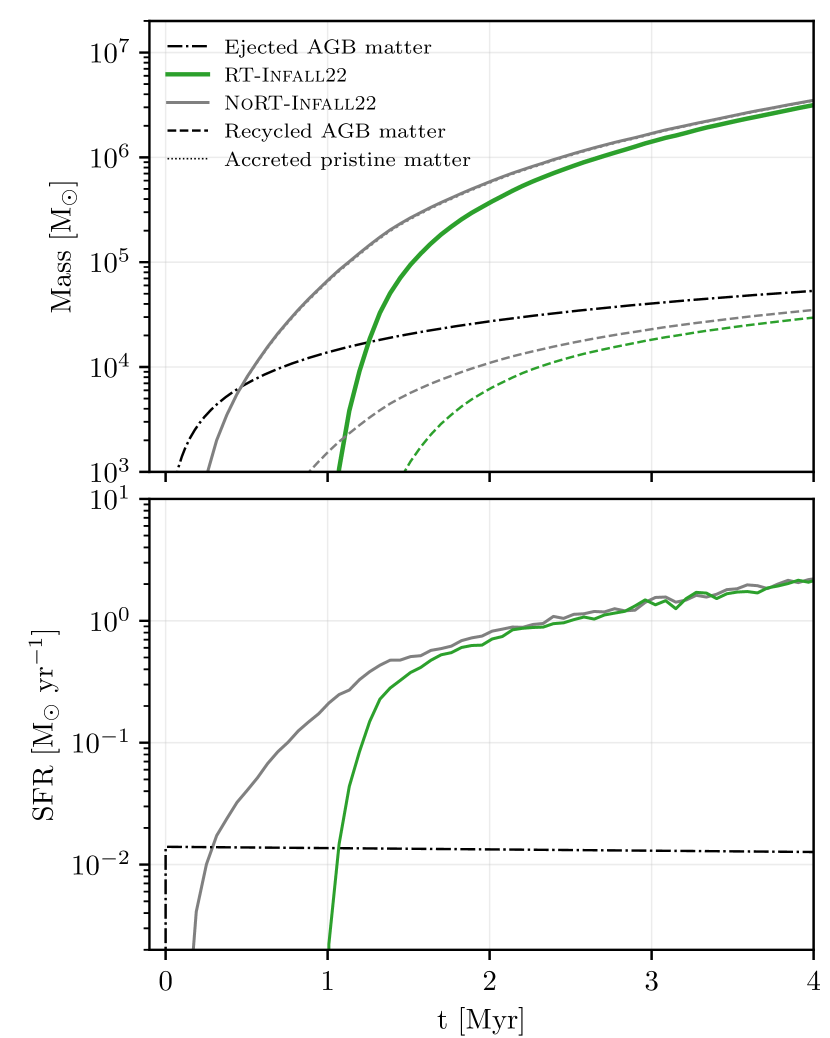
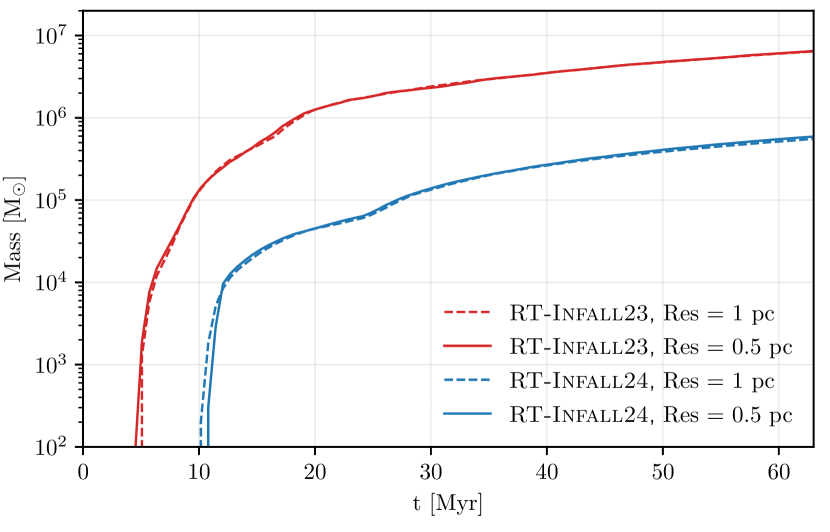
The top panels of Figure 5 show the cumulative SG mass formed in our RT-Infall24 and RT-Infall23 simulations as a function of time. To better understand how the radiation affects the SG mass, we compare the results of our RT simulations with the ones from the NoRT simulations. For both cases, we also show how much of the mass of the SG stars is formed from the AGB ejecta versus the pristine gas. For comparison, the total AGB matter injected into the simulation box, computed from Equation (1), is also plotted.
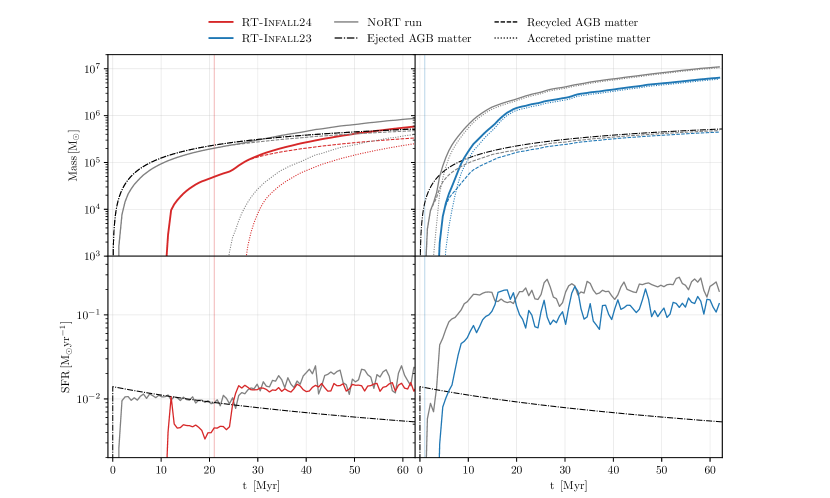
In the RT-Infall24 simulation (the upper left panel of the Figure 5), the ionising radiation delays star formation by about and also decreases the total SG mass by an order of magnitude in the first , compared to NoRT case. Our simulations show that the cluster can retain most of its AGB ejecta in the presence of the ionising radiation even before the start of the infall, however, a large percentage of this gas is too warm to participate in star formation. After , at which point the infall reaches the centre of the cluster, the cluster immediately begins accumulating pristine gas and then the density in the central regions increases which leads to more efficient cooling. As a result, the accreted ISM makes the stellar winds cool down even more and have a larger contribution to star formation. Therefore, our results from RT simulations emphasizes the key role of the pristine gas accretion in star formation in the context of the AGB scenario. In the RT case, the AGB ejecta constitute about percent of the total SG mass, almost the same as in the NoRT case (). Another effect of radiative heating evident in Figure 5 is that it reduces the accumulated mass of both the AGB and the pristine gas. The total SG mass formed in the RT-Infall24 is of that in the NoRT-Infall24 case.
The bottom panels of Figure 5 show the star formation rate (SFR) in our high- and low-density simulations. As can be seen in the bottom-left panel, for the NoRT-Infall24 case the SFR closely follows the rate of the injected AGB matter before the infall starts at . After this time, the SFR increases and reaches a plateau with some fluctuations. This approximately constant rate of star formation can be explained by the time-independent analytic formula of the Bondi-Hoyle-Lyttleton accretion rate (Hoyle & Lyttleton, 1939; Bondi, 1952; Edgar, 2004). Here , and are the mass of the accretor, the density of the ambient gas and the relative velocity between the accretor and the ISM gas, respectively. In the RT case, the SFR is smaller than that of the NoRT case (and the ejected stellar wind rate) before , and then it follows with an almost constant rate similar to the NoRT case, albeit slightly flatter.
In the RT-Infall23 simulation (right panels of Figure 5) the delay due to an earlier and denser infall is shorter. As shown in the top right panel, the SG stars are primarily formed from the accreted pristine gas, about in the RT case, compared to in the NoRT case. Moreover the total SG mass in the RT run is percent of the SG mass in the NoRT run. This panel also shows that the AGB material is well retained by the cluster. Moreover, our simulations for a cluster moving through the ISM with the velocity of , show that in environments where the ISM density is higher, more pristine gas is accumulated and then a larger fraction of stellar wind can be cooled. Our results for a very dense medium of exhibit similar trends and are explained in detail in Appendix A. The lower right panel shows that the SFR in the RT and the NoRT simulations also reach a plateau with a time-independent value which is approximately times that of the SFR in the low-density simulation (the lower left panel). This is also consistent with the linear dependence of the Bondi-Hoyle-Lyttleton accretion rate on the ISM density.
3.4 Resolution convergence
In order to investigate the sensitivity of our results to the adopted resolution ( and ) for our simulations, we performed a series of test runs. The test runs illustrate that simulations with different resolutions yield approximately the same final results, in terms of the total mass, SG profile, and He distribution. For example, Figure 6 compares the cumulative SG mass as a function of time for two resolutions () of and . These indicate that the adopted resolution is sufficient for our results to converge.
4 Discussion
Several studies address the formation of SG stars in GCs based on the AGB scenario. In a recent comprehensive study, using 3D hydrodynamical simulations, C19 found that a very massive cluster moving through an inster-stellar medium is able to overcome the ram pressure from the ambient medium and accumulate sufficient material to form a new and massive generation of stars. In addition to the ram pressure, they also took into account self-gravity, radiative cooling, and stellar winds. Moreover, they investigated the roles of the AGB stars ejecta and the accreted pristine gas in the formation of the SG stars.
Building upon C19, we have added radiative feedback from both FG and SG stars in simulations to examine how it affects the formation of SG stars. To this end, we utilized the Ramses-rt code to simulate a cluster with an initial FG mass of and a half-radius of . We placed the cluster in a homogeneous ISM, flowing towards the cluster centre at a speed of . We considered two densities for the ISM, namely (RT-Infall24) and (RT-Infall23). We started our simulations at the onset of the AGB stars winds () and followed the evolution of the cluster until the start of FG Type I SNe, which is after the formation of the cluster.
Our simulations include photoionisation heating and stellar winds from AGB stars. There are other sources of energy, excluded from our study because they are not expected to affect the SF history of the cluster. In particular, we ignore the effects of intermediate-mass main sequence stars (Naiman et al., 2018). The exact amount of energy injected by those sources is not well determined, but their energy deposition rate can be determined as (e. g. Weaver et al., 1977). By utilising MESA models (Paxton et al., 2011), and the observed initial-final mass relation explained in Naiman et al. (2018), the mean wind velocity and mass loss of main sequence stars are estimated to be times more, and times less than that of AGB stars, respectively. This translates into a wind energy ratio of , rendering the impact of intermediate-mass stars on the total energy loss negligible. Other energy sources may be present, such as planetary nebulae. However, D’Ercole et al. (2008) showed that their contribution in a massive cluster is expected to be negligible and that a total extra energy of , which is times more than of AGB stars, can halt SF in such a system.
We have used the SED model of (Eldridge et al., 2017) for our stellar populations (see Figure 1). Selecting such a population with binary stars allows us to provide the maximum possible amount of radiation in our GC. Our results with another model with lower luminosities, such as the Starburst99 (Leitherer et al., 1999), show that the efficiency of radiation decreases when we assume the stellar population to consist of single stars.
To examine the role of ionising radiation in the retention and cooling of He-rich stellar winds, we repeated our simulations without the infall of the pristine gas. We found that in the RT case, the amount of stellar winds that participate in the star formation process decreases by a factor of compared to a NoRT case without infall. Therefore increasing the density due to gas accretion within a GC results in more effective cooling and increases the SFR. This highlights the key role played by the infall of the pristine gas in the formation of SG stars in the AGB scenario.
We found that the luminosity of such a -Myr-old massive cluster is high enough to ionise its ICM. One might compare this result with what has been predicted by Conroy & Spergel (2011). They suggested that the SG stars should have been formed several after the FG formation, when the Lyman–Werner photon density of the FG population drops by more than three orders of magnitude. In contrast, our results including photoionisation indicate that the cooling process in a massive cluster could also be effective enough to cool the accumulated gas in the central regions and keep it neutral within a shorter time of Myr. In the case of very young clusters, it has been shown that the stellar feedback is dominated by photoionisation before the first supernova (Dale et al., 2014; Gavagnin et al., 2017). As seen in Figure 1, such clusters experiences very high luminosities in the first of their formation, resulting in expelling large fractions of the gas within the initial cloud and decreasing the star formation efficiency by factors (Dale et al., 2014). Even if such a strong feedback does not lead to a significant gas expulsion, radiative heating may not allow the gas within the cluster to cool sufficiently. This argument can be problematic for the SG formation scenarios in which the enriched stars are formed a few after the FG cluster formation.
The chemical composition of SG stars is found to be sensitive to the time difference between the onset of the AGB ejecta and the infall of the pristine gas. However, we found that radiation did not have much effect on the He abundances of SG stars and their mass vs He abundance distribution (Figure 4). Moreover, the SG stars in both RT and NoRT simulations are more concentrated than the FG stars, in agreement with observational findings. The AGB scenario suggests that stars with higher helium abundances are formed earlier than the ones with lower He (see Figure 4). This can be compared with other scenarios for the formation of SG stars, for example the FRMS scenario suggests the opposite. However there is still no strong observational constraints to check this point.
The majority of young (a few - ) massive () clusters have been observed to be gas free, except for a negligible amount of ionised gas that has been detected within some of them (Bastian et al., 2014; Cabrera-Ziri et al., 2015). These observations might seem to constrain the SG formation in GCs. But the point is that there is no evidence to date for the existence of the SG in such GCs, which are younger than Gyr (Bastian & Lardo, 2018). Nevertheless, the properties of the formation environment of progenitors of the GCs hosting MSPs are expected to be different from young massive star clusters.
Our choice of simulating a very massive cluster with a mass of and a half-mass radius might at first glance seem questionable. For example, Baumgardt et al. (2019) estimated that the initial masses of the clusters hosting MSPs are smaller. In addition, according to the flat relation between the mass and the half-mass radius for young massive clusters and GCs (Portegies Zwart et al., 2010; Krumholz et al., 2019), their half-mass radius is found to be less than . However, we demonstrated in Yaghoobi et al. (2022) that a cluster with a half-mass radius of is also able to form a massive SG. Moreover a number of analytic studies (Lin & Murray, 2007; Naiman et al., 2018) suggest that the cluster velocity dispersion and not the cluster mass alone, is the key parameter which ultimately determines the fate of gas accretion and the stellar wind expulsion. Therefore, as far as the formation of SG stars is concerned, our results might be compatible with a cluster of the same velocity dispersion, but a lower mass. Moreover, the exact initial conditions of GCs with MSPs is still debated and no consensus has been reached on this. Nevertheless, we have planned for a future study to investigate the role of radiative feedback in SG formation over a wider range of initial cluster masses and half-mass radii, including lower cluster masses.
5 Conclusions
We investigate whether stellar photoionisation feedback can influence SG formation in a very massive GC in the context of the AGB scenario. We simulate SG formation in two media of different densities and use a stellar population model that includes binary stars. The main outcomes of our study can be summarized as follows.
-
•
In a cluster with a mass of and an age of , long after FG Type II SNe have subsided, photoionisation does not lead to a significant gas expulsion. As a result, the ejecta of the AGB stars and the accreted pristine gas can be retained in the central regions of the cluster. Our results indicate that the cooling process in a massive cluster could also be effective enough to cool the accumulated gas in the central regions and keep it neutral within a time of .
-
•
The inclusion of photoionisation delays the formation of SG stars. It also leads to a modest decrease in the total SG mass. The extent of this effect depends on the ISM density so that a denser medium, decreases the delay in star formation.
-
•
In the case of the low-density simulation (RT-Infall24), radiative heating does not allow any tail to be formed behind the cluster. It, however, makes the distribution of SG stars elongated. The gas is everywhere ionised until after injecting the AGB ejecta. After that, only at the very central regions does the gas become cold enough to turn into stars. The final mass of SG stars in this model is about , approximately percent of that in the NoRT-Infall24.
-
•
In the high-density case (RT-Infall23), the stellar luminosity is not sufficient to ionise all the gas in the box due to a denser infall. However, more accumulated gas within the cluster leads to a more efficient cooling in the central region, and thus star formation occurs earlier than the low density model. Finally, the final SG mass formed in this case is about ( percent of that in the NoRT-Infall23 simulation). Moreover, three sub-populations with different helium abundances, in a good agreement with observations of massive clusters, are found. In addition, a strong tail is formed behind the cluster in this model.
-
•
In all the simulations, we find that the radiation pressure hardly affects the star formation within the cluster, i.e. all the effect of radiation is from photoionisation heating. The radiative effects of the SG population are also found to be negligible in the present work.
Acknowledgements
AY is grateful to the Centre de Recherche Astrophysique (CRAL) for hospitality during her visit. FC acknowledges support from PRIN INAF 1.05.01.85.01 and INAF Main-Stream 1.05.01.86.31. We acknowledge support and computational resources from the Common Computing Facility (CCF) of the LABEX Lyon Institute of Origins (ANR-10-LABX-66) and the PSMN (Pôle Scientifique de Modélisation Numérique) of the ENS de Lyon. We thank the referee, Richard Wünsch, for a constructive review.
DATA AVAILABILITY
The data that support the findings of this study are available from the corresponding author upon reasonable request.
References
- Bastian & Lardo (2018) Bastian N., Lardo C., 2018, ARA&A, 56, 83
- Bastian et al. (2013) Bastian N., Lamers H. J. G. L. M., de Mink S. E., Longmore S. N., Goodwin S. P., Gieles M., 2013, MNRAS, 436, 2398
- Bastian et al. (2014) Bastian N., Hollyhead K., Cabrera-Ziri I., 2014, MNRAS, 445, 378
- Bastian et al. (2015) Bastian N., Cabrera-Ziri I., Salaris M., 2015, MNRAS, 449, 3333
- Baumgardt et al. (2019) Baumgardt H., Hilker M., Sollima A., Bellini A., 2019, MNRAS, 482, 5138
- Bekki (2017) Bekki K., 2017, MNRAS, 467, 1857
- Bekki (2019) Bekki K., 2019, MNRAS, 486, 2570
- Bekki & Freeman (2003) Bekki K., Freeman K. C., 2003, MNRAS, 346, L11
- Bekki et al. (2017) Bekki K., Jeřábková T., Kroupa P., 2017, MNRAS, 471, 2242
- Bondi (1952) Bondi H., 1952, MNRAS, 112, 195
- Bragaglia et al. (2013) Bragaglia A., Carretta E., Gratton R., D’Orazi V., Lucatello S., Sneden C., 2013, Mem. Soc. Astron. Italiana, 84, 24
- Bragaglia et al. (2014) Bragaglia A., Sneden C., Carretta E., Gratton R. G., Lucatello S., Bernath P. F., Brooke J. S. A., Ram R. S., 2014, ApJ, 796, 68
- Cabrera-Ziri et al. (2015) Cabrera-Ziri I., et al., 2015, MNRAS, 448, 2224
- Calura et al. (2015) Calura F., Few C. G., Romano D., D’Ercole A., 2015, ApJ, 814, L14
- Calura et al. (2019) Calura F., D’Ercole A., Vesperini E., Vanzella E., Sollima A., 2019, MNRAS, 489, 3269
- Carretta et al. (2009) Carretta E., et al., 2009, A&A, 505, 117
- Carretta et al. (2010) Carretta E., Bragaglia A., Gratton R. G., Recio-Blanco A., Lucatello S., D’Orazi V., Cassisi S., 2010, A&A, 516, A55
- Chantereau et al. (2020) Chantereau W., Biernacki P., Martig M., Bastian N., Salaris M., Teyssier R., 2020, MNRAS, 493, 1306
- Ciotti et al. (1991) Ciotti L., D’Ercole A., Pellegrini S., Renzini A., 1991, ApJ, 376, 380
- Conroy & Spergel (2011) Conroy C., Spergel D. N., 2011, ApJ, 726, 36
- Conroy et al. (2009) Conroy C., Gunn J. E., White M., 2009, ApJ, 699, 486
- D’Ercole et al. (2008) D’Ercole A., Vesperini E., D’Antona F., McMillan S. L. W., Recchi S., 2008, MNRAS, 391, 825
- D’Ercole et al. (2016) D’Ercole A., D’Antona F., Vesperini E., 2016, MNRAS, 461, 4088
- Dale et al. (2014) Dale J. E., Ngoumou J., Ercolano B., Bonnell I. A., 2014, MNRAS, 442, 694
- Decressin et al. (2007a) Decressin T., Meynet G., Charbonnel C., Prantzos N., Ekström S., 2007a, A&A, 464, 1029
- Decressin et al. (2007b) Decressin T., Charbonnel C., Meynet G., 2007b, A&A, 475, 859
- Denissenkov & Hartwick (2014) Denissenkov P. A., Hartwick F. D. A., 2014, MNRAS, 437, L21
- Denissenkov et al. (2015) Denissenkov P. A., VandenBerg D. A., Hartwick F. D. A., Herwig F., Weiss A., Paxton B., 2015, MNRAS, 448, 3314
- Edgar (2004) Edgar R., 2004, New Astron. Rev., 48, 843
- Eldridge et al. (2017) Eldridge J. J., Stanway E. R., Xiao L., McClelland L. A. S., Taylor G., Ng M., Greis S. M. L., Bray J. C., 2017, Publ. Astron. Soc. Australia, 34, e058
- Frelijj et al. (2021) Frelijj H., Villanova S., Muñoz C., Fernández-Trincado J. G., 2021, MNRAS, 503, 867
- Gavagnin et al. (2017) Gavagnin E., Bleuler A., Rosdahl J., Teyssier R., 2017, MNRAS, 472, 4155
- Gilbert & Graham (2007) Gilbert A. M., Graham J. R., 2007, ApJ, 668, 168
- Gratton et al. (2013) Gratton R. G., et al., 2013, A&A, 549, A41
- Hoyle & Lyttleton (1939) Hoyle F., Lyttleton R. A., 1939, Proceedings of the Cambridge Philosophical Society, 35, 405
- Jacquet & Krumholz (2011) Jacquet E., Krumholz M. R., 2011, ApJ, 730, 116
- Jeřábková et al. (2018) Jeřábková T., Hasani Zonoozi A., Kroupa P., Beccari G., Yan Z., Vazdekis A., Zhang Z. Y., 2018, A&A, 620, A39
- Khalaj & Baumgardt (2015) Khalaj P., Baumgardt H., 2015, MNRAS, 452, 924
- Khalaj & Baumgardt (2016) Khalaj P., Baumgardt H., 2016, MNRAS, 457, 479
- Krause et al. (2013) Krause M., Charbonnel C., Decressin T., Meynet G., Prantzos N., 2013, A&A, 552, A121
- Kroupa (2001) Kroupa P., 2001, MNRAS, 322, 231
- Kroupa et al. (2018) Kroupa P., Jeřábková T., Dinnbier F., Beccari G., Yan Z., 2018, A&A, 612, A74
- Krumholz et al. (2019) Krumholz M. R., McKee C. F., Bland-Hawthorn J., 2019, ARA&A, 57, 227
- Lacchin et al. (2021) Lacchin E., Calura F., Vesperini E., 2021, MNRAS, 506, 5951
- Lagioia et al. (2019) Lagioia E. P., Milone A. P., Marino A. F., Cordoni G., Tailo M., 2019, AJ, 158, 202
- Leitherer et al. (1999) Leitherer C., et al., 1999, ApJS, 123, 3
- Lin & Murray (2007) Lin D. N. C., Murray S. D., 2007, ApJ, 661, 779
- Marcolini et al. (2003) Marcolini A., Brighenti F., D’Ercole A., 2003, MNRAS, 345, 1329
- Milone et al. (2017) Milone A. P., et al., 2017, MNRAS, 464, 3636
- Milone et al. (2020) Milone A. P., et al., 2020, MNRAS, 491, 515
- Minniti et al. (1993) Minniti D., Geisler D., Peterson R. C., Claria J. J., 1993, ApJ, 413, 548
- Naiman et al. (2011) Naiman J. P., Ramirez-Ruiz E., Lin D. N. C., 2011, ApJ, 735, 25
- Naiman et al. (2018) Naiman J. P., Ramirez-Ruiz E., Lin D. N. C., 2018, MNRAS, 478, 2794
- Pancino et al. (2010) Pancino E., Carrera R., Rossetti E., Gallart C., 2010, A&A, 511, A56
- Paxton et al. (2011) Paxton B., Bildsten L., Dotter A., Herwig F., Lesaffre P., Timmes F., 2011, ApJS, 192, 3
- Piotto et al. (2007) Piotto G., et al., 2007, ApJ, 661, L53
- Plummer (1911) Plummer H. C., 1911, MNRAS, 71, 460
- Portegies Zwart et al. (2010) Portegies Zwart S. F., McMillan S. L. W., Gieles M., 2010, ARA&A, 48, 431
- Rasera & Teyssier (2006) Rasera Y., Teyssier R., 2006, A&A, 445, 1
- Renzini et al. (2015) Renzini A., et al., 2015, MNRAS, 454, 4197
- Rosdahl & Teyssier (2015) Rosdahl J., Teyssier R., 2015, MNRAS, 449, 4380
- Rosdahl et al. (2013) Rosdahl J., Blaizot J., Aubert D., Stranex T., Teyssier R., 2013, MNRAS, 436, 2188
- Rosen & Bregman (1995) Rosen A., Bregman J. N., 1995, ApJ, 440, 634
- Schmidt (1959) Schmidt M., 1959, ApJ, 129, 243
- Sutherland & Dopita (1993) Sutherland R. S., Dopita M. A., 1993, ApJS, 88, 253
- Szécsi et al. (2018) Szécsi D., Mackey J., Langer N., 2018, A&A, 612, A55
- Teyssier (2002) Teyssier R., 2002, A&A, 385, 337
- Ventura & D’Antona (2011) Ventura P., D’Antona F., 2011, MNRAS, 410, 2760
- Villanova et al. (2013) Villanova S., Geisler D., Carraro G., Moni Bidin C., Muñoz C., 2013, ApJ, 778, 186
- Wardlow et al. (2017) Wardlow J. L., et al., 2017, ApJ, 837, 12
- Weaver et al. (1977) Weaver R., McCray R., Castor J., Shapiro P., Moore R., 1977, ApJ, 218, 377
- Whitmore et al. (1999) Whitmore B. C., Zhang Q., Leitherer C., Fall S. M., Schweizer F., Miller B. W., 1999, AJ, 118, 1551
- Wünsch et al. (2017) Wünsch R., Palouš J., Tenorio-Tagle G., Ehlerová S., 2017, ApJ, 835, 60
- Yaghoobi & Shadmehri (2018) Yaghoobi A., Shadmehri M., 2018, MNRAS, 477, 412
- Yaghoobi et al. (2022) Yaghoobi A., Calura F., Rosdahl J., Haghi H., 2022, MNRAS, 510, 4330
- Zhu et al. (2003) Zhu M., Seaquist E. R., Kuno N., 2003, ApJ, 588, 243
- de Mink et al. (2009) de Mink S. E., Pols O. R., Langer N., Izzard R. G., 2009, A&A, 507, L1
Appendix A RT-Infall22
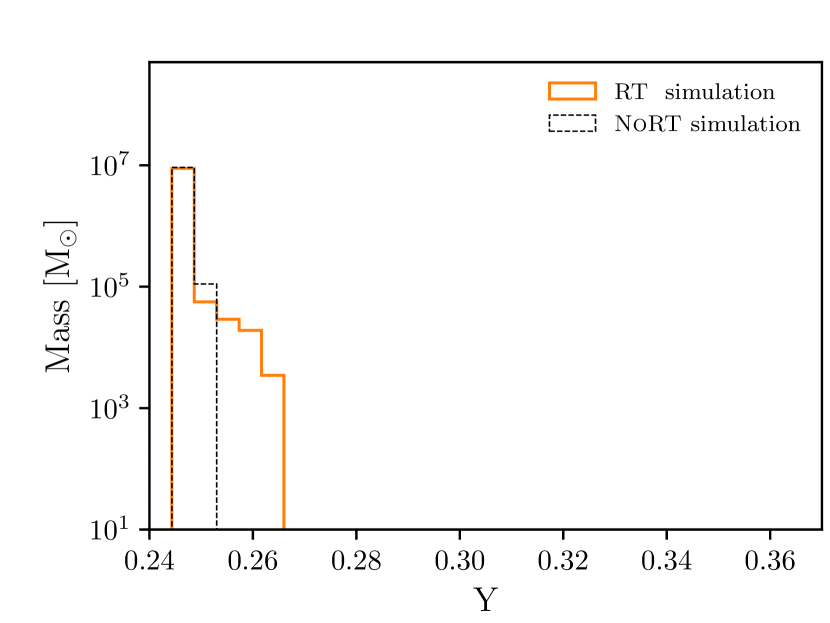
Here we test the formation of SG stars in a very dense medium with a density of , which is similar to the density of a merging system such as the Antennae (Zhu et al., 2003). The stalled radius of the bubble formed by the FG SN explosions for this simulation is found to be about (from Equation in C19), comparable to the box size, applying a shorter (from the birth of the cluster) that we assume to be . Therefore we design the simulation such that the infall reaches the centre at about and therefore both the infall and the AGB ejecta are present at the start of the simulation.
Figure 7 shows the cumulative SG mass and the star formation rate versus time within the first for the RT and NoRT runs. The simulation experiences a SFR of about after . At such a high SFR it is expected that the number of massive stars considerably increases with respect to a standard IMF (Jeřábková et al., 2018, also see Section 2.3) and then after a few the SNe incorporated with SG stars will suppress the star formation. Hence, it may not be realistic that the SF goes on for a longer time. That is the reason why we stopped both simulations at . However, it is not clear yet what is the efficiency of SNe in such a high-density medium and therefore a more comprehensive setup is required to investigate that. Nevertheless, we can still examine the effect of radiation in the ignition of star formation at early times.
Top panel of Figure 7 shows that the stars immediately start forming in the NoRT simulation as the infall passes through the cluster, while star formation occurs later in the case of the RT simulation. The difference between these two simulations disappears after our time reference and finally the stellar mass ends up being about at .
But the SFRs in the NoRT and RT simulations converge at . Here the SFR has become times higher than the rate at the same time in the RT-Infall23 as expected.
Figure 8 shows that the maximum He abundance at is found to be about , which is the lowest value compared to the other simulations due to very strong dilution of the AGB ejecta in this run. If we allow the simulation to proceed for a longer time, this maximum value does not change since new stars would have the same He abundance as in the pristine gas, resulting from a high accretion and dilution. Therefore the results of this model present a He enrichment of about , which is much lower than the observed values for very massive clusters (Milone et al., 2020).