The JWST Hubble Sequence: The Rest-Frame Optical Evolution of Galaxy Structure at
Abstract
We present results on the morphological and structural evolution of a total of 4265 galaxies observed with JWST at in the JWST CEERS observations that overlap with the CANDELS EGS field. This is the biggest visually classified sample observed with JWST yet, times larger than previous studies, and allows us to examine in detail how galaxy structure has changed over this critical epoch. All sources were classified by six individual classifiers using a simple classification scheme aimed to produce disk/spheroid/peculiar classifications, whereby we determine how the relative number of these morphologies evolves since the Universe’s first billion years. Additionally, we explore structural and quantitative morphology measurements using Morfometryka, and show that galaxies at are not dominated by irregular and peculiar structures, either visually or quantitatively, as previously thought. We find a strong dominance of morphologically selected disk galaxies up to , a far higher redshift than previously thought possible. We also find that the stellar mass and star formation rate densities are dominated by disk galaxies up to , demonstrating that most stars in the universe were likely formed in a disk galaxy. We compare our results to theory to show that the fraction of types we find is predicted by cosmological simulations, and that the Hubble Sequence was already in place as early as one billion years after the Big Bang. Additionally, we make our visual classifications public for the community.
1 Introduction
Since the discovery of galaxies, a principal aim of their study has been to characterize their structures and morphologies. The very fact that galaxies appear to be extended, as opposed to point sources, already provides an elusive clue to their nature being different from that of the stars. In fact, it can be said that it was the extended nature of these objects that instigated the debate about whether they were external to our own galaxy, a problem solved through obtaining distances to these systems (Hubble, 1926). Even before then, however, the fact that the structure of galaxies holds important information had been known since at least the time of Lord Rosse and his discovery of spiral structure in nearby massive galaxies such as M51 (Rosse, 1850).
Since that time, galaxy structure, morphology, and how these properties evolve with time has remained a key aspect to understanding galaxy evolution (e.g., Conselice, 2003; Lotz et al., 2004; Mortlock et al., 2013; Delgado-Serrano et al., 2010; Schawinski et al., 2014; Conselice, 2014; Whitney et al., 2021; Ferreira et al., 2022). The resolved structure of distant galaxies, in particular with the advent of the Hubble Space Telescope, clearly revealed that faint distant galaxies were more peculiar and irregular, and few fit into the Hubble sequence (e.g. Driver et al., 1995). Later, once redshifts became available, it became clear that galaxy structures evolve strongly, but systematically, with redshift, such that peculiar galaxies dominate the population at (e.g., Conselice et al., 2008; Conselice, 2014; Whitney et al., 2021). However, because of the limited red wavelengths of Hubble, we still have not yet been able to trace the rest-frame optical light of galaxies back to within the first few Gyr of the Big Bang. The F160W band on the Hubble Space Telescope (HST) can only probe rest-frame visible light up to , but JWST permits us to obtain the same type of data out to with F444W (e.g., Ferreira et al., 2022). Moreover, JWST’s superior resolution and longer wavelength filter set allows galaxy structure to be better measured than with the lower resolution of HST.
Observations of galaxy structure and morphology at do show that in the rest-frame UV galaxies are peculiar and irregular (e.g., Conselice & Arnold, 2009). Moreover, galaxies are often very clumpy at these redshifts, as seen with deep WFC3 data (e.g., Oesch et al., 2010). Furthermore, observations of pairs of galaxies show that the merger rate and fraction of galaxies up to is very high, and therefore that galaxy structure should likewise be affected significantly (e.g., Duncan et al., 2019). At the same time, we know that the Hubble sequence is established at (e.g., Mortlock et al., 2013). However, whether the Hubble sequence already existed in the earlier Universe remains an open question.
While earlier HST-based studies found that the dominating majority of galaxies at are peculiar, recent JWST-based studies find a high number of regular disk galaxies at high redshift (e.g., Ferreira et al., 2022; Nelson et al., 2022; Jacobs et al., 2022; Robertson et al., 2022), consistent with an even earlier emergence of the Hubble sequence. The nature of this evolution and its implications are however still unknown.
Quantitative measures of galaxy structure and morphology also present stringent constraints for numerical simulations to reproduce. In recent years, full hydrodynamic simulations (Schaye et al., 2015; Nelson et al., 2019; Lovell et al., 2021; Marshall et al., 2022a) enable resolved morphologies to be predicted in a self-consistent manner, and recent novel simulation approaches allow these to be tested out to the highest redshifts (Roper et al., 2022). There are a number of difficulties when comparing morphologies between simulations and observations, however simple measures of the abundance of e.g. disk and elliptical galaxies can provide hints as to the underlying mechanisms leading to morphological evolution. However, what we known from early JWST work is that the morphological and structural features of galaxies at are much different than what was found with HST (e.g., Ferreira et al., 2020), and therefore a more thorough analysis is needed to address these fundamental problems.
Thus, in this paper we explore the morphological properties of 4265 galaxies observed with JWST through visual galaxy classifications and quantitative morphology, from to 8. This is a sample 20 times larger than any previous morphological and structural study using JWST. Amongst other things, we confirm that these early galaxies have predominantly disk morphologies, and that the Hubble sequence appars to be already established as early as . In this paper we discuss these results and their implications for galaxy formation and evolution.
The paper is organized as follows. In § 2 we describe the data products used, our reduction pipeline, the visual classification scheme adopted, as well as our methods of quantitative morphology. § 3 describes the results from our classification effort, quantitative morphology measurements including a discussion on the evolution of the Hubble sequence from to 8. We finish with a summary of our main results in § 4.
2 Data and Methods
We use the public NIRCam JWST observations from the Cosmic Evolution Early Release Science Survey (CEERS; PI: Finkelstein, ID=1345, Finkelstein et al. in prep), that overlap with the Cosmic Assembly Near-IR Deep Extragalactic Legacy Survey (CANDELS; Grogin et al. 2011; Koekemoer et al. 2011) on the Extended Growth Strip field (EGS). These data are reduced independently using a custom set-up of the JWST pipeline version 1.6.2 using the on-flight calibration files available through the CDRS 0942, an extensive description is given in § 2.1.
We select 4265 sources with from the CANDELS catalogs which overlap with the area covered by CEERS. We take advantage of the robust photometric redshifts, star formation rates and stellar masses already derived for CANDELS in previous works (Duncan et al., 2014, 2019; Whitney et al., 2021) to conduct this analysis. Neither morphological information is used for the selection of sources, nor are magnitude cuts employed, as we want to make sure that we include sources that might be faint in HST, but bright in JWST observations. This is also the case for morphology; we are also interested in sources that can show dramatic changes in morphology between the two instruments.
We employ two different approaches to these data: first we perform visual classifications for all sources, which is described in detail in §2.3. Second, we perform quantitative morphology through Morfometryka (Ferrari et al., 2015), where we measure non-parametric morphology estimates such as CAS, G-M20, H, Spirality, Sizes, as well as light profile fitting, which is described in detail §2.4.
2.1 Data Reduction
We reprocess all of the uncalibrated lower-level JWST data products for this field following our modified version of the JWST official pipeline. This is similar to the process used in Adams et al. (2022) and Ferreira et al. (2022), but with minor updates and improvements, and can be summarised as follows: (1) We use version 1.6.2 of the pipeline with the Calibration Reference Data System (CRDS) version 0942 which was the most up-to-date version at the time of writing. Use of CRDS 0942 is essential for zero point issues we discuss in (Adams et al., 2022). (2) We apply the 1/f noise correction derived by Chris Willott on the resulting level 2 data of the JWST pipeline.111https://github.com/chriswillott/jwst (3) We extract the sky subtraction step from stage 3 of the pipeline and run it independently on each NIRCam frame, allowing for quicker assessment of the background subtraction performance and fine-tuning. (4) We align calibrated imaging for each individual exposure to GAIA using tweakreg, part of the DrizzlePac python package.222https://github.com/spacetelescope/drizzlepac (5) We pixel-match the final mosaics with the use of astropy reproject.333https://reproject.readthedocs.io/en/stable/ The final resolution of the drizzled images is 0.03 arcseconds/pixel. There is rapid development in the above procedure, and so we anticipate future studies to continue to make refinements to the JWST pipeline. Each one of the four June CEERS observations was processed into individual mosaics.
2.2 Photometric Redshifts and Stellar Masses
The photometric redshifts that we use in this paper originate from the redshifts calculated in Duncan et al. (2019) for EGS. These are based on the original CANDELS+GOODS WFC3/ACS imaging and data, Spitzer/IRAC S-CANDELS (Ashby et al., 2015), and ground-based observations with CFHT (Stefanon et al., 2017). The overall method for this is described in detail in Duncan et al. (2019).
2.3 Visual Classification
As a way to define the morphologies of the galaxies in our sample of 4265 sources, we construct a simple classification scheme that yields a large amount of information with a small number of classification questions, as opposed to having a very detailed sub-classification scheme of structure sub-components. The classification scheme is summarized in the fluxogram in Fig. 1. At high redshift, fine structural details are often difficult to recover and in general are ambiguous, hence these questions capture the overall appearance of the source.
Our sample is the biggest visually classified sample observed with JWST yet, times larger than what is reported in previous JWST morphology results (Ferreira et al., 2022; Nelson et al., 2022; Jacobs et al., 2022). A brief description of each possible resulting class is given below:
-
•
Unclassifiable: Galaxies not clearly visible, too faint/noisy, and image issues like artifacts, cosmic rays.
-
•
Point Sources: Sources that are smaller in angular size than the or that present clear wings/spike patterns consistent with point-like objects but no extended component.
-
•
Disks: Galaxies with a resolved disk in the form of an outer area of lower surface brightness with a regularly increasing brightness towards the center of the galaxy. This classification does not depend on there being a feature present in the disk such as a spiral pattern or a bar, although one can be present.
-
•
Spheroid: Resolved, symmetrically and centrally concentrated, with a smooth profile and are round/elliptical in shape.
-
•
Peculiar: Well-resolved galaxies with a morphology which is dominated by a disturbance or peculiarity, where the disturbance dominates any smooth components.
Each galaxy is further classified as smooth or structured, where structured galaxies have features standing out from the smooth stellar envelope, such as star-formation clumps, tidal features, and merger signatures. Galaxies with distinct disk and bulge components were also classified as structured. Finally, the classifiers were able to provide additional notes on each source to aid in future analysis.
Ultimately, after all classifications were aggregated we determined the final class of each object as the the one receiving the majority of the votes, as discussed in detail in Sec. 2.3. In the cases where classifiers disagreed, we included an ambiguous class.
Based on this classification scheme (Fig. 1), six authors of this study (CBT, CC, ES, JC, GL, LF) classified all the 4265 sources. This effort produced a robust catalog where every galaxy has all six classifications combined in classification fractions, one for each individual question present in the scheme (Fig. 1).
To perform each classification, the classifiers were given access to a web application built with flask, jinja and bootstrap specifically tailored for this task. The volunteers were presented with the rest-frame image in the filter that corresponds to the source redshift (minimizing for ), an RGB image (F277W+F356W+F444W) generated with Trilogy (Coe et al., 2015), the PSF image of the respective filter together with the size of the , and a questionnaire that reproduces Fig. 1. Results are stored in a MySQL database, that is then reduced and aggregated with pandas (Reback et al., 2022).
Each individual classifier’s results are combined in a single table using the following criteria.
First, we define how many votes there are for each source - that is, the votes that are not considered to be unclassifiable and point source. Then, if at least of all votes are assigned to any of these individual classes (i.e. 3 or more votes are exclusively in these categories), we consider the source to be unclassifiable or point-like, by the labels n/a and ps, respectively. For the point-like sources, we compare its size to the . If it is larger than the , we change its classification to spheroid. The same is done the other way around: sources smaller than the are changed programatically to ps.
Second, for all the rest of the sources that have more than of the votes in disk, spheroid or peculiar categories, we average each individual classification decision in a class fraction. Hence, this class fraction is only based on the number of good votes (i.e. votes that are for classifiable and extended galaxies).
Third, to all galaxies that have a clear majority as , we assign the given class as the final class. For all the remaining cases that the classifiers disagree on (e.g., 2 votes in each category), we define those sources to have an ambiguous class.
Finally, we include a structure index, the smooth_fraction, that is independent of the general appearance, designed as a large umbrella to capture sources with rich structures, sub-components, and merging features.
This framework enables sources that might be ambiguous between two classifiers to have a more robust classification. The class fractions can also be used to control the purity of the samples, as higher agreement will represent a less contaminated dataset. We proceed, however, with the final classifications assigned by the majority of the classifiers.
2.4 Morfometryka
Morfometryka (Ferrari et al., 2015) performs several structural measurements on galaxy images in a straightforward, non-interactive way. It measures non-parametric morphometric quantities along with 1D and 2D single Sérsic model fitting (Sérsic, 1963). The inputs are the galaxy and PSF images, from which it estimates the background with an iterative algorithm, segments the sources and defines the target. If desired, it filters out external sources using GalClean444https://github.com/astroferreira/galclean (Ferreira & Ferrari, 2018). From the segmented region it calculates standard geometrical parameters (e.g., center, PA, axial ratio) using image moments; it performs photometry measuring fluxes in similar ellipses with the aforementioned parameters; point sources are masked with a sigma clipping criteria. From the luminosity growth curve it establishes the Petrosian radius and the Petrosian Region (Petrosian, 1976), inside which all the measurements will be made. The 1D Sérsic fit is performed on the luminosity profile and used as inputs for a 2D Sérsic fit done with the galaxy and the PSF images. Finally, it measures several morphometric parameters (concentrations; asymmetries; Gini; M20; entropy, spirality, curvature, among others, Abraham et al., 1994; Bershady et al., 2000; Conselice et al., 2003; Lotz et al., 2004; Conselice et al., 2008; Lotz et al., 2008; Ferrari et al., 2015).
We run Morfometryka for all filters available but only report results for the band that matches closest the rest-frame optical of the source (-).
2.5 BlueTides high-z Mocks
By way of a comparison of observations with theory, we also consider mock JWST images from the BlueTides Mock Image Catalogue (Marshall et al., 2022a, b). This is a catalogue of mock image stamps of galaxies from to 12, with the particle distributions and SEDs of each galaxy taken from the BlueTides hydrodynamical simulation (Feng et al., 2015). The images are created with the NIRCam transmission curves and convolved with JWST model PSFs from WebbPSF (Perrin et al., 2015) to produce a realistic mock image for each galaxy. The BlueTides mock images have a pixel scale of for the NIRCam short-wavelength filters, which is half our observed pixel scale, and for the long-wavelength filters, which is equivalent to our observed pixel scale. Here we use the F444W filter, which is the same filter that we use to probe the rest-frame optical of the real observations at .
It is important to note that the images of the BlueTides galaxies are created in the ‘face-on’ direction, which is defined by the angular momentum of particles in the galaxy (see Marshall et al., 2020). However, studies suggest that the angular momentum of early galaxies does not correlate with their morphological structure (e.g. Park et al., 2022); indeed, visual inspection of the BlueTides images shows that this direction does not necessarily correspond to the visual morphological ‘face-on’ direction. Thus, while we do not expect this feature of the simulation to highly affect our comparison, some bias could be present.
We select all galaxies that overlap with the redshift range probed here from to 8. For each source stamp we add Gaussian noise to match the depth of the CEERS observations levels. Then, we run Morfometryka for all stamps together with the PSF generated with WebbPSF.
3 Results
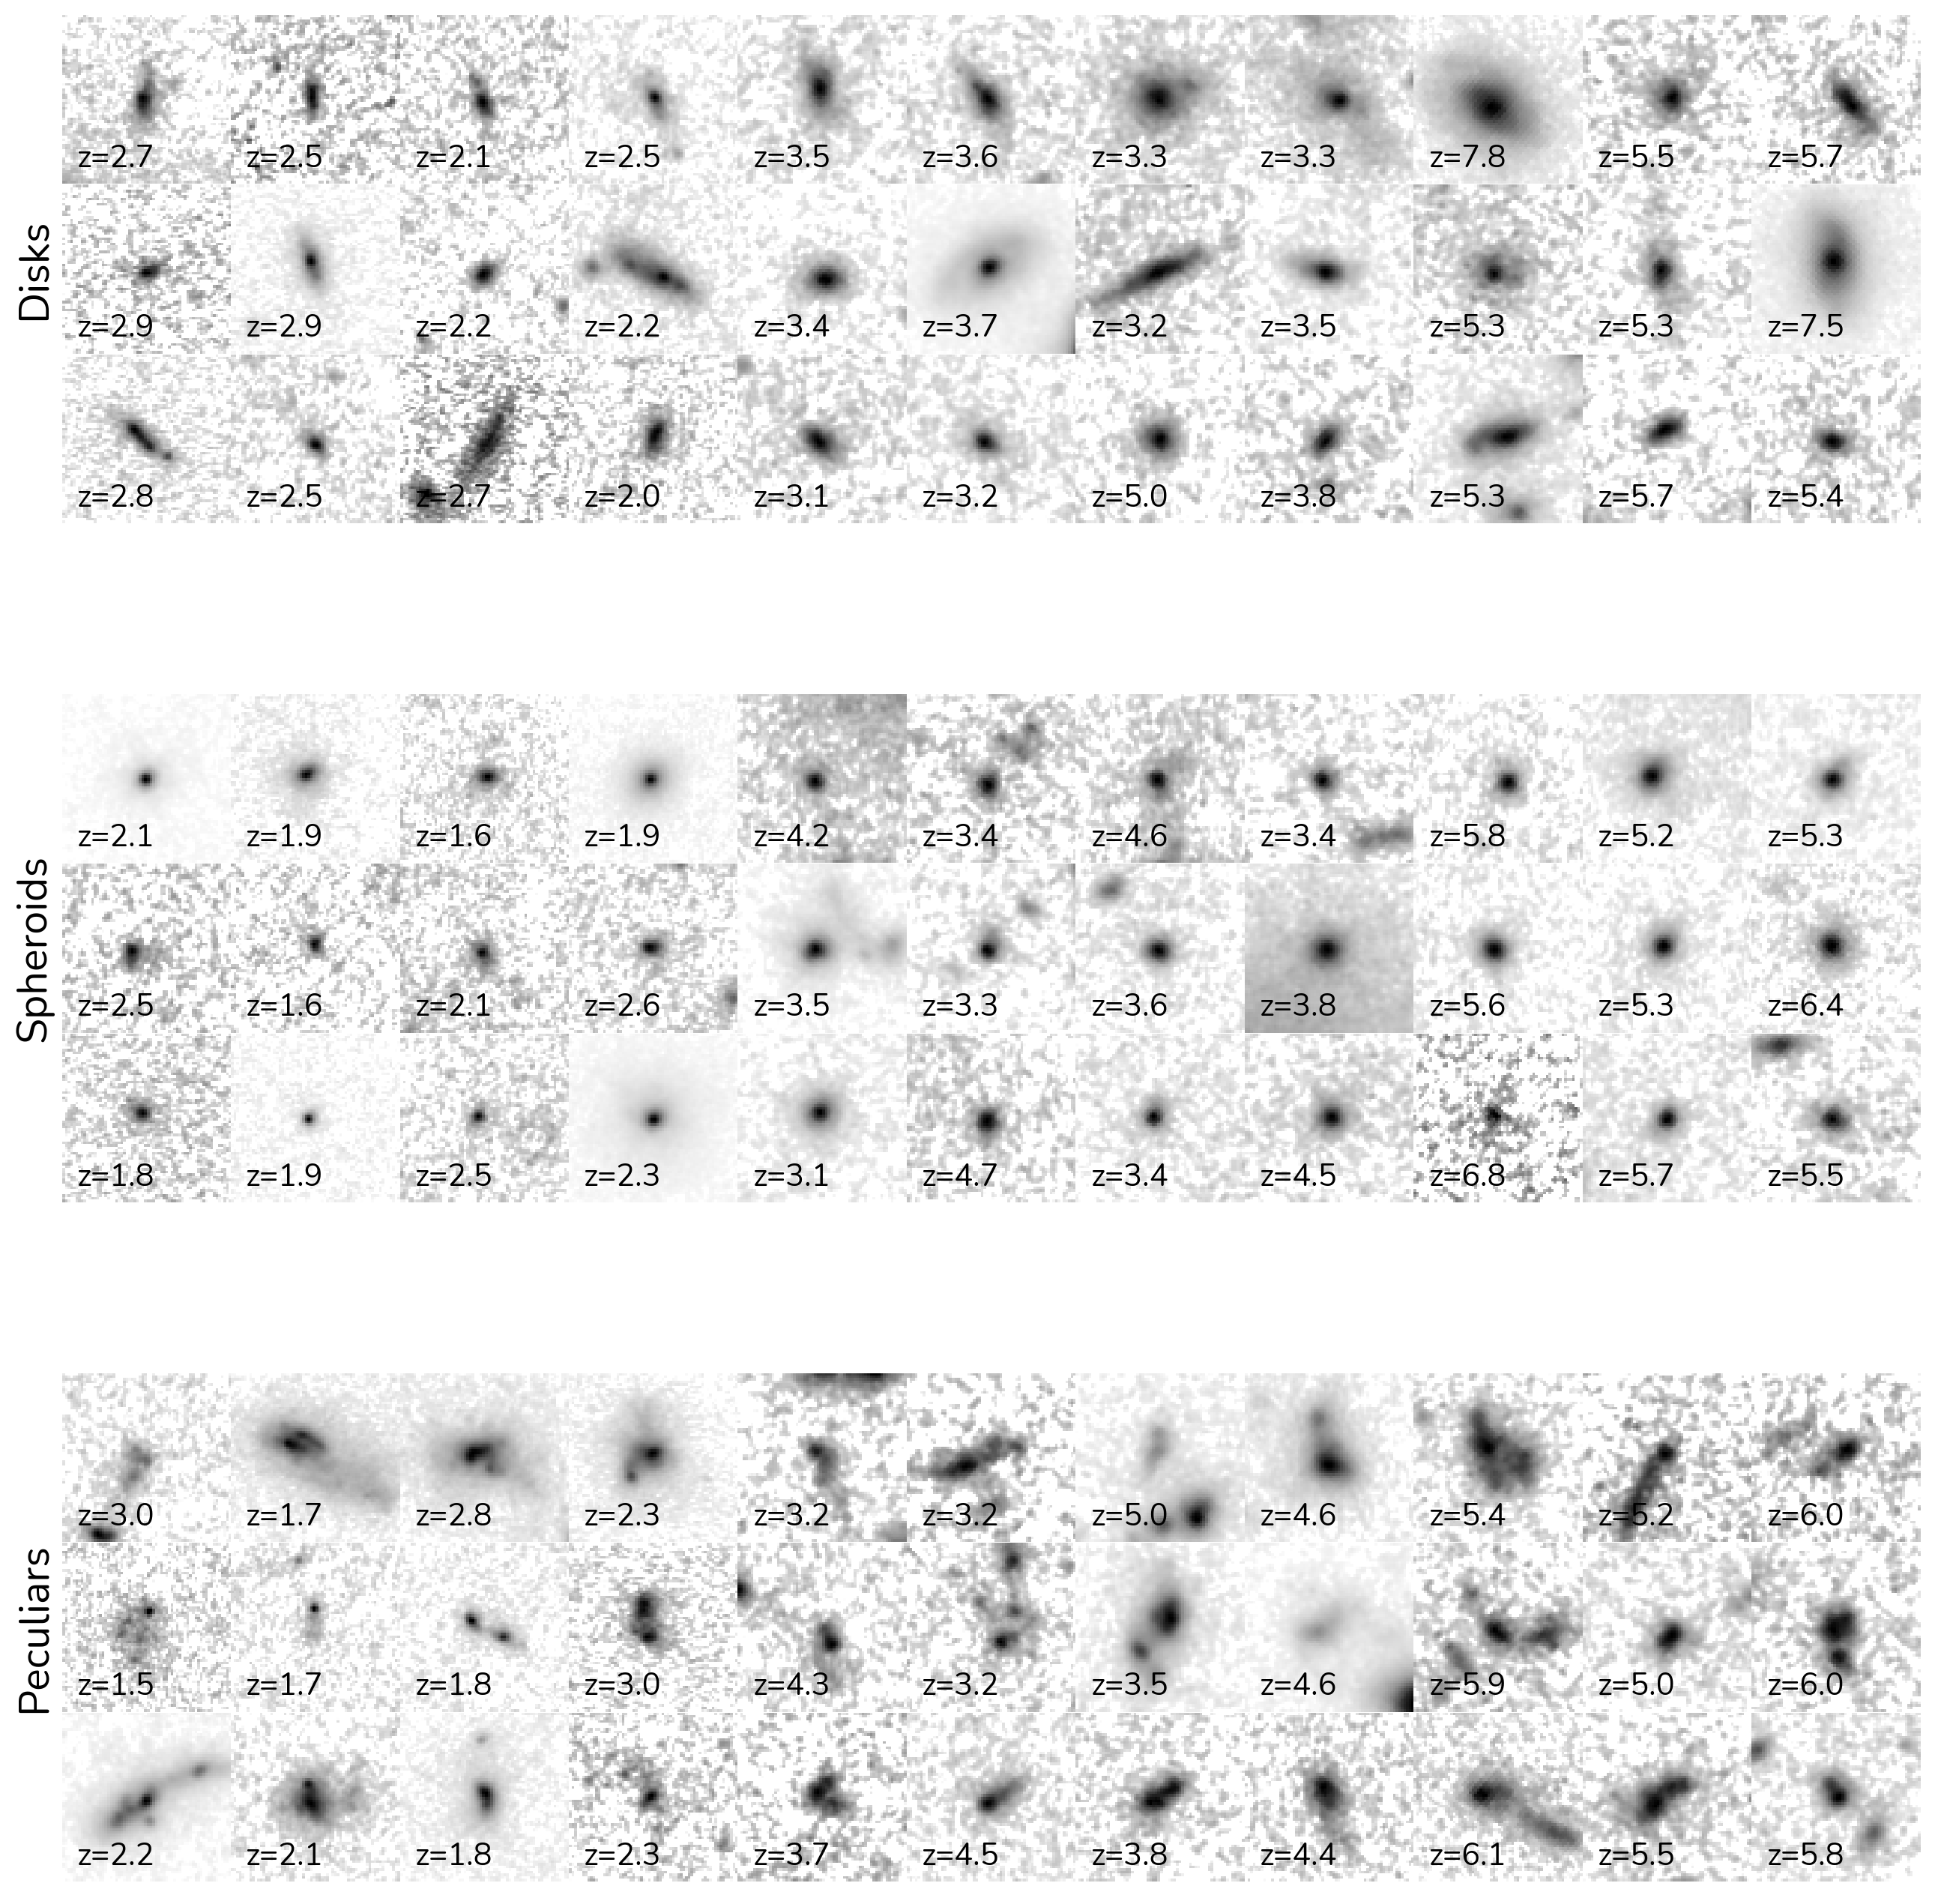
We report the morphology and structure evolution of the sample of 4265 galaxies (§ 2) based on visual classifications (§ 2.3) and in quantitative morphology measurements (§ 2.4). The aggregated classifications catalog based on 6 independent classifiers contains 1696 disks (), 561 spheroids (), 1112 peculiars (), 434 ambiguous sources (), 66 point sources () and 396 unclassifiable sources (). Examples of each of these types are shown in Figure 2 in bins of increasing redshift. The full catalog is publicly available555Full catalog will be made publicly available once this paper goes to press at https://github.com/astroferreira/CEERS_JUNE_VISUAL_CLASSIFICATIONS.
These visual classifications are the basis for the discussion in this section. In Section § 3.1 we detail the three base classes and the caveats from the visual classifications. We follow with a description of the quantitative morphologies of these sources and how they relate to the visual classifications in Section § 3.2. We explore the evolution of the Hubble Sequence in § 3.3, the evolution of the contribution of each morphological class to star formation and stellar mass in § 3.4. We compare these classifications with predictions from cosmological simulations in Section § 3.5, and in § 3.6 we briefly discuss the main differences between HST and JWST imaging that could explain some of the discrepancies from previous studies.
3.1 Disks, Spheroids and Peculiars
Figure 2 displays examples randomly drawn from the catalog for the three main morphological classes: disks, spheroids and peculiars, respectively.
The visual distinction between these classes is clear, with the disks often showing two structural components in the form of a concentrated bulge and a disky envelope, while the spheroids are mostly single-profile, centrally concentrated sources, with some exhibiting PSF-like structure due to the central concentration or AGN emission. However, we note that for most cases, telling apart two types of light concentrations by eye is a difficult task, as sources at high redshifts do not show other clear, disk-like features such as spiral arms, bars and rings, and overall display lower concentrations (Buitrago et al., 2008, 2013). For a better distinction between face-on disks and spheroids, a quantitative approach such as Sérsic fitting might be used alongside visual classification.
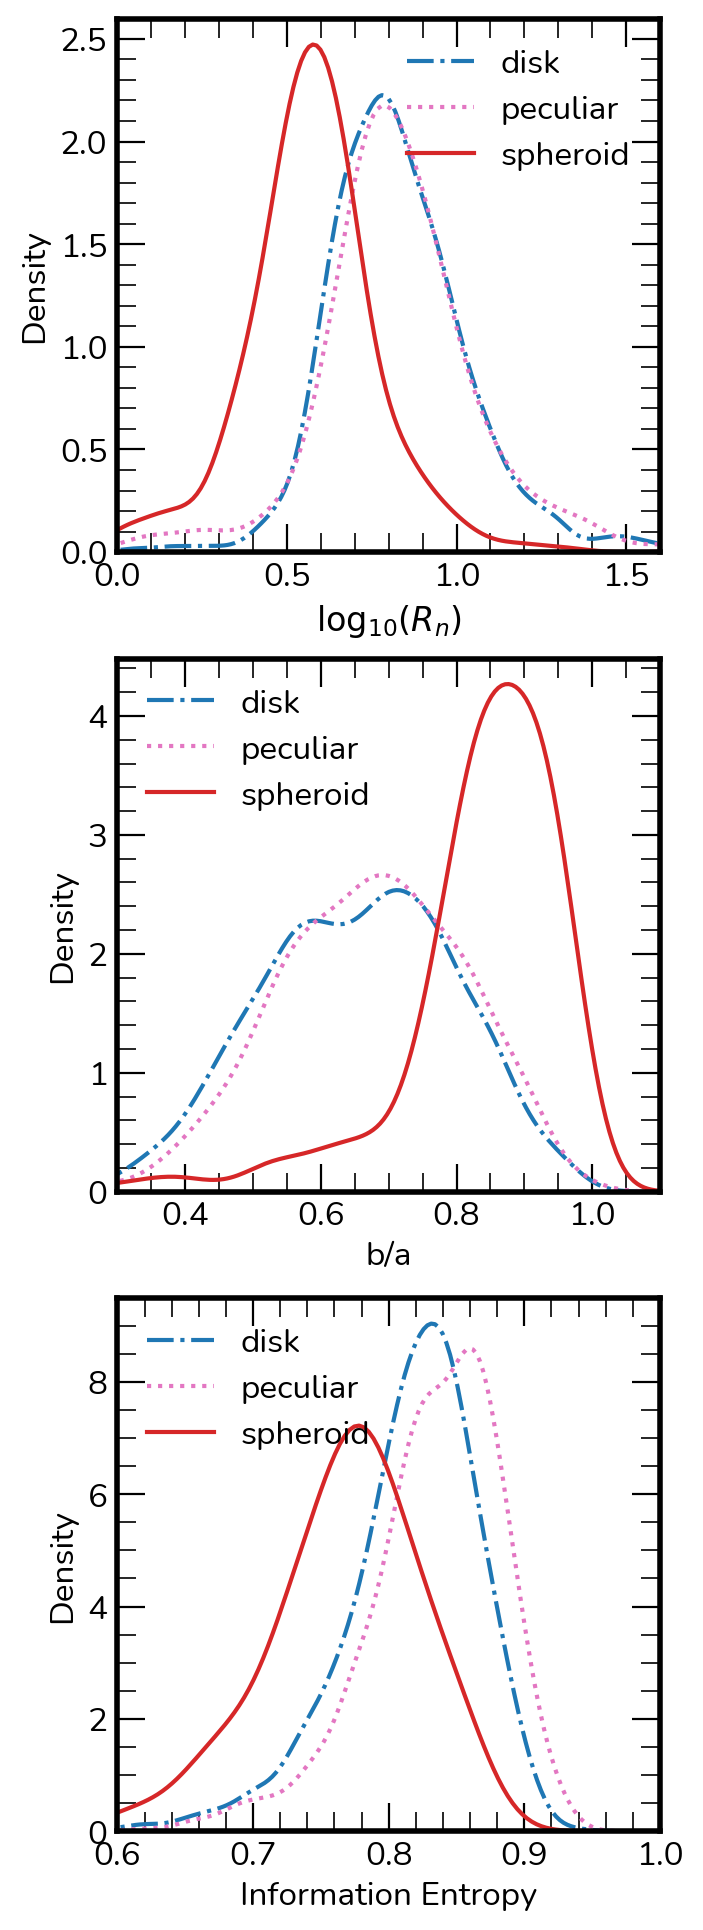
Figure 3 shows three indicators for visual distinctions between the overall sample of disks and spheroids. spheroids are more compact with lower effective radius, higher axis ratios, and lower information entropy (e.g., Shannon entropy) indicating lack of structure. The information entropy describes how the pixel values in an image are distributed, smooth galaxies will present low entropy while clumpy galaxies will have high entropy (see Ferrari et al. (2015) for details on how it is calculated). These distributions follow what is found for high redshift spheroids in previous studies, in that they are round and smaller than disks (Buitrago et al., 2013). However, the axis ratios found here are on the high end, with a lack of spheroids with intermediary axis ratios . Ultimately, some biases might be present, such as the elongation/axis ratio causing some contamination, and thus we possibly miss some elongated spheroids, but this is expected due to each classifier’s subjective perspective on what defines these. We advise the user of the catalog to leverage the class fractions to control purity by only selecting sources with strong agreement.
The peculiars on the other hand vary wildly, from mild disturbances, to clear signs of galaxy merging, often with a companion nearby. Additionally, some high redshift disks and spheroids might end up being classified as peculiars due to more asymmetric/disturbed morphologies than low redshift counterparts. However, as discussed in § 3.2, for most peculiars, the quantitative morphology is consistent with disturbed morphologies.
3.2 Quantitative Morphology Evolution
Cross-examining the morphologies defined by eye using quantitative methods is essential for understanding how their appearance changes across cosmic time. We explore the visual morphologies with several quantitative morphology indicators, both non-parametric and parametric (§ 2.4).
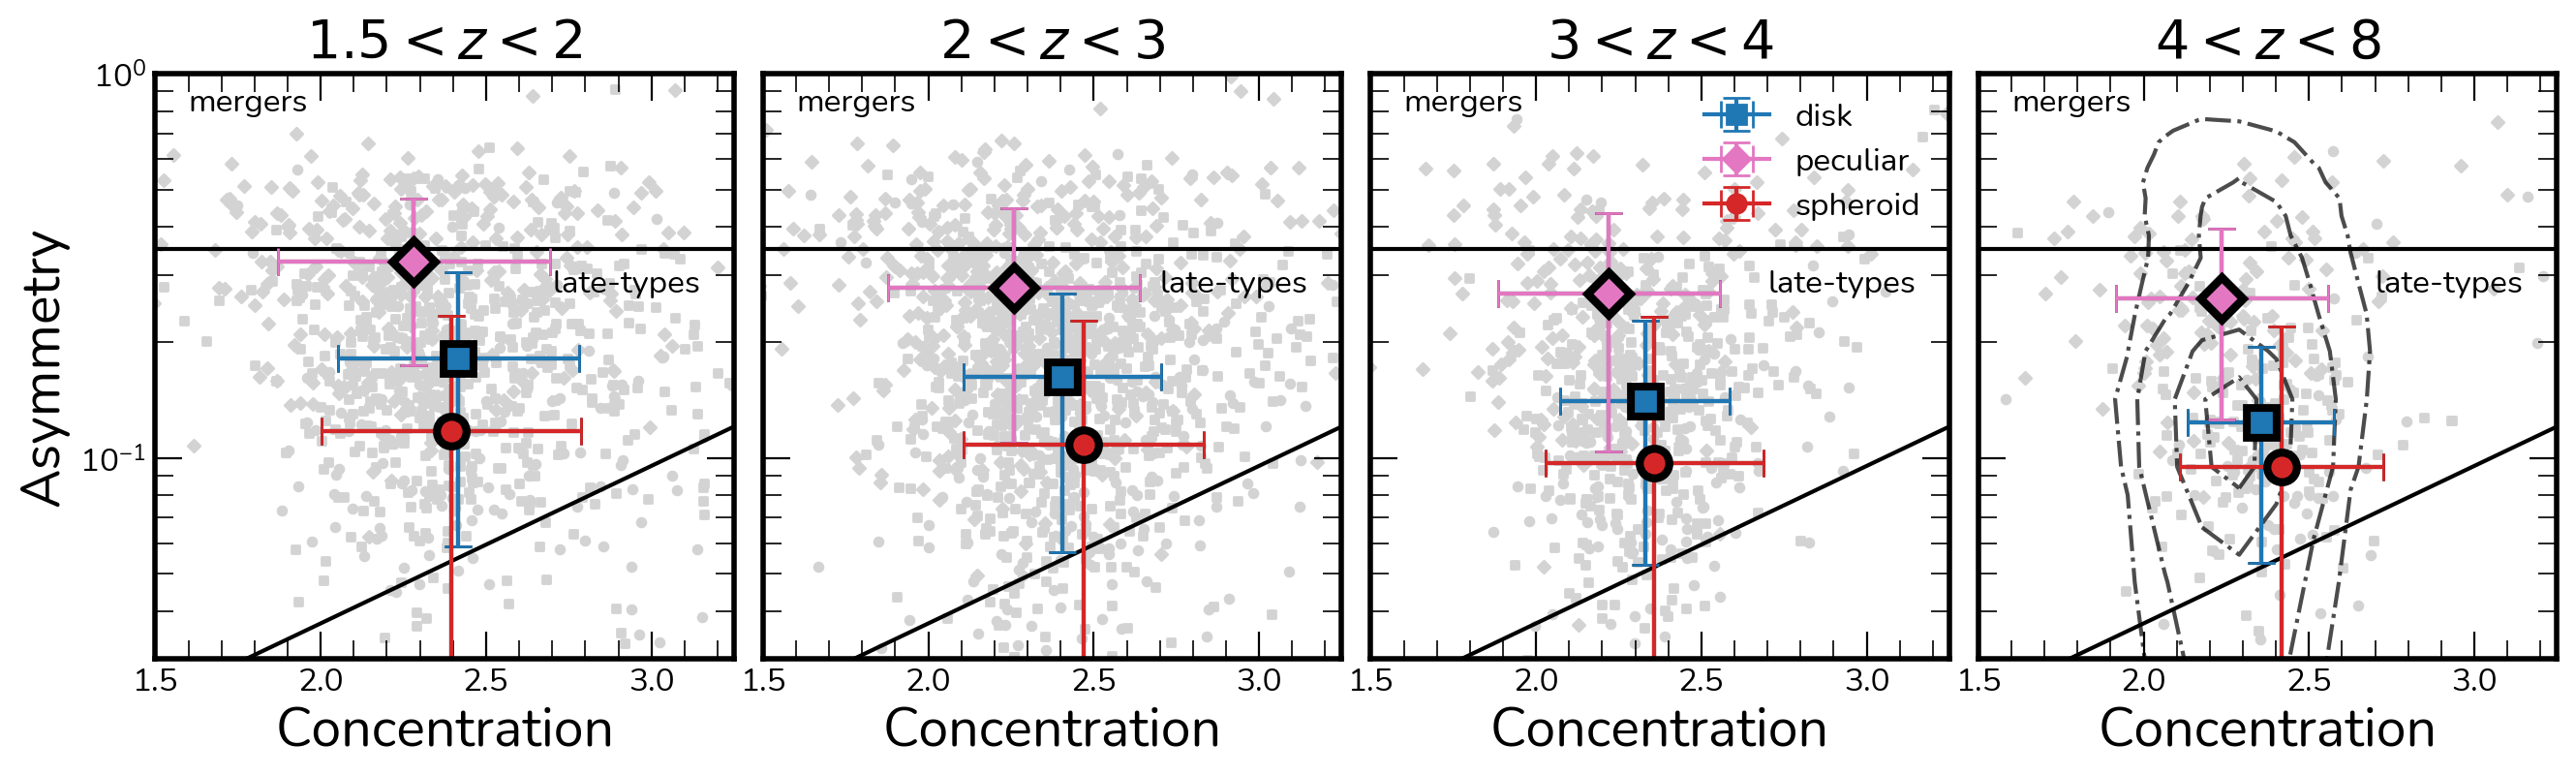
Figure 4 shows the concentration () and asymmetry () plane based on Morfometryka measurements for 4 redshifts bins. The mean values alongside the distribution’s and percentiles for disks, spheroids and peculiars are plotted as blue squares, red circles and pink diamonds, respectively. Each class has its distributions positioned within the expected regions for high redshift galaxies, with peculiars occupying the top of the diagram, the disks the central region and the spheroids around the lower right, including a high overlap. The positions of each of the three classes remain fairly stable over all redshifts, but the spheroids have higher asymmetries and lower concentrations overall at higher redshift, with larger overlaps with the disks. Also displayed with solid lines is the merger criterion based on asymmetry, as
| (1) |
and the diagonal late-type vs. intermediate types boundary based on Bershady et al. (2000). We also explore the G- plane (Lotz et al., 2004, 2008) but we do not find any clear separation between the types, apart from the distinction between sources having close companions or being isolated, similar to what is reported in Rose et al. (2022).
For the highest redshift bin (), we also show the contours for the distribution of the measurements for 50,000 galaxy mocks from the BlueTides simulations (Marshall et al., 2022a). The measurements from the real observations are in good agreement with the measurements for BlueTides mocks. We note that the effective spatial resolution of the BlueTides simulation is ckpc, which corresponds to 0.269 pkpc, or at . This resolution may have an effect on the resulting galaxy morphologies, particularly the inner regions and thus their concentration, but no clear effect is seen here, different to what is found for high- IllustrisTNG mocks (Whitney et al., 2021).
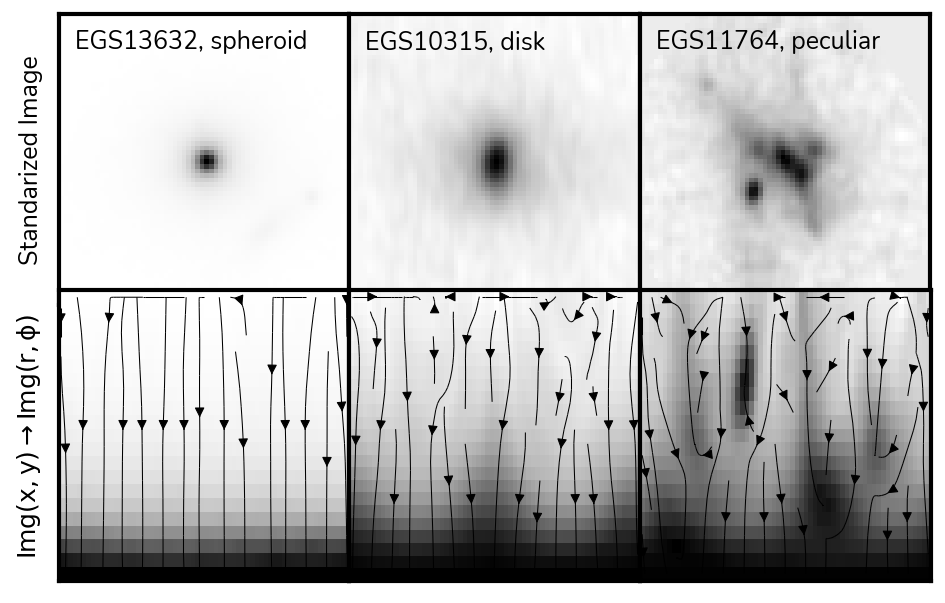
The spirality index – the standard deviation of the galaxy polar image gradient map, designed to measure the amount of non-radial structures in the galaxy – has proven to be very effective in discriminating different classes in this sample. If the galaxy is smooth, its polar image will consist of a single horizontal strip, which will imply a low value for . On the other hand, although we cannot resolve spiral arms in most cases, if the galaxy contains peripheral structures or companions, the polar image will be irregular with a corresponding high . We point the reader to the Morfometryka (Ferrari et al., 2015) paper for a full description of the calculation.
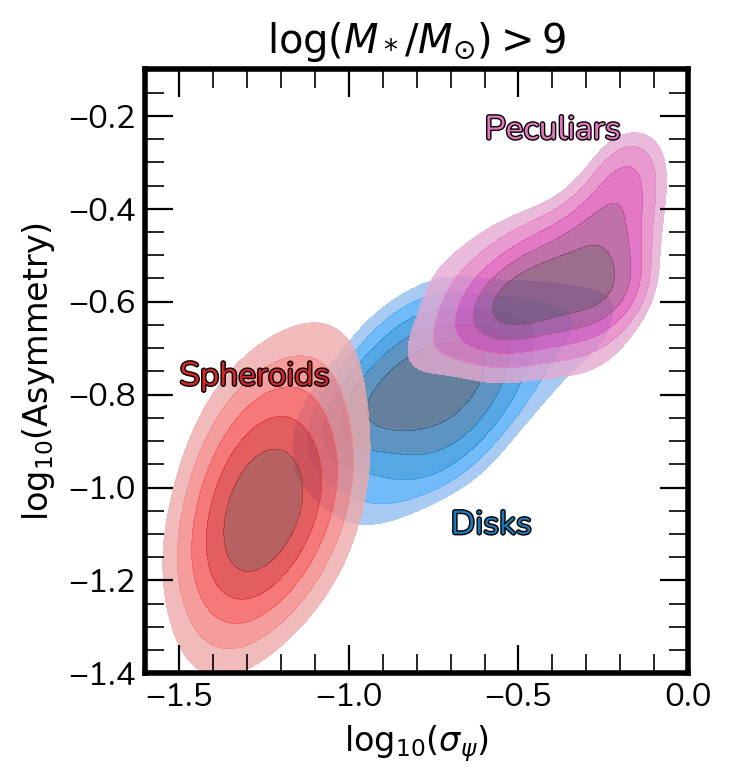
In Figure 5 we show that combining with the asymmetry () warrants a reasonable quantitative separation of the overall classes, as the center of each class distribution is well separated in this plane, unlike in the C-A or G-M20 diagram. As an example as to what is captured by the measurement, we show three galaxies in Figure 6, one for each class, with their respective polar coordinate image and the gradient lines that are used to compute . The distinction between spheroids and disks is subtle, but it is very powerful when large non-radial structure is present in the outskirts of the source.
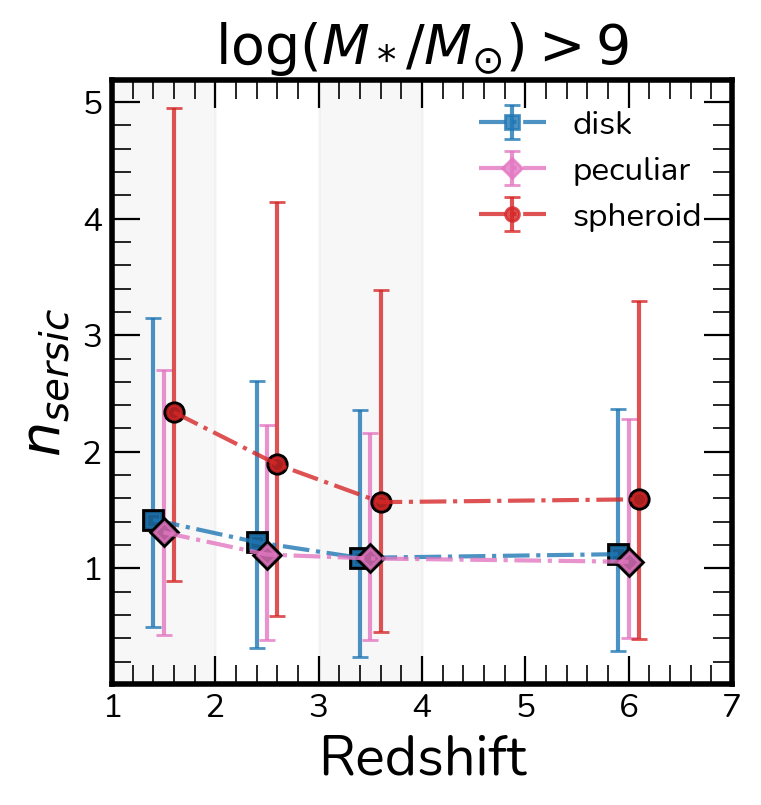
Finally we explore the evolution of the Sérsic profiles (Sérsic, 1963) through the redshift evolution of the Sérsic index for galaxies with . In Figure 7 we report mean values together with the and percentile limits as error bars to represent the distributions at each redshift bin for each class. Disks and Peculiars exhibit similar Sérsic profiles, with at to at . The spheroids, on the other hand, show higher Sérsic indicies at all redshifts, with at to at . The distinction between the classes is clearer than what was reported in Ferreira et al. (2022) as the CANDELS overlap allows us to quickly select high mass galaxies only. The slopes for each class are also different, with the spheroids increasing in Sérsic index more rapidly. The similarities among disks and peculiars suggest that the majority of these disturbed and merging systems are still disk dominated.
3.3 Evolution of the Hubble Sequence
One principal goal of looking at galaxy morphology and structure is to establish when and how the Hubble Sequence (Hubble, 1926) emerges in the context of the hierarchical assembly of the universe.
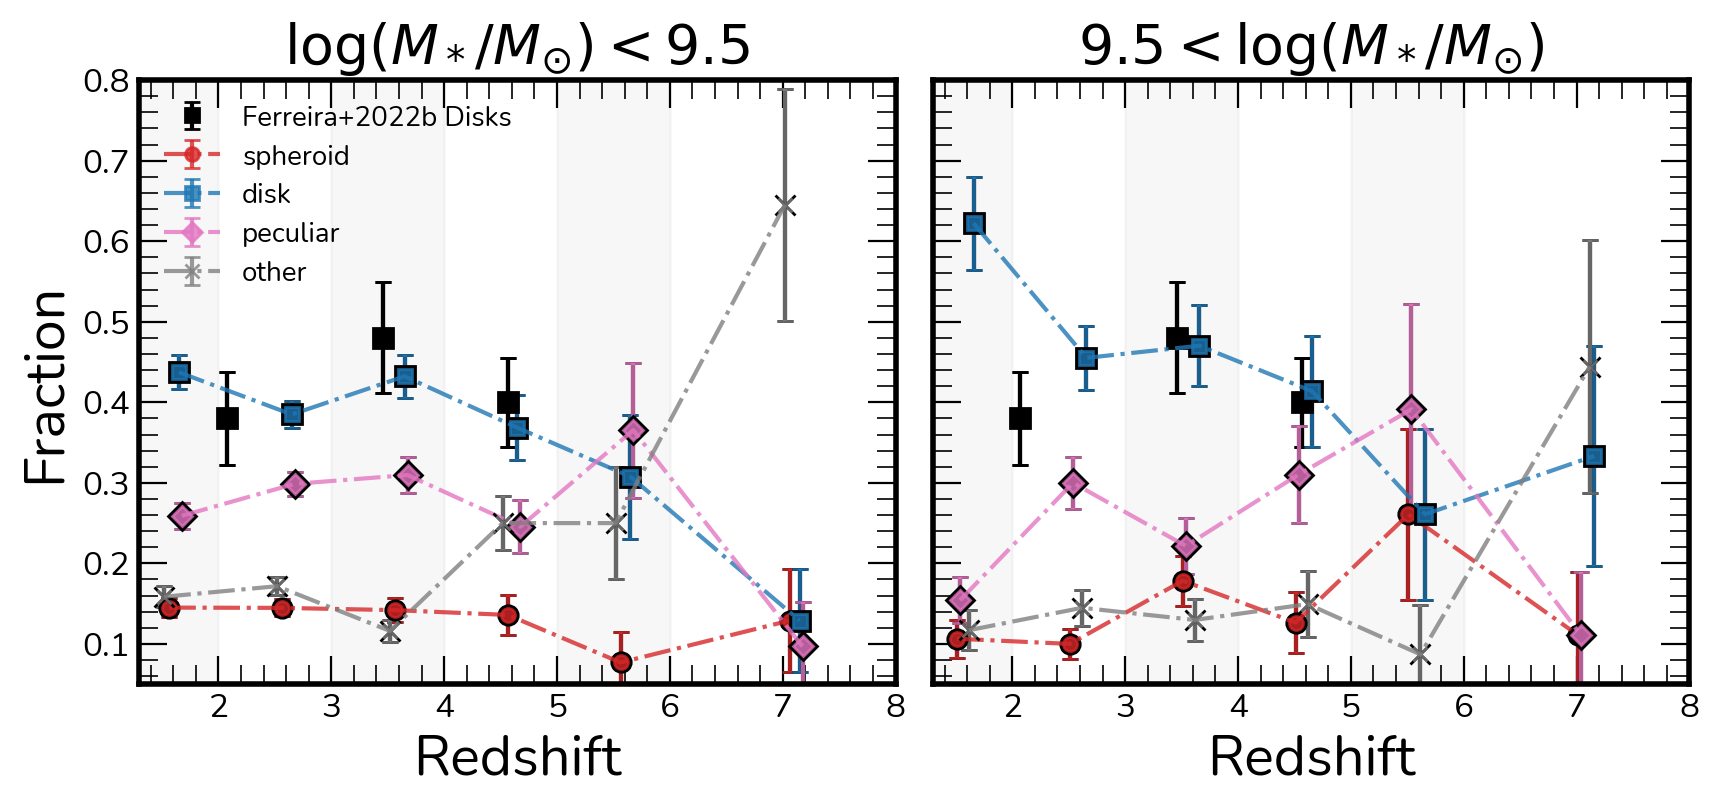
Here we report the redshift evolution of morphological classes that encompass the three main categories of the Hubble Sequence from , from when the Universe was only Gyrs old up to Gyrs. In Figure 8 we show this evolution in two mass bins, with the left panel displaying sources with while the right panel shows this evolution for . Spheroids are displayed by red circles, peculiars as pink diamonds, disks as blue squares, and the other three possible categories as other (point sources, ambiguous and unclassifiable) in gray crosses. The fraction of disks from Ferreira et al. (2022) are shown as black squares for comparison.
For low masses () we do not find any systematic evolution with redshift, with all class fractions remaining fairly constant, with disks at , peculiars at and spheroids at . The only exception is at the highest redshift bin , where all fractions go down to due to the sharp increase of faint and ambiguous sources, artifacts and unclassifiable cases, representing the limits on the depth of our dataset at the low mass range. The disk fractions between agrees well with what was previously reported in Ferreira et al. (2022), but now with a 20 fold increase in sample size, as shown by the smaller error bars.
On the high mass cases () we observe an evolution of the disk fraction from at to at while the fractions of peculiars increases from to in the same redshift range, and spheroids increase from to between .
We also note that there is a slight possible discrepancy between the number of high-mass disks between this work and our previous results in Ferreira et al. (2022). This is most likely because the sample in Ferreira et al. (2022) includes galaxies of all mass, and so the sample is contaminated by low-mass galaxies which are less likely to be disks, as seen in our data as well. However, when we divide our sample into masses and compare with Ferreira et al. (2022) we find very similar results.
3.3.1 Spheroid Evolution
Another remarkable aspect of the evolution of galaxy type fraction is that the spheroid fraction is roughly constant, even up to the highest redshifts, but lower than the level seen for local galaxies. We generally do not see an increase in the number of elliptical galaxies at lower redshifts, at least down to . We might have been expected to see more spheroids at lower-z if mergers are progressively transforming peculiars into ellipticals. This indicates that elliptical galaxies at the mass ranges we probe must form morphologically relatively late in the history of the universe. Despite this, there are clear indications that some ellipticals were morphologically present very early in the universe’s history. This may be a sign of different formation mechanisms at play for these spheroids at different epochs, with some forming through dissipative collapse, some from major mergers, and others through minor mergers.
These trends also suggest that the classic picture of morphology and structural evolution driven by merging might be only important for massive galaxies, where the low mass universe can be described broadly by a consistent Hubble Sequence in the range . We discuss this in more detail in the section below.
3.3.2 The role of mergers in early galaxy assembly
Prior to JWST, the scientific consensus obtained through both observations and simulations was that in the early Universe, galaxies grow and evolve through hierarchical mergers. In simulations, this is seen in galaxy merger trees (e.g., Mo et al., 2010), as well as in the fact that the merger rate increases with redshift (e.g., Conselice et al., 2003; Rodriguez-Gomez et al., 2015; Duncan et al., 2019; Ferreira et al., 2020). Although observational studies of extremely high-redshift galaxies were previously limited, Mortlock et al. (2013) found an increase of the fraction of peculiar galaxies with redshift, supporting the idea that mergers were frequent.
However, the first JWST observations challenged this picture. Ferreira et al. (2022); Nelson et al. (2022); Jacobs et al. (2022); Robertson et al. (2022) all found a higher fraction of high-redshift disks and a lower fraction of peculiar galaxies than expected. The initial results, although based on small datasets, suggested that either mergers are less frequent that we thought, or that high-redshift disks tend to survive mergers and retain their disk morphology.
In this paper, for the first time, we looked at a statistically large sample of high-redshift galaxies observed with JWST, split into two different mass bins, to trace the evolution of high- and low-mass galaxies.
As stated in 3.3, low-mass galaxies show a flat gradient in morphological type fractions. This suggests again that for low-mass galaxies, mergers do not drive structural evolution. Intuitively, this makes sense: since galaxies in this mass bin have assembled less mass, they are less likely to have experienced many mergers in their history. Therefore, the lack of obvious post-merger low-mass galaxies is not surprising.
In the high-mass bin, we see a steady decline of disk fraction at higher redshift, made up for by an increase of the peculiar fraction. This result supports the merger paradigm in principle and is similar to the pattern seen with HST (e.g., Conselice et al., 2008). Our results are in fact consistent with a significant fraction of high-mass galaxies undergoing mergers in the early Universe, going through a peculiar phase, and then forming stable disks. Kinematic observations of these galaxies would go some way towards understanding if this picture is correct.
However, the fraction of high-mass disks is still significantly higher in our data than in HST-based analyses (e.g., Mortlock et al., 2013). At , 50% of galaxies in our JWST observations have a disk morphology, compared to 10% in Mortlock et al. (2013). Therefore, our results still point at a tension between HST- and JWST-based morphology studies. Although our results are consistent with some of the evolution between and being merger-driven, the fraction of disks is still too high. We will investigate in future papers the detailed merger histories of these galaxies based on the JWST data. Ultimately, we want a self-consistent observational picture for how galaxy formation is occurring.
Overall, we see that peculiar structure is more common among high-mass than low-mass galaxies, pointing towards mass assembly via mergers; however, the fraction of disk galaxies in the high mass bin is still higher than what is observed by HST. Some implications of this result could be that either 1) galaxies grow by mergers as well as by another process, e.g., gas accretion (L’Huillier et al., 2012), or 2) mergers between high-mass galaxies do not destroy disks efficiently, allowing some galaxies to retain their disk morphology in the long-term (Hopkins et al., 2009; Sparre & Springel, 2017).
3.4 Star Formation and Stellar Mass Evolution
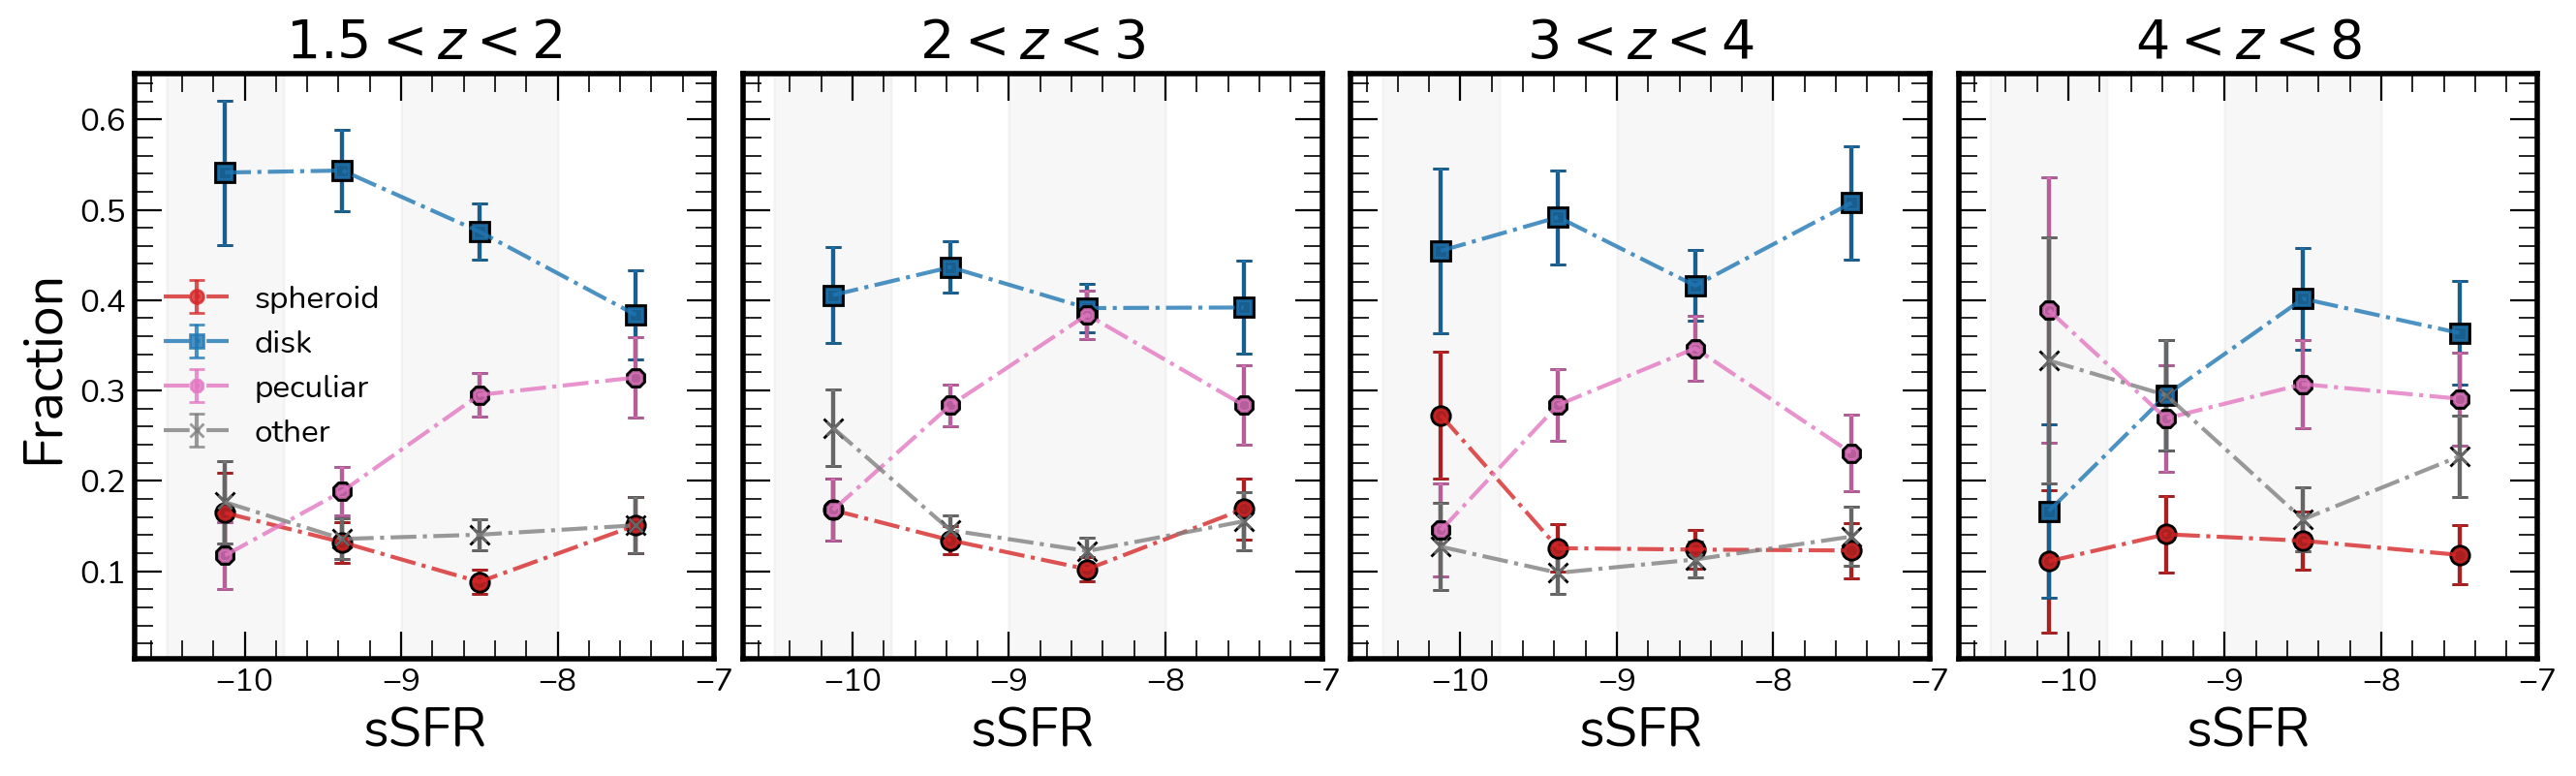
One important goal of tracking morphologies across cosmic time is determining if different morphologies contribute to the star formation and the stellar mass budget of the universe differently. In the previous section we explored the fractional evolution with redshifts, concluding that disk galaxies dominate the overall fraction of morphologies at , and possibly higher redshifts. In Figure 9 we show the class fractions in bins of specific star formation rates (sSFR) divided in four redshift bins. The overall fraction of galaxy types for each redshift panel can be seen in Fig. 8, while each bin in Fig. 9 shows these fractions for a given sSFR bin. Once more, the disks dominate the overall contribution in sSFR, with spheroids showing similar fraction to the overall fraction of spheroids in the sample. However, we see that at high sSFR bins, the contribution of peculiar galaxies increases, to become as important as disk galaxies despite their lower overall fractions in the sample. The same trend is shown for all redshift bins, as the fraction of peculiars increase with increasing sSFR. For the highest redshift bin (), peculiars display roughly the same contribution as disks. Spheroid fractions are slightly higher at lower sSFR. This suggests that peculiar galaxies are important sites of star formation at all times in the Universe, and especially at higher redshifts.
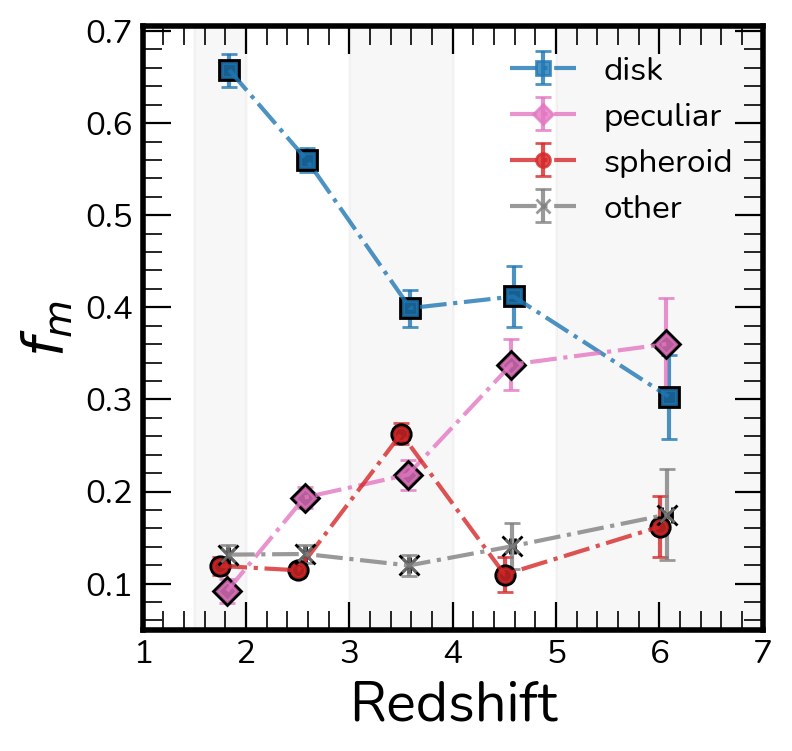
In Figure 10 we show the contribution of each morphological class to the total stellar mass in each redshift bin. This shows that most of the mass in the very early universe was located in peculiar galaxies, while a clear trend with redshift is evident for disk galaxies, such that for most of the mass of the sample is distributed among disk galaxies. More massive overall individually, the spheroid galaxies hold just a small fraction of the total stellar mass in this sample () as it is greatly outnumbered by the amount of mass in galaxies with disk morphologies. This is in contrast to what is found in the Hubble Deep Field (Conselice et al., 2005) due to the very different morphology fractions reported. It thus appears that for the bulk of the history of the universe, most stellar mass in the universe has been occupied in galaxies with disk like morphologies.
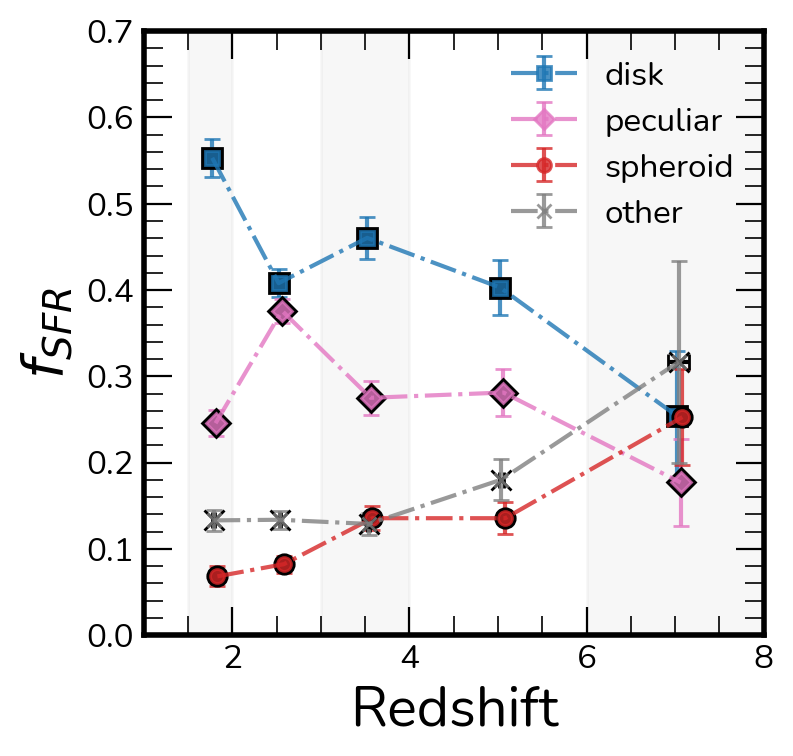
We plot in Figure 11 the fraction of star formation which exists in different galaxy types. As can be seen, the disk galaxies dominate the star formation rate in the universe up to at least . What this implies is that, within the mass selection we use, the most likely galaxy type in which stars form are in disk galaxies. However, this is still less than 50% of the star formation until . As can be seen, a significant amount of star formation also occurs in peculiar galaxies, which are probably mergers, but this does not dominate the method in which stars are formed.
3.5 Predictions from Simulations
We now look at numerical simulation results for morphological evolution over a similar redshift range. Simulations that resolve galaxies self-consistently typically model mass elements either on a grid or as particles. Particle–based decomposition methods (e.g. Abadi et al., 2003; Crain et al., 2010; Thob et al., 2019; Irodotou & Thomas, 2021; Zana et al., 2022) have been extensively used in order to split galaxies into different morphological classes and facilitate a comparison between observed and simulated galactic properties (Tissera et al., 2012; Pillepich et al., 2015; Irodotou et al., 2019; Monachesi et al., 2019; Trayford et al., 2019; Rodriguez-Gomez et al., 2022). However, the true morphology of a system may not always be accurately captured, as particle–based methods can be sensitive to small perturbations in the distribution of particles, which become progressively more significant at lower stellar masses as these galaxies are resolved with fewer particles.
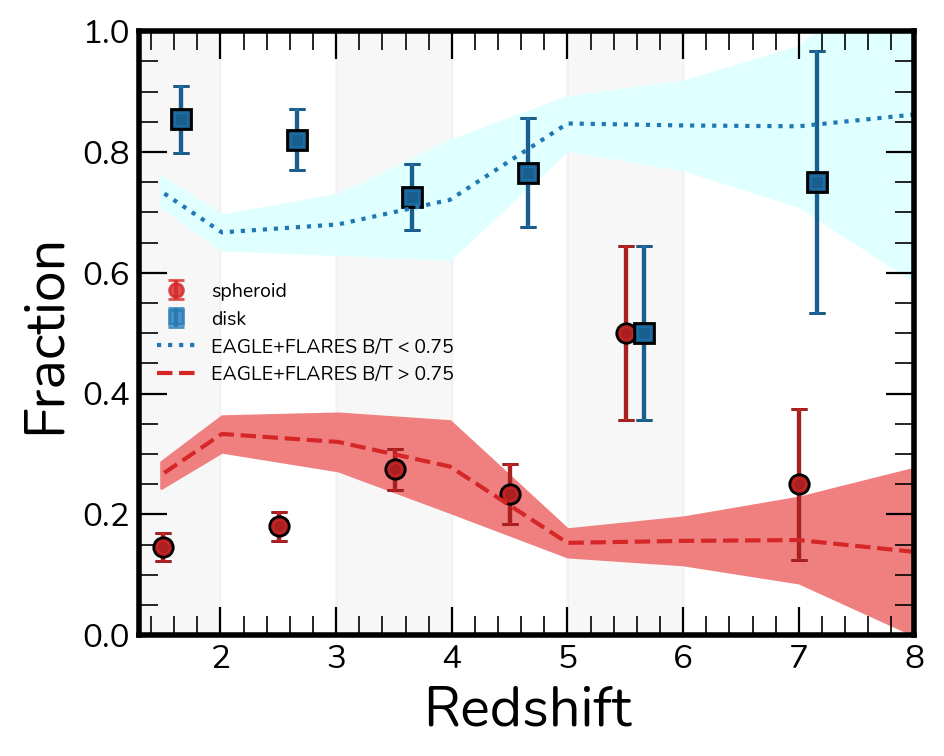
In this work, to ensure that both galaxies and their components are sufficiently resolved, and thus a particle–based decomposition is applicable, we use central and satellite galaxies from the Eagle (Schaye et al., 2015; Crain et al., 2015, for ) and Flares (Lovell et al., 2021, for ) simulations with stellar masses (i.e. even for a galaxy with 0.2 the bulge is resolved with more than a thousand particles with mass of a few Meach). We use the method developed in Irodotou & Thomas (2021) to decompose galaxies by firstly creating a Mollweide projection of the angular momentum map of each galaxy’s stellar particles. Then, stellar particles are assigned to a disc or spheroid component based on their angular separation from the densest grid cell. This allows us to calculate bulge-to-total mass ratios () and use these to split galaxies into two morphological classes: (i) spheroids with 0.75, (ii) spirals with 0.75. The aforementioned limits were calibrated at in order for the Eagle galaxies to match the morphological classes in the Conselice (2006) sample. In Figure 12 we show the comparison of these fractions with the relative fraction of disks and spheroids from the visual classifications for high mass galaxies with , ignoring the peculiars, as we do not have a direct way to classify peculiars in the simulation dataset. The trends between simulations and visual classifications agree for , with the exception of a single anomalous visual classification redshift bin showing similar fractions of disks and spheroids in . Fractions for overall disagree, with an excess of of disks in the visual classifications. It is worth noting, however, in this redshift range (i.e. ), (Lagos et al., 2018) showed that the fraction of dry major mergers in the Eagle volume increases. Since this type of mergers can efficiently reduce the angular momentum of the remnant, this will translate in a negative correlation between our values and redshift, as also seen in e.g. Fig. 4 of (Clauwens et al., 2018) for .
Park et al. (2022) reports similar findings for the Horizon simulations, with the fraction of disks dominating at around by using quantitative morphology indicators as a proxy for morphology.
3.6 HST vs JWST
As discussed in Sec. 3.3, there is a stark difference between morphological classifications derived with HST and JWST observations. The new JWST data is challenging our understanding of galaxy evolution and structure formation in the early Universe. Here, at the end of this paper, we discuss some differences between HST and JWST observations and provide an analysis of what contributes to this discrepancy. This is meant to facilitate discussion about why our results are so different from previous work and to point the way towards understanding how to carry out future JWST galaxy structure work.
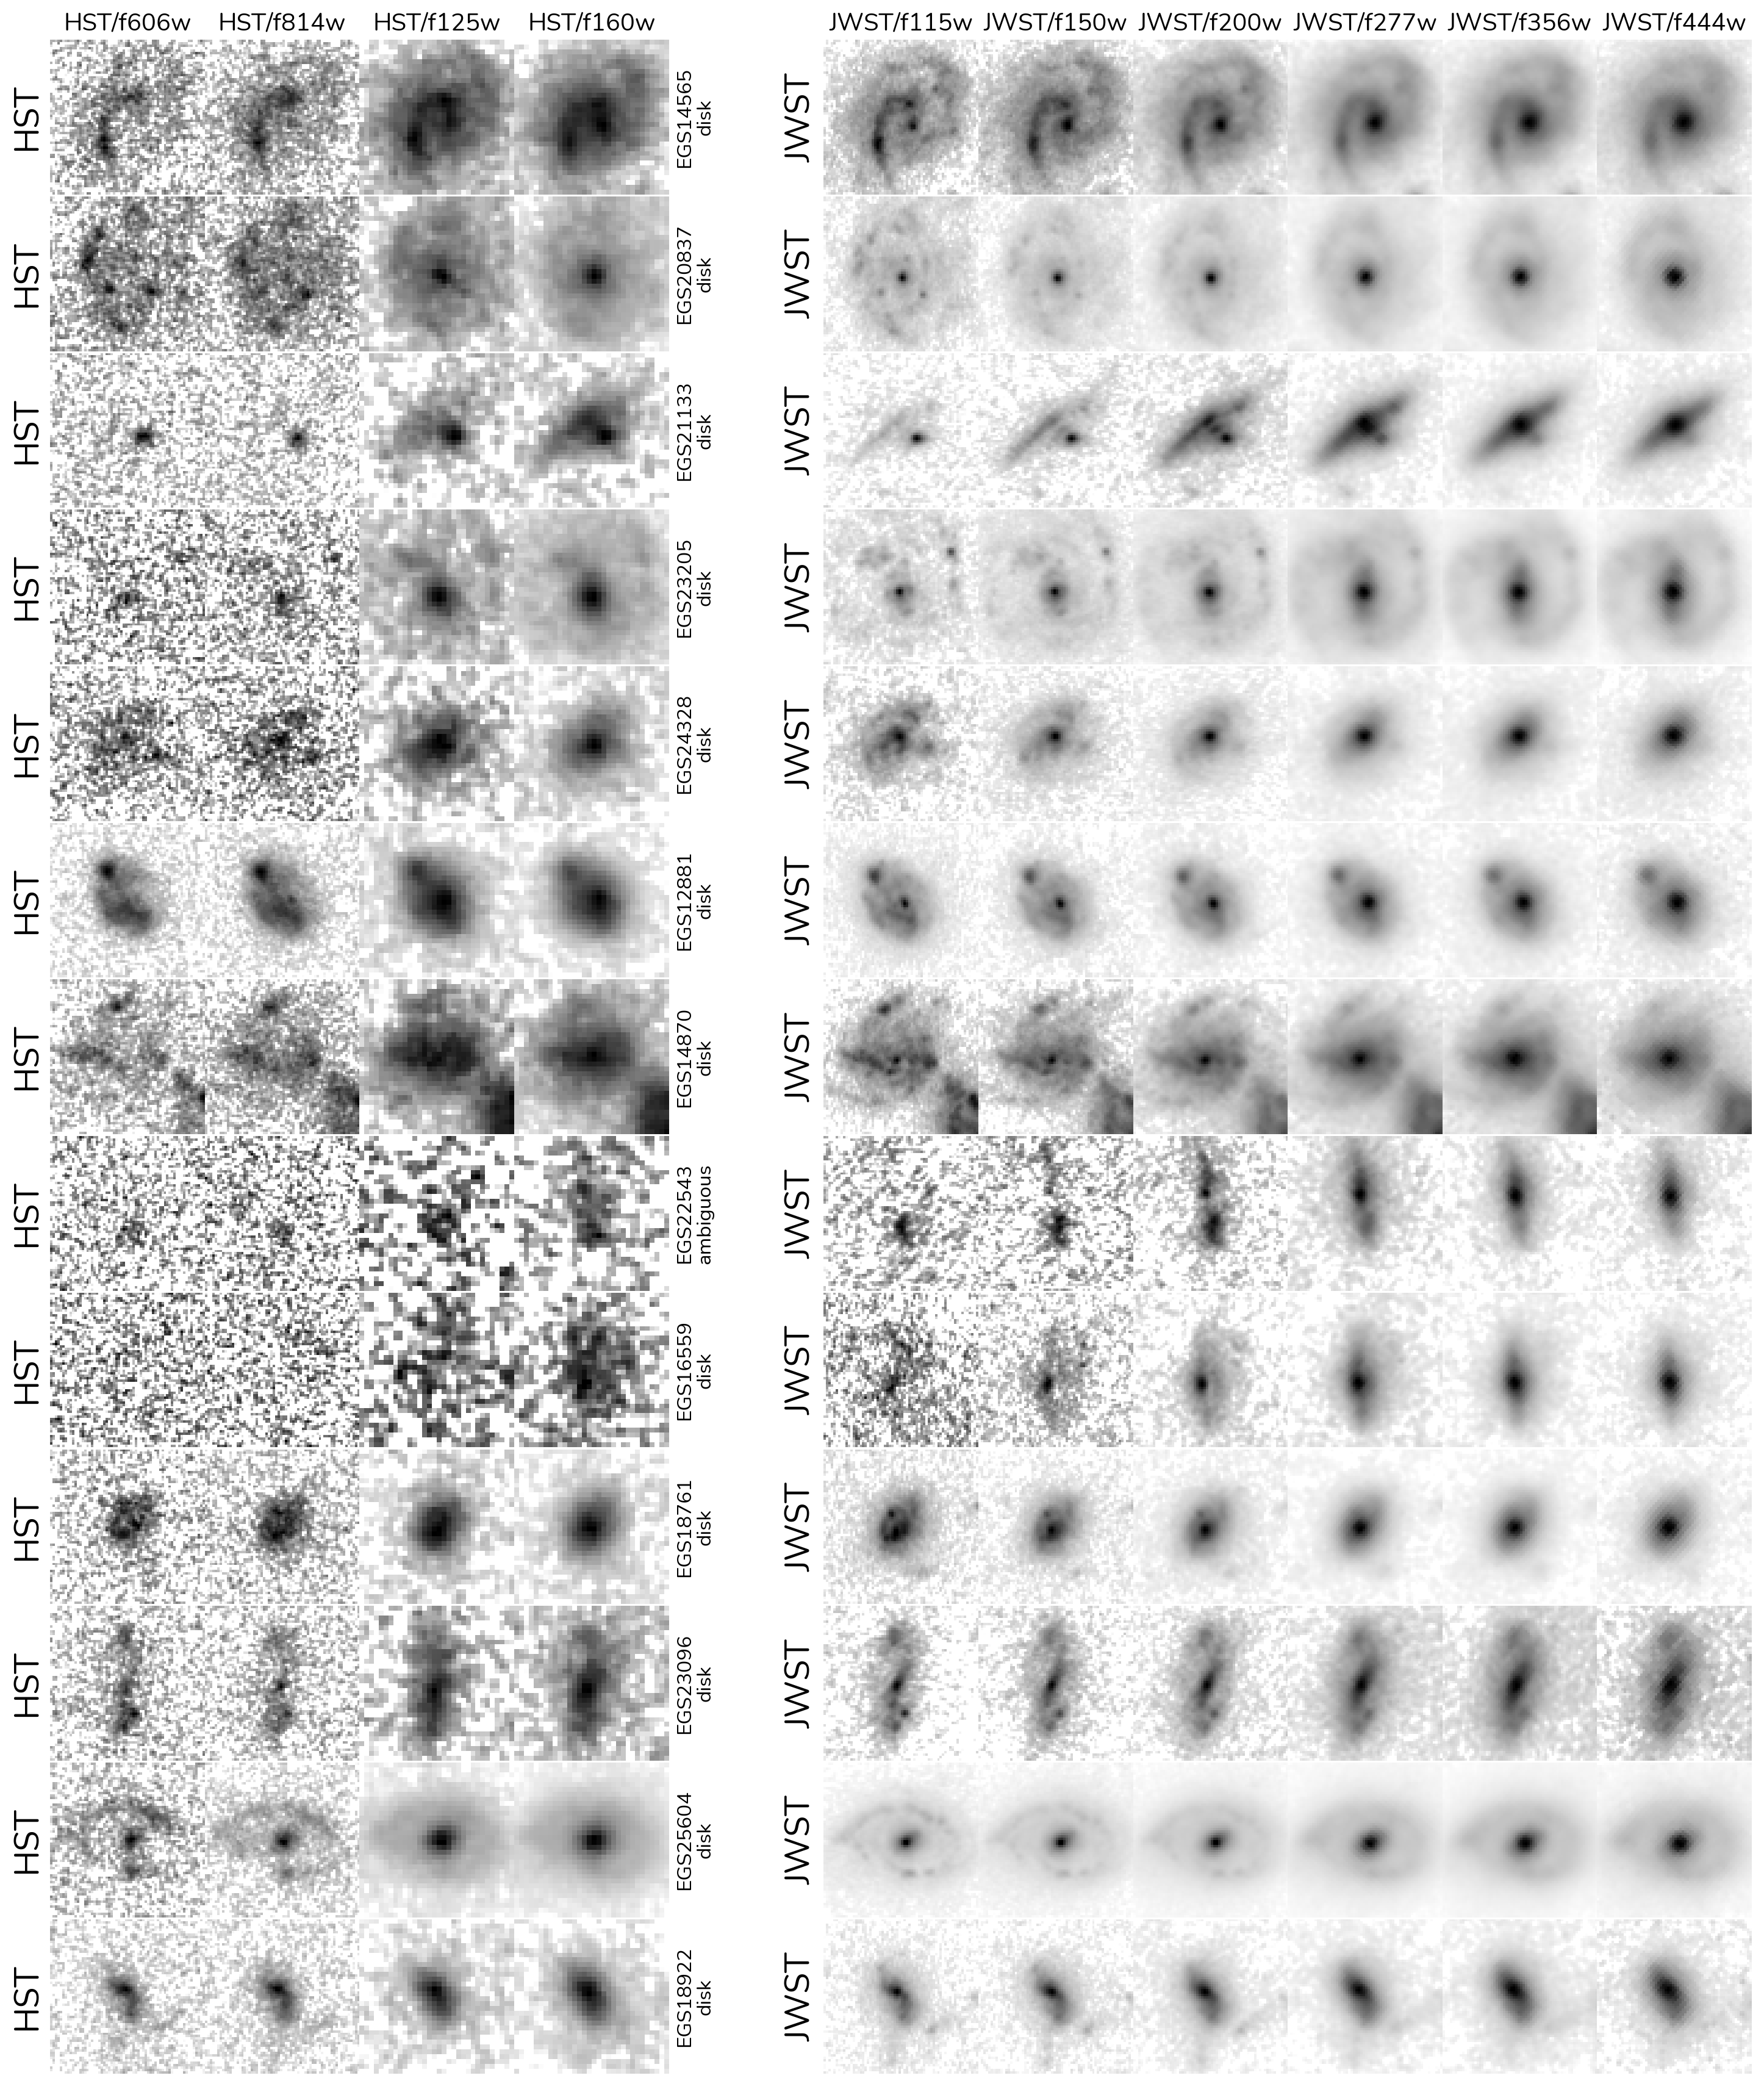
A comparison for a select number of galaxies in our sample between the NIRCam stamps and the HST ACS and WFC3 stamps is shown in Figure 13. Many galaxies show very clear structures in NIRCam but ambiguous morphologies in HST. In some cases, such as EGS23205, only the central component is clearly seem in HST, while a disk, spiral arms and a bar pops up in the longer wavelength bands. In a few cases, such as EGS22543, the source is barely detected in the WFC3 and SW NIRCam images, while a clear disk is visible for the LW NIRCam stamps.
A detailed comparison with the CANDELS classifications (Kartaltepe et al., 2015) is beyond the scope of this paper as our classifications do not align perfectly with the scheme defined in Kartaltepe et al. (2015). However, we briefly discuss the modes for which the discrepancies between classifications based on HST imaging and NIRCam can be explained. First, many of the fine structure such as bars and spirals, are hard to resolve at high redshifts due to the WFC3 pixel scale, and can be mistaken by merging signatures or disturbances, such as the case of EGS14565. It shows clear spiral structure in JWST but not as clear in HST, which could be mistaken as a merger in HST. Secondly, we find the wavelength coverage to be critical, as many of the galaxies at high redshift in HST are probed in the blue side of the optical, and are prone to absorption from dust, giving rise to asymmetric looking structures. Moreover, the bluer bands probe the youngest stars, which have more irregular spatial distributions tracing sites of ongoing star formation but not the underlying mass distribution. Galaxies such as EGS522543 and EGS16559 are good examples of this. This is also expected to be an issue for galaxies at in NIRCam images, as we start having the same issue as WFC3 for .
Future morphology classification studies, with more detailed descriptions and covering larger datasets, such as the complete cycle of CEERS, PRIMER, COSMOS-WEB, JADES and NGDEEP, together with the scope of citizen science projects like Galaxy Zoo (Lintott et al., 2011), will enable a detailed discussion on the main differences between HST and JWST morphology in the overlap region .
4 Summary and Conclusions
We present results on the rest-frame optical morphologies and the structural evolution of JWST observed galaxies at to 8 in a statistically significant sample of 4265 galaxies for the first time, using both visual classifications and quantitative morphology. We focus on galaxies observed by the CEERS program that overlap with the CANDELS fields, enabling us to use robust measurements of redshifts, stellar masses and star formation rates available in CANDELS.
Our major findings are:
I. Distant galaxies at display surprisingly regular disk morphologies at early times, such that for galaxies with , the fraction of disks/spheroids/peculiars appear to to be roughly constant at , showing that the Hubble Sequence was already in place as early as one billion years after the Big Bang.
II. For galaxies with higher masses , tremendous evolution is observed in the fraction of disks and peculiars, suggesting that the role of mergers might be more important to the massive cases.
III. Non-parametric morphology measurements agree well with visual classifications. However, a large overlap exists between classes in the usual CAS, etc. planes. We find that the spirality index () when combined with the asymmetry () makes a powerful diagnostic to separate disks/spheroids/peculiars.
IV. Comparisons with B/T studies from EAGLE and FLARES show that quantitative structures at high redshifts agree well with simulations, and are not unexpected from a theoretical standpoint, even if discrepant with previous morphological studies with HST.
V. Galaxies with disk morphologies dominate both the low sSFR and high sSFR populations, fairly outnumbering spheroids. However, the peculiar contribution to the sSFR budget increases with increasing sSFR and redshift, such that at the highest redshifts, the majority of the highly star forming galaxy population has disturbed/peculiar morphologies.
VI. The contribution to the total stellar mass of galaxies at high redshift is dominated by peculiar galaxies, while most of the stellar mass in the Universe at is located in disk galaxies. We also find that disk galaxies dominate the star formation rate at , suggesting that most stars in the universe were formed in a galaxy with a disk morphology. VII. We report clear examples of galaxies whose morphologies are hidden in HST imaging, but become clear and unambiguous in the NIRCam observations. Spirals and bars are better resolved and clear in the LW NIRCam filters.
In addition to the morphology study presented in this paper, we release the first version of our catalog of aggregated classifications to the community. Our goal is that this large sample of visually classified galaxies will serve as a base for early studies on morphology and structure, and will help the community develop methods and tools to tackle scheduled larger area observations such as COSMOS-WEB while data releases from large citizen science classifications projects, such as GalaxyZoo, are not available. These classifications can be used, for example, as an early training dataset for deep learning methods, or as a transfer learning sample for already established models.
References
- Abadi et al. (2003) Abadi, M. G., Navarro, J. F., Steinmetz, M., & Eke, V. R. 2003, ApJ, 591, 499, doi: 10.1086/375512
- Abraham et al. (1994) Abraham, R. G., Valdes, F., Yee, H. K. C., & van den Bergh, S. 1994, The Astrophysical Journal, 432, 75, doi: 10.1086/174550
- Adams et al. (2022) Adams, N. J., Conselice, C. J., Ferreira, L., et al. 2022, arXiv e-prints, arXiv:2207.11217. https://arxiv.org/abs/2207.11217
- Ashby et al. (2015) Ashby, M. L. N., Willner, S. P., Fazio, G. G., et al. 2015, ApJS, 218, 33, doi: 10.1088/0067-0049/218/2/33
- Astropy Collaboration et al. (2022) Astropy Collaboration, Price-Whelan, A. M., Lim, P. L., et al. 2022, ApJ, 935, 167, doi: 10.3847/1538-4357/ac7c74
- Bershady et al. (2000) Bershady, M. A., Jangren, A., & Conselice, C. J. 2000, The Astronomical Journal, 119, 2645, doi: 10.1086/301386
- Bradley et al. (2020) Bradley, L., Sipőcz, B., Robitaille, T., et al. 2020, astropy/photutils: 1.0.0, 1.0.0, Zenodo, doi: 10.5281/zenodo.4044744
- Buitrago et al. (2008) Buitrago, F., Trujillo, I., Conselice, C. J., et al. 2008, The Astrophysical Journal, 687, L61, doi: 10.1086/592836
- Buitrago et al. (2013) Buitrago, F., Trujillo, I., Conselice, C. J., & Häußler, B. 2013, MNRAS, 428, 1460, doi: 10.1093/mnras/sts124
- Clauwens et al. (2018) Clauwens, B., Schaye, J., Franx, M., & Bower, R. G. 2018, MNRAS, 478, 3994, doi: 10.1093/mnras/sty1229
- Coe et al. (2015) Coe, D., Bradley, L., & Zitrin, A. 2015, ApJ, 800, 84, doi: 10.1088/0004-637X/800/2/84
- Conselice (2003) Conselice, C. J. 2003, The Astrophysical Journal Supplement Series, 147, 1, doi: 10.1086/375001
- Conselice (2006) —. 2006, The Astrophysical Journal, 638, 686, doi: 10.1086/499067
- Conselice (2014) —. 2014, Annual Review of Astronomy and Astrophysics, 52, 291, doi: 10.1146/annurev-astro-081913-040037
- Conselice & Arnold (2009) Conselice, C. J., & Arnold, J. 2009, MNRAS, 397, 208, doi: 10.1111/j.1365-2966.2009.14959.x
- Conselice et al. (2003) Conselice, C. J., Bershady, M. A., Dickinson, M., & Papovich, C. 2003, The Astronomical Journal, 126, 1183, doi: 10.1086/377318
- Conselice et al. (2005) Conselice, C. J., Blackburne, J. A., & Papovich, C. 2005, ApJ, 620, 564, doi: 10.1086/426102
- Conselice et al. (2008) Conselice, C. J., Rajgor, S., & Myers, R. 2008, Monthly Notices of the Royal Astronomical Society, 386, 909, doi: 10.1111/j.1365-2966.2008.13069.x
- Crain et al. (2010) Crain, R. A., McCarthy, I. G., Frenk, C. S., Theuns, T., & Schaye, J. 2010, MNRAS, 407, 1403, doi: 10.1111/j.1365-2966.2010.16985.x
- Crain et al. (2015) Crain, R. A., Schaye, J., Bower, R. G., et al. 2015, MNRAS, 450, 1937, doi: 10.1093/mnras/stv725
- Delgado-Serrano et al. (2010) Delgado-Serrano, R., Hammer, F., Yang, Y. B., et al. 2010, A&A, 509, A78, doi: 10.1051/0004-6361/200912704
- Driver et al. (1995) Driver, S. P., Windhorst, R. A., & Griffiths, R. E. 1995, ApJ, 453, 48, doi: 10.1086/176369
- Duncan et al. (2014) Duncan, K., Conselice, C. J., Mortlock, A., et al. 2014, Monthly Notices of the Royal Astronomical Society, 444, 2960, doi: 10.1093/mnras/stu1622
- Duncan et al. (2019) Duncan, K., Conselice, C. J., Mundy, C., et al. 2019, ApJ, 876, 110, doi: 10.3847/1538-4357/ab148a
- Feng et al. (2015) Feng, Y., Di-Matteo, T., Croft, R. A., et al. 2015, MNRAS, 455, 2778, doi: 10.1093/mnras/stv2484
- Ferrari et al. (2015) Ferrari, F., de Carvalho, R. R., & Trevisan, M. 2015, ApJ, 814, 55, doi: 10.1088/0004-637X/814/1/55
- Ferreira et al. (2020) Ferreira, L., Conselice, C. J., Duncan, K., et al. 2020, ApJ, 895, 115, doi: 10.3847/1538-4357/ab8f9b
- Ferreira & Ferrari (2018) Ferreira, L., & Ferrari, F. 2018, MNRAS, 473, 2701, doi: 10.1093/mnras/stx2266
- Ferreira et al. (2022) Ferreira, L., Adams, N., Conselice, C. J., et al. 2022, arXiv e-prints, arXiv:2207.09428. https://arxiv.org/abs/2207.09428
- Grogin et al. (2011) Grogin, N. A., Kocevski, D. D., Faber, S. M., et al. 2011, The Astrophysical Journal Supplement Series, 197, 35, doi: 10.1088/0067-0049/197/2/35
- Hopkins et al. (2009) Hopkins, P. F., Cox, T. J., Younger, J. D., & Hernquist, L. 2009, ApJ, 691, 1168, doi: 10.1088/0004-637X/691/2/1168
- Hubble (1926) Hubble, E. P. 1926, The Astrophysical Journal, 64, 321, doi: 10.1086/143018
- Hunter (2007) Hunter, J. D. 2007, Computing in Science & Engineering, 9, 90, doi: 10.1109/MCSE.2007.55
- Irodotou & Thomas (2021) Irodotou, D., & Thomas, P. A. 2021, MNRAS, 501, 2182, doi: 10.1093/mnras/staa3804
- Irodotou et al. (2019) Irodotou, D., Thomas, P. A., Henriques, B. M., Sargent, M. T., & Hislop, J. M. 2019, MNRAS, 489, 3609, doi: 10.1093/mnras/stz2365
- Jacobs et al. (2022) Jacobs, C., Glazebrook, K., Calabrò, A., et al. 2022, arXiv e-prints, arXiv:2208.06516. https://arxiv.org/abs/2208.06516
- Kartaltepe et al. (2015) Kartaltepe, J. S., Mozena, M., Kocevski, D., McIntosh, D. H., & Lotz, J. 2015, ApJS, 221, 11, doi: 10.1088/0067-0049/221/1/11
- Koekemoer et al. (2011) Koekemoer, A. M., Faber, S. M., Ferguson, H. C., et al. 2011, ApJS, 197, 36, doi: 10.1088/0067-0049/197/2/36
- Lagos et al. (2018) Lagos, C. d. P., Stevens, A. R. H., Bower, R. G., et al. 2018, MNRAS, 473, 4956, doi: 10.1093/mnras/stx2667
- L’Huillier et al. (2012) L’Huillier, B., Combes, F., & Semelin, B. 2012, A&A, 544, A68, doi: 10.1051/0004-6361/201117924
- Lintott et al. (2011) Lintott, C., Schawinski, K., Bamford, S., et al. 2011, MNRAS, 410, 166, doi: 10.1111/j.1365-2966.2010.17432.x
- Lotz et al. (2004) Lotz, J. M., Primack, J., & Madau, P. 2004, The Astronomical Journal, 128, 163, doi: 10.1086/421849
- Lotz et al. (2008) Lotz, J. M., Davis, M., Faber, S. M., et al. 2008, The Astrophysical Journal, 672, 177, doi: 10.1086/523659
- Lovell et al. (2021) Lovell, C. C., Vijayan, A. P., Thomas, P. A., et al. 2021, MNRAS, 500, 2127, doi: 10.1093/mnras/staa3360
- Marshall et al. (2020) Marshall, M. A., Ni, Y., Matteo, T. D., et al. 2020, MNRAS, 499, 3819, doi: 10.1093/mnras/staa2982
- Marshall et al. (2022a) Marshall, M. A., Watts, K., Wilkins, S., et al. 2022a, MNRAS, 516, 1047, doi: 10.1093/mnras/stac2111
- Marshall et al. (2022b) Marshall, M. A., Watts, K., Wilkins, S., et al. 2022b, BlueTides Mock Image Catalogue, STScI/MAST, doi: 10.17909/ER09-4527
- Mo et al. (2010) Mo, H., van den Bosch, F. C., & White, S. 2010, Galaxy Formation and Evolution
- Monachesi et al. (2019) Monachesi, A., Gómez, F. A., Grand, R. J. J., et al. 2019, MNRAS, 485, 2589, doi: 10.1093/mnras/stz538
- Mortlock et al. (2013) Mortlock, A., Conselice, C. J., Hartley, W. G., et al. 2013, Monthly Notices of the Royal Astronomical Society, 433, 1185, doi: 10.1093/mnras/stt793
- Nelson et al. (2019) Nelson, D., Springel, V., Pillepich, A., et al. 2019, Computational Astrophysics and Cosmology, 6, 2, doi: 10.1186/s40668-019-0028-x
- Nelson et al. (2022) Nelson, E. J., Suess, K. A., Bezanson, R., et al. 2022, arXiv e-prints, arXiv:2208.01630. https://arxiv.org/abs/2208.01630
- Oesch et al. (2010) Oesch, P. A., Bouwens, R. J., Carollo, C. M., et al. 2010, ApJ, 709, L21, doi: 10.1088/2041-8205/709/1/L21
- Park et al. (2022) Park, C., Lee, J., Kim, J., et al. 2022, The Astrophysical Journal, 937, 15, doi: 10.3847/1538-4357/ac85b5
- Perrin et al. (2015) Perrin, M. D., Long, J., Sivaramakrishnan, A., et al. 2015, WebbPSF: James Webb Space Telescope PSF Simulation Tool. http://ascl.net/1504.007
- Petrosian (1976) Petrosian, V. 1976, ApJ, 210, L53, doi: 10.1086/182301
- Pillepich et al. (2015) Pillepich, A., Madau, P., & Mayer, L. 2015, ApJ, 799, 184, doi: 10.1088/0004-637X/799/2/184
- Reback et al. (2022) Reback, J., jbrockmendel, McKinney, W., et al. 2022, pandas-dev/pandas: Pandas 1.4.2, v1.4.2, Zenodo, Zenodo, doi: 10.5281/zenodo.3509134
- Robertson et al. (2022) Robertson, B. E., Tacchella, S., Johnson, B. D., et al. 2022, arXiv e-prints, arXiv:2208.11456. https://arxiv.org/abs/2208.11456
- Rodriguez-Gomez et al. (2015) Rodriguez-Gomez, V., Genel, S., Vogelsberger, M., et al. 2015, Monthly Notices of the Royal Astronomical Society, 449, 49, doi: 10.1093/mnras/stv264
- Rodriguez-Gomez et al. (2022) Rodriguez-Gomez, V., Genel, S., Fall, S. M., et al. 2022, MNRAS, 512, 5978, doi: 10.1093/mnras/stac806
- Roper et al. (2022) Roper, W. J., Lovell, C. C., Vijayan, A. P., et al. 2022, MNRAS, 514, 1921, doi: 10.1093/mnras/stac1368
- Rose et al. (2022) Rose, C., Kartaltepe, J. S., Snyder, G. F., et al. 2022, arXiv e-prints, arXiv:2208.11164. https://arxiv.org/abs/2208.11164
- Rosse (1850) Rosse, T. E. O. 1850, Philosophical Transactions of the Royal Society of London Series I, 140, 499
- Schawinski et al. (2014) Schawinski, K., Urry, C. M., Simmons, B. D., et al. 2014, MNRAS, 440, 889, doi: 10.1093/mnras/stu327
- Schaye et al. (2015) Schaye, J., Crain, R. A., Bower, R. G., et al. 2015, MNRAS, 446, 521, doi: 10.1093/mnras/stu2058
- Sérsic (1963) Sérsic, J. L. 1963, Boletin de la Asociacion Argentina de Astronomia, 6. http://adsabs.harvard.edu/abs/1963BAAA....6...41S
- Sparre & Springel (2017) Sparre, M., & Springel, V. 2017, MNRAS, 470, 3946, doi: 10.1093/mnras/stx1516
- Stefanon et al. (2017) Stefanon, M., Yan, H., Mobasher, B., et al. 2017, ApJS, 229, 32, doi: 10.3847/1538-4365/aa66cb
- Thob et al. (2019) Thob, A. C. R., Crain, R. A., McCarthy, I. G., et al. 2019, MNRAS, 485, 972, doi: 10.1093/mnras/stz448
- Tissera et al. (2012) Tissera, P. B., White, S. D. M., & Scannapieco, C. 2012, MNRAS, 420, 255, doi: 10.1111/j.1365-2966.2011.20028.x
- Trayford et al. (2019) Trayford, J. W., Frenk, C. S., Theuns, T., Schaye, J., & Correa, C. 2019, MNRAS, 483, 744, doi: 10.1093/mnras/sty2860
- Whitney et al. (2021) Whitney, A., Ferreira, L., Conselice, C. J., & Duncan, K. 2021, ApJ, 919, 139, doi: 10.3847/1538-4357/ac1422
- Zana et al. (2022) Zana, T., Lupi, A., Bonetti, M., et al. 2022, MNRAS, 515, 1524, doi: 10.1093/mnras/stac1708