Deep diving off the ‘Cosmic Cliffs’: previously hidden outflows in NGC 3324 revealed by JWST
Abstract
We present a detailed analysis of the protostellar outflow activity in the massive star-forming region NGC 3324, as revealed by new Early Release Observations (ERO) from the James Webb Space Telescope (JWST). Emission from numerous outflows is revealed in narrow-band images of hydrogen Paschen- (Pa-) and molecular hydrogen. In particular, we report the discovery of previously unknown outflows based on their H2 emission. We find three candidate driving sources for these flows in published catalogs of young stellar objects (YSOs) and we identify IR point sources in the new JWST images as potential driving protostars. We also identify several Herbig-Haro (HH) objects in Pa- images from JWST; most are confirmed as jets based on their proper motions measured in a comparison with previous Hubble Space Telescope (HST) H images. This confirmed all previous HST-identified HH jets and candidate jets, and revealed new HH objects. The unprecedented capabilities of JWST allow the direct comparison of atomic and molecular outflow components at comparable angular resolution. Future observations will allow quantitative analysis of the excitation, mass-loss rates, and velocities of these new flows. As a relatively modest region of massive star formation (larger than Orion but smaller than starburst clusters), NGC 3324 offers a preview of what star formation studies with JWST may provide.
keywords:
stars: formation – stars: jets – stars: protostars – HII regions – Herbig–Haro objects1 Introduction
Jets and outflows are signposts of active star formation, although details about their launching, quantitative connection to accretion, and timescales are still poorly understood. Jets can extend to lengths exceeding a parsec, making them readily identifiable in large-scale images with sufficient angular resolution and one of the most spectacular signposts of active star formation. They are launched by an underlying process of disk accretion (e.g. Ferreira et al., 2006) and imprint a fossil record of its variations on the sky (e.g., Ellerbroek et al., 2014). This can indirectly indicate ongoing disk accretion in more distant ( kpc) high-mass star-forming regions. Low-mass stars in high-mass star-forming regions are prime targets to quantify the impact of external feedback and are of particular interest to understand the impact of feedback on planet formation (e.g., O’dell et al. 1993; O’dell & Wen 1994a; Bally et al. 1998a, b; Henney & Arthur 1998; Johnstone et al. 1998; Henney & O’Dell 1999; Bally et al. 2000a; Bally et al. 2006; Eisner & Carpenter 2006; Eisner et al. 2008; Mann & Williams 2010; Mann et al. 2014; Eisner et al. 2016; Eisner et al. 2018; see Winter & Haworth 2022; Reiter & Parker 2022 for recent reviews). To date, most observations of the millimeter dust emission from disks around low-mass stars at these distances target jet-driving sources (e.g., Mesa-Delgado et al., 2016; Cortes-Rangel et al., 2020; Reiter et al., 2020a).
As jets and outflows propagate from embedded young stellar objects (YSOs), they inject energy and momentum into the surrounding interstellar medium. The energy and momentum they inject is predicted to resupply turbulence in clouds (Nakamura & Li, 2007; Cunningham et al., 2011; Offner & Arce, 2014; Murray et al., 2018). Jets also appear to play an important role in regulating the final masses of stars. For example, the starforge simulations predict that outflows have a non-negligible impact on the initial mass function (IMF) even in models that include other feedback mechanisms such as winds, radiation, and supernovae (Guszejnov et al., 2021; Guszejnov et al., 2022).
In high-mass star-forming regions, feedback from the most massive cluster members – winds, radiation and supernovae – creates large ionized bubbles (e.g. Weaver et al., 1977; Spitzer, 1978; Dale, 2015). Once these other feedback mechanisms directly operate, jets/outflows make a much smaller contribution to the overall feedback budget. However, outflows act first, before the other feedback mechanisms initiate. At the periphery of feedback driven bubbles where molecular gas is still forming stars, outflows may dominate the local feedback. A full accounting of the different mechanisms and the timescales over which they dominate is important because feedback drives the evolution of the star-forming material (e.g. Deharveng et al., 2010; Walch et al., 2012; Dale et al., 2014; Ali, 2021; Bending et al., 2022), may affect local star formation (e.g. Thompson et al., 2012; Dale et al., 2015), and enhances the distances out to which eventual supernovae impact the interstellar medium (by carving low-density channels in the star-forming cloud, see e.g., Rogers & Pittard, 2013; Lucas et al., 2020; Rathjen et al., 2021).
Diffraction-limited data from the Hubble Space Telescope (HST) has played a central role in the study of jets. Narrowband images reveal shock-excited emission from hydrogen recombination and forbidden emission lines in Herbig-Haro (HH; Herbig, 1950, 1951; Haro, 1952, 1953) objects that trace shocks and jets especially once they have emerged from the neutral/molecular gas (e.g., Burrows et al., 1996; Bally et al., 2000a; Smith et al., 2010a; Reiter & Smith, 2013, 2014; Reiter et al., 2016; Reiter et al., 2017). These images revealed detailed jet morphologies making clear the connection between disks and jets (e.g., Burrows et al., 1996). In H ii regions, UV radiation from nearby high-mass stars illuminates the jet body, revealing un-shocked components and rendering the entire flow visible. Because of this, irradiated jets are a powerful tool for uncovering the mass-loss histories of the driving YSOs. Multi-epoch imaging traces measurable changes in the morphology and brightness distribution of shocks on human timescales and can be used to measure proper motions to determine (transverse) velocities (e.g., Hartigan et al., 2001, 2005; Hartigan & Morse, 2007; Hartigan et al., 2011, 2019). Diffraction-limited imaging is key to identify collimated jets and outflows in more distant high-mass star-forming regions as these features are difficult to distinguish in seeing-limited images from the ground (e.g., Smith et al., 2004, 2010a).
With the arrival of the James Webb Space Telescope (JWST), similar studies are now possible for embedded jets and outflows seen only in the infrared (IR) that remain invisible at visual wavelengths. Near-IR observations reveal embedded portions of large-scale jets before they break out into the H ii region. Longer wavelengths also unlock the possibility of understanding the impact of jets/outflows in regions that will soon be overwhelmed with external feedback from nearby high-mass stars.
JWST Early Release Observations (ERO; Pontoppidan et al., 2022) targeted the massive star-forming region NGC 3324, providing an unprecedented look inside the star-forming gas surrounding the feedback-driven bubble. Only two confirmed and two candidate jets were previously identified toward this field in narrowband H images obtained with HST (Smith et al., 2010a). Using the ERO images from JWST, we have uncovered at least outflows in NGC 3324, primarily through their prominent emission in the F470N filter tracing shock-excited H2. New F187N images of Paschen- (Pa-) emission trace many of the same features first seen in H images from HST. The 16 yrs between the HST and JWST images allow these complementary observations to be used to provide the first proper motions of outflow features in this region. Together, this provides a first estimate of the kinematics of outflows in this portion of NGC 3324 and a unique look at embedded jets/outflows.
2 Clarifying the relationship between NGC 3324 and Carina
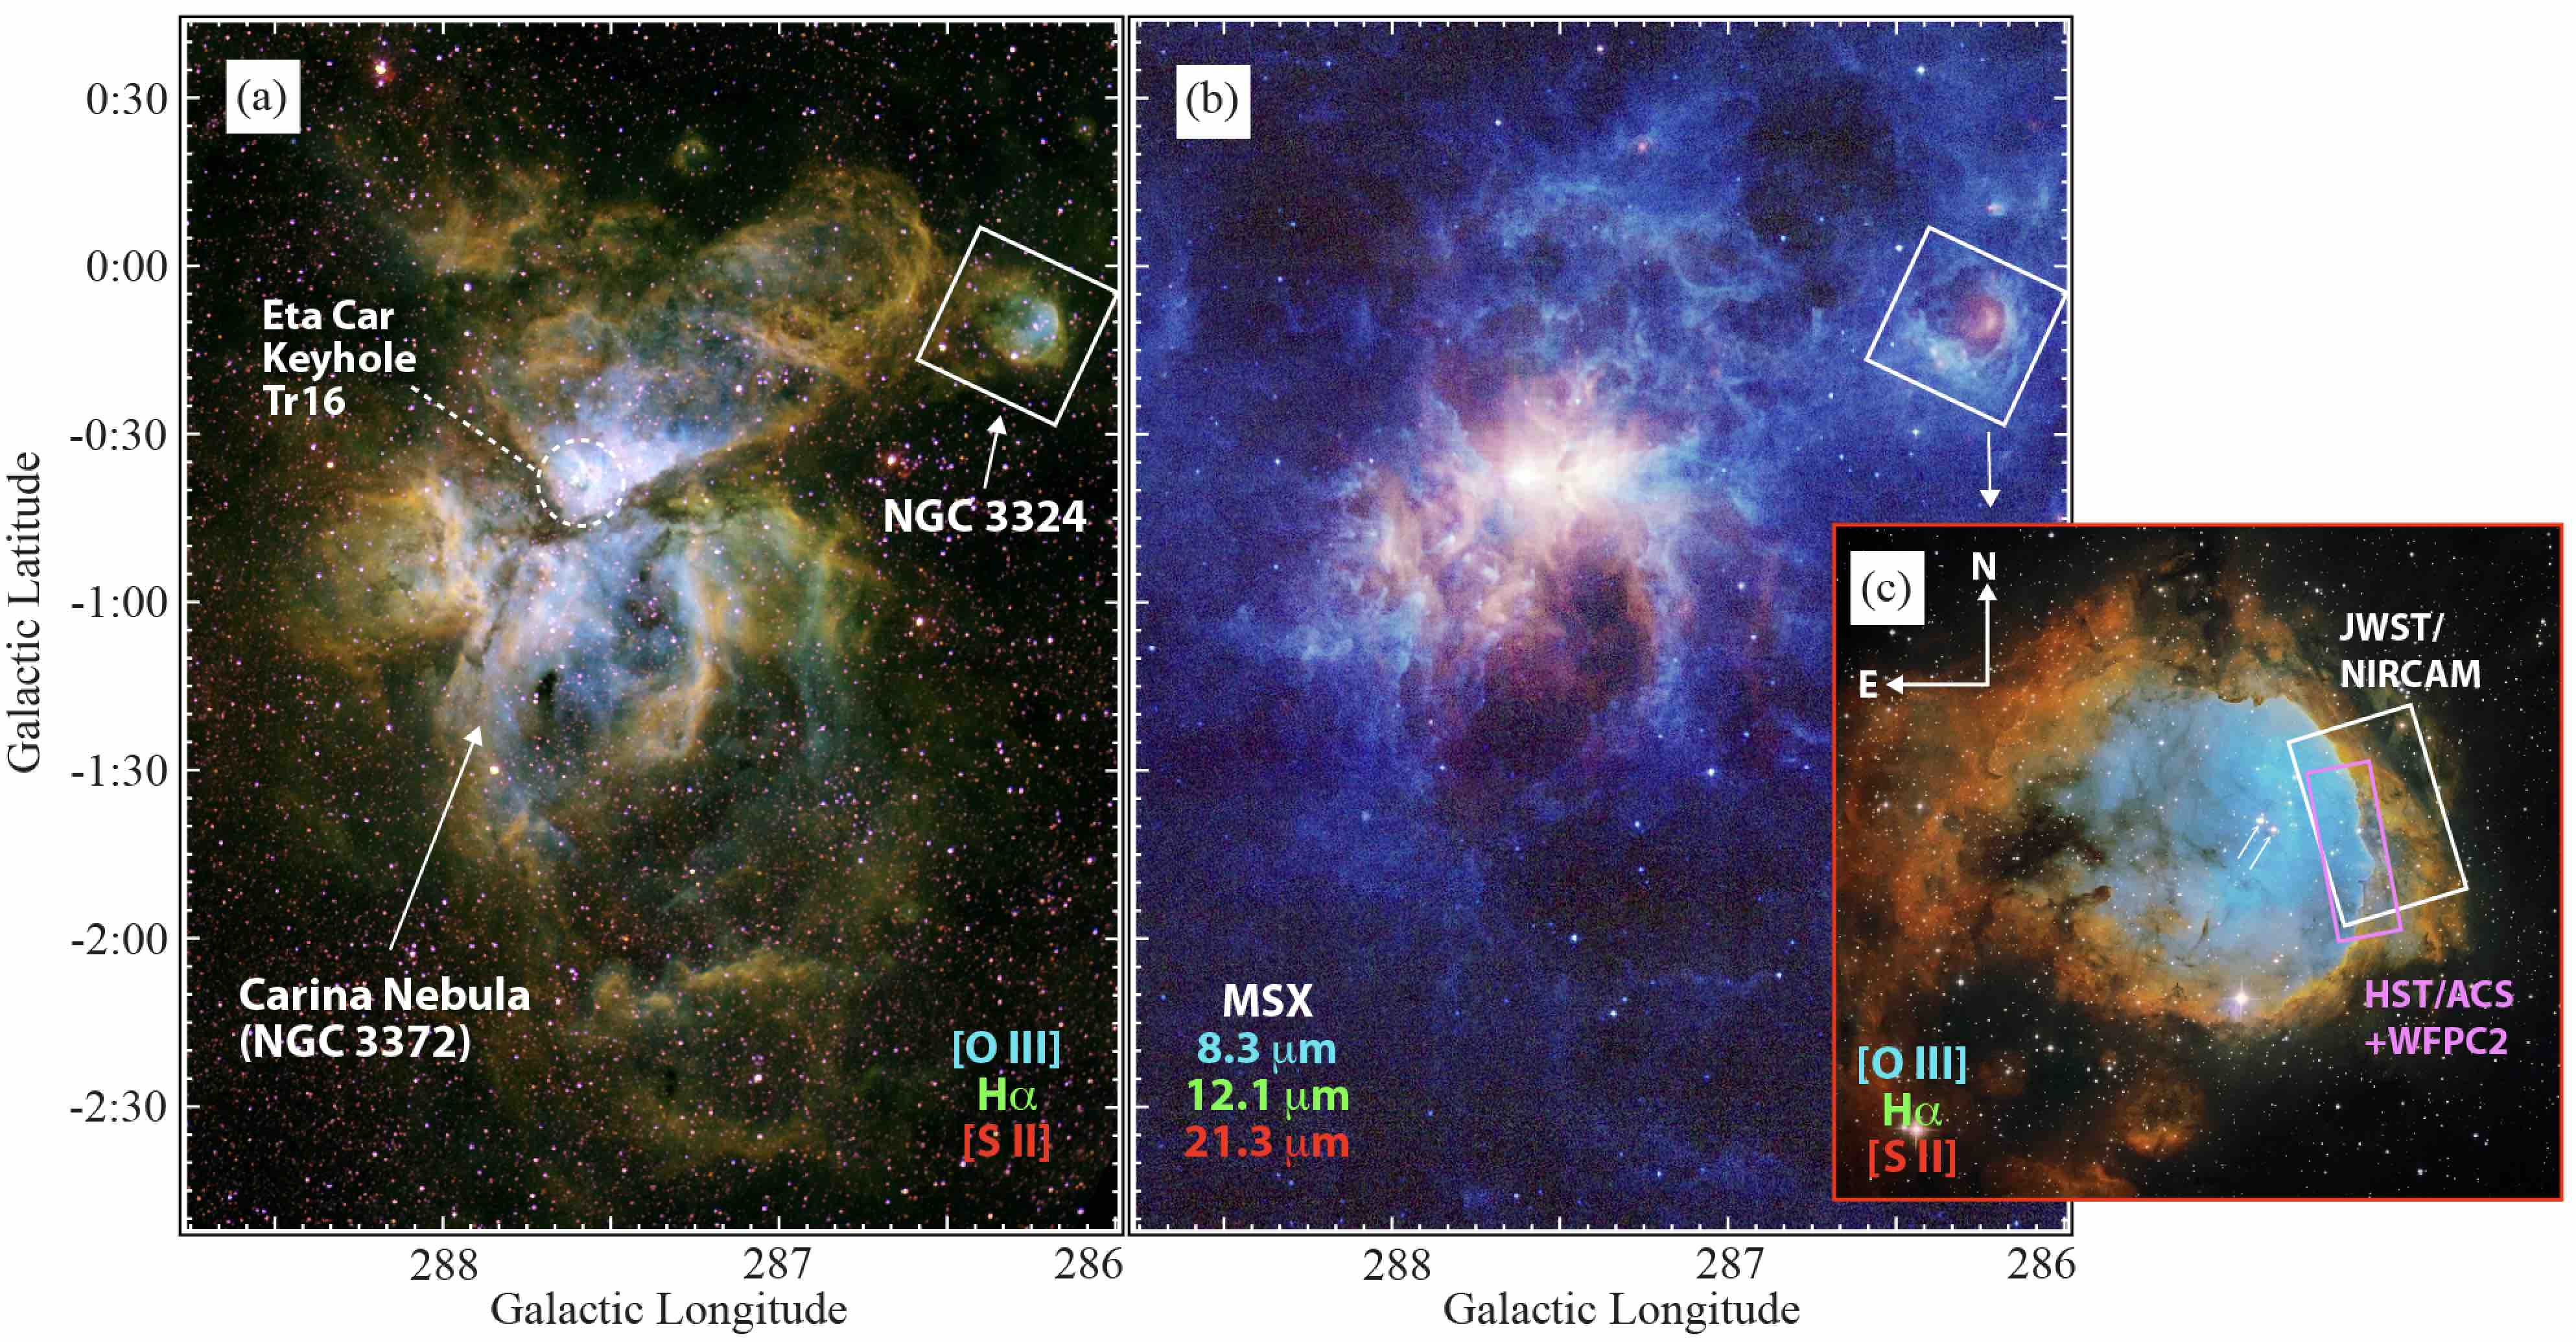
The NGC 3324 cluster and H ii region reside at the outskirts of the larger Carina star-forming complex (see Figure 3). The Carina Nebula has a well-established distance of about 2.3 kpc (Smith, 2006b; Shull et al., 2021), and although it is outside the main nebula, NGC 3324 is thought to reside at a similar distance (Göppl & Preibisch, 2022).
While the JWST Early Release Observations were titled as images of the Carina Nebula, Figure 3 illustrates that NGC 3324 is actually not part of the Carina Nebula complex, and is instead a detached, circular H ii region (Smith et al., 2000). This distinction is important chiefly because the collection of more than 70 O-type stars that have powered feedback in the Carina Nebula – including Carinae, 3 WNH stars (Wolf-Rayet stars of the nitrogen sequence with H in their spectra, see Smith & Conti, 2008), and several of the most luminous and earliest O-types known (Smith, 2006a) – are not the same stars that drive feedback in NGC 3324. In Figure 3b, red features (21 m emission) locate hot dust grains in the interior of H ii region cavities that are heated by nearby O-type stars (Smith & Brooks, 2007). The hot dust in the interior of NGC 3324 is completely separate from the hot dust in Carina, and there does not appear to be a connection between the two cavities.
The two sources that likely dominate ionization and feedback in NGC 3324 are HD 92206 and CPD57∘3580, both of which are mid/late O-type multiple systems. These two stars are indicated by white arrows in Figure 3c. SIMBAD111https://simbad.u-strasbg.fr/simbad/ lists HD 92206 as an O6.5V+O6.5V binary, and CPD57∘3580 as an O8V+O9.7V binary. Note that the Galactic O-Star Catalog lists HD 92206 as five O-type stars contained in HD 92206A, B, and C (Sota et al., 2014; Maíz Apellániz et al., 2016), with HD 92206A resolved from HD 92206B (and HD 92206B is itself an O6+O6 binary), while the catalog also lists CPD57∘3580 as HD 92206C (an O8+O8 binary). In any case, feedback in NGC 3324 appears to be dominated by five closely spaced mid/late O-type stars in the center of the nebula, and it is not directly impacted by the high-mass stars in Carina.
Overall, the combined ionizing photon luminosity of the stars that power NGC 3324 (2.8–3.5 1049 ionizing photons per second; adopting the ionizing photon rates per spectral type in Smith 2006a) is about three times larger than the Orion Nebula, or about 3% of the current ionizing photon luminosity of stars that power the Carina Nebula.
3 Observations
3.1 JWST ERO data
| Instrument | Filter | Date | Exp. Time† | Comment |
| NIRCam | F090W | 3 June 2022 | 3221.04 | |
| NIRCam | F187N | 3 June 2022 | 5797.86 | Paschen- |
| NIRCam | F200W | 3 June 2022 | 3221.04 | |
| NIRCam | F335M | 3 June 2022 | 3221.04 | |
| NIRCam | F444W | 3 June 2022 | 3221.04 | |
| NIRCam | F470N | 3 June 2022 | 5797.86 | |
| MIRI | F1130W | 11 June 2022 | 6771.08 | |
| MIRI | F1280W | 11 June 2022 | 6993.12 | |
| MIRI | F1800W | 11 June 2022 | 5994.08 | |
| † "effective exposure time" of the level 3 data products in seconds | ||||
In this paper, we use the ERO images obtained with JWST as part of PID 2731 (PI: Pontoppidan). A summary of the observations, including the filters used and exposure times, is presented in Table 1. For this study, we use the level 3 science products downloaded from the MAST archive (see Figure 2). These data were produced with calibration software version 1.5.3 from the calibration context jwst_0916.pmap. A more complete description of JWST performance from commissioning may be found in Rigby et al. (2022).
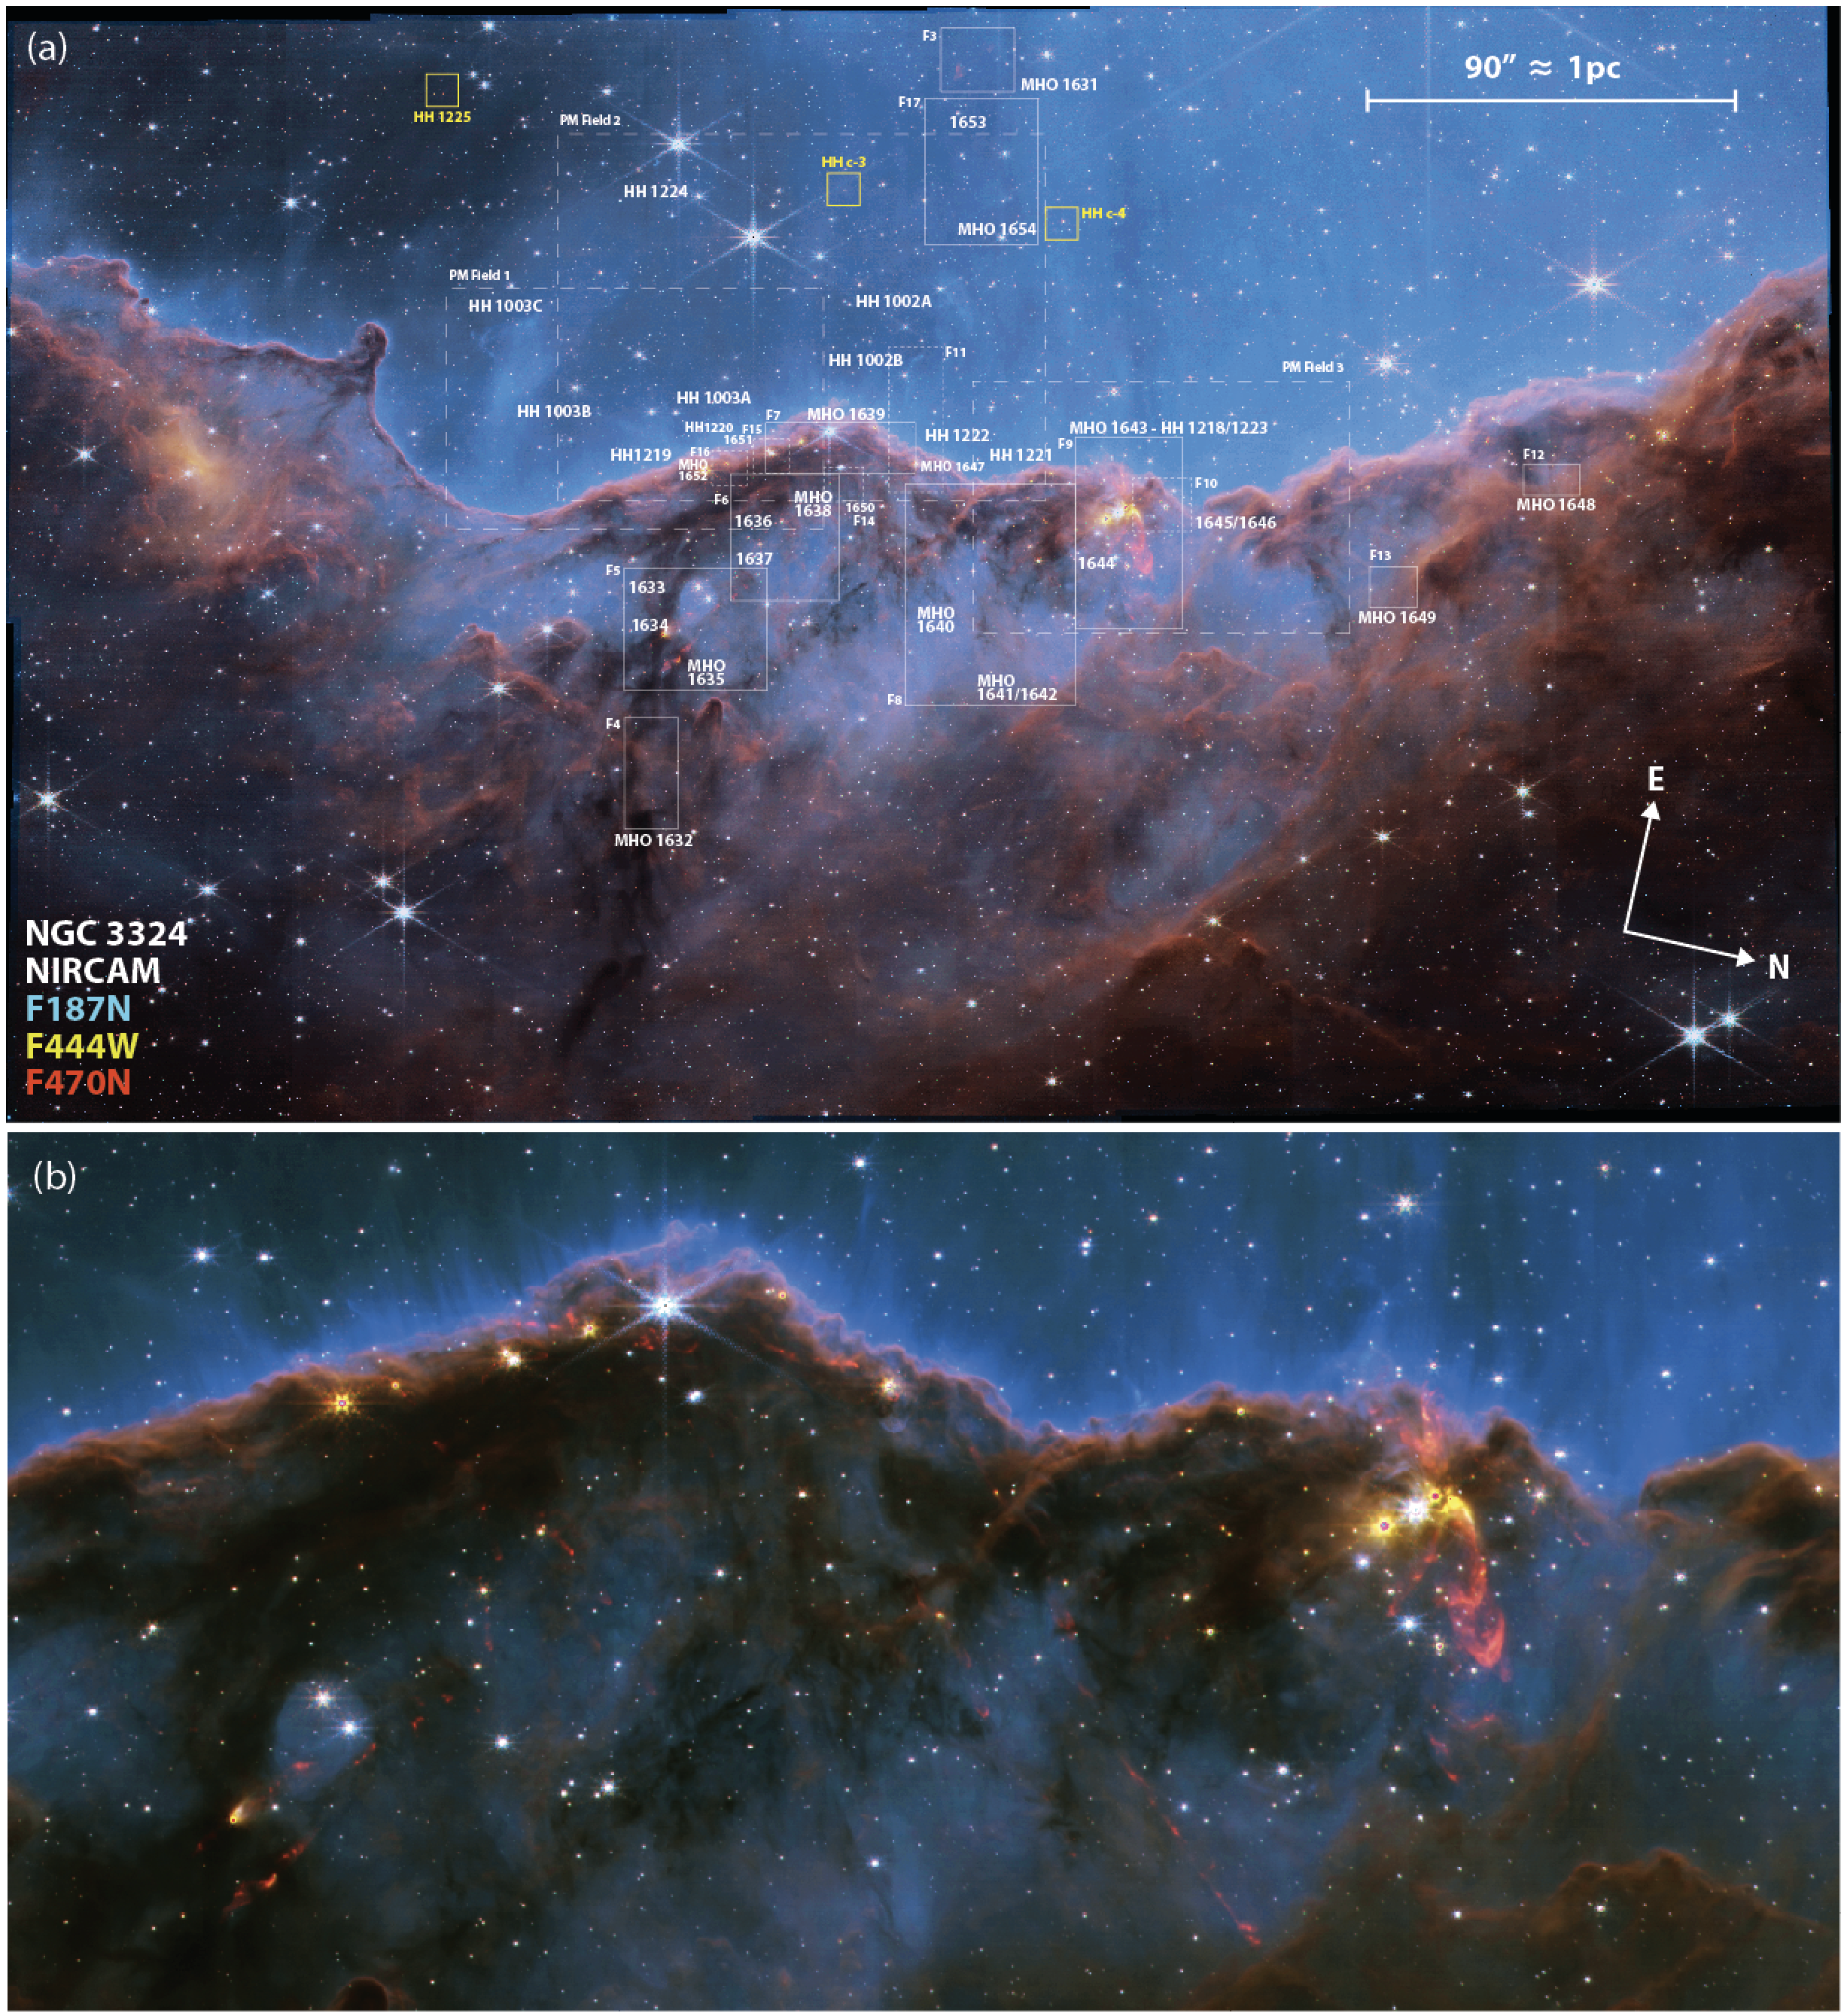
Broad, medium, and narrowband images were obtained with the Near-Infrared Camera (NIRCam; Rieke et al., 2005; Beichman et al., 2012) on 3 June 3 2022. The NIRCam mosaic covers a field on the edge of the NGC 3324 H ii region. The location of this NIRCam field is identified by the white box in Figure 3c, and a color composite of the full field of the NIRCam images (blue=F187N, green=F444W, red=F470N) is shown in Figure 2a. The 6.5 m diameter of JWST provides an angular resolution of over the range of NIRCam wavelengths considered in this study.
Three broadband images of a subset of the area imaged by NIRCam were obtained with the Mid-Infrared Instrument (MIRI; Rieke et al., 2015; Wright et al., 2015) on 11 June 2022. The MIRI field is similar but smaller than the NIRCam mosaics, covering an area that lies entirely within the NIRCam mosaic. The angular resolution of the MIRI images ranges from . We use these images for visual inspection of possible driving sources.
3.2 Archival HST data
The new images from JWST cover and extend the area imaged in HST PID 10475 during 7 and 21 March 2006 with the Advanced Camera for Surveys (ACS) in the F658N filter tracing H + [N II]. Full details of the ACS observations are presented in Smith et al. (2010a). We use these archival H images together with the new Pa- images (F187N, see Table 1) from JWST to measure proper motions of H-emitting knots and shock waves in the outflows (see Sec. 4.2). The overlap between regions imaged with HST and JWST is shown in the right-most panel of Figure 3.
4 Results
We report the discovery of H2 flows in NGC 3324 based primarily on their emission in the F470N filter, and we identify or confirm several HH objects based on Pa- emission in the F187N filter, or based on their motion when compared to previous H images obtained with HST.
Almost all of the H2 flows are seen in the neutral/molecular clouds surrounding the H ii region cavity of NGC 3324; only three features are seen in the H ii region. New flows are cataloged as molecular hydrogen objects (MHOs)444http://astro.kent.ac.uk/df/MHCat/. We describe each new flow in Section 4.1.
Several shock features are also seen in the H ii region, traced by Pa- emission. Many of these features were previously identified in H images from Smith et al. (2010a). For features that are detected in both H and Pa- images, we use aligned frames to measure their proper motions (see Section 4.2). Measuring proper motions also led to the detection of a few new features that, in retrospect, are also visible in the H images from HST.
We use the Spitzer/IRAC Candidate YSO Catalog for the Inner Galactic Midplane (SPICY; Kuhn et al., 2021) to identify candidate driving sources. We also identify point sources on or near the flow axis in the new JWST images and label them by their coordinates. A detailed analysis of their nature (including whether the spectral energy distributions; SEDs) are consistent with young sources will be presented in a future work. Candidate driving sources are listed in Tables 2 and 3. The IR-bright stars that most likely drive the outflows are readily identified in 17/ cases. Two MHOs have ambiguous driving sources; four other features trace shock-like structures but do not have a clear origin or driving source.
4.1 New H2 flows
Newly flows presented in this section were discovered via their H2 emission.
Emission line features are especially prominent when the continuum or broadband emission from surrounding nebulosity is subtracted out (see, e.g., Reiter
et al., 2016).
We use the wideband F444W filter to subtract continuum emission from the narrowband F470N filter.
New MHOs are listed in Table 2 and their locations are identified and labeled in the overview of the NIRCam image in Figure 2a.
In the following, we briefly describe each of the new flows.
MHO 1631:
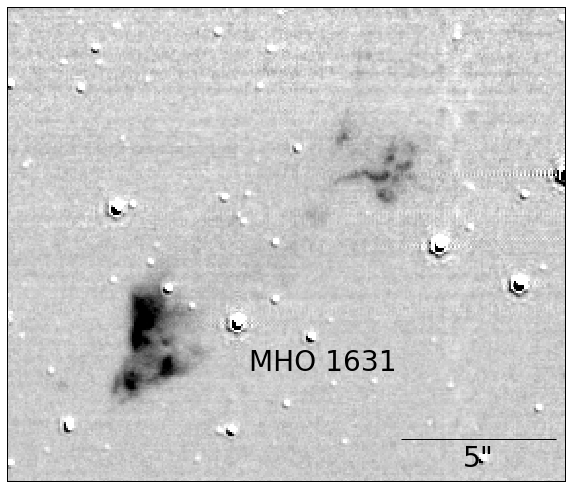
An -bright feature seen to be projected far out in the H ii region cavity is MHO 1631 (see Figure 3).
It may trace a bow shock and its wake as it travels to the west (lower left in Figure 3).
Alternately, it may be a flow
propagating to the east (to the upper right in Figure 3),
although there are no near-IR excess sources seen near MHO 1631 to confirm this orientation.
The feature is seen close to the image edge, so additional knots may be outside the field of view.
MHO 1631 is likely behind NGC 3324 as it does not have an ionized skin seen in Pa-, as we would expect if it were in the H ii region.
Neither MHO 1631 nor its host cloud are seen in extinction, as would be expected if it were a foreground object.
MHO 1632:
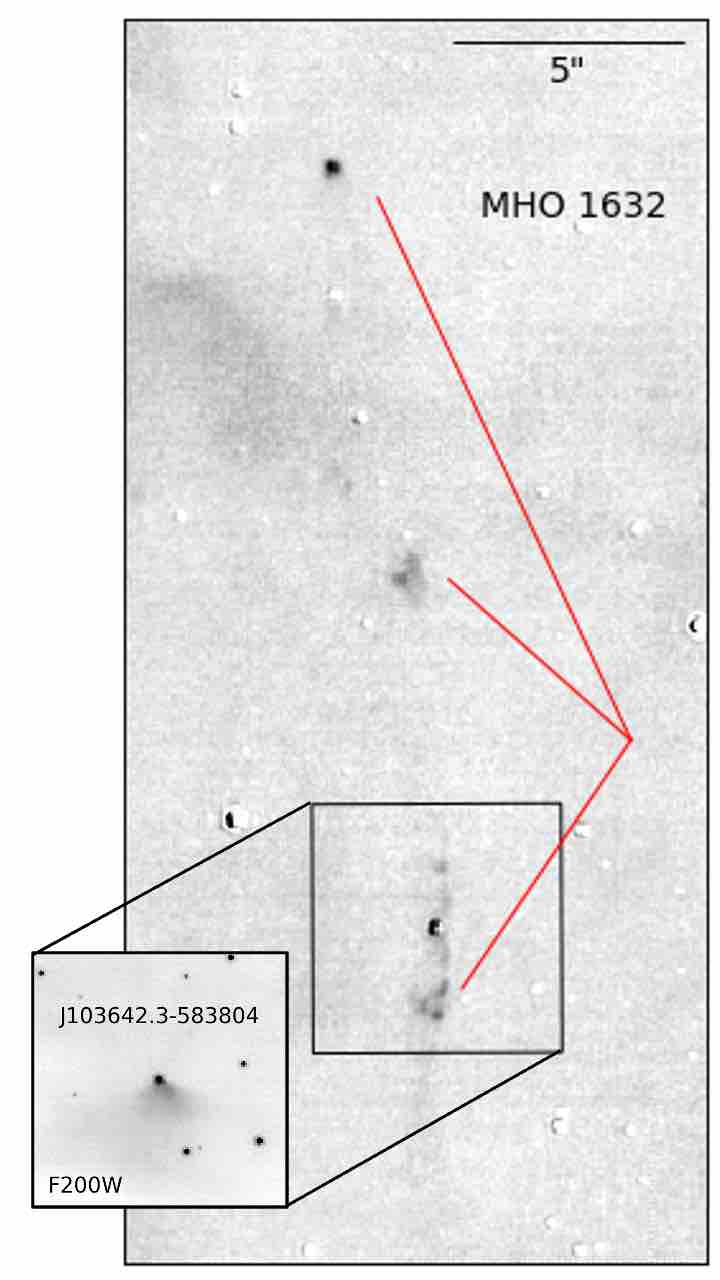
A few faint shock-like features trace the slightly arced MHO 1632 (see Figure 4).
MHO 1632 represents the opposite extreme to MHO 1631 – it is found at the deepest position in the cloud compared to the other MHOs (see Figure 2).
The flow is bipolar with emission on either side of the star on the outflow axis, J103642.3-583804.
Diffuse, fan-like emission that opens from the driving source is seen in the F200W filter.
This may trace reflected light in the outflow cavity if the western limb of the outflow (pointing down in Figure 4) is blueshifted.
MHO 1633:
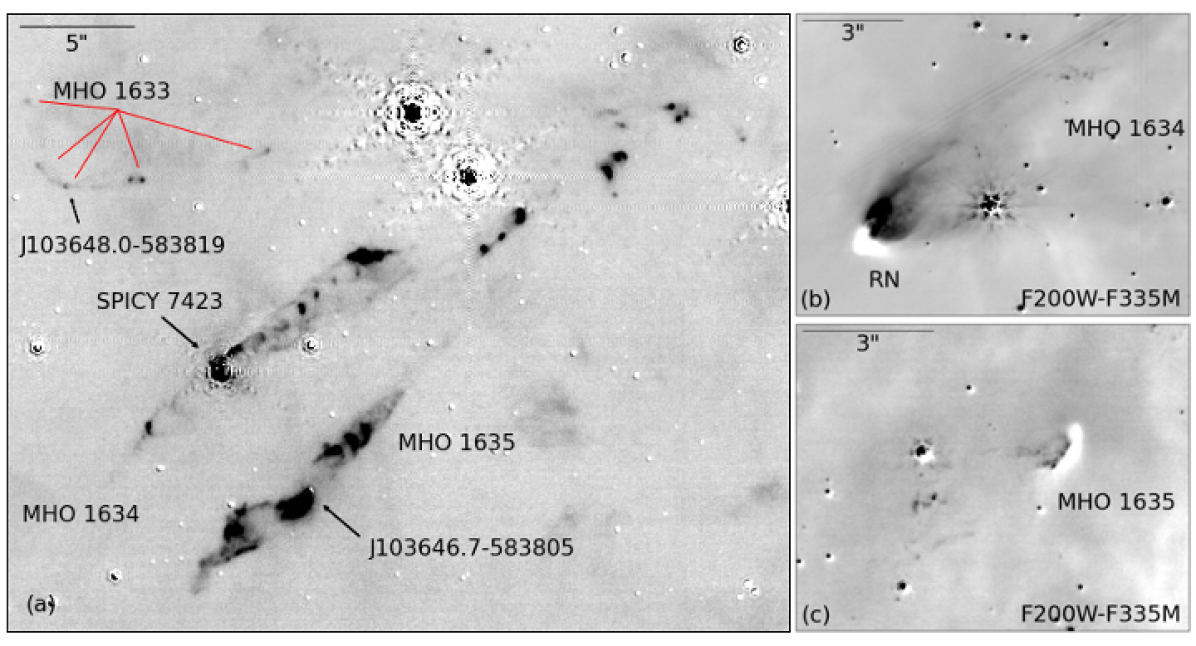
A chain of -bright knots trace the J-shape of MHO 1633 (see Figure 5).
A YSO, J103648.0-583819 in the hook of the J-shape likely drives the flow.
A bright knot of Pa- emission at the location of the driving source may trace the base of the flow in the northern limb (right-hand side in Figure 5).
The bend of the outflow is more dramatic than the other bent flows in this sample, more closely resembling examples seen in Orion (e.g., LL Ori and HH 336, see Bally &
Reipurth, 2001; Bally et al., 2006).
Unlike the Orion jets, MHO 1633 is not directly exposed to strong winds and radiation in the H ii region.
MHO 1634:
A bright reflection nebula associated with the YSO SPICY 7423 and nearby collimated emission are immediately obvious in color images from JWST.
Continuum-subtracted H2 images reveal a clear bipolar flow, MHO 1634, that bisects the reflection nebula (see Figure 5).
The spacing of the inner knots appears quasi-periodic, similar to HD 163296 (Ellerbroek
et al., 2014).
More diffuse emission surrounds these knots on either side, perhaps tracing the cavity walls of the outflow.
Fainter arcs of and a single bright knot trace the counterflow.
An additional stream of fainter emission extends the counterjet to 6.5″ (0.07 pc at a distance of 2.3 kpc) to the southwest of the driving source.
MHO 1635: Immediately below MHO 1634 in Figure 5 lies another bright bipolar outflow, MHO 1635. A red, arcuate feature emerging from a dark cloud is clearly seen in color images. In the continuum-subtracted H2 image, this arc appears to trace the base of a bipolar flow as it emerges from a deeply embedded YSO. A possible driving source, J103646.7-583805, is apparent in the MIRI data. Emission to the southwest (toward the bottom left of the image in Figure 5) is broad, as though tracing an outflow cavity. The red arc seen in color images traces one edge of this cavity. Continuous emission from J103646.7-583805 suggests that this southwest portion is the blueshifted side of the bipolar outflow. Additional emission extends to the southwest beyond this feature, extending 6.5″ (0.07 pc) from the driving source.
The MHO 1635 counterflow to the northeast (upper right in Figure 5) is also broad at first, but appears to get more collimated with distance from the driving source. The first knot of emission is offset 1″ from the candidate driving source, suggesting that this is the redshifted limb propagating into the cloud. A series of bright shock features delineate the flow axis before the inner flow terminates in fainter emission that tapers to a point. More collimation at large distances from the driving source is unusual, but has been observed in other sources (e.g., HH 900, Smith et al., 2010a; Reiter et al., 2015).
The tapered tip of the inner flow points toward another chain of knots located 6.5″ further to the northeast (upper right in Figure 5).
These knots lie between the MHO 1634 and MHO 1635 axes, making unclear from which flow they originate.
This ambiguity may reflect the crossing of the MHO 1634 and MHO 1635 outflow axes.
MHO 1636:
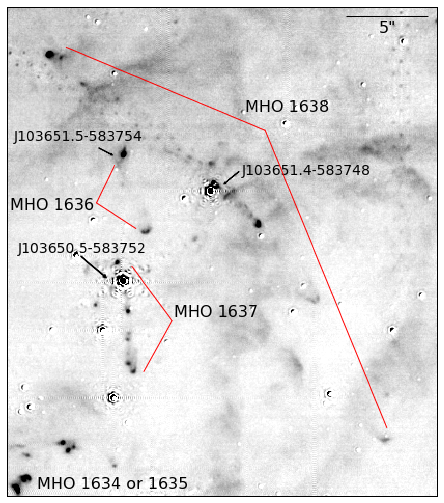
Another group of at least three separate outflows lies to the northeast of MHO 1634 and MHO 1635.
The first, MHO 1636, consists of two bright H2 knots (see Figure 6).
One knot is coincident with the location of a point source, J103651.5-583754.
The second has more of a bow-shock shape with faint wings that point back toward the YSO.
No counterflow is apparent.
While only two knots define MHO 1636, these knots lie away from the axes of the other outflows in the region.
MHO 1637:
In Figure 6, MHO 1637 is seen emerging from a bright star, J103650.5-583752, located almost directly below MHO 1636.
Several H2 knots trace a collimated outflow axis that extends to the west (down in Figure 6).
Most of these knots have a tail of emission that points back in the direction of the driving source.
A single knot on the opposite side of the YSO may trace the counterflow.
However, this feature is located close to the star where artifacts from subtraction of the complex JWST PSF may contaminate the emission.
MHO 1638:
Several knots on either side of a point source, J103651.4-583748, trace the curved bipolar flow MHO 1638.
Two point sources are seen near the flow axis in the NIRCam images;
the fainter source lies on the axis.
H2 emission is bright and slightly extended at the location of the candidate driving source.
More distant knots trace the bipolar flow as it extends to the northwest (to the upper left in Figure 6), pointing toward a bow shock 9″ from the driving source.
Complementary knots trace the southeastern lobe to a shock 12″ from the driving source.
Overall, MHO 1638 has a gentle C-shaped bend indicating deflection toward the west.
MHO 1639:
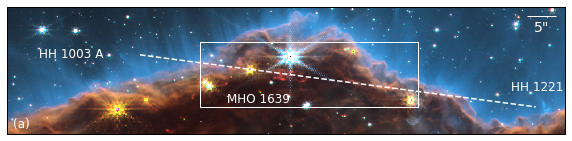
MHO 1639 emerges from a bright point source that lies 5.5″ inside the cloud edge. Knots in the southern outflow limb (the left side of the flow in Figure 7) trace a collimated outflow that extends close to the ionized edge of the cloud. The northern limb appears wider-angle and more diffuse, as though tracing shocks along the walls of an outflow cavity. Additional knots further to the north (to the right side of Figure 7) lie along the same axis, tracing a straight line through the driving source to the southern most knot of the counterflow. Bow shocks at the terminus of MHO 1639 are also visible in H and Pa- images (the axis connecting these features is shown as a dashed white line in Figure 7a). The proper motion of these features suggest that these knots all belong to a single, coherent flow and are discussed in Section 4.2.
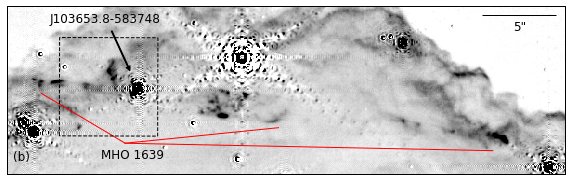
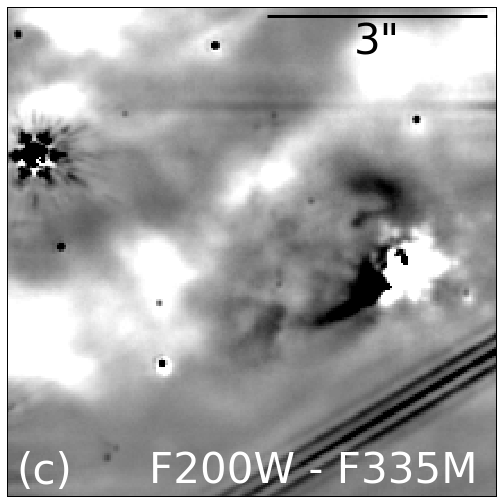
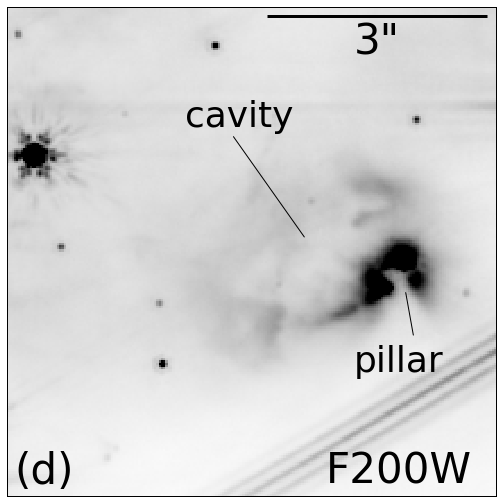
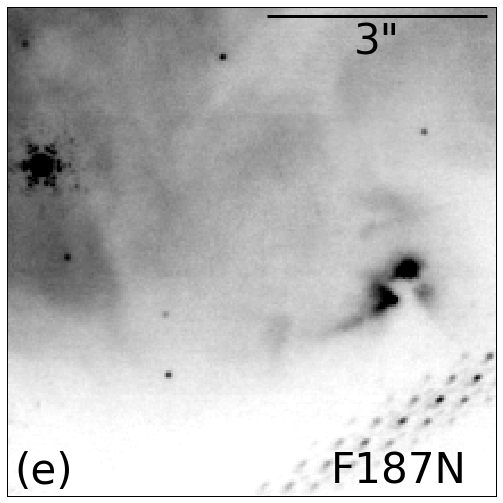
The immediate environment of the probable MHO 1639 driving source, J103653.8-583748, is intriguing.
In continuum and Pa- images, a pillar-like dark cloud obscures the YSO which creates a halo of emission behind it (see Figure 7 c,d,e).
Diffuse emission extends from the bright nebulosity with a morphology that suggests it traces the edges of a bubble or cavity near the YSO.
A bright feature seen near J103653.8-583748 that extends perpendicular to the jet may trace the outer wall of such a cavity.
Overall, the feature bears a strong resemblance to the NGC 1999 reflection nebula as it appears in unpublished HST images (Noll, 1999).
In both objects, a pillar-like dark cloud is seen amid bright nebulosity.
However, the dark region in NGC 1999 is a cavity in the cloud (Stanke
et al., 2010), possibly excavated by the multiple jets that emerge from the nearby V380 Ori system (including the large-scale HH 222 jet, see Reipurth
et al., 2013).
In contrast, it appears that a pillar of material obscures the MHO 1639 driving source, J103653.8-583748.
The possible cavity in this case is offset to the south of the pillar (left in Figure 7) and may have been carved by MHO 1639.
High-resolution sub-millimeter observations are required to test this hypothesis.
MHO 1640:
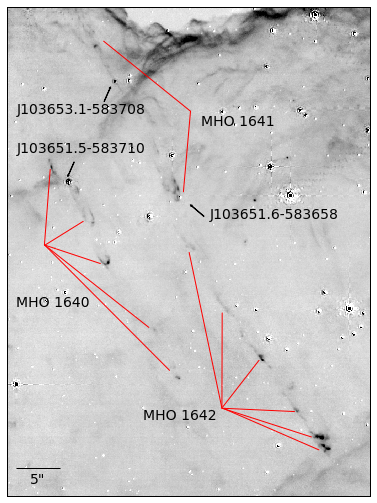
Two classic bow shocks define the northwest limb of MHO 1640 (pointing to the lower right in Figure 8).
Two additional shocks beyond these well-defined bow shocks show that this outflow limb extends at least , or pc.
In contrast, the counterflow to the southeast (upper left in Figure 8) is significantly shorter.
Only a single arc of H2 emission extends from the probable driving source, J103651.5-583710, with a length of 3.5″ (0.04 pc), or about 15% of the length of the northwest limb.
A faint arc of Pa- emission extends from J103651.5-583710 to the northwest of the driving source, possibly tracing the walls of the outflow cavity.
MHO 1641:
Immediately to the north of and nearly parallel to MHO 1640 is another longer flow, MHO 1641 (seen to the right of MHO 1640 in Figure 8).
Several knots trace a collimated outflow extending nearly parallel to MHO 1640.
Two point sources are seen on the outflow axis,
J103653.1-583708 and
J103651.6-583658.
Tenuous emission extends in either direction from J103653.1-583708, perhaps tracing the origin of the collimated flow while
J103651.6-583658 sits amid wider-angle emission with a similar morphology to the reflection nebula seen around MHO 1634.
However, emission from these arcs are not seen at other wavelengths, suggesting that they may instead be bow shocks associated with the outflow.
MHO 1642:
Several additional knots extend to the northwest of MHO 1641 (extending to the lower right in Figure 8).
These knots trace a remarkably straight line of emission that imply a collimated outflow axis that is slightly offset from MHO 1641.
Tenuous emission may trace one side of an outflow cavity, while a few brighter knots may trace shocks within the jet itself.
Future proper motion measurements will help clarify the relationship between MHO 1642 and other and H-emitting knots in the region (see Section 4.2).
MHO 1643:
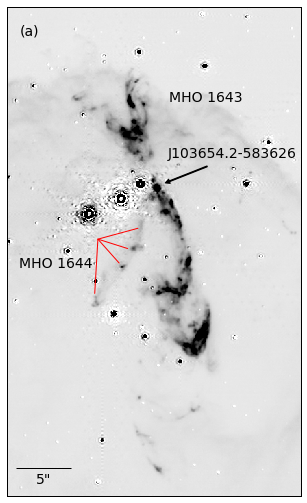
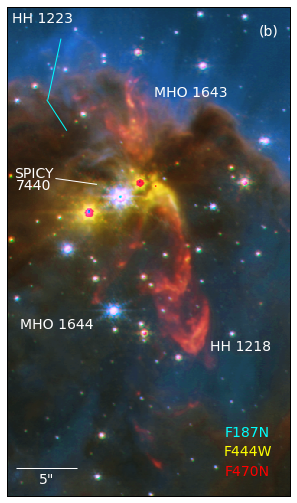
The most dramatic H2 flow seen in the JWST images is MHO 1643. Twin bow shocks stand out in color images, and trace back to a small cluster of stars that lies close to the cloud edge. Continuum-subtracted H2 images (see Figure 9) reveal shocks and diffuse emission tracing one wall of the outflow cavity from the probable driving source, J103654.2-583626, to the first bow shock. Beyond the first bow shock, diffuse emission hints at the outflow cavity created by the bow shock further northwest (down in Figure 9). Fainter shock-like structures beyond the two prominent bow shocks hint that there have been multiple outbursts from this source. On the opposite side of the driving source, MHO 1643 opens in a V-shape giving the flow an hour-glass like shape around the YSO. The outflow cavity points toward the cloud edge with molecular emission ending at the ionization front.
MHO 1643 is offset to the north of three bright stars.
A fourth fainter star can be identified at the apparent origin of the flow in the JWST images, J103654.2-583626.
Together, this collection of stars appears to blow a bubble to the southeast of the MHO 1643 flow (see Figure 9b).
Bright emission in both narrowband (F187N) and broadband (F200W) images traces arcs of emission reminiscent of billowing smoke.
Smith
et al. (2010a) identified a few shock-like features in H from this region as candidate jet HH c-1 (now HH 1223; see Figure 9 and Section 4.2.3).
The motion of features detected in both Pa- and H indicate that the feature is in fact part of an outflow, but that it is separate from MHO 1643 (see Section 4.2).
Interior to these arcs, there is little emission suggesting that the nascent cluster is creating a cavity.
The bright YSO at the base of this feature is SPICY 7440, a flat spectrum YSO that is 3.5″ to the southwest (left in Figure 9) of the origin of MHO 1643.
MHO 1644:
A second, monopolar flow emerges from the same cluster of stars as MHO 1643 (see Figure 9).
MHO 1644 consists of a chain of three bright knots that are connected by an arc of diffuse H2 emission. This outflow seems to originate at almost the same place as MHO 1643, then bends to the southwest (lower left in Figure 9).
It is unclear which source drives MHO 1644 and how close it is to the MHO 1643 driving source.
In the future, proper motion measurements will clarify the relationship between the outflows and YSOs in this region.
MHO 1645:
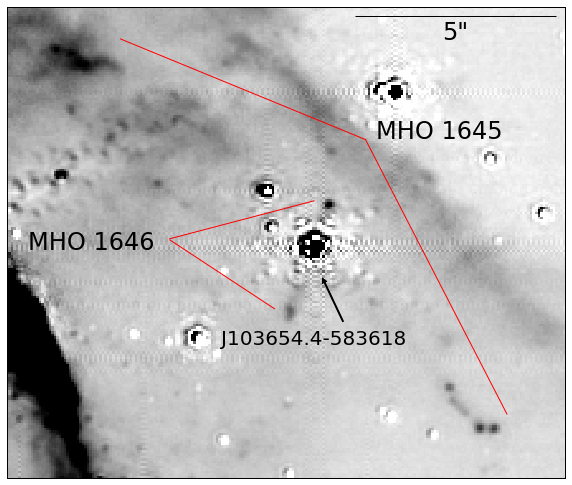
MHO 1645 is a bipolar outflow that emerges from a prominent star, J103654.4-583618, that lies just inside the ionization front (see Figure 10).
Some diffuse emission to the southeast (upper left in Figure 10) of the driving source seen in the F090W images
may trace reflected light at the wide-angle base of the flow.
MHO 1646:
Two additional knots are seen on either side of J103654.4-583618 and may trace a second outflow, MHO 1646, that is oriented nearly perpendicular to MHO 1645.
The eastern knot (pointing to the lower left in Figure 10) extends outside the PSF subtraction residuals, with faint emission extending back toward the point source.
Similar to MHO 1637, a bright knot on the opposite side of the star may trace the counterflow, although this is less certain as the knot may be confused with subtraction residuals.
MHO 1647:
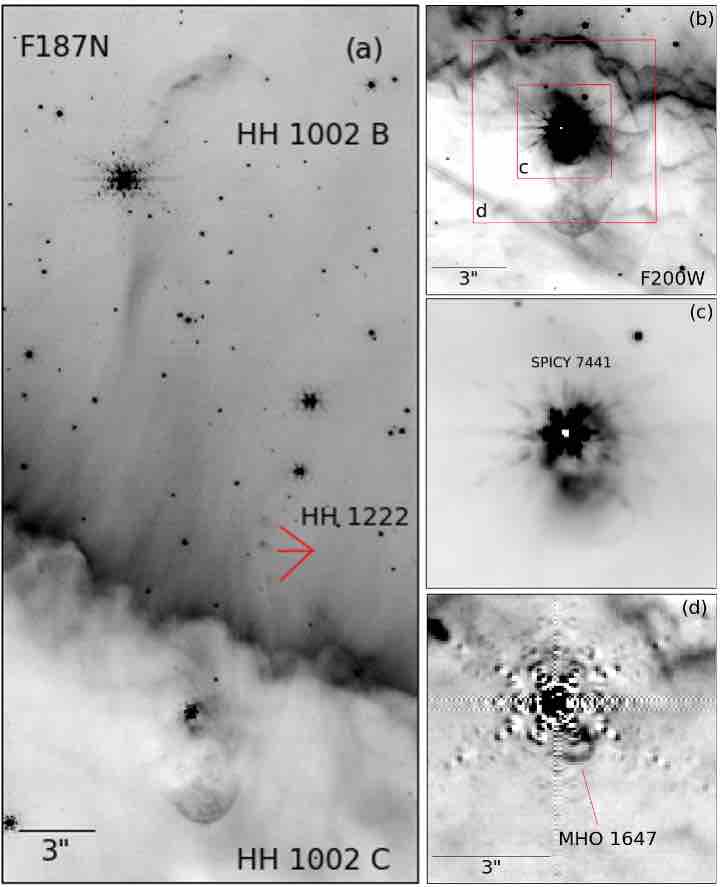
Continuum-subtracted H2 images reveal a single bow shock emerging to the northwest of the SPICY 7441 YSO (pointing to the lower right in Figure 11). Any additional structure interior to this shock is confused with strong subtraction residuals around the bright YSO. More structure can be identified in the F200W image where emission likely traces a combination of 2.12 µm and Br 2.16 µm emission. Some faint Pa- emission is also seen from this feature.
A second bow shock located 3″ further from the YSO lies along the same axis.
The feature traces a larger arc with prominent emission in the Pa- and F200W images.
The same morphology was seen in H images and identified as HH 1002 C by Smith
et al. (2010a).
We use the H and Pa- images to measure the proper motion of HH 1002 C; see discussion in Section 4.2.
MHO 1648:
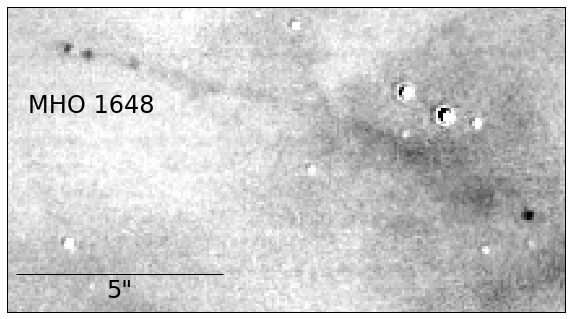
MHO 1648 (see Figure 12) is a tenuous arc of emission.
Four knots interspersed in the flow likely trace shocks.
There is no candidate YSOs near the outflow axis, so it is unclear what source might drive the flow.
MHO 1649:
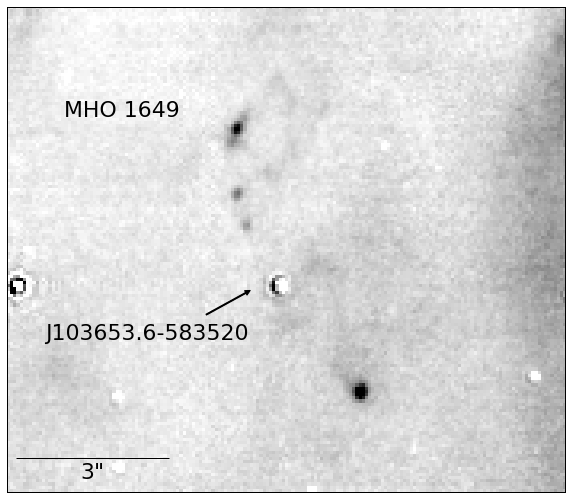
A series of four shocks with diffuse emission between them trace MHO 1649 (see Figure 13).
Three knots curve to the southeast (toward the top of Figure 13) of the probable driving source, J103653.6-583520.
Only a single knot has been identified in the counterflow.
The outflow axis appears to bends slightly toward the northeast (upper right in Figure 13).
MHO 1650:
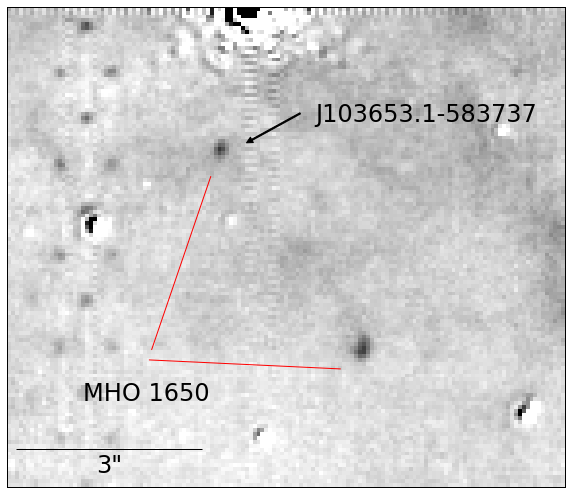
Two knots make up MHO 1650 (see Figure 14).
One of the two knots, seen in the lower right of Figure 14, has a rounded shape, reminiscent of a small bow shock.
Tenuous emission extending from the shock hints at emission from the walls of an outflow cavity.
The other bright spot of H2 emission is coincident with a point source, J103653.1-583737, that likely drives the monopolar flow.
MHO 1651:
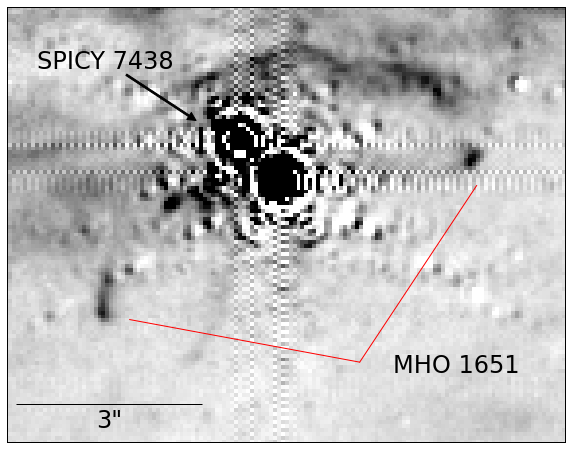
Two knots on either side of the YSO SPICY 7438 trace MHO 1651 (see Figure 15).
The system lies just inside and nearly parallel to the edge of the irradiated cloud.
Tenuous emission from the two shocks extends back toward the YSO, tracing a curved flow that bends away from the ionized cloud edge.
MHO 1652:
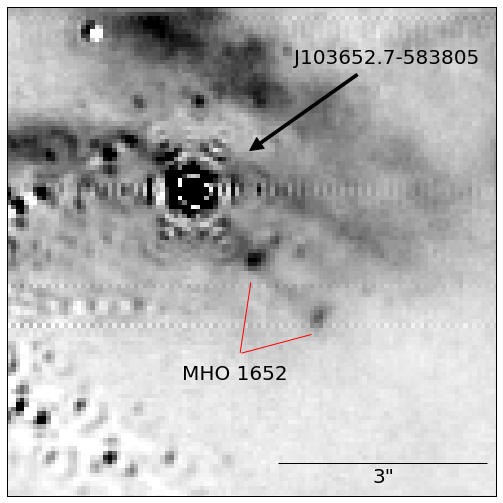
MHO 1652 consists of two knots propagating from a point source, J103652.7-583805 (see Figure 16).
The driving source lies just inside a ridge of the ionization front, so the counterflow may propagate outside the cloud where it is rapidly dissociated and ionized in the H ii region.
No counterflow is evident in continuum-subtracted images or in Pa- emission outside the cloud at this location.
MHO 1653 and MHO 1654:
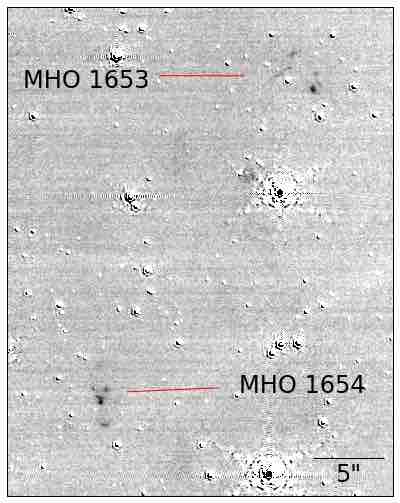
Two collections of small knots are MHO 1653 and MHO 1654 (see Figure 17). These knots lie just below MHO 1631 and also likely reside behind the NGC 3324 H ii region. No candidate YSOs are detected near either knot and no jet body demonstrates that the two features are physically related. Both features trace a shock-like morphology. However, the apex and wings of the purported shocks suggest that these features may not have a common origin. The rounded leading edge of MHO 1654 (closest to the bottom in Figure 17) suggests that it is a bow shock followed by a chain of knots. The axis implied by these features does not intersect MHO 1653. The knots and arcs of MHO 1653 provide fewer hints at their possible direction of motion, so their origin is unclear.
| Name | R.A. | Dec. | P.A. | YSO | Stage | Comment |
|---|---|---|---|---|---|---|
| MHO 1631 | 10:37:05.8 | 58:37:30 | 52∘ | … | … | in the H ii region |
| MHO 1632 | 10:36:42.7 | 58:38:05 | 108∘ | J103642.3-583804 | … | |
| MHO 1633 | 10:36:48.2 | 58:38:17 | 179∘ | J103648.0-583819 | … | |
| MHO 1634 | 10:36:47.2 | 58:38:10 | 51∘ | J103647.3-583810 | Class I | SPICY 7423 |
| MHO 1635 | 10:36:46.7 | 58:38:05 | 57∘ | J103646.7-583805 | … | |
| MHO 1636 | 10:36:51.0 | 58:37:52 | 119∘ | J103651.5-583754 | … | |
| MHO 1637 | 10:36:50.0 | 58:37:51 | 111∘ | J103650.5-583752 | … | |
| MHO 1638 | 10:36:51.4 | 58:37:50 | 154∘ | J103651.4-583748 | … | |
| MHO 1639 | 10:36:53.9 | 58:37:39 | 6∘ | J103653.8-583748 | … | HH 1003 A and HH 1221 trace associated bow shocks |
| MHO 1640 | 10:36:51.5 | 58:37:10 | 132∘ | J103651.5-583710 | … | |
| MHO 1641 | 10:36:53.3 | 58:37:10 | 131∘ | … | … | two possible driving sources: J103653.1-583708 and J103651.6-583658 |
| MHO 1642 | 10:36:49.6 | 58:36:44 | 135∘ | … | … | associated with HH 1224? |
| MHO 1643 | 10:36:54.2 | 58:36:27 | 109∘ | J103654.2-583626 | … | associated with HH 1218 |
| MHO 1644 | 10:36:53.3 | 58:36:28 | 73∘ | … | … | looks monopolar |
| MHO 1645 | 10:36:54.1 | 58:36:14 | 151∘ | J103654.4-583618 | … | |
| MHO 1646 | 10:36:54.2 | 58:36:19 | 83∘ | J103654.4-583618 | … | |
| MHO 1647 | 10:36:53.9 | 58:37:19 | … | J103654.0-583720 | Class I | SPICY 7441; bow shock near YSO; part of HH 1002 C |
| MHO 1648 | 10:36:58.0 | 58:34:48 | 173∘ | … | … | no obvious driving source |
| MHO 1649 | 10:36:53.6 | 58:35:20 | 128∘ | J103653.6-583520 | … | |
| MHO 1650 | 10:36:52.9 | 58:37:36 | 139∘ | J103653.1-583737 | … | |
| MHO 1651 | 10:36:53.3 | 58:37:54 | 35∘ | J103653.3-583754 | uncertain | SPICY 7438 |
| MHO 1652 | 10:36:52.7 | 58:38:05 | 148∘ | J103652.7-583805 | … | |
| MHO 1653 | 10:37:04.8 | 58:37:15 | … | … | … | in the H ii region |
| MHO 1654 | 10:37:01.5 | 58:37:24 | … | … | … | in the H ii region, near MHO 1653 |
4.2 Kinematics of atomic jets
All of the irradiated HH jets and candidate jets identified in the 2006 H images from HST by Smith et al. (2010a) are also visible in the new 2022 Pa- images from JWST. We can therefore measure their proper motions to determine the speed and direction of the outflowing material, distinguish separate outflows, constrain shock velocities and feedback energies, and identify potential driving sources. These kinematic measurements also confirm that, except for the wispy filaments along the sides of HH 1002 B and HH 1003 B, each of the previously identified jet candidates are parts of outflows, and not merely static filamentary structures in the H ii region.
Using the IRAF555IRAF was distributed by the National Optical Astronomy Observatory (now NOIRLab), operated by the Association of Universities for Research in Astronomy, Inc., under cooperative agreement with the National Science Foundation. tasks GEOMAP and GREGISTER, 338 stars in common served as tie points to align the HST/ACS F658N H+[N II] mosaic image to the JWST/NIRCam short wavelength channel F187N Pa- image with a final calculated image scale of pixel-1. Quadratic fits in X and Y were used to map the ACS data to the NIRCam image scale and orientation, with rms residuals of 0.7 pixels (or 22 mas). About 5% of the stars were rejected during the fitting process due to high proper motions during the 16-yr time baseline.666A similar exercise aligning two ACS F475W images obtained about a decade apart of the young supernova remnant 1E 0102.2-7219 in the Small Magellanic Cloud yielded rms residuals of 0.08 ACS pixels or 4 mas using 328 stars and three background galaxies as tie points. With the stellar tie points being mostly at the distance of the SMC, the excellent image alignment is essentially limited by variability in the instrument optical distortions and the HST pointing jitter. Thus we believe the larger residuals in aligning the 2006 ACS F658N image mosaic to the 2022 NIRCam F187N mosaic derive from intrinsically larger scatter in the stellar tie point positions due to measurable proper motions at the distance of NGC 3324, and possibly to slight errors in stitching the NIRCam image mosaic together. (See Reiter et al., 2015, for a related discussion of multi-epoch image alignment in the Carina Nebula region.)
At a distance to NGC 3324 of 2.3 kpc and a time baseline of s, one pixel of motion corresponds to 20.8 km s-1. Typical transverse motions for outflow features range from to 7 pixels or 25 – 150 km s-1, consistent with protostellar jet velocities observed elsewhere in the Carina Nebula region (cf. Figure 28 in Reiter et al., 2017). All proper-motion measurements were estimated ‘by eye’ by comparing the H and Pa- images on the computer display. However, many of the well-delineated features were measured with the proper motion code used previously in Morse et al. (2001), Hartigan et al. (2005), and Kiminki et al. (2016), based on an algorithm described in Currie et al. (1996). The estimated measurement uncertainty for individual features is on the order of pixel or 20 km s-1.
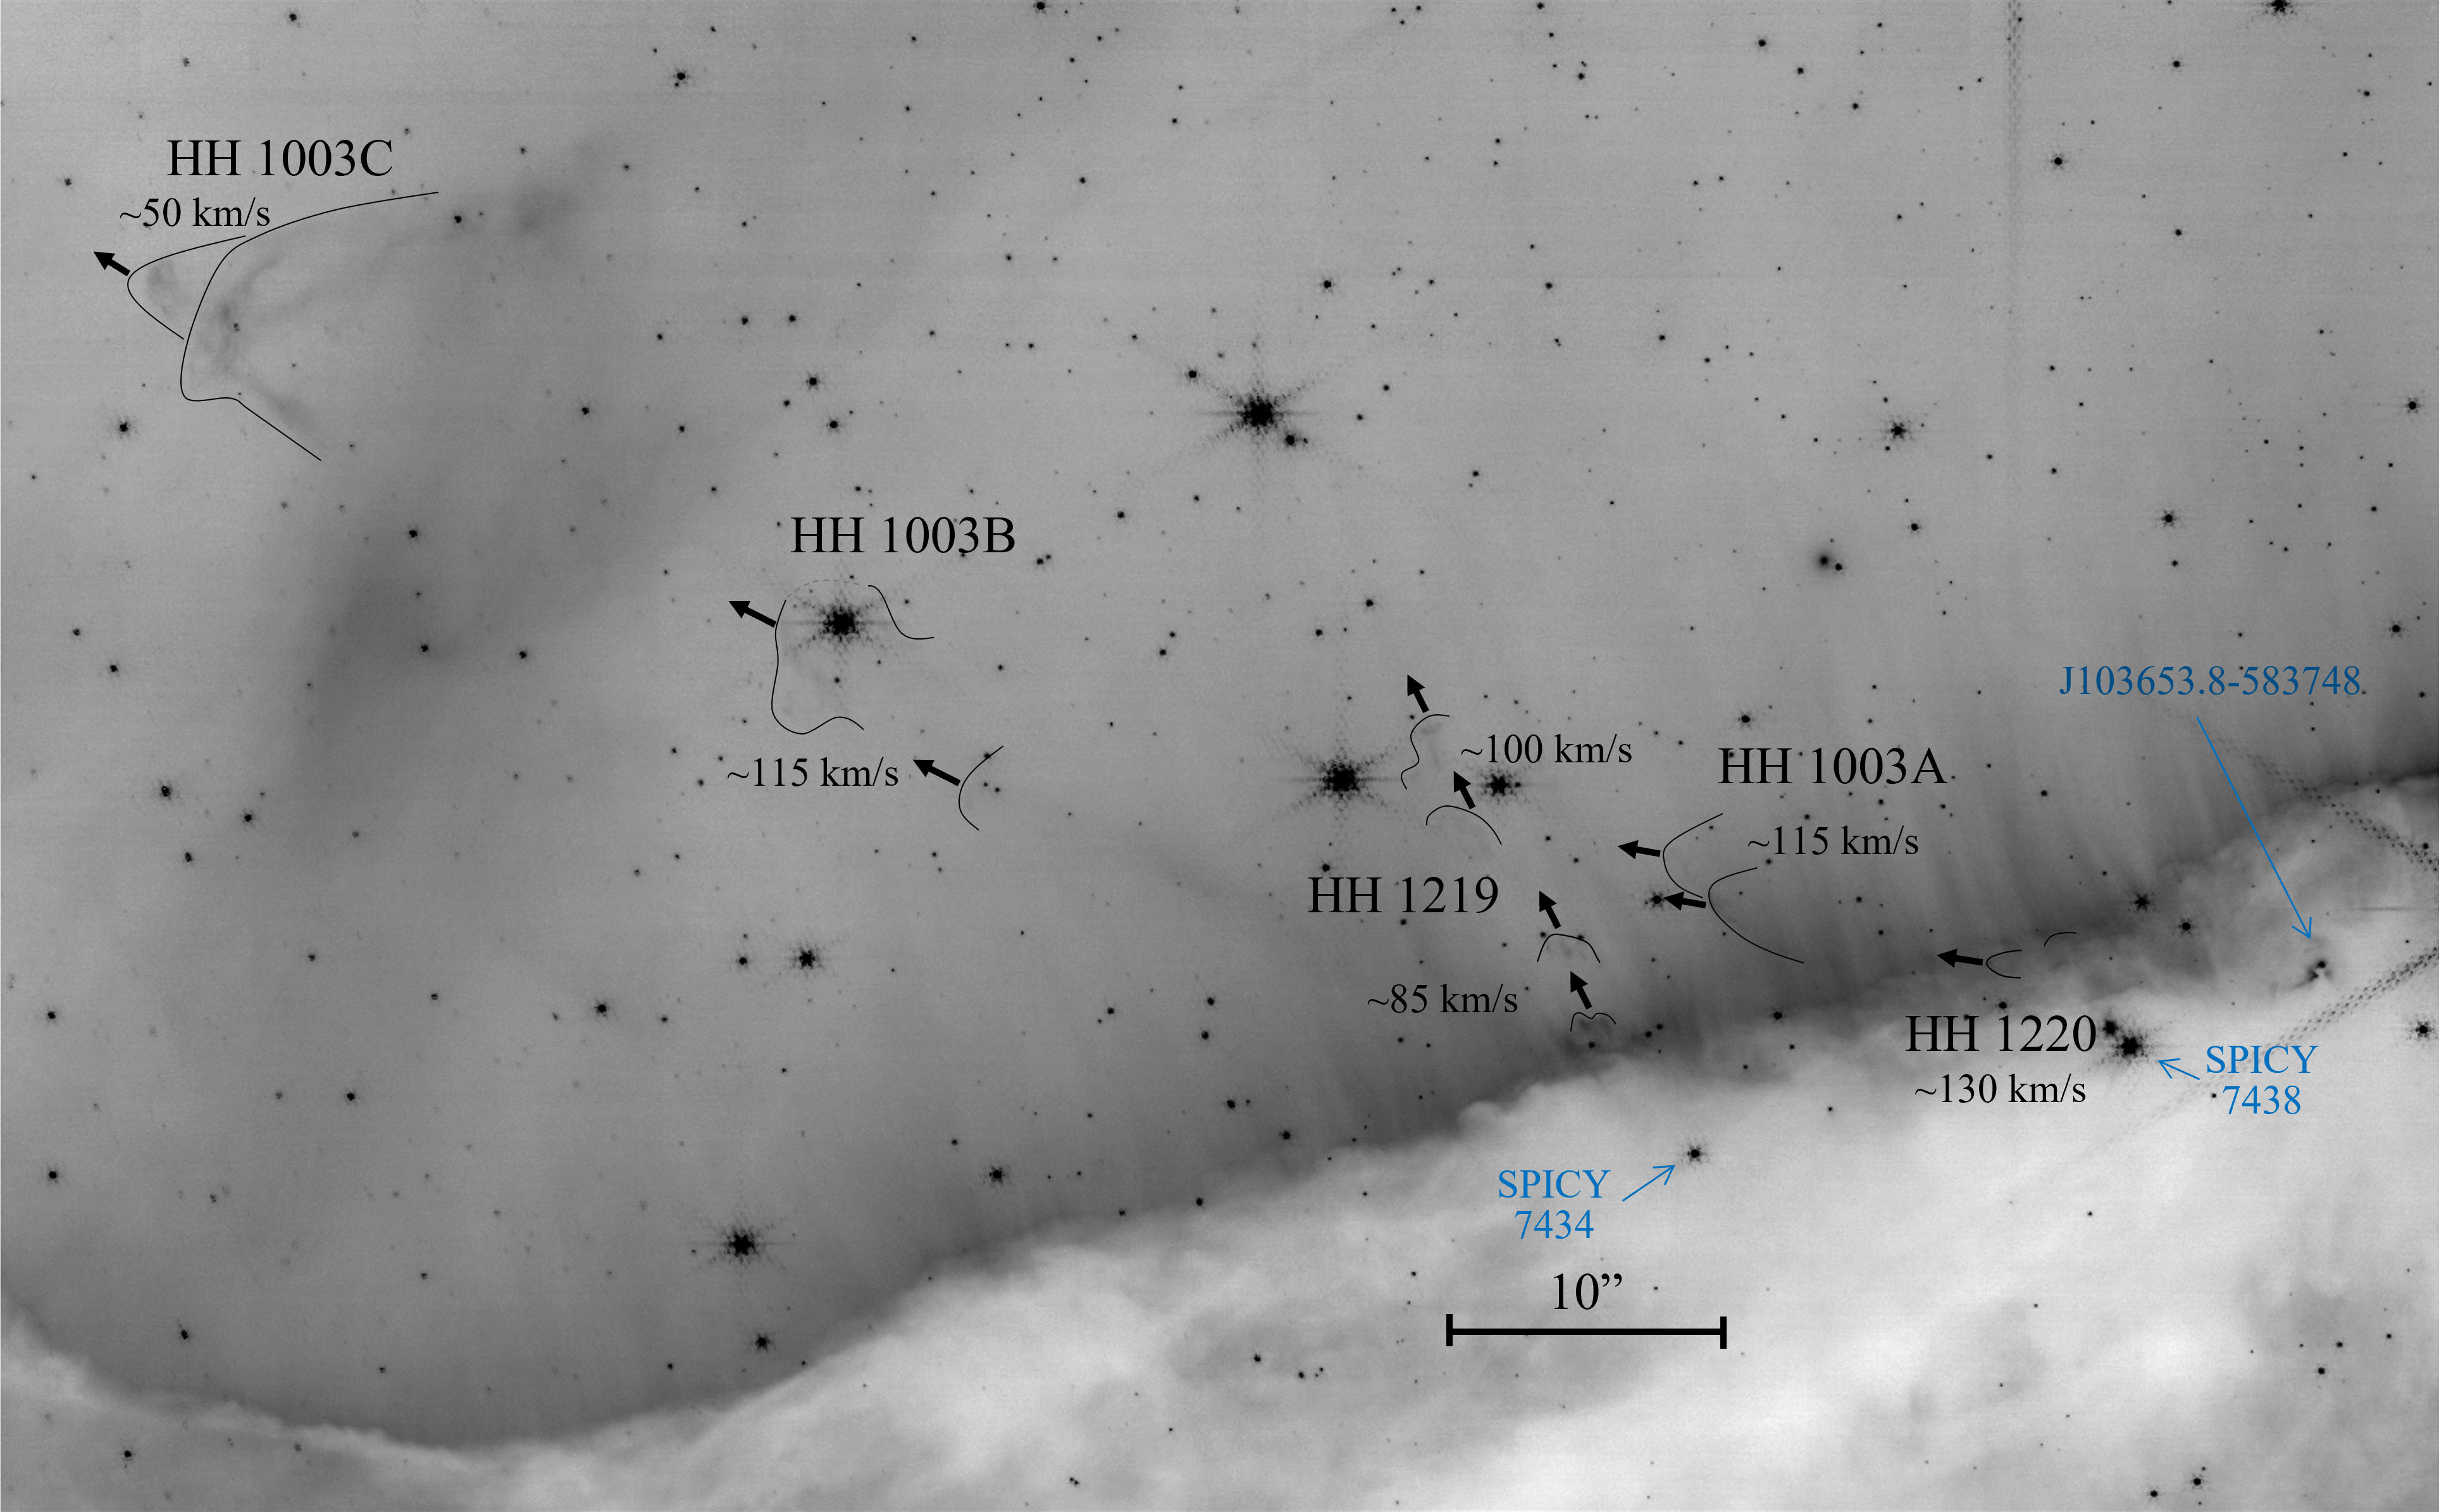
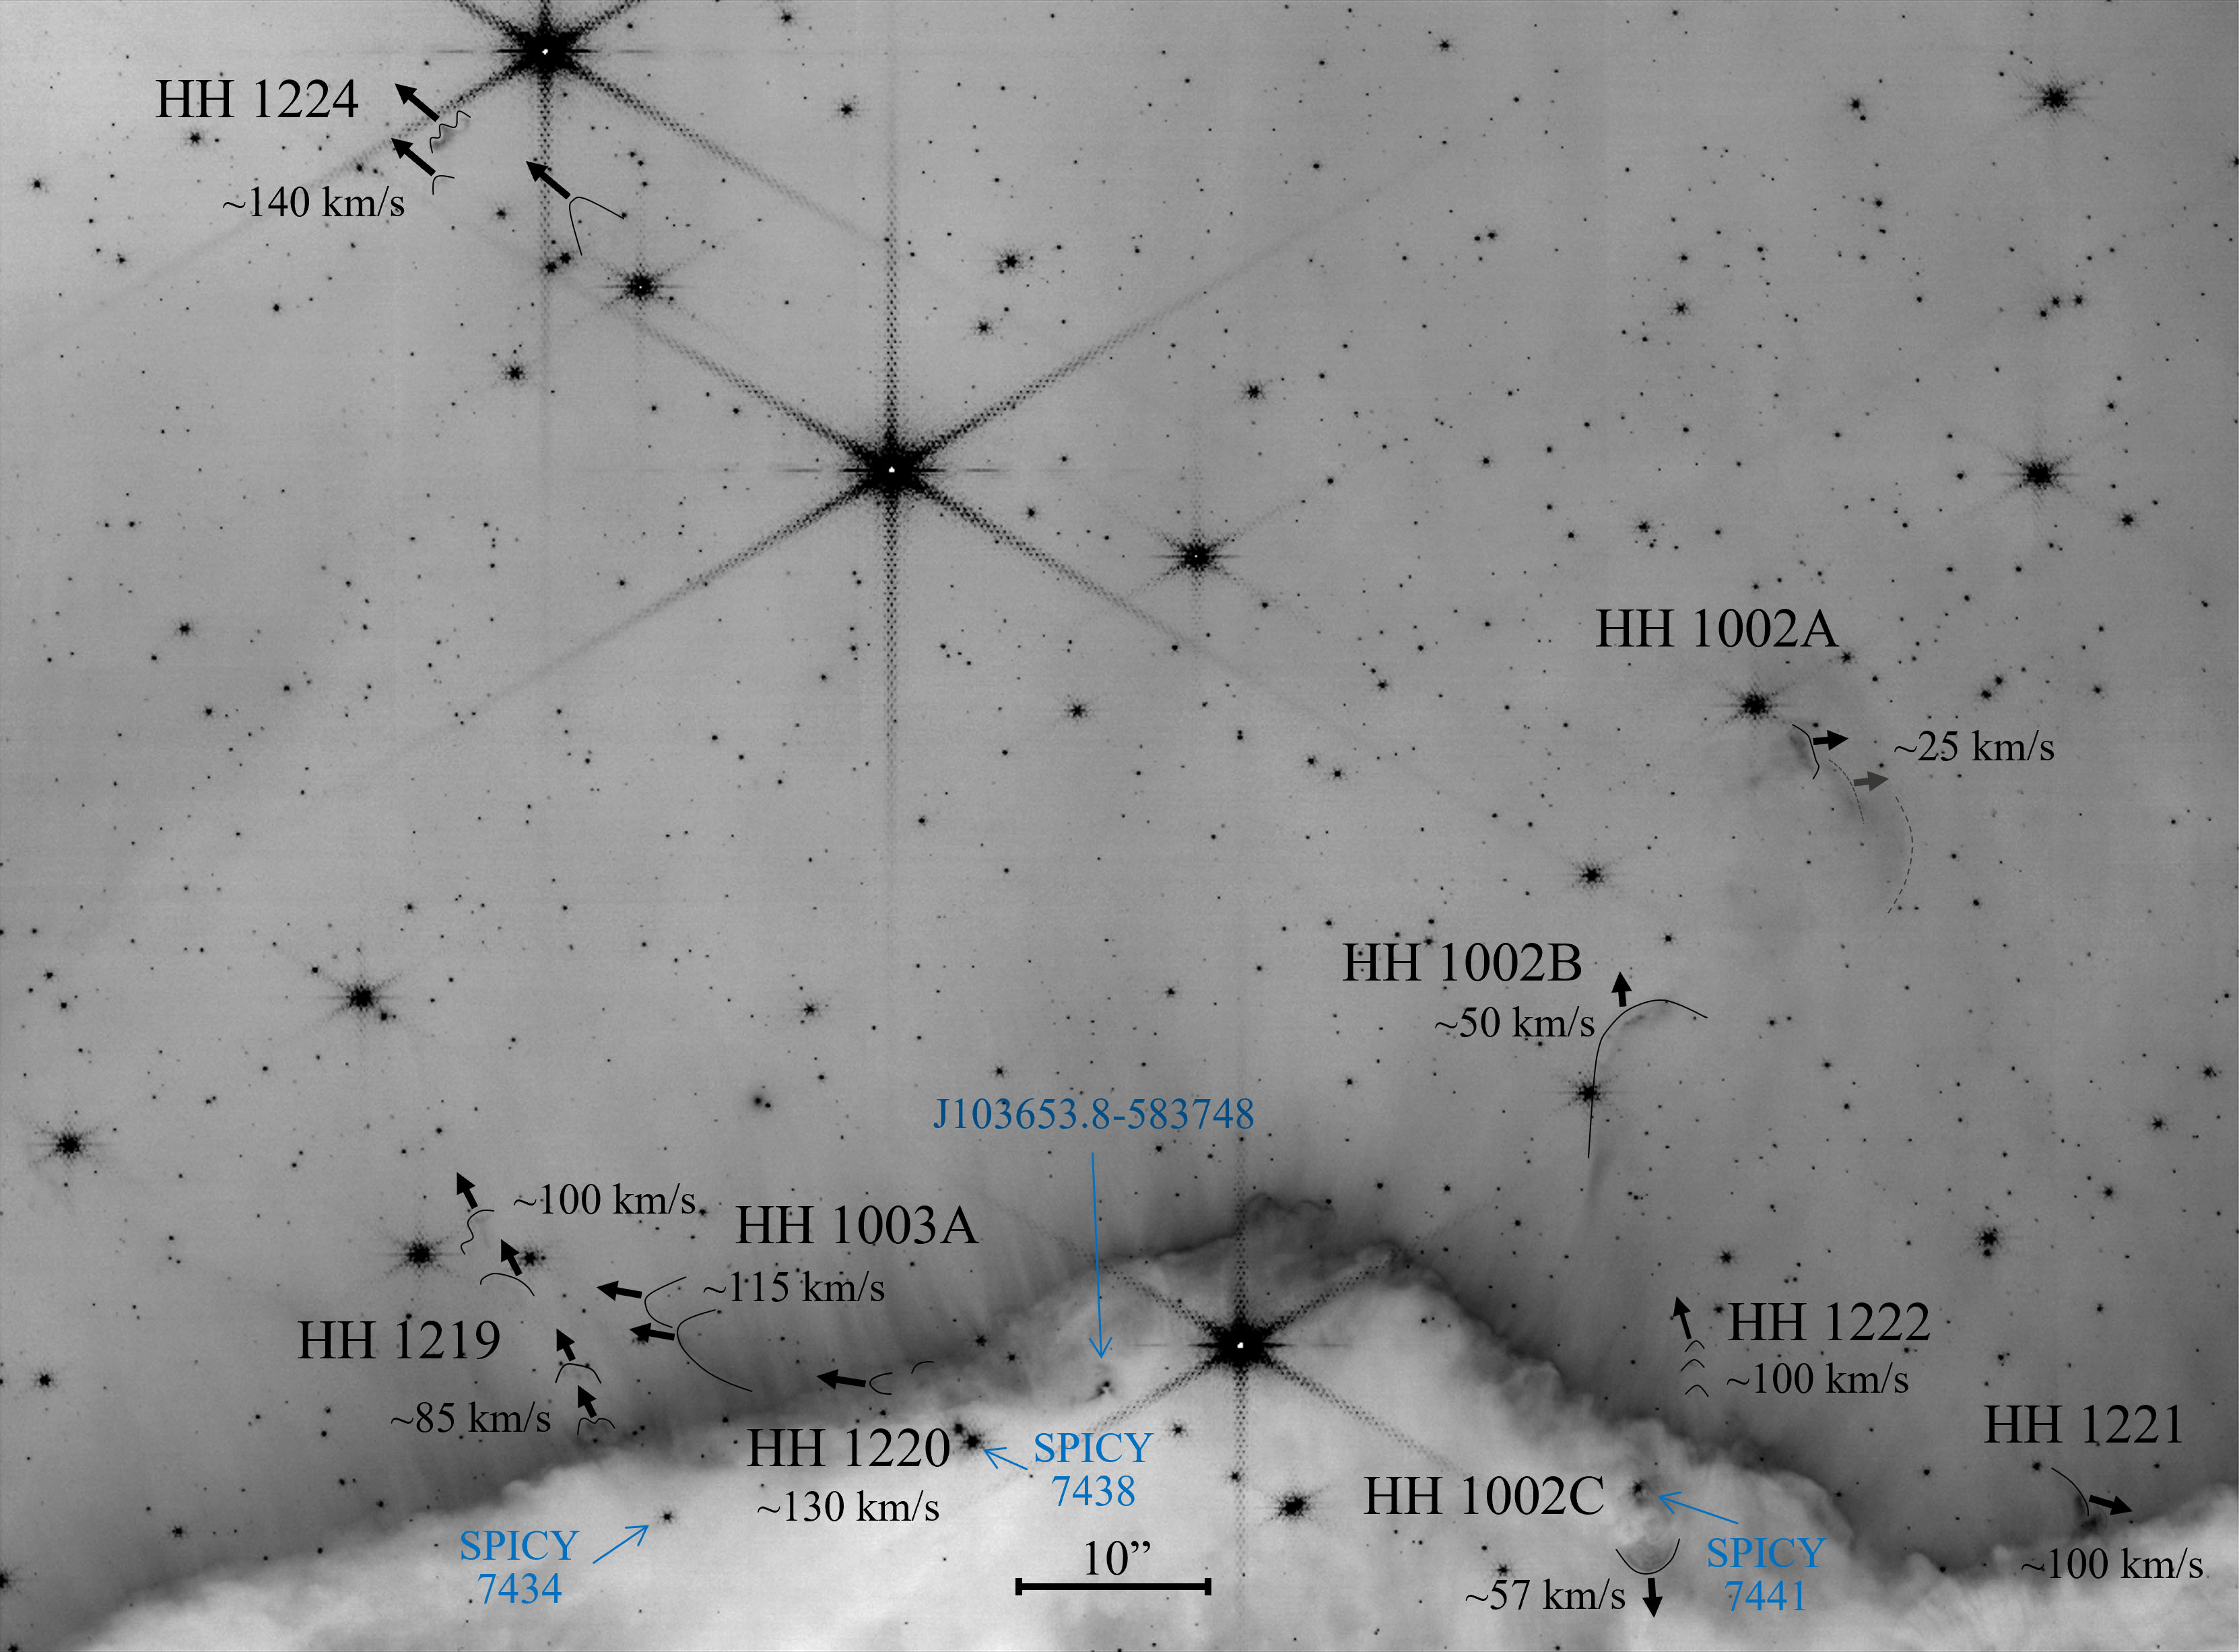
The kinematics of individual outflows and jets are described below in the context of larger fields of regard (labeled as PM Fields 1-3 in Figure 2a). We adopt the nomenclature of Smith et al. (2010a) who provided an overview of HH objects and jet-driven features in the portion of NGC 3324 captured with the HST (see Figure 3c). However, we note instances where features within a single HH designation may represent more than one outflow, or where features with different HH designations appear kinematically connected. In addition, several of the optical HH jets are associated with counterparts. The kinematic measurements of H-emitting features are depicted in Figures 18, 20, and 22, corresponding to the overlapping PM Fields 1–3 shown as dashed boxes in Figure 2a.
4.2.1 PM Field 1
HH 1003: The field shown in Figure 18 includes several optical shock structures that Smith et al. (2010a) labeled HH 1003 A, B, & C. The proper motions – denoted in Figure 18 by the transverse speeds in km s-1 and arrows – reveal that the HH 1003 complex may comprise three separate outflows. The star (bright in the F187N filter) projected in the middle of the forward HH 1003 B shock features is not identified as a YSO in the SPICY catalog and appears to be a chance superposition. The HH 1003 B shocks travel at 115 km s-1 in the same direction as the outer, slow-moving HH 1003 C complex and thus are part of the same outflow.
The HH 1003 C bow shock overall is slow-moving, with a measured proper-motion speed of 50 km s-1. However, a few small filaments within the bow shock near the apex appear to move faster (80 km s-1), though this could reflect changing caustics along our line of sight through the hydrodynamically evolving structure rather than real radiative shock wave motions. At 50 km s-1, the time for the HH 1003 C bow shock to traverse 1′ (projected distance of 0.7 pc) from the cloud edge near HH 1003 A to its current position is 14,000 years. Such a timescale is consistent with those estimated for other outer bow shocks in parsec-scale HH outflows (e.g., Devine et al., 1997; Stanke et al., 1999). However, given the speed of HH 1003 B (115 km s-1) in its wake, we could infer that HH 1003 C probably had a higher velocity in the past and has slowed during its transit through the H ii region. If it had an average transverse speed of 100 km s-1, the transit time is 7000 years. At a projected distance spanning 30″ – 40″ (0.33–0.45 pc) from the cloud edge and traveling 115 km s-1, the HH 1003 B group transit time is 2800–3800 years, and the time between the B & C major outbursts is at least several thousand years. Looking back along the direction of propagation towards the molecular cloud, there are a number of IR sources that could be driving these outflow features. SPICY 7438, the star just to the right (north) of HH 1220, lies roughly along the flow axis connecting HH 1003 B & C. However, no other optical outflow features emanate from this source. MHO 1651 emerges from SPICY 7438 with an axis nearly perpendicular direction to the HH 1003 B & C flow axis (see Figure 15 and Section 4.1) and is clearly a separate flow.
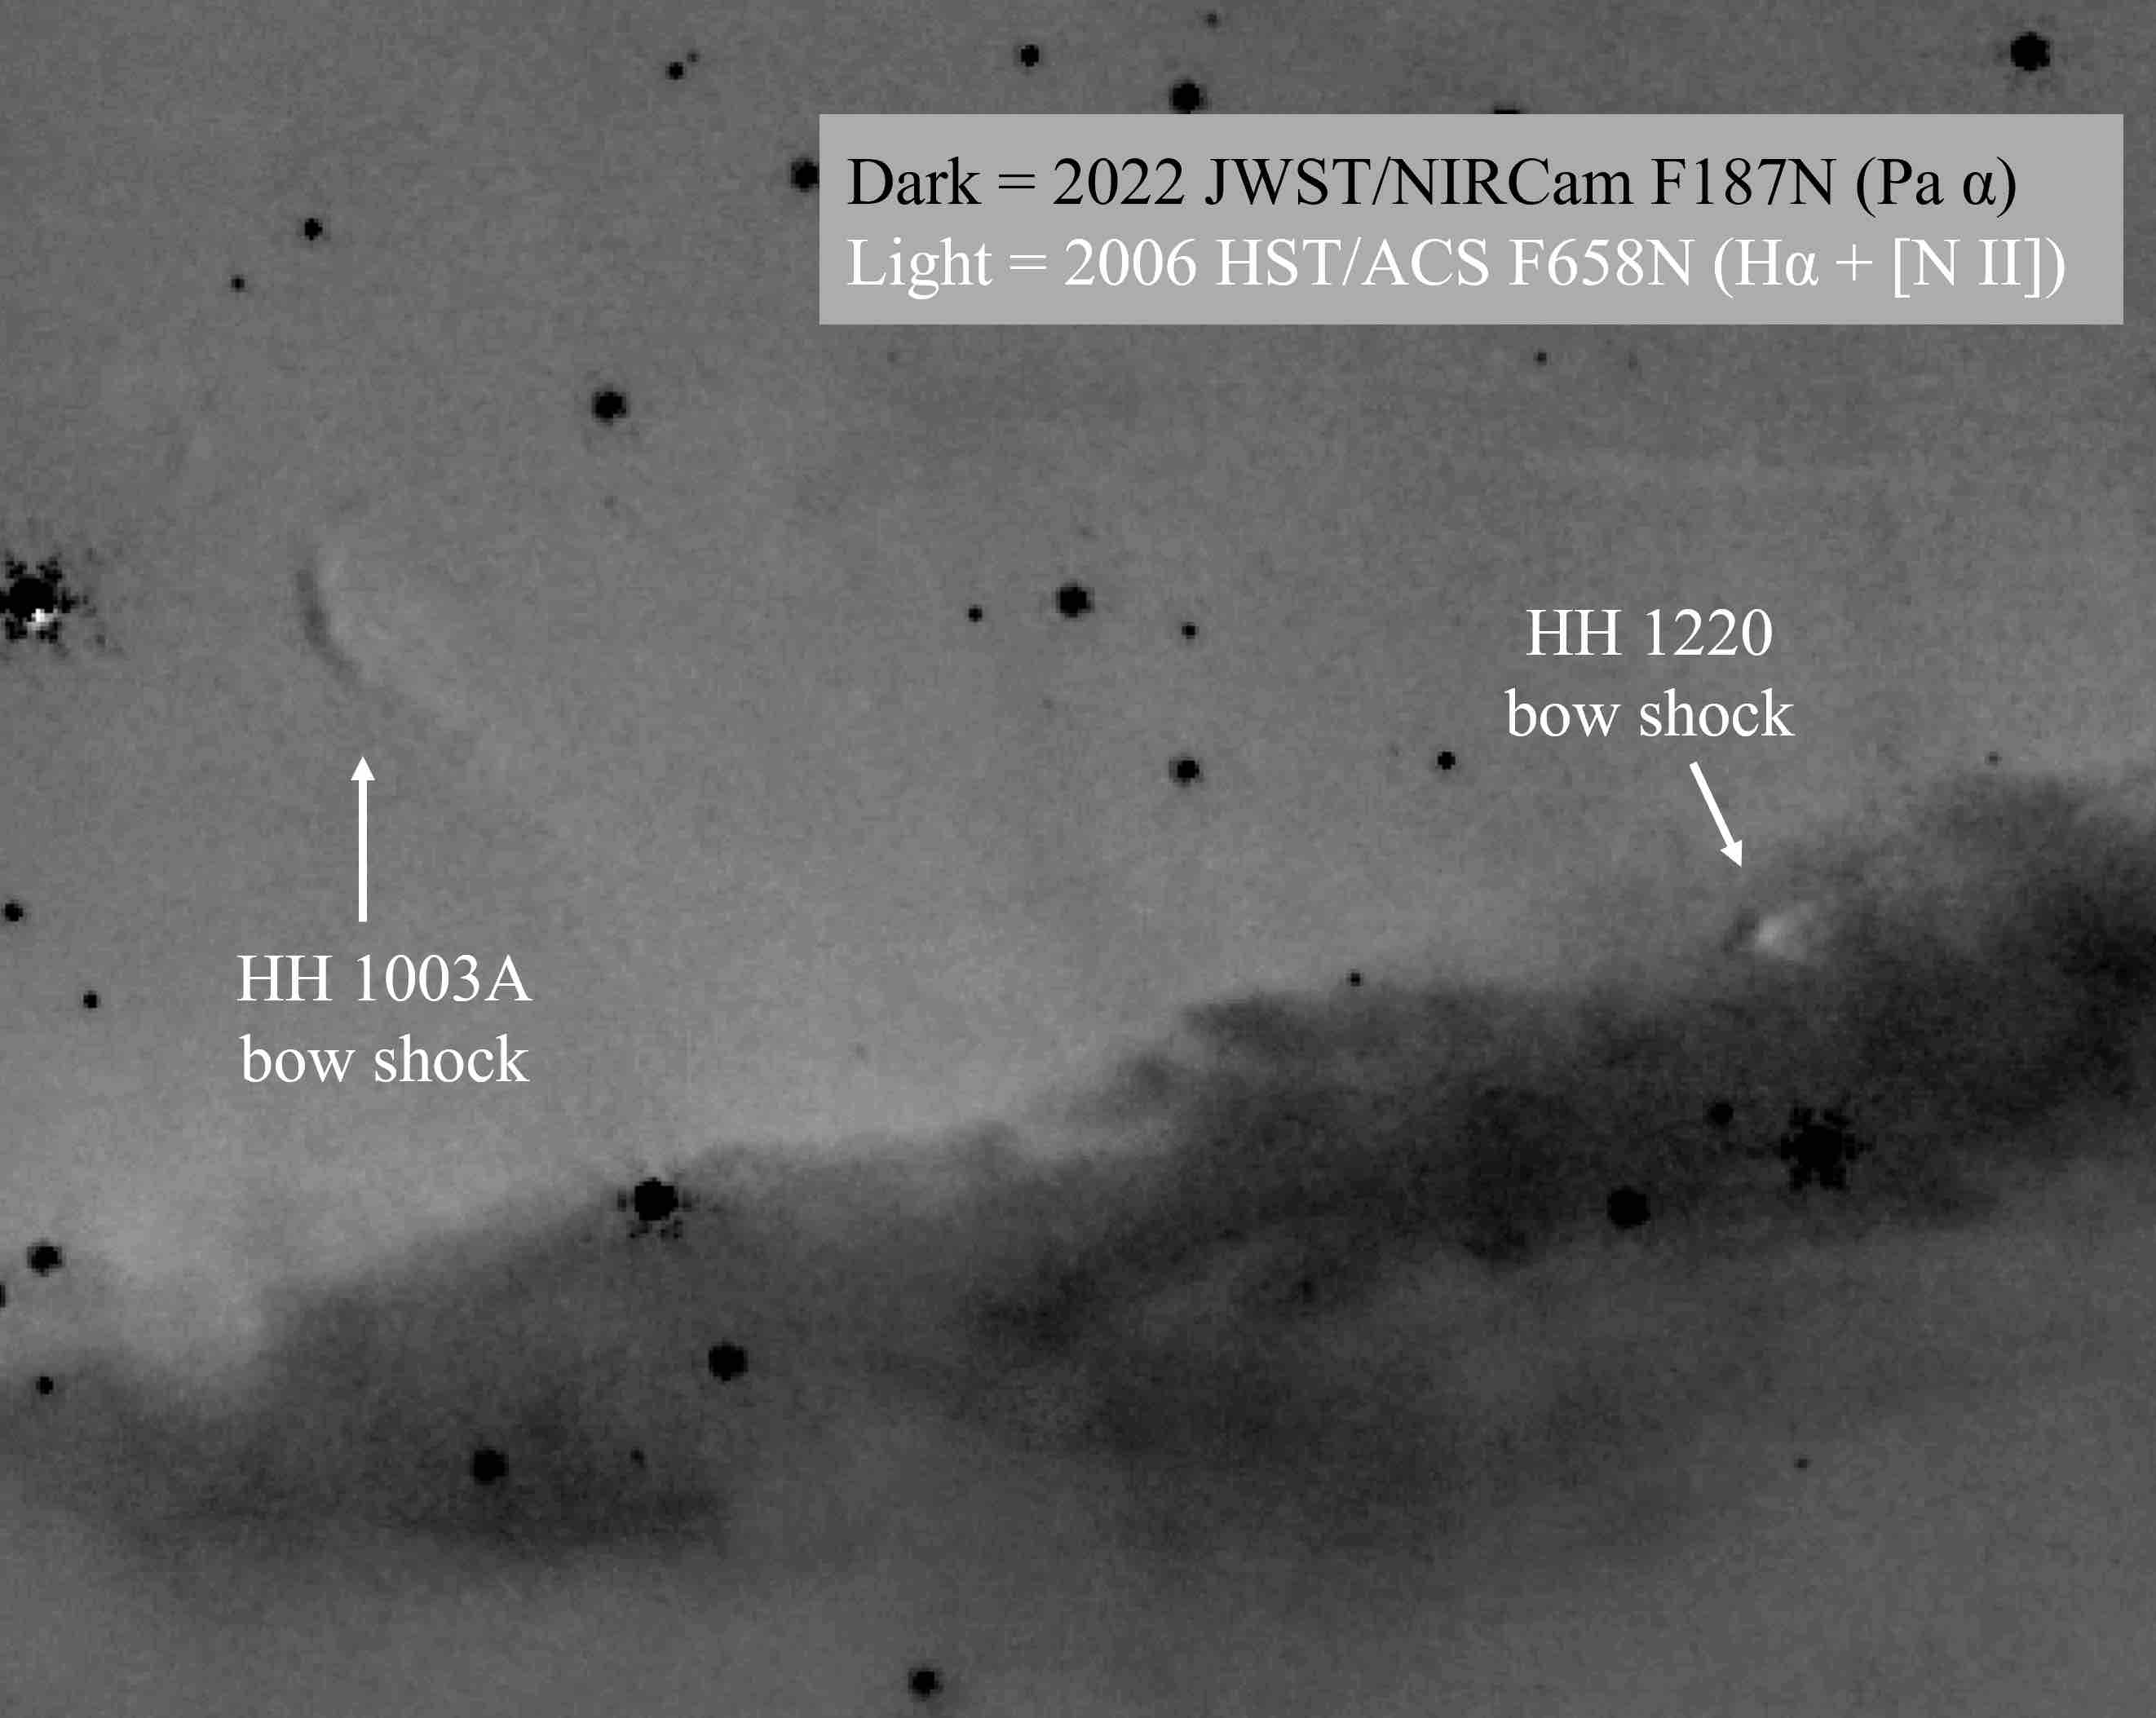
The HH 1003 A features present a more complicated velocity field, and we sub-divide these into two groups. HH 1003 A was described in (Smith et al., 2010a) as the probable driving ‘jet’ of the B & C features, but this appears instead to be a double-bow shock moving in a direction somewhat closer to the cloud edge. In Figure 7 we noted the apparent association of HH 1003 A with MHO 1639 and a candidate driving source; we return to this in the discussion of HH 1221 below. Figure 19 displays the H minus Pa- difference image that shows how the HH 1003 A shocks have moved between 2006 and 2022. Also apparent in the right-hand side of the difference image is a small, well-defined bow shock, HH 1220. This feature has an even higher transverse velocity than HH 1003 A but is traveling along a line closer to the cloud edge.
Nearby is the second sub-group, a collection of shock features that define an outflow emerging in a direction nearly perpendicular to the cloud edge into the H ii region, quite distinct from the general direction of the HH 1003 A, B, & C features.
These knots clearly trace a separate jet that is now identified as HH 1219.
An embedded source, SPICY 7434, lies just inside the cloud edge along the outflow axis and is the likely driving source.
The kinematic ages of the four HH 1219 features noted in Figure 18 are 770, 1100, 1650, and 2000 years from closest to furthest, respectively.
HH 1220: HH 1220 is a compact bow shock that lies along the bright ionization front at the cloud edge (see Figures 18 and 20). The bow-shaped arc seen in Pa- and H is confused with the undulations of the ionization front in single-epoch images, however the feature clearly moves between epochs, as shown in the subtraction image in Figure 19. The feature has a relatively high transverse velocity (130 km s-1), consistent with it being a bow shock driven by an unseen jet. The HH 1220 direction of propagation runs slightly closer to the cloud edge than HH 1003 A, and it does not lie along the line in Figure 7 from the HH 1003 A bow shock apex through the MHO 1639 outflow and driving source to the HH 1221 bow shock. Therefore, we hesitate to declare HH 1220 part of the MHO 1639 outflow, however its proximity is certainly suggestive. Future proper-motion and radial-velocity measurements could help to clarify the relationship.
4.2.2 PM Field 2
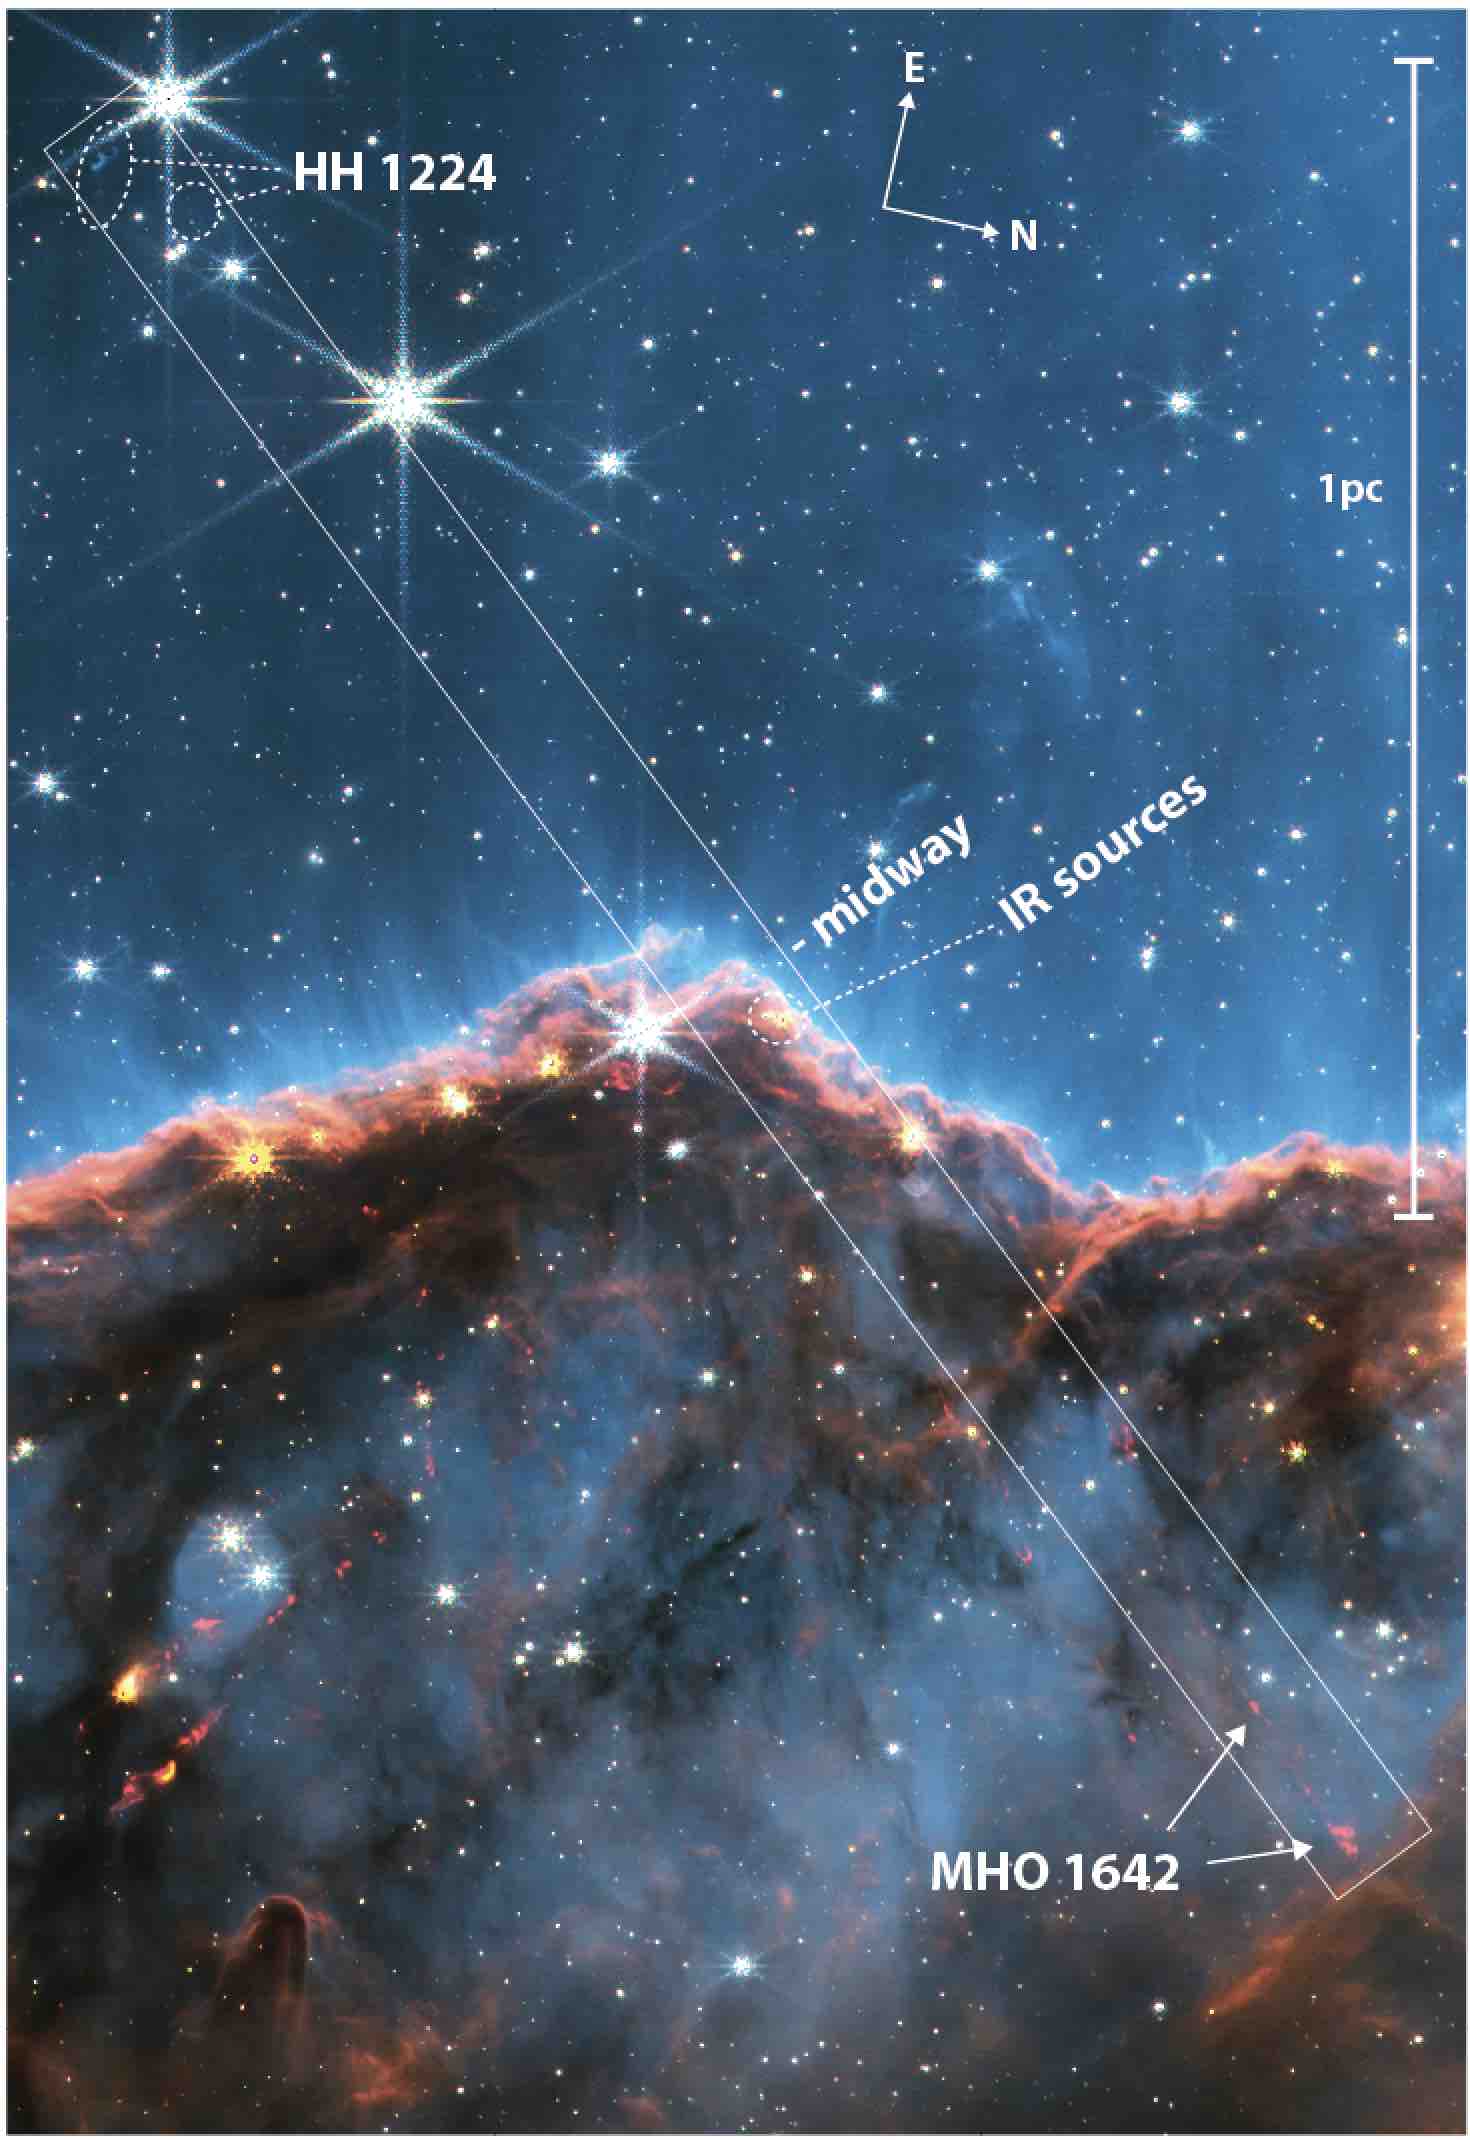
In Figure 20, we present PM Field 2, which includes the HH 1003 A & HH 1219 H-emitting shock structures in the lower-left, along with HH 1224 (candidate HH c-2 in Smith
et al., 2010a) in the upper-left and HH 1002 features on the right.
HH 1224: Features in the candidate jet HH c-2 identified by Smith et al. (2010a) have high proper motions and move as an ensemble in a direction implied by the arcuate morphology. This confirms it as an HH object; it is now designated as HH 1224. The outflow driving source is not immediately obvious but would be located towards the lower-right portion of the field shown or deeper into the cloud. The kinematics show that neither HH 1219, HH 1002 B, nor HH 1222 propagate towards HH 1224, further implying that these are all distinct outflows.
Taking a larger-scale view in Figure 21, there is a tantalizing alignment between the flow axis implied by the motion of the HH 1224 features and the knots of MHO 1642.
A cluster of three IR-bright stars (at R.A.=10:36:54.8 and Dec=-58:37:32) is located at the midpoint between HH 1224 and MHO 1642; further analysis is required to determine if any of these are YSOs.
If confirmed as a single flow, this would be one of the longest bipolar flows in the region with a total length of 1.8 pc.
Moving at a transverse speed of 140 km s-1and assuming one of the IR stars is the driving source, the kinematic age of the HH 1224 features is 6000 years.
HH 1002: Like HH 1003 in PM Field 1, HH 1002 appears to comprise several distinct outflows. The HH 1002 A group is moving slowly to the right (northerly) in Figure 20, roughly orthogonal to the axis of the bipolar HH 1002 B/C outflow. It is possible that the HH 1002 A motions represent sidesplash in the extreme wings of an older, no-longer-visible, east-moving outburst, however the southern cavity edges of HH 1002 B show no such analogous motion in the opposite direction. Future proper-motion and/or radial-velocity measurements could further elucidate whether HH 1002 A represents a distinct outflow.
The optical HH 1002 B & C features move relatively slowly in opposite directions away from the Class I YSO SPICY 7441. A single arc of emission near the YSO among the HH 1002 C filaments is identified as MHO 1647 in Figure 11.
Emission from the HH 1002 C bow shock in the F200W filter closely resembles Pa- and likely traces Br emission within the bandpass. The proper-motion velocities of the opposing HH 1002 B & C features are similar in magnitude, so assuming ballistic motion at the currently measured speeds, the kinematic ages are 5300 and 830 years, respectively.
HH 1222:
Adjacent to the HH 1002 B side of the bipolar outflow lies a series of knots labeled ‘jet’ by Smith
et al. (2010a).
These knots emerge from the cloud edge with transverse speeds of 100 km s-1.
With this confirmation of its jet-like nature, the ‘jet’ is given the designation HH 1222.
There is no clear IR driving source for HH 1222 near the edge of the molecular cloud.
Tracing the knot paths back to an apparent cavity at the cloud edge, we estimate kinematic timescales of 400, 550 and 670 years for the three knots we can measure since they emerged into the H ii region.
The direction of propagation of the HH 1222 knots is slightly tilted southward a few degrees compared to the brightest filament near the apex of HH 1002 B.
This filament contains two brighter knots and then a third fainter knot is 1″ to the left (southward) in Figures 20 and 11a. Blinking the Pa- and H images hints at a slightly divergent trajectory for the fainter knot, suggesting this may be another (older) HH 1222 knot. This knot would then have a kinematic age of 3300 yrs since emerging into the H ii region if its average speed were between 50-100 km s-1.
HH 1221: In the very lower-right of Figure 20 is an arcuate feature with a bright filament labeled HH 1221. This feature has a northerly proper motion, and is of similar scale and speed but propagates in the opposite direction of HH 1003 A. As shown in Figure 7 and discussed in Section 4.1, we argue that HH 1221 is part of a bipolar outflow with optical bow shocks HH 1003 A and HH 1221, and the collimated molecular outflow MHO 1639, emanating from the IR source J103653.8-583748. At a projected distance of 52″ (0.6 pc) from the IR source suspected to drive the MHO 1639 outflow, the HH 1221 bow shock traveling at 100 km s-1 has a kinematic age of 5600 years. On the opposite side of the IR source at a projected distance of 23″ (0.25 pc), the bright HH 1003 A bow shock traveling at a transverse speed of 115 km s-1 has a kinematic age of 2200 years.
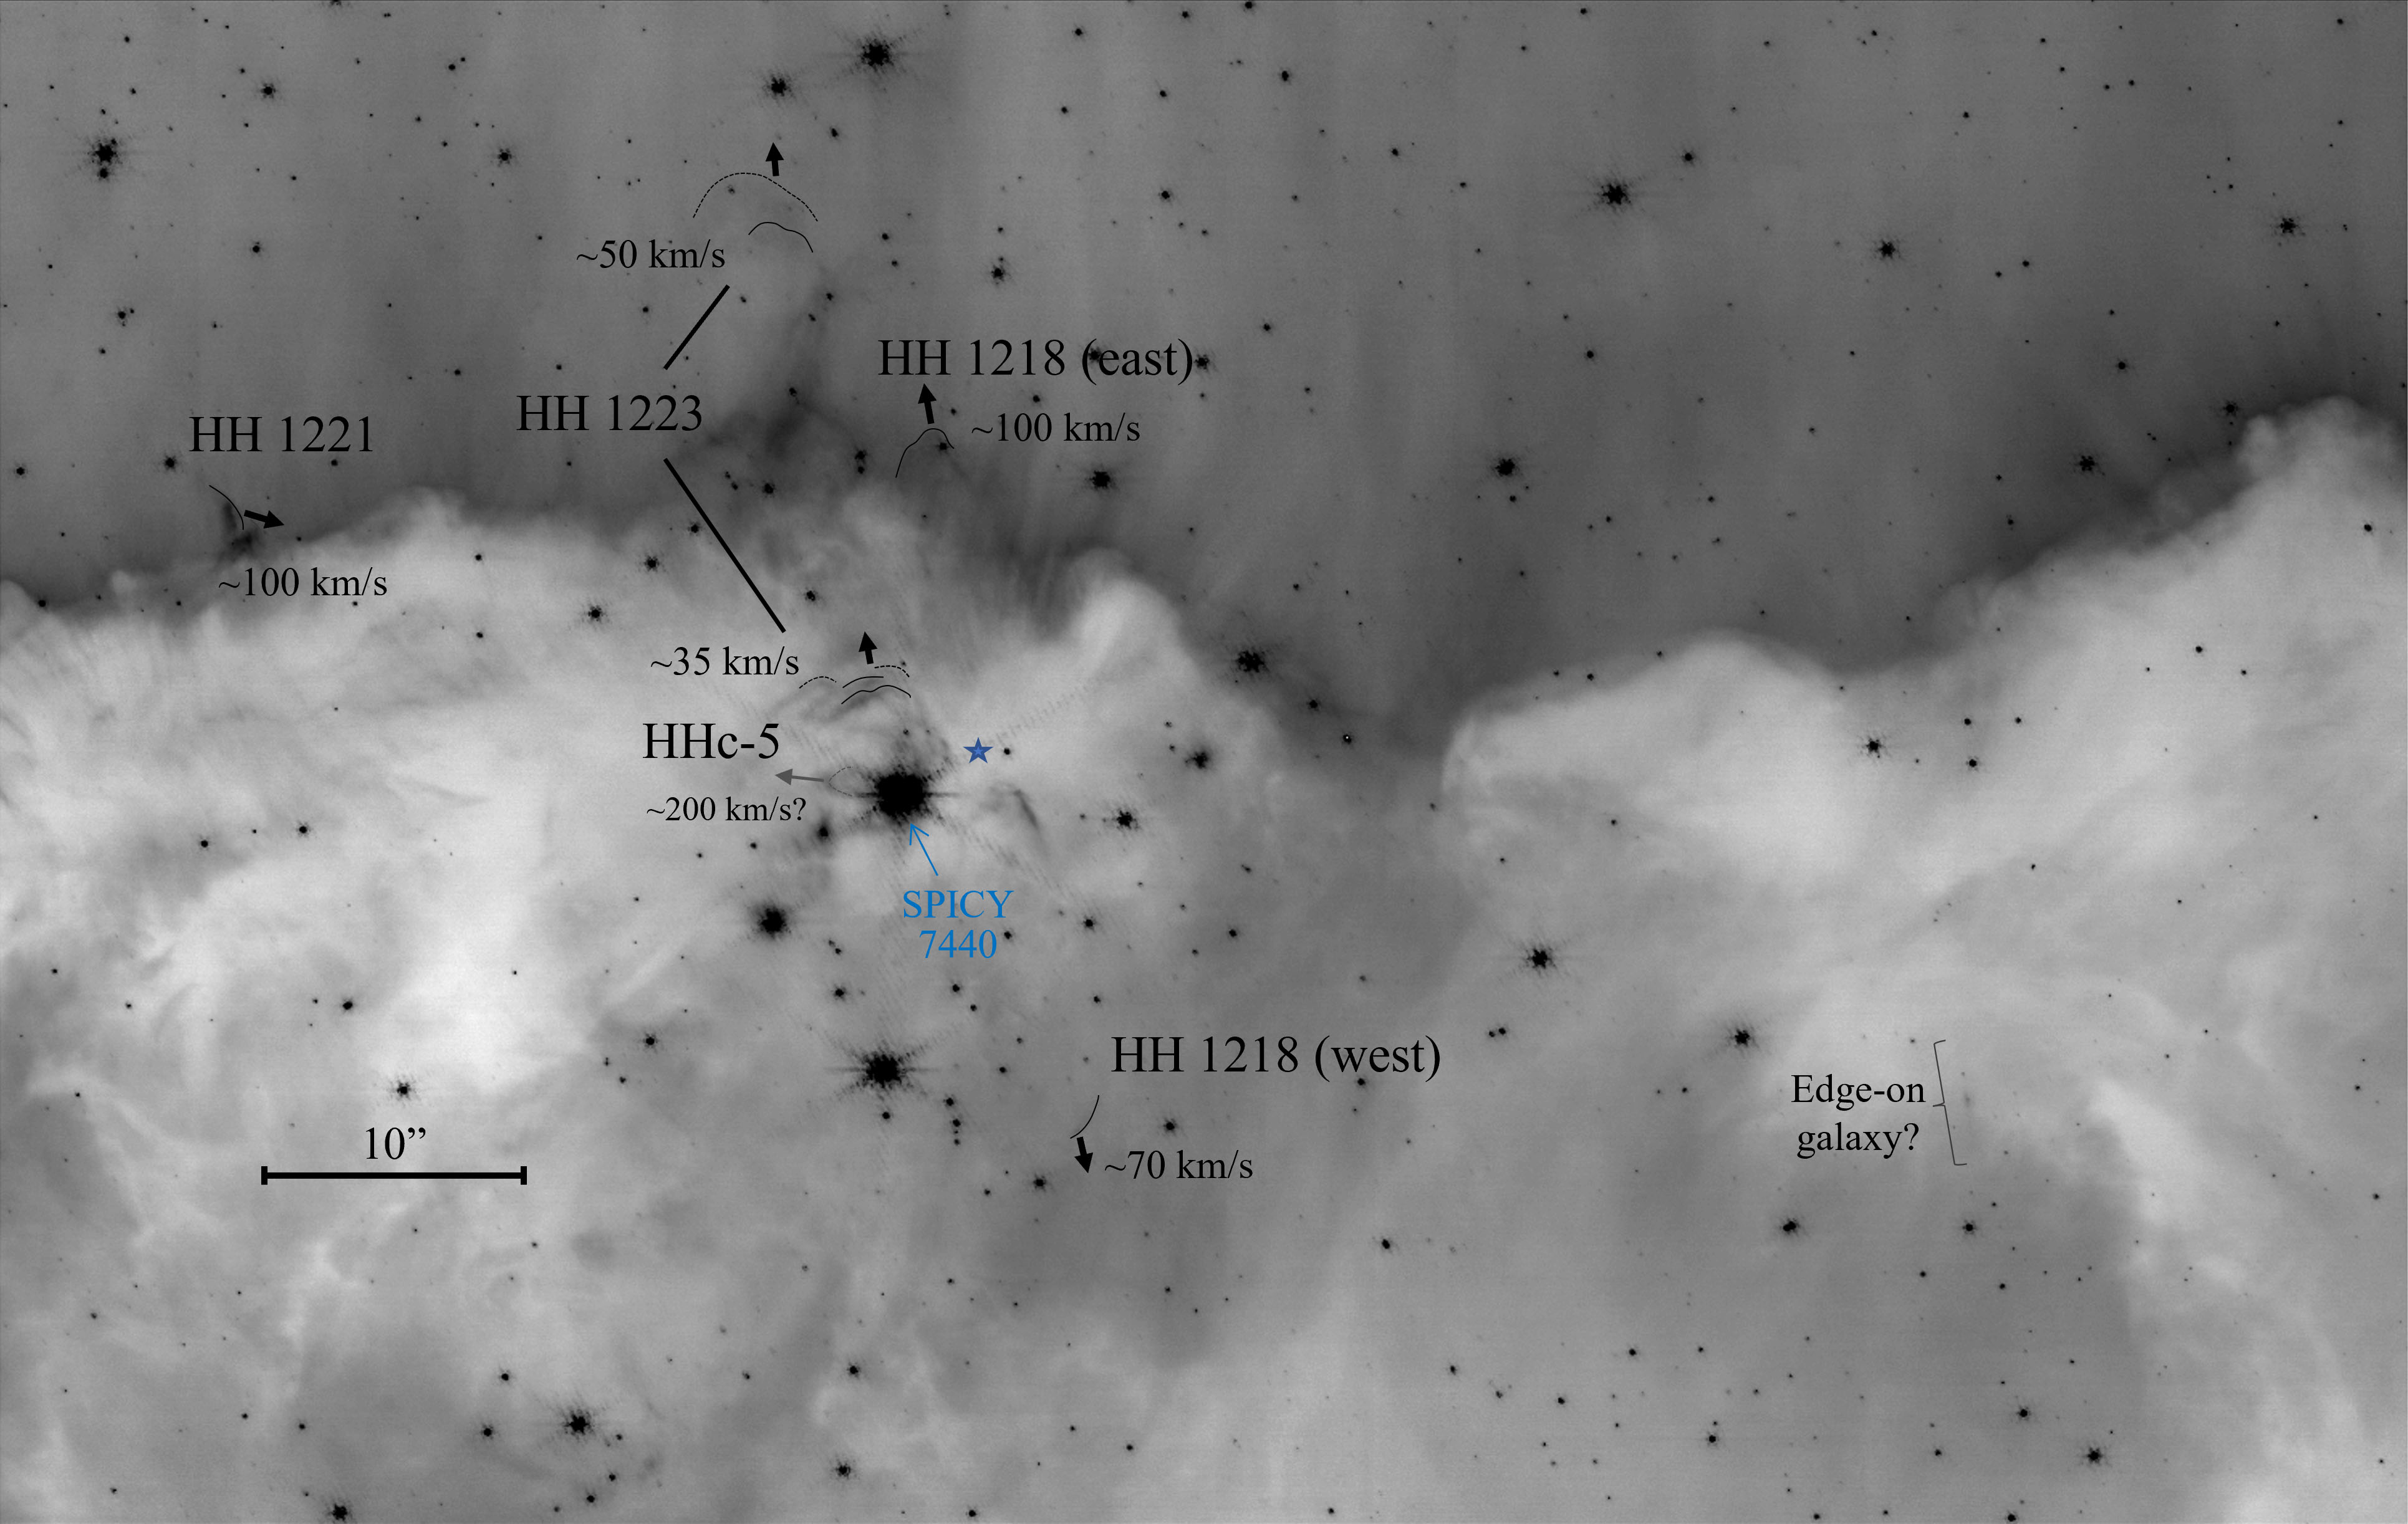
4.2.3 PM Field 3
HH 1223: Further to the north of the HH 1002 features, Smith et al. (2010a) identify shock-like features emerging from the cloud edge as the candidate outflow HH c-1. Comparison with continuum-subtracted images shows that optical emission features sit just south of the embedded MHO 1643 structures and extend outside the cloud into the H ii region (see Figure 9b and 22). The morphologies of HH c-1 and MHO 1643 suggest misaligned axes tracing separate flows. Proper motions demonstrate that filaments in the HH c-1 complex are moving, indicating supersonically outflowing gas even though no collimated jet body is seen in the feature. With proper motions confirming the flow, this object is now designated HH 1223. The several arcs just east of SPICY 7440 (above in Figures 9 and 22) are slow-moving at 35 km s-1 (kinematic age of 1200 years) toward the cloud edge, but in the same direction as the faint structures traveling 50 km s-1 about beyond the cloud edge in the H ii region (kinematic age of 4300 year).
The elongated structure recognized by Smith
et al. (2010a) for its relatively high [S ii]/H ratio shows little or no proper motion, and may lie at the edge of one or more intersecting outflow cavities.
HH 1218:
The filaments at the edge of the cloud just northward show motions of 100 km s-1 in a direction consistent with their being part of the MHO 1643 outflow. Their kinematic age from the J103654.2-583626 IR source, which is visible in the Pa- image, is approximately 1400 years.
On the opposite side of the MHO 1643 driving source about equidistant from these faster cloud edge filaments lies a faint arc of emission that forms a partial bow shock. A distinct knot in this partial H-emitting bow shock shows a transverse velocity of 70 km s-1 in a direction opposite to the cloud edge filaments, and consistent with J103654.2-583626 being the driving source of the bipolar flow. The kinematic age of the H-emitting partial bow shock is 2300 years.
When compared to the continuum-subtracted images, it is immediately clear that this partial bow coincides with the biggest and brightest bow shock associated with the western side of MHO 1643 (see Figures 9 and 22).
We therefore infer that the molecular bow shock that spatially coincides with the partial optical bow shock has the same 2300-yr kinematic age, and that the trailing molecular bow shock likely has a kinematic age about 2/3 as long, or 1500 years, similar to the faster optical filaments at the cloud edge.
HH c-5: Intriguingly, a small arc of emission projects just southward (left in Figure 22) of the YSO SPICY 7440, a flat spectrum source that is visible in both H and Pa- images. Tenuous emission from the wings of the shock may connect back toward this YSO, like a small wind-blown cavity. The apex of the shock is also apparent in the F200W image, perhaps tracing shock-excited , Br emission, or both. Any counterpart in the narrowband F470N image is obscured by the airy rings of the saturated stars in the cluster. At first glance, this jet appears one-sided and has an estimated proper-motion velocity of 200 km s-1 (10 pixels), the fastest of any feature. Additional Pa- emission on the opposite side of the YSO may trace shock-excited emission from a counter-jet (see Figure 22), but this may be confused with Pa- emission from the base of MHO 1643.
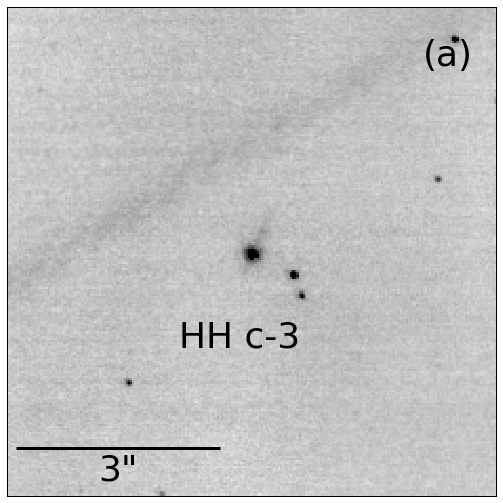
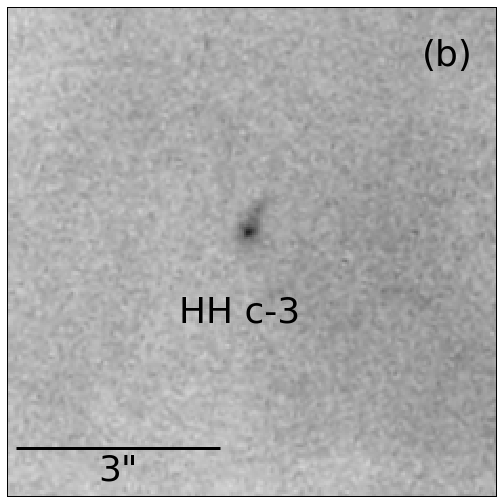
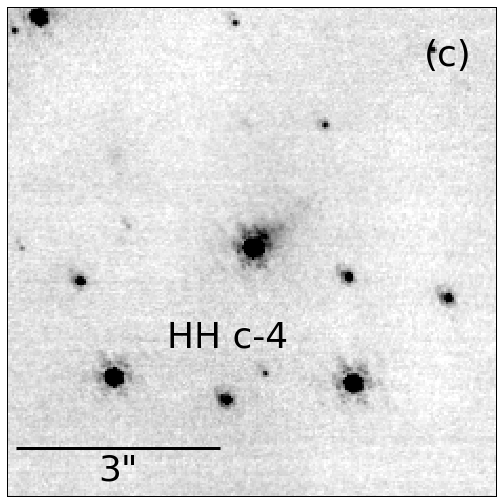
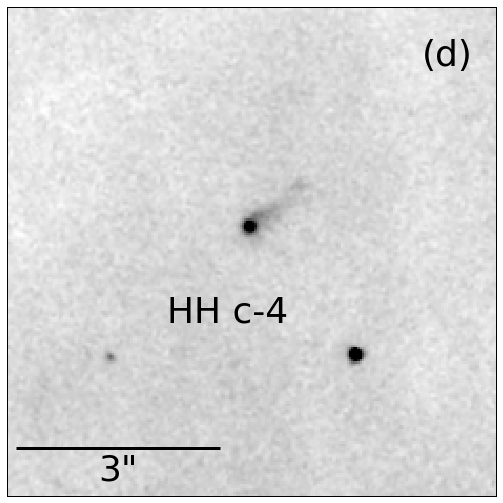
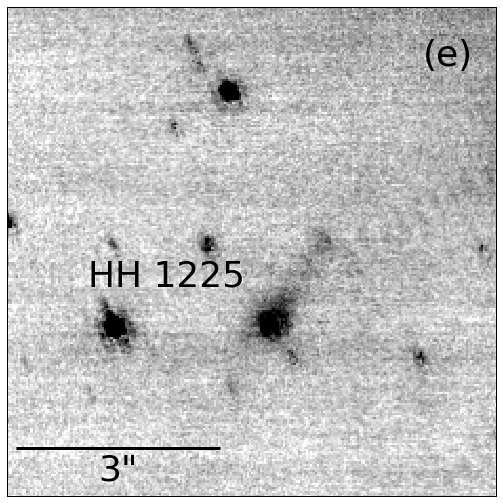
4.2.4 Microjets
We identify two candidate and one confirmed microjet in the H and Pa- images: HH c-3, HH c-4, and HH 1225 (see Table 3 and Figure 23). All three appear monopolar, with collimated emission that extends ( AU) from stars that are visible in the H ii region. Only candidate HH c-4 is associated with a YSO, SPICY 7467, a Class II source. All three microjet axes have similar orientations (see Figure 23) and a morphology that is reminiscent of the photoevaporating protoplanetary disks (proplyds) seen in Orion and other nearby H ii regions (O’dell & Wen, 1994b; Bally et al., 2000b; Kim et al., 2016; Haworth et al., 2021). However, proplyds have a cometary tail on the far side from the UV source, which would be in the opposite direction of what we observe for the ionizing sources in NGC 3324 (see Section 2).
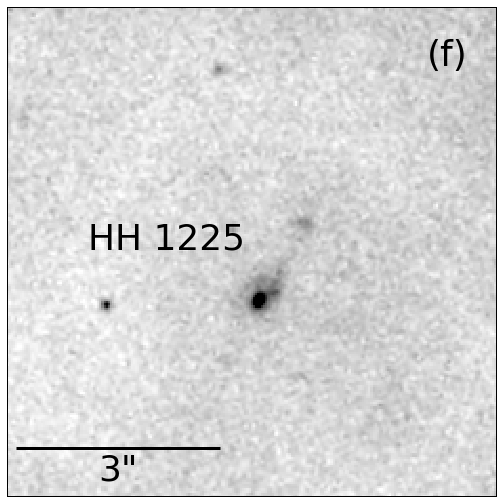
In general, emission from the candidate microjets is too faint and too smooth to reliably measure proper motions. Only HH 1225 has a clearly defined knot at the tip of the microjet, similar to HH 1018 (see Smith et al., 2010a; Reiter et al., 2017). Using this knot, we estimate a jet velocity of 100 km s-1 (5 pixels) along PA 66∘.
| Designation | R.A. | Dec. | YSO | Stage | Comment |
| HH 1002† | 10:36:57.1 | 58:37:26 | J103654.0-583720 | Class I | SPICY 7441 |
| HH 1003 A† | 10:36:53.6 | 58:38:09 | J103653.8-583748 | … | Associated with HH 1221 and MHO 1639 |
| HH 1003 B | 10:36:53.6 | 58:38:45 | J103653.3-583754 | uncertain | SPICY 7438 |
| HH 1003 C† | 10:36:54.8 | 58:39:09 | J103653.3-583754 | uncertain | SPICY 7438 |
| HH 1218 | 10:36:52.6 | 58:36:20 | … | … | Associated with the bow shock of MHO 1643 |
| HH 1219 | 10:36:52.8 | 58:38:13 | J103652.3-583809 | Class I | SPICY 7434; proper motions make clear that it is not part of HH 1003 A |
| HH 1220 | 10:36:53.5 | 58:37:60 | … | … | May be part of MHO 1639 |
| HH 1221 | 10:36:54.6 | 58:36:57 | … | … | Part of MHO 1639 |
| HH 1222† | 10:36:54.8 | 58:37:18 | … | … | Labeled ‘jet’ in Smith et al. (2010a), near HH 1002 but kinematically distinct |
| HH 1223† | 10:36:55.9 | 58:36:38 | J103653.9-583629 | flat spectrum | SPICY 7440; HH c-1 in Smith et al. (2010a) located south of MHO 1643 |
| HH 1224† | 10:37:01.1 | 58:38:37 | … | … | HH c-2 in Smith et al. (2010a) |
| HH 1225 | 10:37:01.7 | 58:39:31 | … | … | Microjet with H and Pa- |
| HH c-3 | 10:37:01.5 | 58:37:51 | J103701.5-583751 | … | Candidate microjet seen in H and Pa- |
| HH c-4 | 10:37:02.1 | 58:36:57 | J103702.1-583658 | Class II | SPICY 7467; candidate microjet seen in H and Pa- |
| HH c-5 | 10:36:53.9 | 58:36:32 | J103653.9-583632 | … | Pa- and visible in F200W (Br?) |
| † identified in Smith et al. (2010a) | |||||
| HH | P.A. | Kinematic | Comment | |
| Designation | (km s-1)† | (∘)∗ | Age (yrs) | |
| HH 1002 A | 25 | 17 | - | Driving source uncertain; sidesplash of older outburst? |
| HH 1002 B | 50 | 107 | 5300 | |
| HH 1002 C | 57 | 286 | 830 | |
| HH 1222 | 100 | 119 | 400/550/670 | 3 jet knots form a distinct outflow; may include faint knot in HH 1002 B complex |
| HH 1003 A | 115 | 182 | 2,200 | Associated with MHO 1639 and HH 1221 |
| HH 1219 | 85, 100 | 139 | 770/1,100/1,650/2,000 | 4 features measured |
| HH 1003 B | 115 | 165 | 2,800-3,800 | 2 shock complexes; foreground star unrelated? |
| HH 1003 C | 50 | 160 | 7,000-14,000 | Younger age range assumes deceleration has occurred |
| HH 1223 ridges | 35 | 110 | 1200 | Uneven expansion across filaments |
| HH 1223 left/slow | 50 | 105 | 4300 | Diffuse features, uncertain measurements |
| HH 1218-counterjet | 100 | 112 | 1400 | Fast filaments at cloud edge, part of MHO 1643 |
| HH 1218 | 70 | 295 | 2300 | Part of MHO 1643, coincides with bow shock |
| HH 1224 | 140 | 152 | 6,000 | Counter flow to MHO 1642? |
| HH 1220 | 130 | 185 | - | Small bow shock, uncertain driving source, may be associated with MHO 1639 |
| HH 1221 east | 100 | 355 | 5600 | Associated with MHO 1639 and HH 1003 A |
| HH 1225 | 100 | 66 | 160 | Knot at tip of microjet |
| HH c-5 | 200 | 190 | 150 | Variable emission pattern may not be shock motion |
| † Transverse velocity uncertainty km s-1 | ||||
| ∗ Typical Position Angle uncertainty is | ||||
5 Discussion
Near- and mid-IR observations from JWST penetrate the dusty walls surrounding the NGC 3324 H ii region, revealing more than a dozen outflows for the first time. We identified flows based on their morphology in F470N–F444W images. Streams of knots and striking bow shocks trace distinct outflows. Many of the outflows are clearly bipolar (12/) while in other cases, only a single limb can be identified (5/). Sources like MHO 1648 that do not have an obvious driving source are more difficult to classify. Other sources, like MHO 1637 and MHO 1646, have bright emission along the probable outflow axis on the opposite side of the driving source that may trace the counterflow. However, these counterflows are difficult to confirm because they are located amid the complex subtraction residuals of the JWST PSF.
Several of the outflows seen with JWST are clustered together with flow axes that overlap in projection. For sources like MHO 1636, 1637, and 1638 (see Figure 6), proper motions measured with future epochs of JWST imaging will clarify the membership of individual shock features in each of the outflows. Proper motion measurements will also clarify the origin of the chain of knots seen between MHO 1634 and MHO 1635 (see Figure 5). Finally, proper motions are one of the best ways to confirm or refute candidate driving sources listed in Table 2 (e.g., Reiter et al., 2017).
In addition to the flows, we also identify a few irradiated outflows and shock-like features in Pa-. Many of the most prominent shocks were identified by Smith et al. (2010a) in their H images. For features detected in both H and Pa-, we measure proper motions to confirm their jet-like nature. In this way, we identify five new HH jets and one new candidate. Finally, we identify three candidate microjets in the H ii region (see Figure 23). In retrospect, all three are also visible in the H images from HST.
The exquisite angular resolution and IR sensitivity of JWST allow us to directly compare the atomic and molecular outflow components, providing a more complete and, in some cases, more complex picture. For example, MHO 1647 consists of a bow shock propagating from the SPICY 7441 YSO into the cloud (see Figure 11). This shock sits within the larger bipolar HH 1002 outflow identified by Smith et al. (2010a). The counterflow propagating into the H ii region is only seen in Pa- and H.
Like MHO 1647, MHO 1639 has both atomic and molecular components. Inside the cloud, a chain of knots trace a collimated outflow axis that extends the width of one of the ‘mountains’ in these ‘cosmic cliffs’ (see Figures 2 and 7). Two shocks in the H ii region seen only in Pa- and H, HH 1003 A and HH 1221, lie along the same straight jet axis traced by MHO 1639. Proper motions of the two atomic shocks trace an axis that coincides with the jet-like emission.
Most of the embedded outflows do not have associated Pa- emission. Instead, Pa- appears to trace either a cavity or a reflection nebula around some of the driving sources (e.g., MHO 1634, MHO 1639, and MHO 1643 see Figures 5, 7, and 9, respectively). In shocks where both and Pa- are observed, their ratio may be used to estimate the shock type (as in Colgan et al., 2007). However, only the prominent bow shocks of MHO 1643 have weak associated Pa-, so a full excitation analysis is not possible with these data.
Almost all of the new candidate outflows that we report in NGC 3324 are completely embedded. This is in contrast to the many HH jets that reside in the main portion of the Carina star-forming complex (Smith et al., 2010a; Reiter et al., 2016; Reiter et al., 2017). These jets were discovered in H images and are thus overwhelmingly seen near cloud edges if not in the H ii region entirely. Reiter et al. (2016) used near-IR [Fe ii] observations to trace the embedded portion of the Carina jets, in many cases connecting shock-like wisps seen in H outside the cloud to the IR-bright driving source itself. Numerous flows have also been detected in the main portion of the Carina star-forming complex (Preibisch et al., 2011; Tapia et al., 2011; Hartigan et al., 2015).
Finally, we note that the NGC 3324 region as a target for JWST ERO observations was not chosen as a famous site for protostellar outflow activity. Based on wide-field mid-IR emission, the most active star formation in the region is further south along the bubble rim (see Figure 3b, and Smith & Brooks 2007). As such, these observations may represent the level of outflow activity we expect to see with JWST observations of star-forming regions. Most of the outflows we identified in NGC 3324 are seen in with no H/Pa- counterpart, so we expect that the high angular resolution at IR wavelengths afforded by JWST is likely to significantly increase the census of outflows in places like main Carina star-forming complex too. Future observations of NGC 3324 with JWST at other wavelengths and later epochs will enhance the value of this dataset by providing proper motions of embedded outflow components and a clearer identification of the outflow-driving sources.
5.1 Outflow bending and orientation
Many of the flows in NGC 3324 have bent outflow axes. None trace the characteristic S-shape typical of a precessing jet (e.g., Raga et al., 1993; Terquem et al., 1999). Instead, the axes of MHO 1632, MHO 1638, MHO 1644, and MHO 1649 trace gentle C-shaped arcs while MHO 1633 has a more sharply curved J-shape. Overall, 5/ (21%) appear bent, similar to the fraction found in Cygnus X by Makin & Froebrich (2018). This is higher than the fraction of bent outflows in lower-mass regions (14%, Froebrich & Makin, 2016) which Makin & Froebrich (2018) speculate may be due to deflection by dust in the environment.
Eislöffel (2000) also find that bent outflows are common in their sample of parsec-scale outflows. They propose two mechanisms that may explain the shape of outflows where both lobes of the bipolar flow arc in the same direction. First, a supersonic side-wind (Canto & Raga, 1995; Salas et al., 1998) may bend the outflows, as has been proposed to explain bent jets in the Orion H ii region (Bally et al., 2006). This seems unlikely for the embedded jets in NGC 3324 as they are shielded by the surrounding molecular cloud. Second, the motion of the driving source itself may lead to an apparent bend of the outflow axis. In this scenario, the driving source ejects a straight bipolar outflow. Once launched, the outflow knots continue to travel ballistically. However, the star is not stationary, so the next knot ejection happens when the star has moved away from the location (and outflow axis) seen at a time . These subsequent bursts appear offset from the previous outflow knots, tracing out an apparently curved flow. Reiter et al. (2020b) proposed a similar scenario to explain the apparent bending of HH 900. Proper motions of the outflows and their driving sources are required to test this hypothesis.
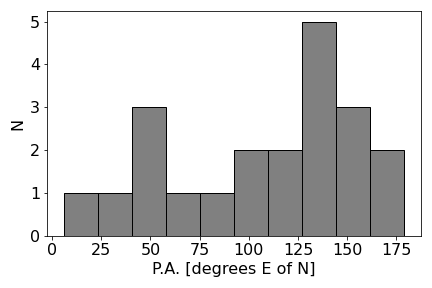
We measure the outflow orientation by defining an axis that connects the two most distant outflow knots identified. Sharply curved sources like MHO 1633 are therefore given only one position angle (P.A.). More precise estimates will be possible when proper motions are available to confirm the knot membership of outflows like MHO 1633. For most of the bent outflows in this sample, the P.A. measured this way is approximately the same as a tangent line to the outflow at the location of the driving source. Outflow P.A.s in degrees east of north are listed in Table 2 and the distribution of outflow P.A.s is shown in Figure 24.
The measured P.A.s are distributed over almost the full range from . Two notable peaks near and are enhanced by the nearly parallel outflow pairs, MHO 1634 and MHO 1635 and MHO 1640 and MHO 1641 (discussed below). A Kolmogorov-Smirnov (K-S) test indicates that the distribution of P.A.s cannot be distinguished from a uniform random distribution (p-value=0.083). While we caution that this sample is small, multiple studies have P.A. distributions consistent with a random distribution (e.g. Davis et al., 2009; Froebrich & Makin, 2016; Stephens et al., 2017; Baug et al., 2020) although preferential outflow orientations have been found with respect to local dust lanes and filaments in young high-mass regions (e.g., Davis et al., 2007; Raga et al., 2010; Makin & Froebrich, 2018; Kong et al., 2019).
While the population of outflows overall traces a wide range of P.A.s, two pairs of outflows show remarkable alignment: MHO 1634 and MHO 1635 (see Figure 5) and MHO 1640 and MHO 1641 (see Figure 8). As projected on the plane of the sky, the outflows appear almost parallel with projected separations between the outflow axes of 10,000 – 20,000 AU. The outflow origins and candidate driving sources are also located in close proximity although not perfectly aligned. Only 6.5″ (15,000 AU) separate the MHO 1634 and MHO 1635 driving sources. The candidate YSOs driving MHO 1640 and MHO 1641 are further apart, with the closer of the two candidate driving sources for MHO 1641 located 13″ (30,000 AU) from the MHO 1640 driving source. For comparison, in Cygnus X Makin & Froebrich (2018) find 10 parallel outflows with driving sources separated by 20″ (28,000 AU at 1.4 kpc), representing 2% of their sample. The four outflows in parallel pairs represent a larger fraction of our smaller sample: 17% or 4/.
The separations between outflow axes and their driving sources are larger than typical core sizes (10,000 AU). If these neighboring stars formed from the same core, then they must have migrated outward. However, there are a couple of challenges to this interpretation. First, at smaller separations, the protostars and their disks will exert a stronger gravitational influence on each other. This may lead to precession causing the outflows to trace an S-shape on the sky. We do not observe this. Instead, the outflows in these pairs appear quite straight (especially MHO 1640 and MHO 1641, see Figure 8). Indeed, even in the absence of the S-shape, observations suggest that outflows from binary pairs are either randomly or preferentially anti-aligned (Lee et al., 2016). Second, as discussed above, if the driving sources are moving, this may lead to an apparent bend in the outflow. None of the outflows in these parallel pairs show a strong C-shape. Nevertheless, driving source motion may play a role in the MHO 1634 and MHO 1635 pair. The two flows have broader outflow lobes that may faintly arc toward each other. More distant knots lie almost exactly between the two outflow axes (see Figure 5) making it unclear which source drives them. Proper motions are required to constrain the motion of the driving sources and identify which outflow likely drives [which of] the more distant blobs. Finally, we note that the current separation between the driving sources in both pairs is larger than the typical binary separations for all but the highest mass stars (see, e.g., Figure 2 in Duchêne & Kraus, 2013).
The cluster of outflows containing MHO 1643, MHO 1644, HH 1223, and HH c-5 represents the contrasting scenario, more similar to the quadrupolar flows reported in Froebrich & Makin (2016); Makin & Froebrich (2018). Multiple outflows emerge from the same cluster but the outflow axes are all oriented in different directions. MHO 1643 and MHO 1644 trace the characteristic X-shape of quadrupolar flows. Both are noticeably bent with more distant knots arcing further to the south (left in Figure 9). HH 1223 propagates along a third axis between MHO 1643 and MHO 1644 and candidate jet HH c-5 is nearly perpendicular to the two outflows. Future proper motion measurements will help clarify the complex outflow motions in this region.
MHO 1645 and MHO 1646 trace another X-shaped quadrupolar flow. In total, 17% (4/) of the MHOs in NGC 3324 are in quadrupolar systems, somewhat higher than the fraction (9–10%) reported by Froebrich & Makin (2016) and Makin & Froebrich (2018).
Outside the cloud, HH 1003 A, B, & C, together with HH 1220, HH 1221 and MHO 1639, may represent a parsec-scale bipolar outflow that has undergone directional changes either due to precession of the driving source or due to the external environment. In general, the proper-motion speeds are higher closer to the suspected driving source(s) and the furthest structures, such as HH 1003 C, are the slowest moving and largest in size. Such characteristics are common to other (more isolated) parsec-scale outflows such as HH 34 or HH 47 (Bally & Devine, 1994; Stanke et al., 1999).
Outflows in the H ii region may be deflected by the photoablation flows originating at the ionization front. Propagation through the resulting density gradient may gradually ‘bend’ the trajectory of the outflowing material away from the cloud. Photoevaporated material flows away from the cloud edge at the sound speed (10–15 km s-1) and imparts an additional impulse on the cross-cutting outflow features (e.g., Hester et al., 1996; Bally et al., 2006; Smith et al., 2010a).
However, it seems more likely that HH 1003 B & C are a separate flow from MHO 1639 and its associated HH objects, HH 1003 A and HH 1221 (and possibly HH 1220). The kinematic evidence suggests that HH 1003 A, MHO 1639, and HH 1221 form a coherent bipolar outflow with little evidence of ‘bending’ or deflection (see Figure 7). Meanwhile, HH 1003 B & C travel in the same direction and a line connecting the apices of these bow shocks does not intersect the driving source of MHO 1639; we alternatively suggest SPICY 7438 as a potential driving source (see Figure 18 and Table 3). Moreover, HH 1003 A is traveling at about the same speed as HH 1003 B, breaking with the notion of steadily decreasing proper-motion speeds with increasing distance from the source. It seems inconsistent that a sizeable deflection of HH 1003 B would not also slow it down considerably, or that HH 1003 B used to move considerably faster in the past than HH 1003 A currently is. Future proper-motion measurements and radial velocities from spectra will help clarify the trajectory and origin of all of these features.
5.2 YSOs
The majority of known flows are driven by young embedded sources (those with a flat spectrum or positive mid-IR spectral index, e.g., Davis et al., 2009). To identify candidate driving sources for the new flows presented in this paper, we search for near-IR excess sources located on the outflow axis from the SPICY catalog (Kuhn et al., 2021) and point sources newly identified in the JWST ERO data.
We identify seven candidate driving sources using the SPICY catalog (see Tables 2 and 3). Of these, one is a flat spectrum source and three are Class I sources, consistent with previous results that driving sources tend to be young. Of the remaining three SPICY YSOs, two have an uncertain evolutionary classification. One Class II source appears to drive one of the candidate microjets exposed in the H ii region. From the SPICY catalog, we identify Spitzer-detected driving sources for 3/ MHOs and 7/ HH candidates that trace an additional 4 distinct flows with no molecular counterparts. In total, 7/31 outflows in the region ( outflows plus 7 distinct HH flows) have a candidate driving source identified in the Spitzer data, corresponding to a detection rate of 23%. This is much lower than in the main portion of the Carina star-forming complex where roughly half of the HH jets have a Spitzer-detected driving source (Reiter et al., 2017).
In the area imaged with NIRCam, there are a total of 25 candidate YSOs in the SPICY catalog. Of these, 12% (3/25) are associated with an MHO and 28% (7/25) are associated with an outflow of any kind. The outflow occurrence rate among Spitzer-detected YSOs is similar to but slightly higher than the rate found by Reiter et al. (2016) for HH jets in the main portion of the Carina star-forming complex (22%).
We also compare the location of the candidate microjets presented in this study with the location of X-ray-active young stars identified by Preibisch et al. (2014). X-ray emission traces an active chromosphere, as is often seen from young low-mass stars that are no longer embedded, providing a complementary sample of more evolved young stars. None of the coutflows or microjets presented in this study have an X-ray-active young star located on or near the outflow axis.
5.3 Comparison to other outflows
Near-IR 2.12 µm emission is one of the best tracers of embedded jets and outflows. Spectacular examples of collimated outflows (e.g., Zinnecker et al., 1998) echo structures seen in the optical (e.g., Reipurth, 1989; Reipurth et al., 1997). Systematic surveys for outflow emission in the Orion star-forming complex (e.g., Yu et al., 1997, 1999; Stanke et al., 1998, 2002; Davis et al., 2009) and other low- and high-mass star-forming regions (e.g., Aquila, Zhang et al. 2015; and DR21/W75N, Smith et al. 2014) revealed dozens of outflows from embedded young stars. The largest such survey to date is the UKIRT Widefield Infrared Survey for (UWISH2, Froebrich et al., 2011, 2015). UWISH2 revealed hundreds of flows from low- and high-mass star-forming regions (Serpens and Aquila, Ioannidis & Froebrich 2012a, b; Cassiopeia and Auriga, Froebrich & Makin 2016; M17, Samal et al. 2018; Cygnus X, Makin & Froebrich 2018). outflows from young stars are collected in the general catalogue of molecular hydrogen emission-line objects (MHOs; Davis et al., 2010)777http://astro.kent.ac.uk/df/MHCat/, a complement to the HH catalog (Reipurth, 2000).
emission lines at longer wavelengths have been used to study outflows with the InfraRed Array Camera (IRAC; Fazio et al., 2004) on the Spitzer Space Telescope (Werner et al., 2004). Shock-excited emits strongly in the 4.5 µm IRAC band allowing outflows to be identified in color-color diagrams (Ybarra & Lada, 2009) or by green emission with shock- or outflow-like morphologies (using the standard color mapping where 4.5 µm emission is shown in green, e.g. Gutermuth et al., 2008; Giannini et al., 2013). Extended green objects, the so-called Spitzer EGOs, trace outflow activity from predominantly higher-mass protostars (Cyganowski et al., 2008; Cyganowski et al., 2009, 2011). Several of these EGOs were detected in Spitzer images of the Carina Nebula (Smith et al., 2010b). Most of the 2.12 µm outflows from low-mass stars in the study of Giannini et al. (2013) were also detected with Spitzer. Only about half of EGOs have associated 2.12 µm emission; less than one third (28%) of those have similar morphology between the Spitzer and 2.12 µm emission (Lee et al., 2012, 2013). Instead, the broadband emission more closely resembles the near-IR continuum emission suggesting that scattered light contributes to the extended emission seen in the [4.5] Spitzer band.
The new outflows presented here were all identified in continuum-subtracted narrowband images. Some knots are also visible in F200W images, likely tracing either 2.12 µm or Br 2.16 µm emission in the band (e.g., MHO 1643 and MHO 1647, see Figure 9 and 11, respectively). None of the flows reported here were previously identified as EGOs (e.g., by Kuhn et al., 2021). This is consistent with these outflows being driven by low- to intermediate-mass YSOs.
We note two bright reflection nebulae that stand out in color images (yellow in Figure 2). Both are at the origin of flows. The bright reflection nebula from SPICY 7423, the MHO 1634 driving source, surrounds a collimated chain of knots that trace the outflow axis. A similar bowl of emission is seen at the origin of MHO 1643 and MHO 1644 (see Figure 9). Flux in the continuum bands is more evenly distributed through the reflection nebula compared to the continuum-subtracted images.
5.4 Outflow feedback in context
Feedback from high-mass stars can trigger or accelerate star formation by compressing molecular gas (e.g., Bertoldi, 1989; Lefloch & Lazareff, 1994; Bisbas et al., 2011; Mackey & Lim, 2011; Haworth & Harries, 2012) or it can disperse the molecular cloud and suppress star formation (e.g. Walch et al., 2012; Dale et al., 2015; Grudić et al., 2021). In particular, pillars and bright rimmed clouds are often suggested as sites of triggered star formation (e.g. Thompson et al., 2004; Urquhart et al., 2007; Urquhart et al., 2009). Sugitani et al. (1991) and Lefloch & Lazareff (1994) suggest an evolutionary sequence in which the irradiated clouds start with a broad morphology and become more compressed, elongated and cometary over time. None of the outflows in NGC 3324 are associated with the most prominent elongated pillar in the region (the most evolved according to the above paradigm). This is in contrast to the many jets seen from pillar tips in the main portion of the Carina star-forming complex (Smith et al., 2010a) which have been proposed to be the result of triggered star formation (e.g., Smith et al., 2010b; Ohlendorf et al., 2012).
While none of the outflows in NGC 3324 emerge from prominent pillars, the majority of the outflows are detected close to the ionization front. Almost all of the outflows we report are located within 1′ of the ionization front edge, or roughly the top third of the cloud imaged with NIRCam (see Figure 2). The close association of active star formation with ionized cloud rims has been taken as evidence for triggered star formation. However, true triggering is difficult to prove observationally or numerically (e.g., Dale et al., 2015). Outflows in NGC 3324 are also confined to the center of the image, with all flows within the middle half of the north-south extent of the NIRCam mosaic. Future estimates of the extinction and column density in this region are required to determine whether we preferentially detect outflows in regions with lower optical depths.
Finally, with the unprecedented sensitivity of JWST, we have detected outflows driven by lower-mass stars despite the 2.3 kpc distance. Whether or not their collapse was triggered, these stars are forming from gas that was affected by feedback. Gas and dust temperatures are higher in high-mass star-forming regions (including NGC 3324, Rebolledo et al., 2016) and there is evidence for complex organic chemistry in strongly irradiated UV environments (Cuadrado et al., 2017). How these impact star formation is an open question, one that is getting renewed attention for its possible impact on planet formation. Feedback is expected to quickly expose YSOs leading to rapid disk dissipation (e.g., Qiao et al., 2022). However, if feedback drives star-forming cores to higher densities, then they may shield their disks for a significant fraction of the planet formation timescale (e.g., Reiter et al., 2019, 2020a, 2020b). Well-studied outflows in high-mass regions like Carina have enabled the first studies of planet-forming disks in feedback-dominated regions (e.g., Mesa-Delgado et al., 2016; Cortes-Rangel et al., 2020). The new population of jets in NGC 3324 provides a target list to extend these kinds of studies to a broader range of feedback conditions as well as younger and possibly lower-mass sources.
6 Conclusions
We report the detection of outflows in NGC 3324 seen for the first time with JWST. Near-IR observations penetrate the dust wall surrounding the H ii region, uncovering active star formation before it is subject to the harshest feedback from the nearby O-type stars. We also identify new HH objects, complementing earlier detections made with HST. In retrospect, all HH objects seen in Pa- were also detected in earlier H imaging with HST, allowing us to measure proper motions over a 16 yr time baseline.
In total, we have identified 31 outflows in the NGC 3324 region – MHOs and HH flows. Our study includes HH objects, including three outflows with both and Pa- emission (MHO 1639, MHO 1643, and MHO 1647) and 4 additional flows with no molecular counterpart. We identify candidate driving sources for 7/31 (23%) of the outflows from the SPICY catalog of YSOs. The evolutionary classification of the candidate driving sources inferred from the shape of their IR SEDs indicates that they are young (flat spectrum or Class I), consistent with earlier studies of outflows. Using the JWST ERO data, we identify an additional 17 point sources on or near outflow axes as candidate driving protostars. A more detailed analysis of the physical properties of these sources is left for future work.
The comprehensive view of the atomic and molecular components of these outflows is only possible with JWST. With the unprecedented sensitivity and angular resolution, we can compare the different components of individual outflows on the same spatial scales. These outflows represent a population of actively accreting stars located just outside the H ii region boundary, still embedded in their natal cloud sampling the moments before they are subject to direct irradiation by the nearby high-mass stars. This geometry has often been taken as evidence for triggered star formation, and the interpretation is tempting as we find few flows deep in the cloud. However, we caution that other possibilities like variations in the extinction and optical depth have not been ruled out.
Whether or not feedback triggered the collapse of the driving YSOs, these sources are forming out of gas that has been strongly affected by feedback. Understanding the impact of environmental feedback is currently a hot topic, especially regarding its impact on planet formation. These outflow-driving sources represent a well-localized set of targets for future study.
Finally, these ERO observations represent the tip of the iceberg of what is possible for star-formation studies with JWST. For NGC 3324, these images provide a first epoch for future proper motion studies that will clarify the association of individual knots with specific outflows and confirm or refute the candidate driving sources we identify. Additional observations in other filters may identify driving sources and constrain outflows excitation and mass-loss rates. As a region with only modest star formation, NGC 3324 indicates how rich observations with JWST stand to be for uncovering low-mass star formation in high-mass regions.
Acknowledgements
We would like to thank John Bally for a prompt and helpful referee report. We would also like to thank Dirk Froebrich and Bo Reipurth for quickly providing MHO and HH numbers for this paper and their thoughtful comments on the work. We would also like to thank Adam Ginsburg for thoughtful discussions. This work is based on observations made with the NASA/ESA/CSA James Webb Space Telescope. The data were obtained from the Mikulski Archive for Space Telescopes at the Space Telescope Science Institute, which is operated by the Association of Universities for Research in Astronomy, Inc., under NASA contract NAS 5-03127 for JWST. These observations are associated with program #2731. This research is based in part on observations made with the NASA/ESA Hubble Space Telescope obtained from the Space Telescope Science Institute, which is operated by the Association of Universities for Research in Astronomy, Inc., under NASA contract NAS 5–26555. These observations are associated with program 10475. The MHO catalogue is hosted by the University of Kent. This research has made use of the SIMBAD database, operated at CDS, Strasbourg, France and SAOImage DS9 (Joye & Mandel, 2003). TJH is funded by a Royal Society Dorothy Hodgkin Fellowship.
Data Availability
The data used in this work are available to the public for immediate download from the MAST archive888https://archive.stsci.edu/missions-and-data/jwst.
References
- Ali (2021) Ali A. A., 2021, MNRAS, 501, 4136
- Bally & Devine (1994) Bally J., Devine D., 1994, ApJ, 428, L65
- Bally & Reipurth (2001) Bally J., Reipurth B., 2001, ApJ, 546, 299
- Bally et al. (1998a) Bally J., Sutherland R. S., Devine D., Johnstone D., 1998a, AJ, 116, 293
- Bally et al. (1998b) Bally J., Testi L., Sargent A., Carlstrom J., 1998b, AJ, 116, 854
- Bally et al. (2000a) Bally J., O’Dell C. R., McCaughrean M. J., 2000a, AJ, 119, 2919
- Bally et al. (2000b) Bally J., O’Dell C. R., McCaughrean M. J., 2000b, AJ, 119, 2919
- Bally et al. (2006) Bally J., Licht D., Smith N., Walawender J., 2006, AJ, 131, 473
- Baug et al. (2020) Baug T., et al., 2020, ApJ, 890, 44
- Beichman et al. (2012) Beichman C. A., Rieke M., Eisenstein D., Greene T. P., Krist J., McCarthy D., Meyer M., Stansberry J., 2012, in Clampin M. C., Fazio G. G., MacEwen H. A., Oschmann Jacobus M. J., eds, Society of Photo-Optical Instrumentation Engineers (SPIE) Conference Series Vol. 8442, Space Telescopes and Instrumentation 2012: Optical, Infrared, and Millimeter Wave. p. 84422N, doi:10.1117/12.925447
- Bending et al. (2022) Bending T. J. R., Dobbs C. L., Bate M. R., 2022, MNRAS, 513, 2088
- Bertoldi (1989) Bertoldi F., 1989, ApJ, 346, 735
- Bisbas et al. (2011) Bisbas T. G., Wünsch R., Whitworth A. P., Hubber D. A., Walch S., 2011, ApJ, 736, 142
- Burrows et al. (1996) Burrows C. J., et al., 1996, ApJ, 473, 437
- Canto & Raga (1995) Canto J., Raga A. C., 1995, MNRAS, 277, 1120
- Colgan et al. (2007) Colgan S. W. J., Schultz A. S. B., Kaufman M. J., Erickson E. F., Hollenbach D. J., 2007, ApJ, 671, 536
- Cortes-Rangel et al. (2020) Cortes-Rangel G., Zapata L. A., Toalá J. A., Ho P. T. P., Takahashi S., Mesa-Delgado A., Masqué J. M., 2020, AJ, 159, 62
- Cuadrado et al. (2017) Cuadrado S., Goicoechea J. R., Cernicharo J., Fuente A., Pety J., Tercero B., 2017, A&A, 603, A124
- Cunningham et al. (2011) Cunningham A. J., Klein R. I., Krumholz M. R., McKee C. F., 2011, ApJ, 740, 107
- Currie et al. (1996) Currie D. G., et al., 1996, AJ, 112, 1115
- Cyganowski et al. (2008) Cyganowski C. J., et al., 2008, AJ, 136, 2391
- Cyganowski et al. (2009) Cyganowski C. J., Brogan C. L., Hunter T. R., Churchwell E., 2009, ApJ, 702, 1615
- Cyganowski et al. (2011) Cyganowski C. J., Brogan C. L., Hunter T. R., Churchwell E., Zhang Q., 2011, ApJ, 729, 124
- Dale (2015) Dale J. E., 2015, New Astron. Rev., 68, 1
- Dale et al. (2014) Dale J. E., Ngoumou J., Ercolano B., Bonnell I. A., 2014, MNRAS, 442, 694
- Dale et al. (2015) Dale J. E., Haworth T. J., Bressert E., 2015, MNRAS, 450, 1199
- Davis et al. (2007) Davis C. J., Kumar M. S. N., Sandell G., Froebrich D., Smith M. D., Currie M. J., 2007, MNRAS, 374, 29
- Davis et al. (2009) Davis C. J., et al., 2009, A&A, 496, 153
- Davis et al. (2010) Davis C. J., Gell R., Khanzadyan T., Smith M. D., Jenness T., 2010, A&A, 511, A24
- Deharveng et al. (2010) Deharveng L., et al., 2010, A&A, 523, A6
- Devine et al. (1997) Devine D., Bally J., Reipurth B., Heathcote S., 1997, AJ, 114, 2095
- Duchêne & Kraus (2013) Duchêne G., Kraus A., 2013, ARA&A, 51, 269
- Eislöffel (2000) Eislöffel J., 2000, A&A, 354, 236
- Eisner & Carpenter (2006) Eisner J. A., Carpenter J. M., 2006, ApJ, 641, 1162
- Eisner et al. (2008) Eisner J. A., Plambeck R. L., Carpenter J. M., Corder S. A., Qi C., Wilner D., 2008, ApJ, 683, 304
- Eisner et al. (2016) Eisner J. A., Bally J. M., Ginsburg A., Sheehan P. D., 2016, ApJ, 826, 16
- Eisner et al. (2018) Eisner J. A., et al., 2018, ApJ, 860, 77
- Ellerbroek et al. (2014) Ellerbroek L. E., et al., 2014, A&A, 563, A87
- Fazio et al. (2004) Fazio G. G., et al., 2004, ApJS, 154, 10
- Ferreira et al. (2006) Ferreira J., Dougados C., Cabrit S., 2006, A&A, 453, 785
- Froebrich & Makin (2016) Froebrich D., Makin S. V., 2016, MNRAS, 462, 1444
- Froebrich et al. (2011) Froebrich D., et al., 2011, MNRAS, 413, 480
- Froebrich et al. (2015) Froebrich D., et al., 2015, MNRAS, 454, 2586
- Giannini et al. (2011) Giannini T., Nisini B., Neufeld D., Yuan Y., Antoniucci S., Gusdorf A., 2011, ApJ, 738, 80
- Giannini et al. (2013) Giannini T., et al., 2013, ApJ, 778, 71
- Göppl & Preibisch (2022) Göppl C., Preibisch T., 2022, A&A, 660, A11
- Grudić et al. (2021) Grudić M. Y., Guszejnov D., Hopkins P. F., Offner S. S. R., Faucher-Giguère C.-A., 2021, MNRAS, 506, 2199
- Guszejnov et al. (2021) Guszejnov D., Grudić M. Y., Hopkins P. F., Offner S. S. R., Faucher-Giguère C.-A., 2021, MNRAS, 502, 3646
- Guszejnov et al. (2022) Guszejnov D., Grudić M. Y., Offner S. S. R., Faucher-Giguère C.-A., Hopkins P. F., Rosen A. L., 2022, arXiv e-prints, p. arXiv:2205.10413
- Gutermuth et al. (2008) Gutermuth R. A., et al., 2008, ApJ, 674, 336
- Haro (1952) Haro G., 1952, ApJ, 115, 572
- Haro (1953) Haro G., 1953, ApJ, 117, 73
- Hartigan & Morse (2007) Hartigan P., Morse J., 2007, ApJ, 660, 426
- Hartigan et al. (2001) Hartigan P., Morse J. A., Reipurth B., Heathcote S., Bally J., 2001, ApJ, 559, L157
- Hartigan et al. (2005) Hartigan P., Heathcote S., Morse J. A., Reipurth B., Bally J., 2005, AJ, 130, 2197
- Hartigan et al. (2011) Hartigan P., et al., 2011, ApJ, 736, 29
- Hartigan et al. (2015) Hartigan P., Reiter M., Smith N., Bally J., 2015, AJ, 149, 101
- Hartigan et al. (2019) Hartigan P., Holcomb R., Frank A., 2019, ApJ, 876, 147
- Haworth & Harries (2012) Haworth T. J., Harries T. J., 2012, MNRAS, 420, 562
- Haworth et al. (2021) Haworth T. J., Kim J. S., Winter A. J., Hines D. C., Clarke C. J., Sellek A. D., Ballabio G., Stapelfeldt K. R., 2021, MNRAS, 501, 3502
- Henney & Arthur (1998) Henney W. J., Arthur S. J., 1998, AJ, 116, 322
- Henney & O’Dell (1999) Henney W. J., O’Dell C. R., 1999, AJ, 118, 2350
- Herbig (1950) Herbig G. H., 1950, ApJ, 111, 11
- Herbig (1951) Herbig G. H., 1951, ApJ, 113, 697
- Hester et al. (1996) Hester J. J., et al., 1996, AJ, 111, 2349
- Ioannidis & Froebrich (2012a) Ioannidis G., Froebrich D., 2012a, MNRAS, 421, 3257
- Ioannidis & Froebrich (2012b) Ioannidis G., Froebrich D., 2012b, MNRAS, 425, 1380
- Johnstone et al. (1998) Johnstone D., Hollenbach D., Bally J., 1998, ApJ, 499, 758
- Joye & Mandel (2003) Joye W. A., Mandel E., 2003, in Payne H. E., Jedrzejewski R. I., Hook R. N., eds, Astronomical Society of the Pacific Conference Series Vol. 295, Astronomical Data Analysis Software and Systems XII. p. 489
- Kim et al. (2016) Kim J. S., Clarke C. J., Fang M., Facchini S., 2016, ApJ, 826, L15
- Kiminki et al. (2016) Kiminki M. M., Reiter M., Smith N., 2016, MNRAS, 463, 845
- Kong et al. (2019) Kong S., Arce H. G., Maureira M. J., Caselli P., Tan J. C., Fontani F., 2019, ApJ, 874, 104
- Kuhn et al. (2021) Kuhn M. A., de Souza R. S., Krone-Martins A., Castro-Ginard A., Ishida E. E. O., Povich M. S., Hillenbrand L. A., COIN Collaboration 2021, ApJS, 254, 33
- Lee et al. (2012) Lee H.-T., Takami M., Duan H.-Y., Karr J., Su Y.-N., Liu S.-Y., Froebrich D., Yeh C. C., 2012, ApJS, 200, 2
- Lee et al. (2013) Lee H.-T., et al., 2013, ApJS, 208, 23
- Lee et al. (2016) Lee K. I., et al., 2016, ApJ, 820, L2
- Lefloch & Lazareff (1994) Lefloch B., Lazareff B., 1994, A&A, 289, 559
- Lucas et al. (2020) Lucas W. E., Bonnell I. A., Dale J. E., 2020, MNRAS, 493, 4700
- Mackey & Lim (2011) Mackey J., Lim A. J., 2011, MNRAS, 412, 2079
- Maíz Apellániz et al. (2016) Maíz Apellániz J., et al., 2016, ApJS, 224, 4
- Makin & Froebrich (2018) Makin S. V., Froebrich D., 2018, ApJS, 234, 8
- Mann & Williams (2010) Mann R. K., Williams J. P., 2010, ApJ, 725, 430
- Mann et al. (2014) Mann R. K., et al., 2014, ApJ, 784, 82
- Maret et al. (2009) Maret S., et al., 2009, ApJ, 698, 1244
- Mesa-Delgado et al. (2016) Mesa-Delgado A., Zapata L., Henney W. J., Puzia T. H., Tsamis Y. G., 2016, ApJ, 825, L16
- Morse et al. (2001) Morse J. A., Kellogg J. R., Bally J., Davidson K., Balick B., Ebbets D., 2001, ApJ, 548, L207
- Murray et al. (2018) Murray D., Goyal S., Chang P., 2018, MNRAS, 475, 1023
- Nakamura & Li (2007) Nakamura F., Li Z.-Y., 2007, ApJ, 662, 395
- Nisini et al. (2010) Nisini B., Giannini T., Neufeld D. A., Yuan Y., Antoniucci S., Bergin E. A., Melnick G. J., 2010, ApJ, 724, 69
- Noll (1999) Noll K., 1999, Hubble Heritage Observations of NGC 1999, HST Proposal ID 8548. Cycle 8
- O’dell & Wen (1994a) O’dell C. R., Wen Z., 1994a, ApJ, 436, 194
- O’dell & Wen (1994b) O’dell C. R., Wen Z., 1994b, ApJ, 436, 194
- O’dell et al. (1993) O’dell C. R., Wen Z., Hu X., 1993, ApJ, 410, 696
- Offner & Arce (2014) Offner S. S. R., Arce H. G., 2014, ApJ, 784, 61
- Ohlendorf et al. (2012) Ohlendorf H., Preibisch T., Gaczkowski B., Ratzka T., Grellmann R., McLeod A. F., 2012, A&A, 540, A81
- Pontoppidan et al. (2022) Pontoppidan K., et al., 2022, arXiv e-prints, p. arXiv:2207.13067
- Preibisch et al. (2011) Preibisch T., et al., 2011, A&A, 530, A34
- Preibisch et al. (2014) Preibisch T., Mehlhorn M., Townsley L., Broos P., Ratzka T., 2014, A&A, 564, A120
- Qiao et al. (2022) Qiao L., Haworth T. J., Sellek A. D., Ali A. A., 2022, MNRAS,
- Raga et al. (1993) Raga A. C., Canto J., Biro S., 1993, MNRAS, 260, 163
- Raga et al. (2010) Raga A. C., Lora V., Smith N., 2010, Rev. Mex. Astron. Astrofis., 46, 179
- Rathjen et al. (2021) Rathjen T.-E., et al., 2021, MNRAS, 504, 1039
- Rebolledo et al. (2016) Rebolledo D., et al., 2016, MNRAS, 456, 2406
- Reipurth (1989) Reipurth B., 1989, Nature, 340, 42
- Reipurth (2000) Reipurth B., 2000, VizieR Online Data Catalog, p. V/104
- Reipurth et al. (1997) Reipurth B., Hartigan P., Heathcote S., Morse J. A., Bally J., 1997, AJ, 114, 757
- Reipurth et al. (2013) Reipurth B., Bally J., Aspin C., Connelley M. S., Geballe T. R., Kraus S., Appenzeller I., Burgasser A., 2013, AJ, 146, 118
- Reiter & Parker (2022) Reiter M., Parker R. J., 2022, arXiv e-prints, p. arXiv:2209.03889
- Reiter & Smith (2013) Reiter M., Smith N., 2013, MNRAS, 433, 2226
- Reiter & Smith (2014) Reiter M., Smith N., 2014, MNRAS, 445, 3939
- Reiter et al. (2015) Reiter M., Smith N., Kiminki M. M., Bally J., Anderson J., 2015, MNRAS, 448, 3429
- Reiter et al. (2016) Reiter M., Smith N., Bally J., 2016, MNRAS, 463, 4344
- Reiter et al. (2017) Reiter M., Kiminki M. M., Smith N., Bally J., 2017, MNRAS, 470, 4671
- Reiter et al. (2019) Reiter M., McLeod A. F., Klaassen P. D., Guzmán A. E., Dale J. E., Mottram J. C., Garay G., 2019, MNRAS, 490, 2056
- Reiter et al. (2020a) Reiter M., Guzmán A. E., Haworth T. J., Klaassen P. D., McLeod A. F., Garay G., Mottram J. C., 2020a, MNRAS, 496, 394
- Reiter et al. (2020b) Reiter M., Haworth T. J., Guzmán A. E., Klaassen P. D., McLeod A. F., Garay G., 2020b, MNRAS, 497, 3351
- Rieke et al. (2005) Rieke M. J., Kelly D., Horner S., 2005, in Heaney J. B., Burriesci L. G., eds, Society of Photo-Optical Instrumentation Engineers (SPIE) Conference Series Vol. 5904, Cryogenic Optical Systems and Instruments XI. pp 1–8, doi:10.1117/12.615554
- Rieke et al. (2015) Rieke G. H., et al., 2015, PASP, 127, 584
- Rigby et al. (2022) Rigby J., et al., 2022, arXiv e-prints, p. arXiv:2207.05632
- Rogers & Pittard (2013) Rogers H., Pittard J. M., 2013, MNRAS, 431, 1337
- Salas et al. (1998) Salas L., Cruz-González I., Porras A., 1998, ApJ, 500, 853
- Samal et al. (2018) Samal M. R., Chen W. P., Takami M., Jose J., Froebrich D., 2018, MNRAS, 477, 4577
- Shull et al. (2021) Shull J. M., Darling J., Danforth C. W., 2021, ApJ, 914, 18
- Smith (2006a) Smith N., 2006a, MNRAS, 367, 763
- Smith (2006b) Smith N., 2006b, ApJ, 644, 1151
- Smith & Brooks (2007) Smith N., Brooks K. J., 2007, MNRAS, 379, 1279
- Smith & Conti (2008) Smith N., Conti P. S., 2008, ApJ, 679, 1467
- Smith et al. (2000) Smith N., Egan M. P., Carey S., Price S. D., Morse J. A., Price P. A., 2000, ApJ, 532, L145
- Smith et al. (2004) Smith N., Bally J., Brooks K. J., 2004, AJ, 127, 2793
- Smith et al. (2010a) Smith N., Bally J., Walborn N. R., 2010a, MNRAS, 405, 1153
- Smith et al. (2010b) Smith N., et al., 2010b, MNRAS, 406, 952
- Smith et al. (2014) Smith M. D., Davis C. J., Rowles J. H., Knight M., 2014, MNRAS, 443, 2612
- Sota et al. (2014) Sota A., Maíz Apellániz J., Morrell N. I., Barbá R. H., Walborn N. R., Gamen R. C., Arias J. I., Alfaro E. J., 2014, ApJS, 211, 10
- Spitzer (1978) Spitzer L., 1978, Physical processes in the interstellar medium, doi:10.1002/9783527617722.
- Stanke et al. (1998) Stanke T., McCaughrean M. J., Zinnecker H., 1998, A&A, 332, 307
- Stanke et al. (1999) Stanke T., McCaughrean M. J., Zinnecker H., 1999, A&A, 350, L43
- Stanke et al. (2002) Stanke T., McCaughrean M. J., Zinnecker H., 2002, A&A, 392, 239
- Stanke et al. (2010) Stanke T., et al., 2010, A&A, 518, L94
- Stephens et al. (2017) Stephens I. W., et al., 2017, ApJ, 846, 16
- Sugitani et al. (1991) Sugitani K., Fukui Y., Ogura K., 1991, ApJS, 77, 59
- Tapia et al. (2011) Tapia M., Roth M., Bohigas J., Persi P., 2011, MNRAS, 416, 2163
- Terquem et al. (1999) Terquem C., Eislöffel J., Papaloizou J. C. B., Nelson R. P., 1999, ApJ, 512, L131
- Thompson et al. (2004) Thompson M. A., White G. J., Morgan L. K., Miao J., Fridlund C. V. M., Huldtgren-White M., 2004, A&A, 414, 1017
- Thompson et al. (2012) Thompson M. A., Urquhart J. S., Moore T. J. T., Morgan L. K., 2012, MNRAS, 421, 408
- Urquhart et al. (2007) Urquhart J. S., Thompson M. A., Morgan L. K., Pestalozzi M. R., White G. J., Muna D. N., 2007, A&A, 467, 1125
- Urquhart et al. (2009) Urquhart J. S., Morgan L. K., Thompson M. A., 2009, A&A, 497, 789
- Walch et al. (2012) Walch S. K., Whitworth A. P., Bisbas T., Wünsch R., Hubber D., 2012, MNRAS, 427, 625
- Weaver et al. (1977) Weaver R., McCray R., Castor J., Shapiro P., Moore R., 1977, ApJ, 218, 377
- Wenger et al. (2000) Wenger M., et al., 2000, A&AS, 143, 9
- Werner et al. (2004) Werner M. W., et al., 2004, ApJS, 154, 1
- Winter & Haworth (2022) Winter A. J., Haworth T. J., 2022, arXiv e-prints, p. arXiv:2206.11910
- Wright et al. (2015) Wright G. S., et al., 2015, PASP, 127, 595
- Ybarra & Lada (2009) Ybarra J. E., Lada E. A., 2009, ApJ, 695, L120
- Yu et al. (1997) Yu K. C., Bally J., Devine D., 1997, ApJ, 485, L45
- Yu et al. (1999) Yu K. C., Billawala Y., Bally J., 1999, AJ, 118, 2940
- Zhang et al. (2015) Zhang M., Fang M., Wang H., Sun J., Wang M., Jiang Z., Anathipindika S., 2015, ApJS, 219, 21
- Zinnecker et al. (1998) Zinnecker H., McCaughrean M. J., Rayner J. T., 1998, Nature, 394, 862
Appendix A Candidate galaxies
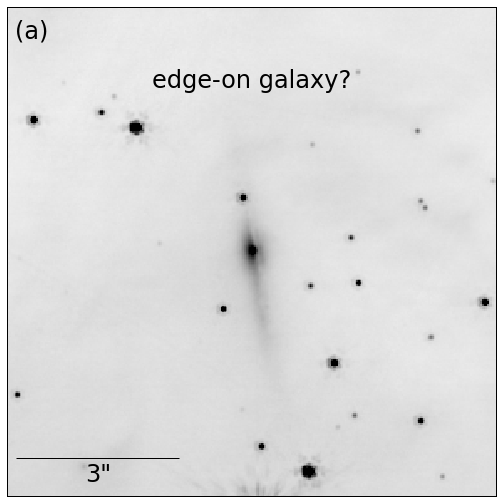
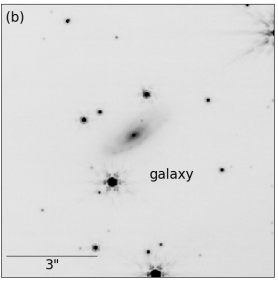
We identify four candidate background galaxies in the JWST ERO data on NGC 3324. Candidates are shown in Figure 25.
An elongated object with coordinates R.A.=10:36:53.7 and Dec=58:35:47 is visible in multiple filters (F187N, F200W, F335M, F444W, F470N, F1280W, and F1800W). The morphology is reminiscent of an edge-on spiral galaxy (see Figure 25a) but the elongated emission is asymmetrical suggesting an off-center bulge. Structure in the F200W image hints at a dust lane bisecting the disk-like emission but this feature is not seen at any other wavelength. The nearest object in the Simbad database (Wenger et al., 2000) is away from the coordinates of this object.
A second object at R.A.=10:36:59.5 and Dec=58:39:01 looks like a spectacular example of a spiral galaxy (see Figure 25b). The closest Simbad object is located away from these coordinates.
A third candidate galaxy is seen at R.A.=10:37:07.2 and Dec=58:35:36 (see Figure 25c). At first glance, the object looks like a bright point source in the middle of a diffraction spike from a nearby bright star. However a disk-like structure can be seen in a F200W–F090W image (the source is not visible in the F090W filter so we use this to suppress the diffraction spike). Like the other candidate galaxies, the nearest Simbad source is offset nearly 20″ from the position of this object.
A candidate elliptical galaxy at R.A.=10:36:55.2 and Dec=58:38:09 is noted in Figure 18 and shown in Figure 25d. The source is round and appears resolved compared to the somewhat fainter star projected next to it in the JWST NIRCam F187N image, but is not visible in the HST F658N image. The object is 0.29″ from an RR Lyrae candidate Gaia DR3 5350681737823554176 which is likely the neighboring point source.