Towards realistic simulations of human cough:
effect of droplet emission duration and spread angle
Abstract
Human respiratory events, such as coughing and sneezing, play an important role in the host-to-host airborne transmission of diseases. Thus, there has been a substantial effort in understanding these processes: various analytical or numerical models have been developed to describe them, but their validity has not been fully assessed due to the difficulty of a direct comparison with real human exhalations. In this study, we report a unique comparison between datasets that have both detailed measurements of a real human cough using spirometer and particle tracking velocimetry, and direct numerical simulation at similar conditions. By examining the experimental data, we find that the injection velocity at the mouth is not uni-directional. Instead, the droplets are injected into various directions, with their trajectories forming a cone shape in space. Furthermore, we find that the period of droplet emissions is much shorter than that of the cough: experimental results indicate that the droplets with an initial diameter m are emitted within the first 0.05 s, whereas the cough duration is closer to 1 s. These two features (the spread in the direction of injection velocity and the short duration of droplet emission) are incorporated into our direct numerical simulation, leading to an improved agreement with the experimental measurements. Thus, to have accurate representations of human expulsions in respiratory models, it is imperative to include parametrisation of these two features.
keywords:
COVID-19, pathogen transmission, respiratory dropletsMSC:
[2010] 76T10 , 76F651 Introduction
Since the outbreaks of SARS-CoV in 2003 and SARS-CoV-2 in 2019, the role played by the turbulent multiphase flow in the transmission of infectious diseases via the airborne route has received increasing attention. The host-to-host transmission of respiratory disease is a complicated process with multiple stages including the exhalation, dispersion and inhalation of the pathogen [Bourouiba, 2020, Zhou and Zou, 2021, Bourouiba, 2021, Chong et al., 2021, Smith et al., 2020].In particular, a central piece to the puzzle is the dispersion of pathogen-carrying droplets in turbulent flows.
A classic approach to mathematically predict the transmission of an infectious disease among populations is the compartmental models [Tolles and Luong, 2020]. Developed in 1927, the most basic compartmental model is an SIR model [Kermack and McKendrick, 1927], where the population is separated into three so-called compartments, namely ‘Susceptible’, ‘Infected’ and ‘Removed’. Individuals can transfer between compartments based on ordinary differential equations while the total population remains constant. The infection rate of susceptible individuals can be improved with more physical insight via dose-response models [Brouwer et al., 2017], or the Wells–Riley model in particular for diseases transmitted via the airborne route [Noakes et al., 2006]. The application of these two groups of models and a detailed comparison are presented in the review paper by Sze To and Chao [2010]. In essence, the Wells–Riley model centers on the concept of ‘quantum’, which is the dose required to start an infection, while the dose-response model uses the amount of pathogen taken in by the susceptible individual. In both approaches, the complicated transmission process that involves a series of stages (exhalation, dispersion, ventilation, inhalation, etc) is parametrised based on some physical assumptions or empirical observations [Lelieveld et al., 2020, Bazant and Bush, 2021, Jones et al., 2021, Nordsiek et al., 2021]. As a typical example, the room where the infectious disease is spread from is assumed to be ‘well-mixed’, i.e. the pathogen distributes uniformly in the room. More recently, some efforts have been made to incorporate the temporal and spatial inhomogeneity in the model [Mittal et al., 2020a, Yang et al., 2020]. A sophisticated software tool has been developed to estimate the infection risk under a number of scenarios, including various modes of ventilation and different levels of activities [Mikszewski et al., 2020]. These models are relatively easy to use and hence highly appealing when developing social guidelines based on the risk of transmission at a wide range of real-life scenarios. However, the derivation of these models, especially the selection of the parameters hinges on the detailed understanding of the governing physics in each step of the transmission.
Alongside the effort in the epidemiology community, there has also been an ongoing endeavour in understanding and modelling the flow physics in the transmission of respiratory diseases. In the pioneering work of Wells [1934], the lifespan of a droplet is illustrated through a simple ‘evaporation-falling curve’, where the fate of a small droplet is considered to be full evaporation, while that of a large droplet is ground deposition. This simplistic model was then improved by Xie et al. [2007], where the salinity of the droplet, the ambient temperature and relative humidity conditions and the buoyant respiratory jet were taken into consideration. The effect of ambient conditions on the droplet evaporation is then incorporated into one parameter, the effective evaporation diffusivity proposed by Balachandar et al. [2020]. The coupling between the carrying fluid and the disperse phase is further incorporated into the puff model by Bourouiba et al. [2014], and a good agreement with the laboratory measurement of a multiphase puff is observed, but a direct comparison with clinical data, such as the speed and the trajectory of the puff is still lacking.
There is now a consensus that the flow physics in the transmission of respiratory diseases involve a multiphase flow [Bourouiba, 2020]. Indeed, various human respiratory events, such as breathing, speaking, coughing and sneezing, can be simplified as transient turbulent jets with liquid droplets as the second phase [Balachandar et al., 2020, Mittal et al., 2020b, Bourouiba et al., 2014, Bourouiba, 2020, Ng et al., 2021, Chong et al., 2021, Abkarian et al., 2020, Stadnytskyi et al., 2020]. The flow field associated with a single respiratory event have been investigated through both experiments with human subjects [VanSciver et al., 2011, Bahl et al., 2020] and laboratory or numerical simulations [Bourouiba et al., 2014, Wei and Li, 2017, Chang et al., 2020, Abkarian et al., 2020, Ng et al., 2021, Chong et al., 2021, Fabregat et al., 2021]. The general picture of a cough or sneeze is that the droplet-laden, warm and moist air is injected at a high speed over a short duration ( s), which propagates under the effect of both the initial momentum and buoyancy [Bourouiba et al., 2014, Ng et al., 2021], while in continuous events such as speaking, a ‘puff train’ assimilates to a turbulent jet like structure in the far field [Abkarian et al., 2020]. The fate of the droplets varies largely depending on their size [Ng et al., 2021]: large droplets with a diameter deposit on the ground in a near ballistic motion, while small droplets with a diameter are trapped in the humid puff and have prolonged lifetimes compared to the prediction of Wells [1934]. Condensation is observed at low ambient temperature and high relative humidity settings [Chong et al., 2021]. Similar to the need for judicious assessment of the accuracy of theoretical models with clinical data, a direct comparison of numerical simulations with real respiratory events is imperative to test and elevate the accuracy of these models.
Accordingly, in this study, we report a unique pair of datasets of human coughs with both experimental and numerical components with similar conditions. The numerical dataset is obtained using direct numerical simulations (DNS) based on the methods employed by Chong et al. [2021] and Ng et al. [2021], and the experimental component is the extension of the method used by Bahl et al. [2020] to coughs. We reveal that both the droplet emission duration and the initial spread angle have strong influence on the far-field behaviour of the flow field. These two refinements to the flow inlet conditions are validated through the experimental data collected from a human subject in §2. Two numerical simulation cases are formulated based on these refined conditions in §3, and their detailed effect on the simulated flow is discussed in §4.
2 Experimental observations
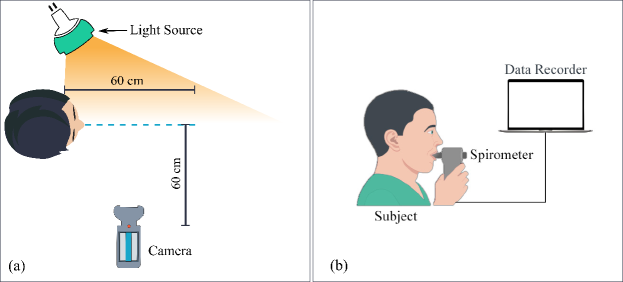
To capture the flow dynamics of both the airflow and the droplets expelled during a cough from human exhalations, we utilise two sets of experiments. Namely, a spirometer is employed in the subject’s mouth to capture the volumetric flow rate expelled during a cough (Fig. 1(b)), and Particle Tracking Velocimetry (PTV) experiments quantify the motion of the expelled droplets. For the latter, a volume illumination configuration is employed using a high powered pulsed LED light source (GsVitec L5), positioned at approximately from the image plane, to capture high-speed imaging data of the scattered light from the droplets expelled during a cough. The high-speed camera was placed m away from the image plane and was equipped with a mm lens with an f-stop of F4 to capture a field-of-view of approximately m2. This arrangement provided a resolution of 312.5 m/pixel and a depth of field of 40 mm. Respiratory droplets expelled by the subject were used as tracer particles, and no additional seeding was introduced. The basic setup is depicted in Fig. 1(a). We note that all the experiments were performed at an ambient temperature of 22 ∘C.
To perform precise particle tracking, the high-speed image sequences are first pre-processed to minimise background/sensor noise and isolate head movement. After that, PTV was performed on the image sequence using Lavision® Davis 8.4. Here an initial Particle Image Velocimetry (PIV) pass on the image sequence was employed to obtain a velocity field estimate and then individual droplets were tracked using PTV algorithm [Cowen and Monismith, 1997]. Further details on the experimental setup and processing can be found in Bahl et al. [2020].
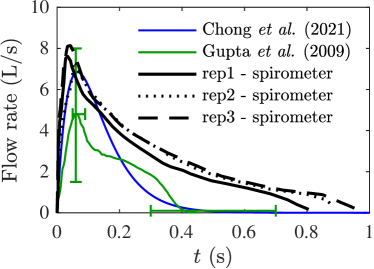
In order to draw a direct comparison of the flow rates in our experiments, Fig. 2 shows the flow rate of coughs measured by the spirometer compared to the representative profile obtained using the same method in the experiments of Gupta et al. [2009], and the inlet velocity condition assumed in our previous work [Chong et al., 2021]. Although the flow rate of the experiments peaks within a shorter time after the start of the cough, the overall duration and intensity of the coughs are very comparable with previous works, i.e. the cough duration is s. Three repeating measurements are conducted on the same subject, and an average of these measurements is used as the injection flow rate in the simulation to be detailed in §3.
Fig. 3 shows the droplet trajectories of a single cough produced by the same subject and captured by PTV for a duration of approximately 0.4 s. Note that as limited by the intrusive nature of the spirometer measurement, the trajectories presented here are not obtained simultaneously with the flow rate date shown in Fig. 2. However, the close agreement between the three repeating spirometer curves in Fig. 2 indicates that measurements performed at different times by the two methods can still be reliably compared. The droplets are emitted into various directions, and the ballistic trajectories form a cone shape in the space with an apex angle around , as delineated by the red dashed lines. Such spreading phenomena can also be observed in the droplet trajectories captured by Bourouiba et al. [2014] and the inline holography in Shao et al. [2021]. In the atomisation process of a high-speed gas jet shearing a liquid film, which is considered as a major mechanism of droplet generation in respiratory tracts [Johnson and Morawska, 2009], there is also experimental evidence that droplets are ejected at an angle of relative to the jet flow direction [Descamps et al., 2008]. Note that the spreading angle of the initial velocity field discussed here is a near field quantity ( where is the mouth diameter), which is different from the far field () spreading angle of the respiratory jet typically reported to be with respect to the centre-line [Gupta et al., 2009, Abkarian et al., 2020, Dudalski et al., 2020].


By visually inspecting the raw PTV images, the droplet emission rate is found to be the highest at the beginning of a cough, then it quickly diminishes long before the flow injection velocity at the mouth reaches zero [de Silva et al., 2021]. In other words, the droplet emission is concentrated at the onset of the cough for a much shorter duration than that of the flow injection. To provide further quantitative evidence regarding this observation, we utilise the numerical dataset in Chong et al. [2021], and compare the number of droplets in a region close to the mouth (as marked by the blue shaded box in Fig. 3) before and after removing all droplets emitted after s. We choose to focus on this region mostly due to the consideration that here the droplet number is predominantly dependent on the emission and streamwise transportation, with negligible contribution from other factors such as evaporation, deposition or droplets leaving the measurement volume. Fig. 4 shows the number of droplets within from the mouth in the streamwise direction in each frame, where is the mouth diameter. Each curve is normalised by the magnitude of the first peak emerging around s, thus eliminating the effect of the total number of droplets on the comparison between cases. In the PTV dataset, the number of droplets captured in a frame reaches its maximum between 0.02 s and 0.04 s, before it approaches 0 at 0.15 s after the start of the cough, when the injecting flow rate is still more than 60% of its peak value (see Fig. 2). The DNS case of Chong et al. [2021] shows a similar trend as in the PTV data between 0 and 0.1 s, but instead of reducing to 0, the droplet number then quickly increases and the value almost triples at 0.4 s, indicating a very dense droplet population close to the mouth. In the DNS data of Chong et al. [2021], droplets were emitted at a constant rate over a duration of 1 s. At the later stage of the cough when the injection velocity was low, the droplets still entered the flow field at a constant rate, leading to the accumulation of droplets close to the mouth. After removing all the droplets emitted after s (black curve in Fig. 4), better agreement with the PTV result is observed.
Note that the PTV method in this study can confidently detect droplets with m although smaller droplets are also likely to be detected. Therefore, the emission cutoff time discussed above is only strictly applicable to droplets in this size range, and it is likely that smaller aerosol particles formed deep in the lung [Johnson and Morawska, 2009] are emitted throughout the entire cough when the air flow is present.
To summarise, two major features of a real human cough can be concluded from the experiments: first, the initial velocities of droplets are not uni-directional. Instead, droplets with a relatively high momentum spread into various directions after exiting the mouth, as evidenced by their trajectories which form a cone shape with an apex around . Second, the majority of droplets with m are emitted between 0-0.05 s, which is less than 10% of the duration of a cough based on a nonzero injection flow rate. Incorporating these features in numerical simulations are therefore mandatory in order to achieve a better representation of realistic human respiratory events.
3 Numerical investigations
In this section, we provide details of the numerical cases designed to study the effect of the spread angle and droplet emission cutoff time.
We consider an incompressible fluid of gas phase, with both temperature and vapour concentrations coupled to the velocity field by employing the Boussinesq approximation. The gas phase is solved using DNS by a staggered second-order accurate finite difference scheme and marched in time using a fractional-step third-order Runge–Kutta approach [Verzicco and Orlandi, 1996, van der Poel et al., 2015]. Buoyancy effect of the puff as a result of the temperature and vapour mass fraction difference between the exhalation and the ambient environment is considered in the simulation. For droplets, we apply the spherical point-particle model, and consider the conservation of momentum (Maxey-Riley equation), energy, and mass. During the evaporation of droplets, the temperature and vapour mass fraction of the surrounding air are modified, which leads to a change in the density of the local gas phase. The momentum equation of the gas phase is not affected by the presence of droplets except through the modification of density. We use the measurement of Xie et al. [2009] for the initial droplet size distribution. For the domain size and other details on the implementation, we refer readers to Chong et al. [2021] and Ng et al. [2021].
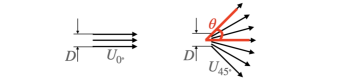
The spread angle, , is defined as half of the cone apex angle. Therefore the apex angle observed in Fig. 3 is equivalent to . Two configurations are simulated in the present numerical study, with and , respectively. Schematics of the inlet conditions can be found in Fig. 5. The initial velocity vectors at the inlet cross section have the same magnitude within each case, and they spread radially in the case. The velocity distribution is then smoothed with an axis-symmetric Gaussian function.
The mouth shape in both cases is assumed to be a circle with diameter mm, which remains constant in time. By integrating the streamwise velocity across the mouth area, the flow rate of the exhalation can then be expressed as
| (1a) | |||
| and | |||
| (1b) | |||
where is the air density, is the Gaussian function and is the variable of integration with at the centre-line of the mouth. is the angle between the injection velocity vector and the horizontal axis in the case, which can be related to as
| (2) |
The injected flow rate and forward momentum govern the propagation of the respiratory jet. For a given flow rate, the injection velocity magnitudes, and , can then be determined using (1b). Here we assume that both cases have the same flow rate profile as the spirometer result in the present study (see Fig. 2). The resulting centreline velocity of the case is approximately 16% higher compared to the case. The injected forward momentum of the former is then 7% higher than the latter.

A total number of 5000 droplets with the initial size distribution following Xie et al. [2009] are introduced to the simulation domain at a constant rate over 0.4 s. The total number of droplets is also chosen based on the same study. Since the droplet distribution in the flow field is relatively sparse, the droplet-to-droplet interaction is negligible. For the same reason the modification to evaporation rates due to droplet clustering is also insignificant. Therefore, it is possible to remove droplets emitted after a certain time in post processing to study the effect of the droplet emission cutoff time.
4 Results and discussion
The spatial distribution of the droplets in the DNS cases at a range of time instances from 0.01 s to 0.2 s are shown in Fig. 6. Overall, the spread angle case qualitatively agrees with the experimental results: droplets form a ‘cloud’ after entering the flow field, instead of concentrating along the centre-line as in the case. Both the experiment and the case have a large population of droplets above the centre-line of the mouth ( m), which is absent in the case. Furthermore, the droplet density near the mouth is much lower in Fig. 6(d) compared to earlier time instances, and such a decrease is also observed in the simulation in Fig. 6(l) after excluding all the grey dots, which are droplets emitted after 0.05 s. This observation confirms our previous hypothesis that the rate of droplet emission during a cough varies with time, and large droplets are released only at the early stage of the cough. In the literature, the common practice is to assume that the droplets are uniformly distributed in the discharging fluid [Bourouiba et al., 2014, Wei and Li, 2017] or emitted at a constant rate over the entire duration of the cough [Chong et al., 2021, Ng et al., 2021, Fabregat et al., 2021]. Incorporating the short droplet emission time in the model can significantly improve the agreement between the simulation and the experiment.
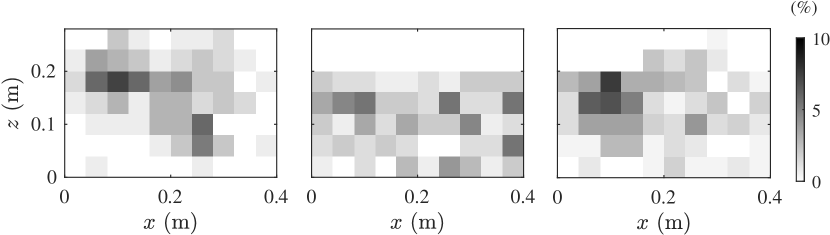
The contribution of the spread angle is further analysed in Fig. 7, a 2D histogram of the droplet spatial distribution at s for the experiment and the and DNS cases. The short droplet emission time is taken into account, thus only droplets emitted before s are included when computing the histogram. The histogram peaks at m and m in the experiment (Fig. 7a), with droplets scattered both above and below . These major features are successfully replicated in the case (Fig. 7c). In the case (Fig. 7b), however, very few droplets can be found above the mouth location . The build-up of droplets near the mouth is absent, and the droplet distribution is almost uniform in the streamwise direction.

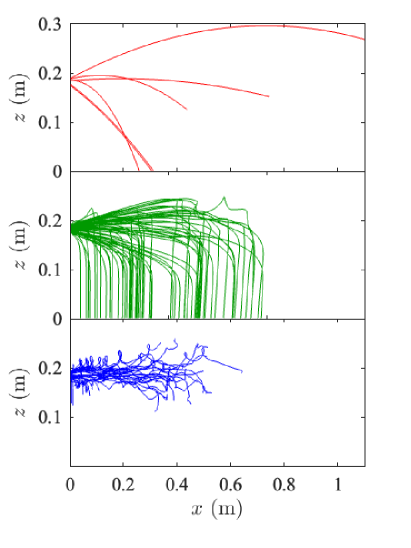
Droplet trajectories of cases and are compared side-by-side in Fig. 8. As expected, droplets with an initial diameter m exhibit predominately ballistic behaviour, and a non-zero spread angle introduces a larger scatter in their trajectories. For the medium-sized droplets, the streamwise deceleration is complete before they reach the floor. Comparing Fig. 8(c) and (d), one would notice that droplets in the case settle closer to the mouth. Instead of carried downstream by the jet with a similar velocity, droplets emitted with a large spread angle penetrate deeper sideways into the still ambient fluid, so they experience larger relative velocity (therefore higher aerodynamic drag and stronger deceleration) compared to the case. The reduction in the settling distance is not limited to droplets emitted with a high wall-normal velocity component: it is also seen in those with small or zero wall-normal component, as a result of the lower streamwise velocity in the widened jet.
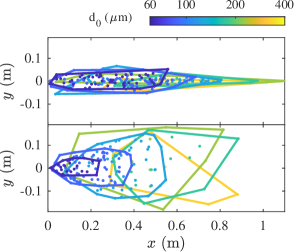
The settling behaviour of droplets is further explored by examining the distribution of deposition locations in the ground plane of in Fig. 9. The location where a droplet reaches the ground is represented by a dot in the plane, with the colour determined by its initial diameter . The contaminated region on the ground for each size class is shown by the convex hull. Although the mouth is at m in the simulation domain, for smaller droplets (m), the streamwise velocity has already decreased to 0 before reaching the plane. Therefore, the deposition pattern reported in Fig. 9 would still be applicable when the mouth is at m above the ground, which is the case of a standing person.
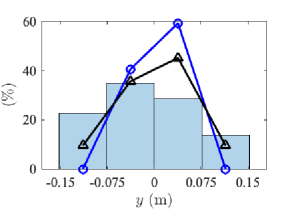
Comparing Fig. 9(a) and (b), it is apparent that the deposition location scatters over a wider range in the spanwise direction for , while it is mostly concentrated along the centre-line in the case. This is a progress towards a more realistic cough, as evidenced by the improved agreement with the data of human subjects [Xie et al., 2009] (Fig. 10). In Fig. 9(b), the spanwise width of the convex hull increases with increasing , presumably because larger droplets have a higher initial momentum and they can continue for a longer distance along the direction of their initial velocity. The streamwise extent of the convex hull is shorter in the case compared to the case, indicating that droplets (especially those with m) have a strong tendency to deposit closer to the mouth.
We note that the initial size distribution of droplets exhaled during respiratory events is presently actively investigated. The simulation results can be affected by the size distribution: for instance, if we use the distribution of Duguid [1946], which has more small ( m) droplets, a higher number of trajectories can be expected in Fig. 8(e-f). However, here our focus is on capturing the dominant effects of an actual cough.
The scalar fields of relative humidity () are shown in Fig. 11. At s, despite the higher injected streamwise momentum, the case has a shorter and wider turbulent jet compared to the case. The flow also appears more turbulent close to the mouth ( m) in the former. The cone angle of the jet, which can be determined from , where is the jet radius at the streamwise location , is very different from the spread angle . Comparing the white reference lines in the figure with the scalar field of the jet, it is shown that the jet cone angle is approximately in the case, while it is only slightly smaller in the case. Therefore, a change in the spread angle only results in a less than change in the cone angle .
At s (Fig. 11c and d), a vortex ring separated from the main jet is observed in both cases. These vortices are formed at the front of the jet, which can be seen attached to the jet at . As the injection velocity decreases and the jet front decelerates, the self-induced velocity of the vortex ring eventually exceeds the velocity of the jet front, then the vortex ring detaches from the jet. Such vortex rings have also been observed in the large-eddy simulation results by Liu et al. [2021], and their formation, strength and velocity are shown to be very sensitive to the initial conditions of the simulation.
5 Conclusions and outlook
In this study, we present a unique comparison of both experimental and numerical datasets on a human cough with matched conditions. Specifically, we implemented two important features of the human cough with insight gained from the comparison with the experimental data: the injection of the coughing flow which is shown to be better described with a spread angle of , and the emission of large droplets only occurs for a short period of time ( s) at the beginning of a cough, whose length is much longer ( s). The contribution of these features to the simulation result is examined by comparing two DNS cases with the conventional and with the modified inlet conditions based on the aforementioned experimental observations from a human cough. Overall, a significant improvement in the agreement with the experimental data is observed after implementing the modifications. We further demonstrate that by considering the initial spread angle, the simulated jet appears thicker and shorter. Droplets deposit on the ground closer to the mouth in the streamwise direction, but scatter over a wider range in the spanwise direction, which is consistent with the experimental observations. The aim of future work must be to extend the present comparative approach between experiments and numerical simulations to other respiratory events such as singing and in particular speaking, which accumulatively plays an even more important role in the aerosol release [Abkarian et al., 2020, Yang et al., 2020].
Acknowledgements
This work was funded by the Netherlands Organisation for Health Research and Development (ZonMW), project number 10430012010022: “Measuring, understanding & reducing respiratory droplet spreading”, the ERC Advanced Grant DDD, Number 740479, Foundation for Fundamental Research on Matter with Project No. 16DDS001, which is financially supported by the Netherlands Organisation for Scientific Research (NWO). C de Silva acknowledges ARC LIEF funding Grant, Number LE200100042, which supported the experimental work. The use of the national computer facilities in this research was subsidized by NWO Domain Science. We also acknowledge PRACE for awarding us access to MareNostrum in Spain at the Barcelona Computing Center (BSC) under the project 2020235589 and Irene at Très Grand Centre de calcul du CEA (TGCC) under PRACE project 2019215098. KL Chong is also supported by Shanghai Science and Technology Program under the project no. 19JC1412802.
Data availability
As part of the ZonMW funding agreement, data of the DNS cases are available as open access, which can be accessed via the link https://doi.org/10.4121/17099468. Larger files such as the scalar fields will be available upon request. The experimental data cannot be directly shared due to ethics limitations.
References
- Abkarian et al. [2020] Abkarian, M., Mendez, S., Xue, N., Yang, F., Stone, H.A., 2020. Speech can produce jet-like transport relevant to asymptomatic spreading of virus. Proc. Natl. Acad. Sci. U.S.A. 117, 25237–25245.
- Bahl et al. [2020] Bahl, P., de Silva, C.M., Chughtai, A.A., MacIntyre, C.R., Doolan, C., 2020. An experimental framework to capture the flow dynamics of droplets expelled by a sneeze. Exp. Fluids 61, 1–9.
- Balachandar et al. [2020] Balachandar, S., Zaleski, S., Soldati, A., Ahmadi, G., Bourouiba, L., 2020. Host-to-host airborne transmission as a multiphase flow problem for science-based social distance guidelines. Int. J. Multiph. Flow 132.
- Bazant and Bush [2021] Bazant, M.Z., Bush, J.W.M., 2021. A guideline to limit indoor airborne transmission of COVID-19. Proc. Natl. Acad. Sci. U.S.A. 118.
- Bourouiba [2020] Bourouiba, L., 2020. Turbulent gas clouds and respiratory pathogen emissions: potential implications for reducing transmission of COVID-19. J. Am. Med. Assoc. 323, 1837–1838.
- Bourouiba [2021] Bourouiba, L., 2021. The fluid dynamics of disease transmission. Annu. Rev. Fluid Mech. 53, 473–508.
- Bourouiba et al. [2014] Bourouiba, L., Dehandschoewercker, E., Bush, J.W.M., 2014. Violent expiratory events: on coughing and sneezing. J. Fluid Mech. 745, 537–563.
- Brouwer et al. [2017] Brouwer, A.F., Weir, M.H., Eisenberg, M.C., Meza, R., Eisenberg, J.N.S., 2017. Dose-response relationships for environmentally mediated infectious disease transmission models. PLoS Comput. Biol. 13, e1005481.
- Chang et al. [2020] Chang, B., Sharma, R.S., Huynh, T., Kudrolli, A., 2020. Aerial mucosalivary droplet dispersal distributions with implications for disease mitigation. Phys. Rev. Res. 2, 043391.
- Chong et al. [2021] Chong, K.L., Ng, C.S., Hori, N., Yang, R., Verzicco, R., Lohse, D., 2021. Extended lifetime of respiratory droplets in a turbulent vapor puff and its implications on airborne disease transmission. Phys. Rev. Lett. 126, 034502.
- Cowen and Monismith [1997] Cowen, E.A., Monismith, S.G., 1997. A hybrid digital particle tracking velocimetry technique. Exp. Fluids 22, 199–211.
- Descamps et al. [2008] Descamps, M., Matas, J.P., Cartellier, A.H., 2008. Gas-liquid atomisation: gas phase characteristics by PIV measurements and spatial evolution of the spray, in: 2nd colloque INCA, Initiative en Combustion Avancée, p. 1.
- Dudalski et al. [2020] Dudalski, N., Mohamed, A., Mubareka, S., Bi, R., Zhang, C., Savory, E., 2020. Experimental investigation of far-field human cough airflows from healthy and influenza-infected subjects. Indoor Air 30, 966–977.
- Duguid [1946] Duguid, J.P., 1946. The size and the duration of air-carriage of respiratory droplets and droplet-nuclei. Epidemiol. Infect. 44, 471–479.
- Fabregat et al. [2021] Fabregat, A., Gisbert, F., Vernet, A., Ferré, J.A., Mittal, K., Dutta, S., Pallarès, J., 2021. Direct numerical simulation of turbulent dispersion of evaporative aerosol clouds produced by an intense expiratory event. Phys. Fluids 33, 033329.
- Gupta et al. [2009] Gupta, J.K., Lin, C.H., Chen, Q., 2009. Flow dynamics and characterization of a cough. Indoor Air 19, 517–525.
- Johnson and Morawska [2009] Johnson, G., Morawska, L., 2009. The mechanism of breath aerosol formation. J. Aerosol Med. Pulm. Drug Deliv. 22, 229–237.
- Jones et al. [2021] Jones, B., Sharpe, P., Iddon, C., Hathway, E.A., Noakes, C.J., Fitzgerald, S., 2021. Modelling uncertainty in the relative risk of exposure to the SARS-CoV-2 virus by airborne aerosol transmission in well mixed indoor air. Build. Environ. 191, 107617.
- Kermack and McKendrick [1927] Kermack, W.O., McKendrick, A.G., 1927. A contribution to the mathematical theory of epidemics. Proc. R. Soc. A 115, 700–721.
- Lelieveld et al. [2020] Lelieveld, J., Helleis, F., Borrmann, S., Cheng, Y., Drewnick, F., Haug, G., Klimach, T., Sciare, J., Su, H., Pöschl, U., 2020. Model calculations of aerosol transmission and infection risk of COVID-19 in indoor environments. Int. J. Environ. Res. Public Health 17, 8114.
- Liu et al. [2021] Liu, K., Allahyari, M., Salinas, J.S., Zgheib, N., Balachandar, S., 2021. Peering inside a cough or sneeze to explain enhanced airborne transmission under dry weather. Sci. Rep. 11, 1–9.
- Mikszewski et al. [2020] Mikszewski, A., Buonanno, G., Stabile, L., Pacitto, A., Morawska, L., 2020. Airborne infection risk calculator. https://www.cunybpl.org/resources/airborne-infection-risk-calculator/ (last accessed on 10-06-2021).
- Mittal et al. [2020a] Mittal, R., Meneveau, C., Wu, W., 2020a. A mathematical framework for estimating risk of airborne transmission of COVID-19 with application to face mask use and social distancing. Phys. Fluids 32, 101903.
- Mittal et al. [2020b] Mittal, R., Ni, R., Seo, J.H., 2020b. The flow physics of COVID-19. J. Fluid Mech. 894, F2.
- Ng et al. [2021] Ng, C.S., Chong, K.L., Yang, R., Li, M., Verzicco, R., Lohse, D., 2021. Growth of respiratory droplets in cold and humid air. Phys. Rev. Fluids 6, 054303.
- Noakes et al. [2006] Noakes, C.J., Beggs, C.B., Sleigh, P.A., Kerr, K.G., 2006. Modelling the transmission of airborne infections in enclosed spaces. Epidemiol. Infect. 134, 1082–1091.
- Nordsiek et al. [2021] Nordsiek, F., Bodenschatz, E., Bagheri, G., 2021. Risk assessment for airborne disease transmission by poly-pathogen aerosols. PLoS One 16, e0248004.
- van der Poel et al. [2015] van der Poel, E.P., Ostilla-Mónico, R., Donners, J., Verzicco, R., 2015. A pencil distributed finite difference code for strongly turbulent wall-bounded flows. Comput. Fluids 116, 10–16.
- Shao et al. [2021] Shao, S., Zhou, D., He, R., Li, J., Zou, S., Mallery, K., Kumar, S., Yang, S., Hong, J., 2021. Risk assessment of airborne transmission of covid-19 by asymptomatic individuals under different practical settings. J. Aerosol Sci. 151, 105661.
- de Silva et al. [2021] de Silva, C.M., Bahl, P., Doolan, C., Raina MacIntyre, C., 2021. Bespoke flow experiments to capture the dynamics of coughs and sneezes. Measurement Science and Technology 32, 125302. doi:10.1088/1361-6501/ac2010.
- Smith et al. [2020] Smith, S.H., Somsen, G.A., Van Rijn, C., Kooij, S., Van Der Hoek, L., Bem, R.A., Bonn, D., 2020. Aerosol persistence in relation to possible transmission of SARS-CoV-2. Phys. Fluids 32, 107108.
- Stadnytskyi et al. [2020] Stadnytskyi, V., Bax, C.E., Bax, A., Anfinrud, P., 2020. The airborne lifetime of small speech droplets and their potential importance in SARS-CoV-2 transmission. Proc. Natl. Acad. Sci. U.S.A. 117, 11875–11877.
- Sze To and Chao [2010] Sze To, G.N., Chao, C.Y.H., 2010. Review and comparison between the Wells–Riley and dose-response approaches to risk assessment of infectious respiratory diseases. Indoor Air 20, 2–16.
- Tolles and Luong [2020] Tolles, J., Luong, T., 2020. Modeling epidemics with compartmental models. J. Am. Med. Assoc. 323, 2515–2516.
- VanSciver et al. [2011] VanSciver, M., Miller, S., Hertzberg, J., 2011. Particle image velocimetry of human cough. Aerosol Sci. Tech. 45, 415–422.
- Verzicco and Orlandi [1996] Verzicco, R., Orlandi, P., 1996. A finite-difference scheme for three-dimensional incompressible flows in cylindrical coordinates. J. Comput. Phys. 123, 402–414.
- Wei and Li [2017] Wei, J., Li, Y., 2017. Human cough as a two-stage jet and its role in particle transport. PLoS One 12, e0169235.
- Wells [1934] Wells, W.F., 1934. On air-borne infection. study II. Droplets and droplet nuclei. Am. J. Hyg. 20, 611–18.
- Xie et al. [2007] Xie, X., Li, Y., Chwang, A.T.Y., Ho, P.L., Seto, W.H., 2007. How far droplets can move in indoor environments–revisiting the Wells evaporation–falling curve. Indoor Air 17, 211–225.
- Xie et al. [2009] Xie, X., Li, Y., Sun, H., Liu, L., 2009. Exhaled droplets due to talking and coughing. J. R. Soc. Interface 6, S703–S714.
- Yang et al. [2020] Yang, F., Pahlavan, A.A., Mendez, S., Abkarian, M., Stone, H.A., 2020. Towards improved social distancing guidelines: Space and time dependence of virus transmission from speech-driven aerosol transport between two individuals. Phys. Rev. Fluids 5, 122501.
- Zhou and Zou [2021] Zhou, M., Zou, J., 2021. A dynamical overview of droplets in the transmission of respiratory infectious diseases. Phys. Fluids 33, 031301.