0
\vgtccategoryResearch
\vgtcpapertypeapplication/design study
\vgtcinsertpkg
\teaser
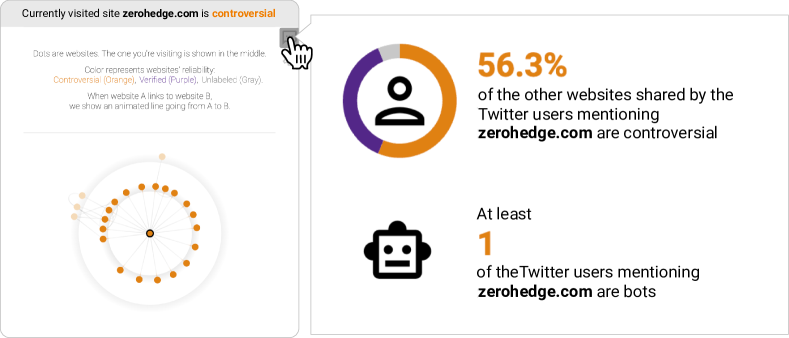
![[Uncaptioned image]](/html/2210.00160/assets/x1.png) MisVis helps users assess a website’s reliability and
understand how the site may be involved in spreading false information
by visualizing its hyperlink connectivity.
When a user visits a website,
MisVis is displayed interstitially over the website, blurring its contents and blocking user interactions.
The MisVis user interface consists of
(A) a Header message about the reliability of the website being visited by the user,
(B) brief Explanation about how to interpret the MisVis visualization, and
(C) the Main Window that visualizes the connectivity of the visited website in two coordinated views: Graph View and Summary View.
(1) The Graph View shows how the website connects to other websites via hyperlinks. Dots are websites, and edges are hyperlinks; the site being visited is shown in the middle.
MisVis visualizes the information flow among sites through animation.
(2) The Summary View shows
the site’s overall reliability by summarizing the reliability of its connected sites.
In both views,
controversial sites are shown in orange,
verified in purple, and
unlabeled in gray.
MisVis helps users assess a website’s reliability and
understand how the site may be involved in spreading false information
by visualizing its hyperlink connectivity.
When a user visits a website,
MisVis is displayed interstitially over the website, blurring its contents and blocking user interactions.
The MisVis user interface consists of
(A) a Header message about the reliability of the website being visited by the user,
(B) brief Explanation about how to interpret the MisVis visualization, and
(C) the Main Window that visualizes the connectivity of the visited website in two coordinated views: Graph View and Summary View.
(1) The Graph View shows how the website connects to other websites via hyperlinks. Dots are websites, and edges are hyperlinks; the site being visited is shown in the middle.
MisVis visualizes the information flow among sites through animation.
(2) The Summary View shows
the site’s overall reliability by summarizing the reliability of its connected sites.
In both views,
controversial sites are shown in orange,
verified in purple, and
unlabeled in gray.
Explaining Website Reliability by Visualizing Hyperlink Connectivity
Abstract
As the information on the Internet continues growing exponentially, understanding and assessing the reliability of a website is becoming increasingly important. Misinformation has far-ranging repercussions, from sowing mistrust in media to undermining democratic elections. While some research investigates how to alert people to misinformation on the web, much less research has been conducted on explaining how websites engage in spreading false information. To fill the research gap, we present MisVis, a web-based interactive visualization tool that helps users assess a website’s reliability by understanding how it engages in spreading false information on the World Wide Web. MisVis visualizes the hyperlink connectivity of the website and summarizes key characteristics of the Twitter accounts that mention the site. A large-scale user study with 139 participants demonstrates that MisVis facilitates users to assess and understand false information on the web and node-link diagrams can be used to communicate with non-experts. MisVis is available at the public demo link: https://poloclub.github.io/MisVis.
Human-centered computingVisualizationVisualization systems and toolsVisualization toolkits;
1 Introduction
As the information on the Internet continues growing exponentially, understanding and assessing the reliability of a website is becoming increasingly important. Misinformation has far-ranging repercussions, from sowing mistrust in media to undermining democratic elections [42, 36]. For example, in the 2016 U.S. election, the top 20 fake news stories on Facebook had higher engagement than the top 20 true ones [43]. Some research investigates how to alert people to fake news on the web [12, 24, 22]. Yet, warning about fake news alone does not necessarily help people learn about how to assess information reliability [32, 40]. Little research has been conducted on explaining how websites engage in spreading the false information [31, 16].
To fill this research gap, we present MisVis, a web-based interactive visualization tool that helps users assess a website’s reliability by understanding how it engages in spreading false information on the web and social media. Built on top of our early prototype [25], we design and develop MisVis following the design study methodology by Sedlmair et al. [38]. MisVis’s design is inspired by the recent findings from Sehgal et al. [39] that the reliability of a website is closely related to how it is connected to other websites through hyperlinks and how it is shared on social media. We define false information to encompass all types of fake or inaccurate information on the web, such as misinformation, disinformation and conspiracy [48]. Our MisVis research contributes:
-
•
Abstracting the Problem of Explaining Website Reliability. In collaboration with AVAST, a large cybersecurity company, we characterize the problem of explaining website reliability to non-expert users as the task of visualizing and summarizing websites’ hyperlink connectivity and Twitter mentions. We design and develop the web-based interactive MisVis tool (Explaining Website Reliability by Visualizing Hyperlink Connectivity) to accomplish that task, helping users better understand how websites engage in spreading false information.
-
•
Evaluation of Visualization Design of MisVis. A large-scale user study with 139 participants shows that MisVis effectively helps users identify and understand false information on the web. For a demo video of MisVis, visit https://youtu.be/BRp3tedaNeg.
-
•
Reflection and Design Lessons. Our iterative design process and study results have made discoveries relating to the larger research area of visualization, adding to the body of knowledge that benefits researchers, e.g., our large-scale user study shows that non-experts can easily comprehend node-link diagrams for understanding hyperlink connectivity; and that displaying interstitial [22] visualization could increase its ease of use.
2 Related Works
Reliability assessment of web information. To help people assess the factualness of web information, online platforms, such as Snopes [20], FAIR [3], FactCheck.org [2], and PolitiFact [4] focus on helping people manually validate information, while Ciampaglia et al. [9] introduces a computational fact-checking technique. To curb misinformation on social media, Facebook [27] and Twitter [35] have been adding warning labels to alert users to false information, and web-browser extensions have been developed to detect fake news on social media [1, 29]. However, most existing techniques primarily focus on alerting people to false information [12, 24, 22, 11, 23]. Much less research has been conducted on explaining how websites engage in spreading false information [31, 16].
Hyperlink connectivity visualization. While the visualization community has developed techniques for understanding graph structures [49, 45, 44, 10], cybersecurity researchers primarily focus on studying hyperlink graphs to better understand website relationships [16, 6, 37]. However, little research has focused on visualizing hyperlink connectivity to accomplish the goal of explaining website reliability [6]. Furthermore, to the best of our knowledge, there have not been large-scale studies that evaluate whether non-experts can easily comprehend node-link diagrams for understanding hyperlink connectivity [45, 10]. To fill the above research gaps, we design, develop, and evaluate MisVis to help the general public better understand how websites engages in spreading false information through visualizing website connections as node-link diagrams.
3 Design Goals
We have been collaborating closely with security and misinformation domain experts at AVAST since August 2021, iteratively designing and developing MisVis; we identified three design goals (G1-G3):
-
G1.
Easily Understandable Visualization. While graph visualizations has been developed to better understand hyperlink connectivity [47], there has been little research on whether non-experts can easily understand them [45]. MisVis aims to visualize hyperlink connectivity in a way that is easy for the general public to understand.
-
G2.
Credibility Identification. For users to trust MisVis’s visualizations about websites that they may visit (or to turn away from, as they spread false information), it is important for MisVis to maintain high credibility [19, 8]. We design MisVis to be transparent and neutral in terms of website reliability labels.
- G3.
4 System Design
4.1 Overview
We design MisVis to help users assess a website’s reliability by visually explaining how the website engages in spreading false information on the web and social media. Based on our discussion with AVAST cybersecurity experts and building on previous work [39], we characterize the problem of explaining website reliability to non-expert users as the task of visualizing and summarizing websites’ hyperlink connectivity and Twitter mentions.
Dataset. For website reliability and connectivity, we employ the dataset collected by Sehgal et al. [39], which consists of 1,059 misinformational and 1,059 informational websites that are collected and labeled by combining four publicly available datasets, BS Detector [34], Columbia Journalism Review, FakeNewsNet [41], and Media Bias Fact Check [5]. We reveal these label sources in MisVis for better transparency (G2). MisVis labels the misinformational websites as controversial to encompass all types of false information, such as misinformation, disinformation, and conspiracy (G2). The informational and unlabeled domains are labeled as verified and unlabeled, respectively.
For the Twitter user data, Twitter’s Search Tweets API111https://developer.twitter.com/en/docs/twitter-api/v1/tweets/search/guides/standard-operators has been used with the query “which websites are shared by which Twitter users”. Then, the Twitter users who have recently mentioned at least one of the websites in the website reliability dataset described above have been added to the Twitter user dataset. Among these Twitter users, we identified bot accounts using the botometer-python API222https://github.com/IUNetSci/botometer-python.
User Interface. MisVis is displayed interstitially when a user visits a website [22] (G3). We implement MisVis using the standard HTML/CSS/JavaScript web technology stack and the D3.js visualization library [7]. MisVis is available at https://poloclub.github.io/MisVis.
4.2 Main Window
MisVis’s Main Window (Explaining Website Reliability by Visualizing Hyperlink ConnectivityC) visualizes the connectivity of the visited website in two coordinated views: Graph View (Explaining Website Reliability by Visualizing Hyperlink Connectivity\raisebox{-.9pt} {1}⃝) and Summary View (Explaining Website Reliability by Visualizing Hyperlink Connectivity\raisebox{-.9pt} {2}⃝). The Graph View shows how a website is connected with other websites by hyperlinks and how the information would flow through the links. The Summary View presents the visited site’s overall reliability by summarizing the reliability distributions of its connected sites.
4.2.1 Graph View
The Graph View (Explaining Website Reliability by Visualizing Hyperlink Connectivity\raisebox{-.9pt} {1}⃝) explains how a user-visited website engages in spreading false information. Specifically, it shows how a visited website is connected to other websites by hyperlinks and how false information would flow through the links.
Each website is represented by a circular node, whose color indicates the site’s reliability; orange for controversial, purple for verified, and gray for unlabeled. The label unlabeled is assigned to content aggregators (e.g., google.com) or sites whose labels are not yet available. The nodes are arranged along two concentric rings, based on how they are connected to the visited website. The website being visited is shown in the center. The visited site’s 1-hop (directly linked) and 2-hop neighbors are positioned on the inner and outer ring, respectively. We include neighbors up to 2 hops away, because a 2-hop neighborhood provides rich connectivity information for understanding the spread of false information [39, 16] without creating overwhelming visual complexity.
Hyperlinks between two sites are represented as edges. When a user hovers over a node, MisVis visualizes how information flows to or from that node. When a website A links to website B, MisVis shows an animated line going from A to B. When none of the nodes is hovered, the hyperlinks between the visited website and its 1-hop neighbors are animated by default to draw the user’s attention to the visited site shown in the center (Explaining Website Reliability by Visualizing Hyperlink Connectivity\raisebox{-.9pt} {1}⃝)
To enhance the readability of the node-link diagram by arranging the nodes to reduce edge crossings (G1), we lay out the nodes using the force-directed layout [14] via the d3-force API333https://github.com/d3/d3-force. Also, we use a straight line to connect two nodes that are on different rings (e.g., connecting a 1-hop neighbor and a 2-hop neighbor) and a curved line to connect two nodes that are on the same ring (e.g., connecting two 1-hop nodes).
4.2.2 Summary View
The Summary View (Explaining Website Reliability by Visualizing Hyperlink Connectivity\raisebox{-.9pt} {2}⃝) helps users understand the visited site’s reliability by providing a quantitative summary of its connected sites’ reliability. The Summary View displays a summary statement (e.g., “22 controversial websites are linking to the site you are visiting”) and a doughnut chart that shows the reliability distributions of the sites linked with the visited site. As it is common for the sites with false information to link to each other via hyperlinks [46], the summary statement raises the user’s awareness of the visited site’s risk by highlighting the number of linked controversial sites.
The doughnut chart summarizes the reliability distributions of its connected sites in two rings; the inner and outer rings represent the visited site’s 1-hop and 2-hop neighbors, respectively. In the center of the rings, we display the percentage of controversial sites among all the sites in the chart. The number and percentage that an arc in the doughnut chart stands for can be viewed by hovering the arc.
The Summary View visualizes the neighboring sites’ reliability in two modes: normalized and absolute mode. In the normalized mode, one full ring is for 100% of the sites in the ring; for example, if 5 out of 10 directly connected sites are controversial, half of the inner ring is colored in orange. In the absolute mode, each ring is evenly divided into 100 arc segments, and each segment corresponds to one website; for example, 5 controversial sites are represented by 5 orange arc segments. We experimented with the number of segments beyond 100 but decided not to use more than 100 segments as they became illegible. If there are more than 100 sites in a ring, MisVis shows a pop-up message informing that the limit has been reached and reverts to the normalized mode.
4.3 Twitter Window
As false information is often shared and propagates on social media [26, 30], the Twitter Window (Figure 1) informs users of how the visited website is shared on Twitter. At the top of the Twitter Window, users can see the percentage of the controversial websites among the sites shared by the Twitter users that have mentioned the visited website. If the percentage of controversial sites mentioned by the common Twitter users with the visited website is high, the visited site is likely to be controversial as well, since prolific spreaders of false information often mention multiple controversial sites on Twitter. Below, the number of bot Twitter accounts that have mentioned the visited website is displayed. As bot accounts are commonly deployed to spread false information [28, 18], a high number of bots strongly implies that the site would contain false information. The Twitter Window can be shown and hidden by clicking the social media button at the top-right corner of the Main Window.
4.4 Settings Panel
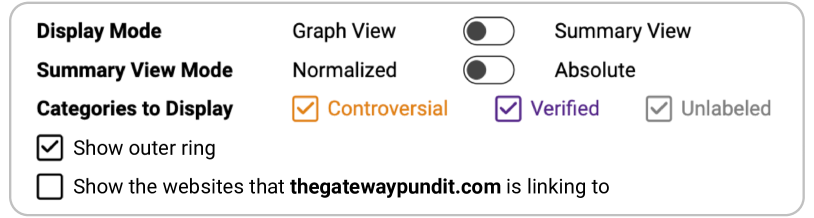
The Settings Panel (Figure 2) is used to (1) switch the view of the Main Window between the Graph View and the Summary View (subsection 4.2), (2) switch the Summary View mode between normalized and absolute (subsubsection 4.2.2), (3) include or exclude certain reliability labels to or from the visualization in the Main Window, (4) show or hide the outer ring for 2-hop neighbors, and (5) show or hide the visualization for the websites that the visited website contains hyperlinks to, in addition to the websites with hyperlinks to the visited website. By default, we display both 1-hop and 2-hop neighbors of the visited website as 2-hop neighborhood can provide rich information for the connectivity [39, 16]. On the other hand, the sites that the visited website has hyperlinks to is not shown in the default setting as a controversial site can deliberately link to a large number of reputable sites to falsely inflate its credibility and mislead users [15].
5 Design Validation by User Study
To validate the effectiveness of MisVis, we conducted a large-scale user study. We recruited 150 U.S.-based participants from Prolific444https://www.prolific.co/, an online platform designed for academic research. The participants’ ages range from “18-24 years old” to “65 or older”. They consume news from a variety of sources, including news websites, social media, and television. The study for each participant lasted for around 15 minutes and we compensated each participant with $2.50; we paid a $1.00 bonus to the participants who provided feedback for the open-ended survey questions.
5.1 Procedure
We first asked participants to watch a 2-minute tutorial video about how to use MisVis. After that, to ensure high quality result, we asked the participants to answer 3 simple questions about the video. Then, we asked participants to use MisVis in a hypothetical scenario where they were using a search engine to look up information to write an essay about the “islands in the East China Sea with territorial dispute”, a topic that is less likely to evoke extreme emotions among most U.S.-based participants. We provided the participants with the hypothetical search result page showing a list of websites (similar to those returned by search engines). They were asked to visit the first two websites in sequence. To prevent exposing the participants to false information and to help them focus on the visualization, when they clicked on a website, MisVis was displayed interstitially [22]; the website contents were blurred, user interactions were blocked, and the website name was masked (Explaining Website Reliability by Visualizing Hyperlink Connectivity). After visiting each website, the participants were asked to determine if the site was a reliable information source: yes, maybe, no.
Every participant visited one controversial site and one verified site, so that we could evaluate how participants interact with MisVis in both cases. The two websites were presented in random order to guard against order effect (i.e., controversial verified, or verified controversial) We sampled 10 controversial and 10 verified sites with at least one 1-hop and 2-hop neighbor, to allow us to evaluate whether the participants could easily use and understand MisVis even with more complex connectivity (G1).
5.2 Results
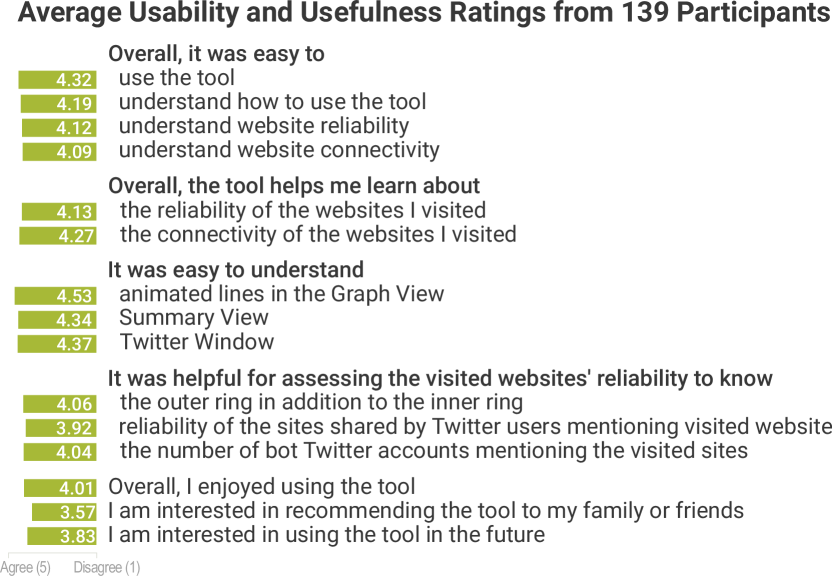
After using MisVis, the participants were asked to answer 5-point Likert-scale questions about MisVis’s usability and usefulness for assessing website reliability [21, 22]. Figure 3 summarizes the results from the 139 participants who correctly answered at least two of the three quality-check questions (we excluded 11 participants who incorrectly answered two or all questions). Overall, participants rated MisVis favorably. They enjoyed using MisVis, and found it helpful and was easy to use and understand.
Participants could easily use and understand MisVis. The average ratings for all the questions about the overall usability of MisVis and its features were above 4. In particular, many participants commented that MisVis was easy to use. (e.g., “It was laid out nicely and easy to understand.”)
Node-link diagrams for hyperlink connectivity were easy to understand and helpful (G1). The understandability and helpfulness of MisVis’s node-link diagram design received high ratings. We are excited that non-experts could easily understand such graph based visualization, because this discovery contributes to the body of knowledge of the larger area of visualization, in addition to misinformation research; such a large-scale study has not been performed before. Many participants found the animated edges enhanced their understanding. (e.g., “It showed the connections instantly and easily. It was fun to use, and the animation helped easier understanding and was relaxing.”)
MisVis helped participants assess website reliability and connectivity. Many participants gave high ratings to the questions about the helpfulness of MisVis. After visiting the controversial websites, 95 out of 139 participants determined the sites to be indeed controversial, 30 were undecided; only 14 thought they were reliable. For the verified websites, 88 determined the sites to be reliable, 40 were undecided. Our results provided strong empirical evidence for MisVis’s effectiveness in helping assess website reliability.
Hyperlink connectivity helped participants assess website reliability. Participants commented that knowing a website’s hyperlink connectivity enhanced their assessment confidence (e.g., “ Legitimacy of a website’s connections bolsters its trust.”, “Knowing that a website is connected to reliable websites gives me comfort.”). This finding validated our problem abstraction of explaining website reliability via visualizing hyperlink connectivity.
Interstitial visualization enhances MisVis’s ease of use (G3). MisVis was displayed interstitially [22], over the website’s blurred contents. One of the participants said “I found this tool useful as I could see the reliability of the website without clicking anything, therefore save me time”, echoing the benefit of the interstitial design.
6 Reflection and Design Lessons
Label Wording for Website Reliability. Through close discussion with domain experts, we established three criteria to provide accurate and unbiased labels for website reliability (G2): (1) the labels should be easily understandable for general users, (2) they should encompass all types of false information, and (3) they should be neutral, not to offend users. For example, at first, we labeled each website’s reliability as misinformation, reliable, or unlabeled. However, the domain experts pointed out that the term misinformation might not cover all types of false information (e.g., disinformation), and that users could feel offended if the sites they often visited were labeled as misinformation. Thus, we adopted the controversial label, which is more neutral than misinformation. Likewise, we adopted the verified label to convey that labels had verifiable sources.
Revealing Reliability Label Sources. We learned that revealing the sources for the website reliability labels significantly increases the credibility of MisVis [19, 33] (G2). The earlier designs of MisVis did not mention where the reliability labels came from. On a pilot study, multiple participants were concerned about the potential biases in the reliability labels and wondered how the labels were determined. We therefore added a statement at the bottom of the Main Window to clearly state the sources: “Reliability labels are based on credible sources: Columbia Journalism Review, Media Bias Fact Check, FakeNewsNet.” (Clicking the sources would bring the users to their websites.) In our large-scale study, as a result, far fewer participants were concerned about the credibility of MisVis.
7 Conclusion and Future Work
We present MisVis, a web-based interactive visualization tool to help users assess the reliability of a website and understand how the website is involved in spreading false information on the World Wide Web and social media, by visualizing hyperlink connectivity of the website and summarizing key characteristics of the Twitter accounts that mention the site. Through a large-scale user study, we validate that MisVis successfully facilitates users to identify and understand false information on the web. We plan to deploy MisVis as a web browser extension for broader impact and improved usability.
References
- [1] Bot sentinel. https://botsentinel.com. Accessed: 2022-04-28.
- [2] Factcheck.org. www.factcheck.org. Accessed: 2022-04-28.
- [3] Fair. fair.org. Accessed: 2022-04-28.
- [4] Politifact. www.politifact.com. Accessed: 2022-04-28.
- [5] Questionable sources. mediabiasfactcheck.com/fake-news. Accessed: 2022-04-28.
- [6] T. Aoki and A. Goto. Graph visualization of the dark web hyperlink. In 2020 Eighth International Symposium on Computing and Networking (CANDAR), pp. 89–94. IEEE, 2020.
- [7] M. Bostock, V. Ogievetsky, and J. Heer. D3 data-driven documents. IEEE transactions on visualization and computer graphics, 17(12):2301–2309, 2011.
- [8] P. B. Brandtzaeg and A. Følstad. Trust and distrust in online fact-checking services. Communications of the ACM, 60(9):65–71, 2017.
- [9] G. L. Ciampaglia, P. Shiralkar, L. M. Rocha, J. Bollen, F. Menczer, and A. Flammini. Computational fact checking from knowledge networks. PloS one, 10(6):e0128193, 2015.
- [10] M. Douma, G. Ligierko, O. Ancuta, P. Gritsai, and S. Liu. Spicynodes: Radial layout authoring for the general public. IEEE Transactions on Visualization and Computer Graphics, 15(6):1089–1096, 2009.
- [11] D. A. Eccles and T. Dingler. Three prophylactic interventions to counter fake news on social media. arXiv preprint arXiv:2105.08929, 2021.
- [12] R. Ennals, B. Trushkowsky, and J. M. Agosta. Highlighting disputed claims on the web. In Proceedings of the 19th international conference on World wide web, pp. 341–350, 2010.
- [13] A.-M. Fraser. Google bans website zerohedge from its ad platform over comments on protest articles. NBC News, 2020.
- [14] T. M. Fruchterman and E. M. Reingold. Graph drawing by force-directed placement. Software: Practice and experience, 21(11):1129–1164, 1991.
- [15] Z. Gyongyi, H. Garcia-Molina, and J. Pedersen. Combating web spam with trustrank. In Proceedings of the 30th international conference on very large data bases (VLDB), 2004.
- [16] H. W. A. Hanley, D. Kumar, and Z. Durumeric. No calm in the storm: Investigating qanon website relationships. ICWSM, 2022.
- [17] D. Hawkins. Twitter bans zero hedge account after it doxxed a chinese researcher over coronavirus. The Washington Post, 2020.
- [18] M. Himelein-Wachowiak, S. Giorgi, A. Devoto, M. Rahman, L. Ungar, H. A. Schwartz, D. H. Epstein, L. Leggio, B. Curtis, et al. Bots and misinformation spread on social media: Implications for covid-19. Journal of Medical Internet Research, 23(5):e26933, 2021.
- [19] C. I. Hovland and W. Weiss. The influence of source credibility on communication effectiveness. Public opinion quarterly, 15(4):635–650, 1951.
- [20] S. M. G. Inc. Snopes. www.snopes.com. Accessed: 2022-04-28.
- [21] F. Jahanbakhsh, A. X. Zhang, A. J. Berinsky, G. Pennycook, D. G. Rand, and D. R. Karger. Exploring lightweight interventions at posting time to reduce the sharing of misinformation on social media. Proc. ACM Hum.-Comput. Interact., 5(CSCW1), apr 2021. doi: 10 . 1145/3449092
- [22] B. Kaiser, J. Wei, E. Lucherini, K. Lee, J. N. Matias, and J. Mayer. Adapting security warnings to counter online disinformation. In 30th USENIX Security Symposium (USENIX Security 21), pp. 1163–1180, 2021.
- [23] J. Kirchner and C. Reuter. Countering fake news: A comparison of possible solutions regarding user acceptance and effectiveness. Proceedings of the ACM on Human-computer Interaction, 4(CSCW2):1–27, 2020.
- [24] C. Lanius, R. Weber, and W. I. MacKenzie. Use of bot and content flags to limit the spread of misinformation among social networks: a behavior and attitude survey. Social Network Analysis and Mining, 11(1):1–15, 2021.
- [25] S. Lee, S. Afroz, H. Park, Z. J. Wang, O. Shaikh, V. Sehgal, A. Peshin, and D. H. Chau. MisVis: Explaining web misinformation connections via visual summary. In Extended Abstracts of the 2022 CHI Conference on Human Factors in Computing Systems. ACM, 2022. doi: 10 . 1145/3491101 . 3519711
- [26] P. Meel and D. K. Vishwakarma. Fake news, rumor, information pollution in social media and web: A contemporary survey of state-of-the-arts, challenges and opportunities. Expert Systems with Applications, 153:112986, 2020. doi: 10 . 1016/j . eswa . 2019 . 112986
- [27] Meta. Combating misinformation, 02 2022.
- [28] C. Metz. Twitter bots poised to spread disinformation before election. The New York Times, 2020.
- [29] M. C. Nabanita De, Anant Goel and Q. Chen. Project fib, 01 2022.
- [30] S. B. Naeem, R. Bhatti, and A. Khan. An exploration of how fake news is taking over social media and putting public health at risk. Health Information & Libraries Journal, 38(2):143–149, 2021.
- [31] V. Patricia Aires, F. G. Nakamura, and E. F. Nakamura. A link-based approach to detect media bias in news websites. In Companion Proceedings of The 2019 World Wide Web Conference, pp. 742–745, 2019.
- [32] S. Pluviano, C. Watt, and S. Della Sala. Misinformation lingers in memory: failure of three pro-vaccination strategies. PloS one, 12(7):e0181640, 2017.
- [33] C. Pornpitakpan. The persuasiveness of source credibility: A critical review of five decades’ evidence. Journal of applied social psychology, 34(2):243–281, 2004.
- [34] M. Risdal. Getting real about fake news, 2016. doi: 10 . 34740/KAGGLE/DSV/911
- [35] Y. Roth and N. Pickles. Updating our approach to misleading information, 05 2020.
- [36] M. M. H. Samia Tasnim and H. Mazumder. Impact of rumors and misinformation on covid-19 in social media. Journal of Preventive Medicine & Public Health, 53:171–174, 2020. doi: 10 . 3961/jpmph . 20 . 094
- [37] N. S. Sattar, S. Arifuzzaman, M. F. Zibran, and M. M. Sakib. Detecting web spam in webgraphs with predictive model analysis. In 2019 IEEE International Conference on Big Data (Big Data), pp. 4299–4308. IEEE, 2019.
- [38] M. Sedlmair, M. Meyer, and T. Munzner. Design study methodology: Reflections from the trenches and the stacks. IEEE transactions on visualization and computer graphics, 18(12):2431–2440, 2012.
- [39] V. Sehgal, A. Peshin, S. Afroz, and H. Farid. Mutual hyperlinking among misinformation peddlers. CoRR, abs/2104.11694, 2021.
- [40] F. Sharevski, R. Alsaadi, P. Jachim, and E. Pieroni. Misinformation warnings: Twitter’s soft moderation effects on covid-19 vaccine belief echoes. Computers & security, 114:102577, 2022.
- [41] K. Shu, D. Mahudeswaran, S. Wang, D. Lee, and H. Liu. Fakenewsnet: A data repository with news content, social context and dynamic information for studying fake news on social media. arXiv preprint arXiv:1809.01286, 2018.
- [42] F. Siddiqui and S. Svrluga. N.c. man told police he went to d.c. pizzeria with gun to investigate conspiracy theory. The Washington Post, 2016.
- [43] C. Silverman. Viral fake election news outperforms real news on facebook, 2022.
- [44] M. A. Smith, C. A., N. Milic-Frayling, B. Shneiderman, E. Mendes Rodrigues, J. Leskovec, and C. Dunne. Nodexl: a free and open network overview, discovery and exploration add-in for excel 2007/2010/2013/2016. 2010.
- [45] L. South, M. Schwab, N. Beauchamp, L. Wang, J. Wihbey, and M. A. Borkin. Debatevis: Visualizing political debates for non-expert users. In 2020 IEEE Visualization Conference (VIS), pp. 241–245. IEEE, 2020.
- [46] K. Starbird, A. Arif, T. Wilson, K. Van Koevering, K. Yefimova, and D. Scarnecchia. Ecosystem or echo-system? exploring content sharing across alternative media domains. In Proceedings of the International AAAI Conference on Web and Social Media, vol. 12, 2018.
- [47] O. Turetken and R. Sharda. Visualization of web spaces: state of the art and future directions. ACM SIGMIS Database: the DATABASE for Advances in Information Systems, 38(3):51–81, 2007.
- [48] L. Wu, F. Morstatter, K. M. Carley, and H. Liu. Misinformation in social media: definition, manipulation, and detection. ACM SIGKDD Explorations Newsletter, 21(2):80–90, 2019.
- [49] S. Zhang, R. Yang, X. Xiao, X. Yan, and B. Tang. Pprviz: Effective and efficient graph visualization based on personalized pagerank. arXiv preprint arXiv:2112.14944, 2021.