©2022 IEEE. Personal use of this material is permitted. Permission from IEEE must be obtained for all other uses, in any current or future media, including reprinting/republishing this material for advertising or promotional purposes, creating new collective works, for resale or redistribution to servers or lists, or reuse of any copyrighted component of this work in other works. A definitive version was published in 44th International Engineering in Medicine and Biology Conference (EMBC) and is available at https://dx.doi.org/10.1109/EMBC48229.2022.9871325
Automated Characterization of Catalytically Active Inclusion Body Production in Biotechnological Screening Systems*
Abstract
We here propose an automated pipeline for the microscopy image-based characterization of catalytically active inclusion bodies (CatIBs), which includes a fully automatic experimental high-throughput workflow combined with a hybrid approach for multi-object microbial cell segmentation.
For automated microscopy, a CatIB producer strain was cultivated in a microbioreactor from which samples were injected into a flow chamber. The flow chamber was fixed under a microscope and an integrated camera took a series of images per sample.
To explore heterogeneity of CatIB development during the cultivation and track the size and quantity of CatIBs over time, a hybrid image processing pipeline approach was developed, which combines an ML-based detection of in-focus cells with model-based segmentation.
The experimental setup in combination with an automated image analysis unlocks high-throughput screening of CatIB production, saving time and resources.
Biotechnological relevance— CatIBs have wide application in synthetic chemistry and biocatalysis, but also could have future biomedical applications such as therapeutics. The proposed hybrid automatic image processing pipeline can be adjusted to treat comparable biological microorganisms, where fully data-driven ML-based segmentation approaches are not feasible due to the lack of training data. Our work is the first step towards image-based bioprocess control.
I INTRODUCTION
Inclusion bodies are misfolded proteins, typically regarded as cellular waste products, that occur during overproduction in bacteria such as Escherichia coli (E. coli). However, if these inclusion bodies are catalytically active (CatIBs), they become interesting targets for synthetic chemistry and industrial biotechnology, being easy to produce and harvest [1, 2]. Although CatIB production is compelling, little is known about efficient process conditions. Nowadays, microbioreactors, such as the so-called Biolector system, are used to screen for beneficial (cost-efficient) process conditions [3]. For automation, the Biolector is integrated with a liquid handling system, enabling injection of samples into a flow chamber, which is fixed under a microscope. With an integrated camera, a series of images is taken of the samples. On the images, CatIBs appear as bright spots within the cells. The number of CatIBs per cell, and time point of the sample are thus detectable analysis parameters that are then correlated with the amount of the protein produced. This setup allows large-scale optical condition screening to characterize the production of CatIBs.
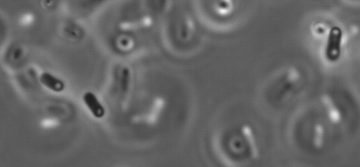
Due to the large amount of data generated per experiment (500 images per sample, and three samples per one time point), manual analysis of CatIB counts is infeasible. Application of off-the-shelf machine learning (ML)-based segmentation approaches is hampered by a lack of training data. Ground truth (GT), however, is extremely time-intense to produce: since the height of the flow chamber is far larger than the cells, a large fraction of cells is out-of-focus (Figure 1). Therefore, manual annotation (drawing cell and CatIB outlines) is extremely hard even for experts and risks introducing a bias.
To objectively analyze the formation of CatIBs in large-scale screens, we propose a hybrid image processing pipeline (HIPP), designed to segment in-focus cells and determine CatIB parameters. With this, analyzing CatIB production at single-cell heterogeneity becomes possible, such as the number and the ratio of the cells carrying CatIBs, along with the average numbers, such as total CatIB and cell areas to monitor the cultivation process. We tested our HIPP with a real data set, showing biotechnologically comprehensible results.
II Experimental set-up
II-A Strains, media and cultivation conditions
E. coli DH5 was used as a cloning host for the generation of plasmid pET28a::EcLDCc::SG::TDoT. Heterologous expression of the gene fusions was performed using E. coli BL21(DE3). Lysogeny broth (LB) medium was employed for the cultivation of strains during the cloning procedure and for the precultures of the expression strains. For automated microscopy experiments, the expression strains were cultivated in 48-well FlowerPlates (m2p-labs GmbH, Baesweiler, Germany) in M9-AI medium [3] in a BioLector (m2p-labs GmbH, Baesweiler, Germany). After precultivation, expression cultures were inoculated at OD600, and the cells were cultivated at 37°C for 3 hours at 1000 rpm. Then the temperature was decreased to 15°C and the expression ensued for 69 hours under the same shaking conditions. All cultures were supplemented with 50 µg/ml kanamycin for plasmid maintenance.
II-B Automated experimentation and microscopy
CatIB strains were cultivated in a BioLector, which was integrated into a liquid handling system (Freedom Evo200, Tecan, Männedorf, Switzerland). Every 4.5 hours, cells were harvested from each well of the FlowerPlate (the last three wells were harvested at 72 hours) and stored in a deep well plate at 4°C on the robotic deck until automated microscopy was performed. For sample injection, a self-built injection station [4] was used. The station was connected via a tubing (VWR, Darmstadt, Germany) to a flow chamber (height: 20 µm, length: 58.5 mm, width: 800 µm, microfluidic ChipShop, Jena, Germany). The chamber was fixed on an inverted Nikon Eclipse Ti microscope (Nikon GmbH, Düsseldorf, Germany) equipped with a CFI Plan Apo Lambda 100x Oil objective (Nikon GmbH, Düsseldorf, Germany). 300 µL of each sample, followed by 400 µL H2O were injected in the injection station. After the injection of 600 µL the flow was set to zero to allow for image acquisition. A 1 µL pulse with a velocity of 1 µL/switch after a 4 min delay was performed three times to flush in new cells. 500 images (one image per second) were taken of each sample in the flow chamber, resulting in 1500 images for each time point. Images were taken with a Thorlab camera DCC154M-GL (Thorlabs Inc., Newton, New Jersey, USA).
III Hybrid image processing pipeline
The goal of the proposed HIPP is to segment the in-focus cells and their CatIBs (if present) separately and afterwards, classify the segmented cells, based on the number of the CatIBs. To accomplish the goal, considering the large fraction of free-flowing out-of-focus cells, we split multi-object (in-focus cells) and multi-label segmentation (number of CatIBs in a cell) into two major steps: an ML-based single-class detection approach and a model-based segmentation step, which includes variational-based and thresholding-based segmentation. The introduced separation has four reasons:
-
1.
Despite the availability of the multi-object segmentation methods, like [5], their main limitation is the lack of training data, being, in our case, very laborious to produce. Here, unlike precise pixel-wise image annotation that is necessary for the training of a multi-object pipeline, we use an easy to create single-class training dataset, since only bounding boxes are needed to train the detection framework.
-
2.
Although, the detection framework we here use supports multi-class detection, and could be used as a classifier for the different types of cells (none, 1 or 2 CatIBs per cell), it still requires a bigger training dataset, and due to the small feature (CatIB) size, compared to the image size, adequate classification accuracy was not reached in our preliminary numerical experiments.
-
3.
Another important benefit of the separation of detection and the segmentation step is simplifying the problem by reformulating multi-object segmentation as many single-object segmentation tasks. This unlocks single-object model-based segmentation methods, such as variational-based segmentation and thresholding.
-
4.
One more advantage of the splitting is that the segmentation can be done in parallel for the cells since each detected bounding box contains only one cell, which can be processed independently.
III-A Detection
To detect the in-focus cells, the YOLOv5 detection framework, one of the fastest available detection frameworks [6], was used. However, using another detection framework is certainly possible. The training data was generated by manual annotation of four images, where only in-focus cells were labeled, resulting in 151 objects (cells). To artificially increase the training dataset YOLOv5’s built-in augmentation was used, which includes image saturation, hue and value augmentation; rotation, translation and scaling; horizontal and vertical flips and image mosaic augmentation. The detection was performed on 15 manually chosen images with a steady flow for each of the 16 time points. The resulting output is discussed in Section IV.
Figure 2 shows detection examples for images from the beginning (4.5 hours, yellow), middle (36 hours, green), and the end (72 hours, red) of the dataset and the number of the detected cells on 15 images for each time point. In the bar chart, the positive slope in the first part of the experiment (4.5-36 hours) coincides with the natural growth of the cell colonies. The decline of the number of detected cells during the last part (60.5-72 hours) is explained by the fact, that during the last sampling points, E. coli cells were too crowded for exact automated image analysis. Especially in the last time point (Figure 2), nearly all in-focus cells overlapped with out-of-focus cells, hampering the automated analysis. In the future, to improve the automated microscopy system, a dilution step of the cells should be added at a specific E. coli density to ensure correct image analysis over the whole cultivation time. Moreover, the detection accuracy can be improved by using a bigger training dataset, since we use an ML-based detection.
III-B Segmentation
After the detection, each detected cell is segmented individually, by considering the image tile inside the detected bounding box. There, the segmentation is divided into two steps: first, cell-body segmentation (no CatIBs are assumed) and next CatIB(s) segmentation in each cell. To this end, we use a model-based segmentation approach on each single-cell image tile. Direct cell body segmentation is complicated by the fact that CatIBs are as bright as the background, or even brighter, and in most cases missegmented as background. To avoid this problem, we “fill” the CatIBs using a morphological closing operation [7], which combines the application of the dilation (minimum filter, as the cell is darker than the background) and erosion (maximum filter) to the dilated image tile. Then, to smooth the artifacts resulting from the closing operation and to avoid local minima problems during the following variational segmentation step, Gaussian blur is applied to the obtained “closed” (inclusion-less) image tile.
To separate the main (fully present) cell from parts of cells in the neighborhood included in the corresponding bounding box, a variational B-splines-based segmentation [8] is performed, where the cell shape is modeled as a straight rod (by fixing the curvature parameters and in the notation of [8], to zero), which consists of six control points. As the shape of the cell is more flexible than the shape model used in the variational segmentation step, to obtain the fine cell contour, global manually set thresholding (the same threshold value was applied to the entire dataset) is applied to the pixels which belong to the interior of the spline, which results in a binary pixel mask of the cell body. The suggested spline fit is necessary if parts of other cells are in the bounding box, but not necessary if sparse cell flow can be guaranteed (i.e. with dilution). To acquire the mask for the CatIB(s) of the target cell, thresholding was also applied to the original image tile, where the resulting CatIB mask is multiplied by the cell body mask, obtained at the previous step.
Since every cell has a bright surrounding “halo”, which can be missegmented as CatIB, every CatIB mask instance is checked for its area and its eccentricity. The CatIB mask components with high eccentricity (more than 80%) and small area (2 or fewer pixels) are assumed to be outliers and removed from the mask. Since the presence of CatIBs can not be guaranteed and the number of the labels is thus unknown, a multi-label histogram-based threshold cannot be applied.
IV Results
IV-A Accuracy quantification
Since no benchmark datasets are available for our application setting, we created GT data ourselves. Therefore, the validation dataset is rather small. As a validation dataset for the segmentation, 30 single-cell image tiles, obtained at the detection step, were used, where manual pixel-wise segmentation annotation was performed by an expert. The dataset contains ten image tiles of each class from different time points, where for the “1 CatIB” and the “2 CatIBs” classes, the GT CatIB masks are provided as well.
As a quality metric for the proposed segmentation algorithm, we used the average Dice score for the cell and for the CatIBs:
| (1) |
Here, is the binary mask (either cell body or CatIB(s)), obtained with the proposed pipeline; is the GT binary mask of the respective object, from the manual annotation by the expert and is the number of images tiles in the validation dataset.
In the case of the first class, with no CatIBs present and no CatIBs predicted, the Dice score for the frame is set to be 1. The resulting quality metrics for the empirically tuned parameter set (see below), which provides the best scores, are , . The parameter set includes the cell body and the CatIB thresholds; sizes of the masks for the dilation and erosion, and the weights for the variational spline-based segmentation step [8].
The low score can be explained by the fact that generally, the CatIBs have around 3-10 pixels area and even the slightest (1 pixel) deviation of the result from the GT affects the score strongly.
The classification of the cells was performed, based on the segmentation result, where cells with no CatIBs segmented belong to the first class, cells with one solid CatIB (after the area and eccentricity checks) belong to the second class, and cells with two separate (not 8-connected) CatIBs detected, belong to the last class. The confusion matrix is shown below (Table I).
| Predicted | ||||
| No CatIB | 1 CatIB | 2 CatIBs | ||
| Actual | No CatIB | 10 | 0 | 0 |
| 1 CatIB | 1 | 9 | 0 | |
| 2 CatIBs | 1 | 4 | 5 | |
IV-B CatIB characterization
To evaluate the automatic analysis, we selected and manually counted the cells with CatIB(s) and the total number of cells for each time point on five images to calculate the fraction of the cells with CatIB(s). The GT results were compared against the results, obtained with the proposed HIPP on 15 images for each time point.
In Figure 4, in the second half of the experiment, an underestimation of cells with CatIBs is observed, which correlates with the classification results (Section I). Nevertheless, the obtained automatic result is qualitatively matching the manual result (with Pearson correlation coefficient = 98 %) and is useful for experts to adjust the experimental design, conditions control, etc.
The proposed automated HIPP, applied to the 15 images for each time point, was used to observe the CatIB formation process over the whole cultivation time along with the cell growth (Figure 5). The first CatIBs were detected after 31.5 h. The amount of in-focus cells with 1 CatIB reached its maximal amount at about 60 %, while by the end of the experiment the formation of the second CatIB and the CatIB area growth is still ongoing. The linear trend of cell area growth is noted, where cell area reaches its maximum (3 µm2) by the end of the experiment. The growth of CatIB area over cell area fraction shows exponential behavior and reaches almost 20 %. Overall, the resulting numbers provide the necessary information for CatIB production characterization, being an enabler for image-based bioprocess control.
V CONCLUSION
In this paper, a fully automated microscopic screening system was established, saving 8 h of manual microscopy in one experiment. It was used to observe CatIB formation over the whole cultivation time. The system includes a hybrid approach combining ML-based detection with model-based unsupervised segmentation. Given the flexibility by choosing different segmentation parameters, and the adequately accurate results of the approach, despite low-quality images, we expect a similar strategy to be effective for comparable image segmentation tasks in microbiology and medicine, where no sufficient amount of training data is available to perform a fully data-driven segmentation approach.
References
- [1] Ramona Kloss et al., “Tailor-made catalytically active inclusion bodies for different applications in biocatalysis,” Catalysis Science & Technology, vol. 8, no. 22, pp. 5816–5826, 2018.
- [2] Vera D. Jäger et al., “Catalytically-active inclusion bodies for biotechnology—general concepts, optimization, and application,” Applied Microbiology and Biotechnology, vol. 104, no. 17, pp. 7313–7329, 2020.
- [3] Kira Küsters et al., “Construction and comprehensive characterization of an EcLDCc-CatIB set-varying linkers and aggregation inducing tags,” Microbial Cell Factories, vol. 20, no. 1, 2021.
- [4] Roman Jansen, Kira Küsters, Holger Morschett, Wolfgang Wiechert, and Marco Oldiges, “A fully automated pipeline for the dynamic at-line morphology analysis of microscale aspergillus cultivation,” Fungal Biology and Biotechnology, vol. 8, no. 1, 2021.
- [5] Kaiming He, Georgia Gkioxari, Piotr Dollar, and Ross Girshick, “Mask R-CNN,” in 2017 IEEE International Conference on Computer Vision (ICCV). oct 2017, IEEE.
- [6] Glenn Jocher et al., “ultralytics/yolov5: v5.0 - yolov5-p6 1280 models, aws, supervise.ly and youtube integrations,” 2021.
- [7] Richard E. Woods Rafael C. Gonzalez, Digital Image Processing, Global Edition, Pearson, 2018.
- [8] Karina Ruzaeva, Katharina Nöh, and Benjamin Berkels, “A hybrid multi-object segmentation framework with model-based B-splines for microbial single cell analysis,” in 2022 IEEE 19th International Symposium on Biomedical Imaging (ISBI). 2022, IEEE, (in press).