Emergence of the spin polarized domains in the kagome lattice Heisenberg antiferromagnet Zn-barlowite (Zn0.95Cu0.05)Cu3(OD)6FBr
Abstract
Kagome lattice Heisenberg antiferromagnets are known to be highly sensitive to perturbations caused by structural disorder. NMR is a local probe ideally suited for investigating such disorder-induced effects, but in practice large distributions in the conventional one-dimensional NMR data make it difficult to distinguish the intrinsic behavior expected for pristine kagome quantum spin liquids from disorder induced effects. Here we report the development of a two-dimensional NMR data acquisition scheme applied to Zn-barlowite (Zn0.95Cu0.05)Cu3(OD)6FBr kagome lattice, and successfully correlate the distribution of the low energy spin excitations with that of the local spin susceptibility. We present evidence for the gradual growth of domains with a local spin polarization induced by 5% Cu2+ defect spins occupying the interlayer non-magnetic Zn2+ sites. These spin polarized domains account for % of the sample volume at 2 K, where gapless excitations induced by interlayer defects dominate the low energy sector of spin excitations within the kagome planes.
INTRODUCTION
The quantum spin liquid (QSL) is a novel state of matter formed by entangled spin singlets, in which magnetic frustration effects prevent spins from undergoing magnetic long range order [1, 2, 3, 4, 5]. The last few decades have seen concerted efforts to identify model materials of the QSL. However, many of them undergo magnetic long range order or spin freezing at low temperatures. Copper hydroxyhalide materials herbertsmithite ZnCu3(OH)6Cl2 [6, 7, 8, 9, 10, 11, 12, 13, 14, 15, 16, 17, 18, 19, 20, 21, 22, 23] and Zn-barlowite ZnCu3(OH)6FBr [24, 25, 26, 27, 28, 29, 21, 30] are among the few exceptions without magnetic symmetry breaking even near absolute zero. As shown in Fig.1, Cu2+ ions with electron spin- in Zn-barlowite form a corner-sharing triangular lattice known as the kagome lattice. The nearest-neighbor Cu2+-Cu2+ antiferromagnetic super-exchange interaction is as large as K [7, 25] and geometrically frustrated. While earlier studies point toward realization of a proximate kagome QSL state in these materials [6, 7, 8, 11, 12, 15, 16, 17, 19, 20, 21, 22, 23, 24, 27, 21], the structural disorder in these materials [14, 26] complicates interpretation of the experimental results. Accordingly, the exact nature of the kagome planes has been highly controversial, necessitating clear understanding of the influence of disorder on the kagome planes.
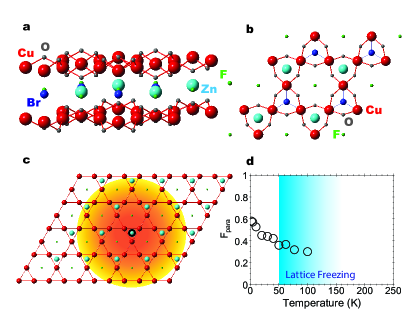
Recent work, including site-selective anomalous X-ray scattering experiments, established that the interlayer non-magnetic Zn2+ sites are occupied by extra Cu2+ defect spins with 15% probability in herbertsmithite [14] and 5% probability in the most Zn-rich Zn-barlowite, synthesized as a powder [26]. Accordingly, their actual chemical formula is (Zn0.85Cu0.15)Cu3(OH)6Cl2 for herbertsmithite and (Zn0.95Cu0.05)Cu3(OH)6FBr for Zn-barlowite. We will use an acronym Zn0.95 to represent Zn-barlowite hereafter. One important difference between Zn-barlowite and herbertsmithite is in the location of the interlayer Cu2+ defects: in herbertsmithite, they occupy the centered, octahedral Zn2+ site, while in Zn-barlowite they occupy an off-center, trigonal prismatic site that is distinct from the octahedral Zn2+ site [25, 26].
The extra interlayer Cu2+ defect spins in both of these materials could directly contribute to the magnetic response of the sample, such as enhanced bulk spin susceptibility at low temperatures. In addition, each interlayer defect spin interacts with three nearest neighbor (nn) kagome Cu2+ sites located in each of the two adjacent kagome planes. Furthermore, the structural distortion in the vicinity of the interlayer defects [11, 17, 21, 30] might enhance local spin susceptibility at low temperatures through Dzyaloshinskii-Moriya interaction [9, 10, 13, 19] and/or randomness introduced to the exchange interaction [31, 32, 33]. On the other hand, the upper bound of the concentration of the non-magnetic Zn2+ inter-site defects diluting the magnetic Cu2+ sites within the kagome planes is % in both of these materials [14, 26]. This contradicts with the persisting claim that as much as 5% of kagome Cu sites may be diluted by non-magnetic inter-site Zn2+ defects, which cause local spin singlets accompanied by oscillatory spin density induced in their vicinity [12, 20].
Our earlier NMR measurements in the isotope-enriched single crystal samples of herbertsmithite successfully separated the main NMR peaks from those associated with the nn and the next nearest neighbor (nnn) 2D (nuclear spin ) [15] and 17O (nuclear spin ) [17] sites of the 15% interlayer Cu2+ defect spins. We demonstrated that the Knight shift of the main NMR peak arising from the sites far away from the interlayer defects decreases toward zero. The implication of the diminishing local spin susceptibility far from the defects has been the subject of an intense debate, i.e. whether the proximate kagome QSL realized in herbertsmithite and Zn0.95 is gapped or gapless [11, 12, 15, 17, 24, 20, 21]. On the other hand, the NMR Knight shift at the nn sites of the interlayer defects in herbertsmithite is negative and its magnitude grows with decreasing temperature roughly in proportion to the bulk averaged spin susceptibility [15, 17]. This means that the interlayer defect moments, which are polarized by the external magnetic field applied to conduct NMR measurements, induce a negative hyperfine magnetic field pointing the opposite direction from . In principle, one can probe the spatial extent of the influence of interlayer Cu2+ defect spins on the adjacent kagome planes by investigating the nnn and further 2D and 17O sites. But we were unable to resolve these peaks at low temperatures, because the splitting between the multiple quadrupole-split NMR peaks is obscured by extreme magnetic line broadening with both positive as well as negative .
Very recently, we used inverse Laplace transform (ILT) T1 analysis technique [34, 35, 36, 37, 38, 39, 40, 21, 41] to successfully deduce the density distribution function of the nuclear spin-lattice relaxation rate in herbertsmithite and Zn0.95 [21]. The integral of is normalized to 1, and represents the probability for the nuclear spin to relax with a given value of . In general, probes low energy spin excitations in the form of the wave vector integral of the dynamical electron spin susceptibility at the NMR frequency ,
| (1) |
where is the dependent hyperfine form factor, and is the imaginary part of the dynamical electron spin susceptibility (i.e. spin fluctuations at the resonance frequency ).
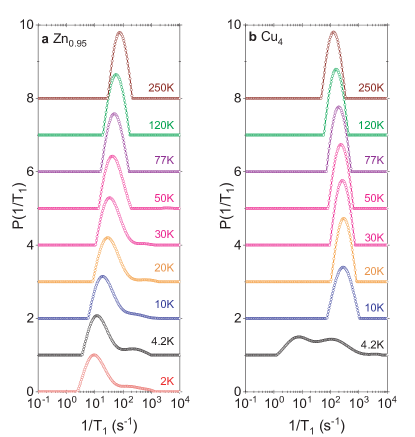
It turned out that the 63Cu nuclear spin-lattice relaxation rate in Zn0.95 develops a bimodal distribution below K due to the gradual emergence of spin singlets with inhomogeneous gap , which has a large distribution ranging from a few K to as high as K [21]. These Cu sites involved in spin singlet formation exhibit diminishing with decreasing temperature, and the absolute upper bound of their volume fraction is %. On the other hand, the remaining Cu sites with the fraction of % or greater do not participate in spin singlet formation, and remain correlated but paramagnetic. These paramagnetic Cu spins exhibit a large and roughly constant s-1, which is typical for gapless excitations of paramagnetic spins coupled by super-exchange interactions, but their origin was not clear.
The aim of this study is to probe the origin, nature, and fraction of these paramagnetic Cu sites based on 19F NMR study of Zn0.95. 19F has a nuclear spin , lacks nuclear quadrupole moment, and hence 19F NMR is immune from nuclear quadrupole interaction that splits and complicates 2D and 17O NMR lineshapes. 19F NMR therefore provides a unique avenue to probe the influence of interlayer defects on the kagome planes. Nonetheless, earlier 19F NMR studies based on the conventional one-dimensional NMR approach [24, 21] did not provide a clear cut picture on the nature of defects in Zn0.95, because the line broadening obscured the distinction between the intrinsic and defect induced phenomena.
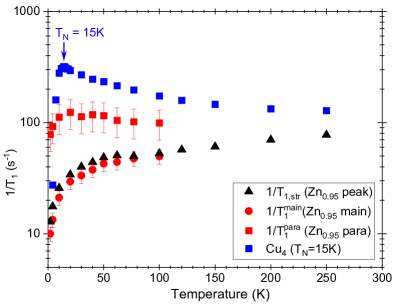
In this paper, we report the development of a two-dimensional NMR data acquisition scheme and its application to 19F NMR measurements in Zn0.95. Instead of separately measuring the position by position variations of and low energy spin excitations from the distributions of the Knight shift and , respectively, we generate a two dimensional correlation map between them. In essence, this procedure allows us to count the number of 19F sites that have certain values of the Knight shift and (i.e. and local spin excitations). We demonstrate that interlayer Cu2+ defect spins induce distinct spin polarized domains at low temperatures, in which 19F sites exhibit similar behavior as in antiferromagnetic barlowite Cu4(OH)6FBr with Néel temperature K (abbreviated as Cu4 hereafter) [42, 43, 44, 45, 46, 47, 48, 25]. The 19F sites in these domains of Zn0.95 detect gapless spin excitations and enhanced induced by interlayer Cu2+ defects spins. The volume fraction of these domains reaches as much as 60% at 2 K despite the low 5% concentration of the interlayer defects in Zn0.95, indicating the gradual spatial growth of these domains at low temperatures.
The rest of this article is organized as follows. We will begin the next RESULTS section with a presentation of the one-dimensional NMR data. We will explain how much one can learn from such conventional NMR data with the aid of ILT, and also their limitations. The following sub-section will develop the two-dimensional NMR data acquisition scheme, and discuss how one can de-convolute the 19F NMR peak into two components with different magnitude of . In the DISCUSSION section, we will compare Zn0.95 and Cu4, and discuss the implications of our findings.
RESULTS
Conventional one-dimensional NMR data and their limitations
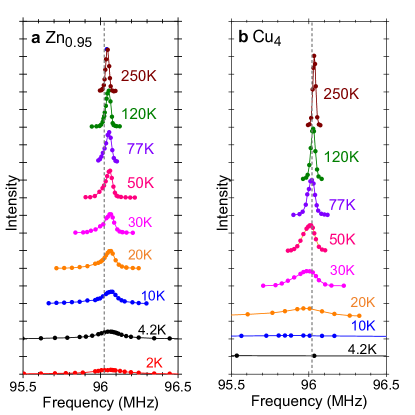
We first summarize the conventional one dimensional 19F NMR results, and their limitations in elucidating the influence of defects. In Fig.2a, we present the representative 19F NMR lineshapes observed for a deuterated, polycrystalline Zn0.95 sample of (Zn0.95Cu0.05)Cu3(OD)6FBr in an external magnetic field of T. The full width at half maximum (FWHM) of the lineshape is as narrow as 26 KHz at 250 K owing to the small nuclear dipole moment of 2D. Upon cooling, the peak frequency of the lineshape slightly increases down to K, then decreases toward the bare resonance frequency MHz marked by the vertical dashed line. is the resonance frequency expected in the absence of hyperfine interactions with electron spins in the lattice, and the nuclear gyromagnetic ratio of 19F nucleus is MHz/Tesla. We can summarize the change of using the NMR Knight shift defined as
| (2) |
where the summation goes over the twelve nn Cu sites of 19F nucleus with local spin susceptibility , is Avogadro’s number, is the positive hyperfine coupling with these nn Cu sites [24], and (%) is a very small and temperature independent chemical shift [24].
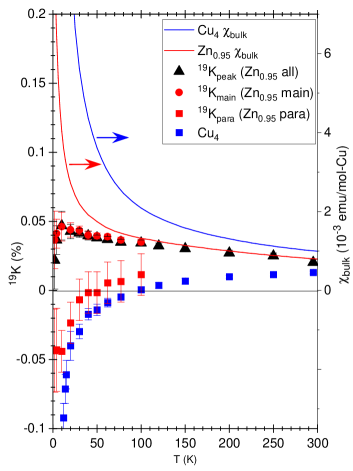
In Fig. 3, we summarize () in comparison to . Our results are similar to the earlier reports in [24] and [21]; begins to decrease below K toward zero. An earlier report fitted the results with an activation form with a gap [24], but we found that large experimental uncertainties of caused by extremely broad lineshapes below 20 K make it rather difficult to rule out a linear temperature dependence expected for the gapless spin liquid picture based on Dirac Fermions [49]. We recall that does not necessarily decrease to zero, unless all the 12 nn Cu sites of a given 19F site form spin singlets; but less than a half of Cu sites are actually involved in spin singlet formation in Zn0.95 [21]. In fact, exhibits a temperature dependence analogous to that of only down to K, where the latter begins to grow. The broad 19F NMR linsehapes observed at low temperatures exhibit long tails stretching hundreds of kHz toward both higher and lower frequencies. This means that a majority of 19F sites sense large, distributed hyperfine magnetic fields with both positive and negative signs, and only a small fraction of 19F sites exhibit diminishing below 20 K.
If there is no magnetic inhomogeneity, we expect for all sites, and hence the NMR lineshape would remain narrow. In other words, the broadening of the lineshape indicates that develops a large distribution below K. Interestingly, this is the same temperature range, where the structural disorder freezes [30] as evidenced by the broadening of the 79Br NQR lineshapes; the oscillation on the transverse relaxation measurements also uncovered the signature of structural dimer formation below K [30].
We also measured at the peak frequency . The magnitude of develops a significant distribution below K where the lattice freezing sets in [21]. Accordingly, we resorted to deduce the stretched-fit value of based on the conventional stretched fit of the recovery curve as follows:
| (3) |
where is the saturated nuclear magnetization, is the change in the nuclear magnetization immediately after the inversion pulse or saturation comb pulses, and is the phenomenological stretched exponent. See Fig. 1g in [21] for the similar results of and the fit. If magnetic inhomogeneity is negligibly small in Zn0.95, we expect . We emphasize that the stretched fit analysis of is convenient but largely empirical, because it implicitly assumes a specific functional form for the density distribution function of [50, 51, 52, 53, 54]. Strictly speaking, it is justifiable only if may be represented with the modified Bessel function of the second kind [54]. Empirically, is often a reasonable approximation of the center of gravity of the true distributed values of as determined from ILT [38, 39, 40, 21, 55], including the present case.
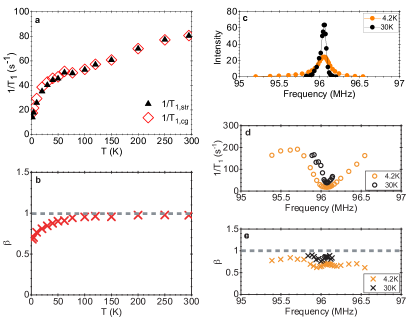
We summarize the temperature dependences of and observed at in Fig.4a and b. These results are very similar to our earlier work conducted in a lower magnetic field 0.72 T [21]. smoothly decreases with temperature, and does not exhibit an activation behavior expected for fully and homogeneously gapped QSL. On the other hand, the power law behavior expected for the gapless QSL formed by Dirac Fermions [49] is not observed, either. A key consideration in interpreting the results is that, again, 19F sites are subjected to the fluctuations of the transferred hyperfine fields from 12 nn Cu2+ sites. Since the absolute upper bound of the fraction of spin singlets occupying the Cu sites is % in Zn0.95 [21], many of the 19F sites are under the influence of paramagnetic Cu spins that are not involved in spin singlets. This explains why the results for as well as do not meet the naive expectations for purely gapped or purely gapless QSL.
We also measured at various frequencies within the extremely broad lineshape. We summarize the representative results of the frequency dependence of and in Fig.4c-e. is larger at both lower and higher frequency sides of the peak. This suggests that the relaxation process at 19F sites in the tailed sections of the broad lineshape is enhanced by low energy spin excitations associated with the source of the hyperfine magnetic fields that gives rise to the line broadening. But we are unable to pinpoint their origin based on these measurements.
Two-dimensional NMR data
Proximate quantum spin liquid materials that do not undergo magnetic long range order are often structurally disordered and exhibit significantly distributed . In our recent work, we overcame the difficulties in conventional NMR data acquisition protocols outlined in the previous section by using the ILTT1 analysis technique [38, 39]. In the ILT analysis of the distributed , one only assumes that has a spatial distribution, and each nuclear spin relaxes exponentially with the j-th value with the probability density . Utilizing Tikhonov regularization, one can optimize the fit of the experimentally observed recovery curve with a summation of single exponentials with distributed ,
| (4) |
where the summation of the probability is normalized to 1. See [36, 38, 39] for the details of the numerical ILT procedures.
In Fig.5a, we summarize representative results deduced for the distribution of in Zn0.95 measured at in T. These results are similar to our previous findings in T [21], and indicate that has a roughly symmetrical distribution above K. The center of gravity of the distribution of summarized in Fig.4a is similar to , as noted above. Below K, begins to develop a tail toward larger values of . This means that some of the 19F nuclear spins resonating around have enhanced , but the majority of 19F nuclear spins around still relax with the slower values comparable to . We emphasize that the conventional stretched fit analysis alone cannot clarify such qualitative changes in the distribution of .
Successful demonstration of the distribution of in Zn0.95 [21] was a major step toward clarifying the nature of disorder in kagome materials. However, we were unable to identify the origin of the 19F sites with enhanced , nor can we estimate their population based on such a one-dimensional NMR data set alone even with ILT. Notice that we were measuring two sets of one-dimensional distributions separately in these measurements: (a) the distribution of the resonant frequency and hence in the form of the NMR lineshape, which provides us with the histogram of the distribution of averaged over 12 Cu2+ sites nn to each 19F site; (b) the distribution of in the form of at the peak frequency . What is still missing is the correlation between the distributions in static local spin susceptibility and local spin dynamics reflected on .
Here, we take one more step forward to clarify the nature of disorder by advancing the ILTT1 analysis technique. In addition to at the peak frequency of the lineshape, we also measure and use ILT to deduce at other frequencies within the broadened lineshape, and thereby correlate the histograms of and distributions. In Fig. 6, we illustrate how this two-dimensional NMR data acquisition scheme works. The top panel Fig. 6a shows the conventional overall NMR lineshape at 30 K. The broad lineshape peaked at MHz represents the histogram of the total hyperfine magnetic field at 19F sites transferred from the 12 nn Cu sites. The result of measured at , which we now represent as to show the specific frequency, is shown in the bottom panel Fig. 6c underneath the peak of the total lineshape in Fig. 6a. Note that this is the same curve at 30 K presented in Fig. 5a, rotated clockwise by 90∘. The integrated area of the as a function of is normalized to 1, as before.
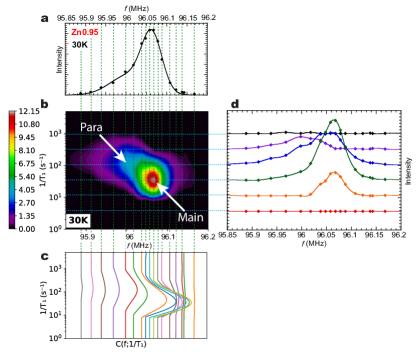
Next, we repeat the measurement of the recovery curves at different frequencies within the broad lineshape, and deduce the corresponding between MHz and 96.15 MHz, as also shown in Fig. 6c. The integrated area of at each frequency is normalized to the relative intensity of the one-dimensional NMR lineshape in Fig.6a. For example, the overall 19F signal intensity at 96.02 MHz in Fig. 6a is only % of the peak intensity at MHz, hence the integrated area of is normalized to . Once we deduce multiple curves across the broad NMR lineshape in panel Fig.6c, we can generate the two-dimensional color contour plot of as a function of both and and normalize its integral in the two-dimensional parameter space to 1. We present the normalized color contour plot of in panel Fig.6b. represents the two-dimensional correlation map between the distributed resonance frequency and the distributed low energy spin excitations reflected on . Therefore, the magnitude of at specific values of and represents the relative probability of a 19F nuclear spin to have particular values of and .
These two-dimensional NMR data of require an order of magnitude longer data acquisition time in comparison to the conventional one-dimensional NMR data, because we need to repeat measurements at various frequencies with high precision required by ILT. But the results of the correlation map provide much richer information. For example, we can slice the color contour map in Fig. 6b horizontally at a given value of , and plot as a function of , as summarized in the right panel Fig. 6d. Then the resulting curves represent the NMR lineshapes for nuclear spins with the specific values of . Unlike the conventional NMR lineshape in panel Fig.6a measured from the sum of all 19F nuclear spins with various values, the NMR lineshapes in Fig. 6d are resolved for different values. We opt to coin them as ILTT1 resolved NMR lineshapes. Notice that the ILTT1 resolved NMR lineshape with s-1 is centered around 96.02 MHz (purple curve in Fig. 6d), whereas the majority of the 19F sites are concentrated around the main peak near 96.05 MHz with much slower values of s-1 (green curve in Fig. 6d). To the best of our knowledge, this is the first time to successfully resolve the inhomogeneously broadened NMR lineshape for different values of , although narrow NMR lineshapes with homogeneous broadening were previously resolved with the aid of fast Fourier transform [56].
Temperature dependence of
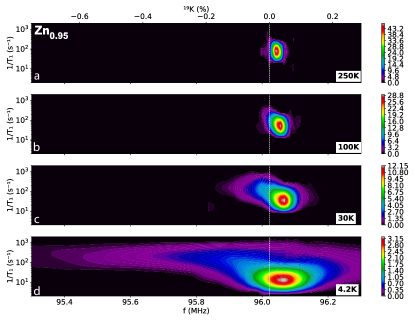
In Fig. 7a-d, we summarize the representative results of observed for Zn0.95 at various temperatures. See Supplemental Materials for the complete set of data. Supplemental files also include a motion picture (movie) summary of the evolution of as a function of temperature. Notice that has a nearly symmetrical oval shape around 250 K, because both and have only a minor distribution centered around their central value. This main peak remains fairly narrow along both the and axes at least down to 10 K. But a distinct component emerges below K on the upper left hand side of the main peak, and gradually splits off. In what follows, we call the emergent side peak with larger values of as the paramagnetic peak for the reasons to become clear below. The two dimensional distribution of the paramagnetic peak continuously grows along the axis toward 2 K, but the growth of the distribution along the axis appears less significant at low temperatures.
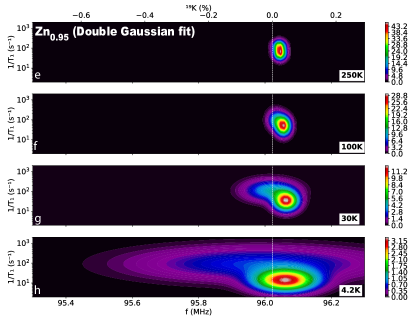
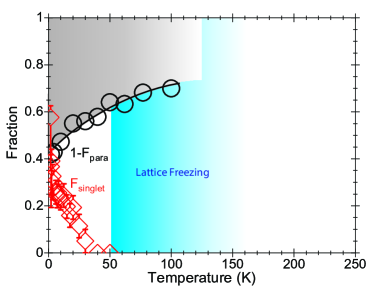
In order to separate the contributions of the main and paramagnetic peaks, we deconvoluted into two separate two-dimensional Gaussian functions of and by conducting the least fit in the two-dimensional parameter space. See Supplementary Materials for the details of the fit. We show the color contour map of the summation of these two Gaussian components in Fig. 7e-h. The two component fit reproduces the experimental data in Fig 7a-d fairly well. The paramagnetic side peak merges into the main peak at higher temperatures, and we were unable to clearly resolve them above 100 K. In Fig. 1d, we summarize the temperature dependence of the fraction of the 19F sites involved in the paramagnetic side peak estimated from the integral of the two-dimensional Gaussian peak in the - space. gradually grows with decreasing temperature, and reaches as large as at 2 K. We emphasize that the faint signature of the paramagnetic side peak seems to persist even at 150 K or above, as shown in Supplemental Figure 3. It is consistent with our earlier finding that the 2D and 17O sites nn to the interlayer defects are distinct even at 295 K in herbertsmithite [15, 17]. On the other hand, the estimation of was difficult above 100 K due to the unstable nature of the two dimensional fit of the small side peak involving a large number of free parameters.
From the central values of the two-dimensional Gaussian function for the paramagnetic peak, we estimated the central values of the distributed and , whereas and were estimated from the two-dimensional Gaussian function of the main peak; we summarize these results in Fig. 3 and Fig. 8. The paramagnetic peak is somewhat asymmetrical along the frequency axis with slightly more weight along the lower frequency side, but this does not significantly affect our estimation of the central value of . The central values of and for the main peak are close to the nominal peak values of the one dimensional data discussed in the previous section.
DISCUSSIONS
Our two-dimensional correlation maps and ILTT1 resolved 19F NMR lineshapes revealed that two distinct types of 19F sites exist in Zn0.95 at low temperatures: (i) 19F sites with characteristic signatures of paramagnetic spins, i.e. enhanced Knight shift due to growing spin polarization, and large temperature independent induced by gapless low energy spin excitations obeying . The volume fraction of these 19F sites reaches as much as % at 2 K, indicating that spin polarized domains gradually extends in space, as schematically shown in Fig. 1c. (ii) The main intrinsic 19F sites that are mostly immune from these effects, suggesting that they are spatially more distanced from the source of the spin polarization and more reflective of the intrinsic behavior of the kagome planes. These two different types of 19F sites become indistinguishable above K within our experimental resolutions.
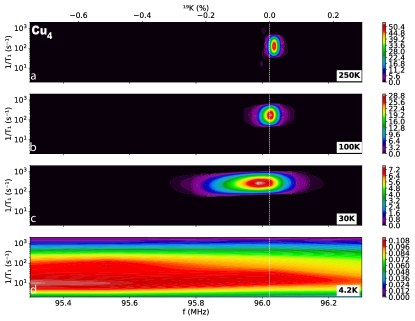
Interestingly, the negative Knight shift of the paramagnetic peak shows qualitatively the same behavior as the negative Knight shift observed at the nn 2D and 17O sites of the 15% interlayer Cu2+ defect spins occupying the Zn2+ sites in herbertsmithite [15, 17]. This strongly suggests that the paramagnetic 19F sites are also located in the vicinity of the 5% interlayer Cu2+ defects of Zn0.95. In order to test this scenario, we repeated two-dimensional 19F NMR measurements in a deuterated powder sample of barlowite Cu4(OD)6FBr. Cu4 is the parent antiferromagnetic phase of Zn0.95 with Cu2+ spins occupying all the interlayer Zn2+ sites in Zn0.95, and undergoes a Néel transition into antiferromagnetically ordered state at K [47, 48, 25].
We summarize the 19F NMR results of Cu4 in Fig.2b, 3, 5b, 8, and 9 in comparison to the results for Zn0.95. Our one-dimensional NMR data for Cu4 are similar to earlier 19F NMR measurements conducted in a limited temperature range below 100 K for a protonated powder sample of Cu4 [47]. Notice that two-dimensional correlation maps of Cu4 in Fig. 9 show no signature of a split-off peak. Instead, Cu4 exhibits only one type of 19F NMR peak in the entire paramagnetic state above ; this is consistent with the crystal structure of Cu4 with a crystallographically unique 19F site.
A striking finding here is that observed for Zn0.95 shows nearly identical behavior as the unique 19F sites in antiferromagnetic Cu4 above , as shown in Fig. 3. This contrasts with the behavior of and reinforces our conclusion that the paramagnetic 19F sites observed for Zn0.95 are in the close proximity with interlayer Cu2+ defects occupying the Zn2+ sites, where the structural and magnetic environment is locally similar to Cu4’s. Since of Cu4 shows strong enhancement below K, naturally one expects analogous enhancement of the local spin susceptibility in the vicinity of Cu2+ interlayer defects of Zn0.95. The negative sign of the hyperfine magnetic field leads to strongly negative in Zn0.95. This further suggests that the conclusions from prior one dimensional 19F NMR studies that neglect the affects of impurities should be reassessed [24].
While our 19F NMR measurements establish the gradual growth of spin polarized domains induced in the vicinity of the Cu2+ interlayer defects, our measurements do not reveal the exact spin configuration in these domains. The growth of staggered spin polarization within the kagome planes was previously proposed to account for the broadening of 17O NMR lineshapes in herbertsmithite, but it was attributed to the Zn2+ anti-site defects within the kagome planes [12, 20]. Our findings here indicate that such spin vacancies within the kagome planes are not required to account for the NMR line broadening in these kagome materials; after all, Cu4 has no Zn2+ ions in its composition. Moreover, the upper bound of the Zn2+ anti-site defect population is as little as % [14, 25]. At high temperatures ( K) dominated by short range spin fluctuations, it is striking that the behavior of Zn0.95 ( and decrease upon cooling) clearly differs from Cu4 ( and increase upon cooling). This hints at an approach to two different ground states.
Another important point to emphasize is that the fraction of the paramagnetic 19F sites in Fig. 1d gradually grows below K to as large as % toward the base temperature of 2 K. In Fig.1c, we use a circle with orange-to-yellow shading to schematically present the spin polarized domain surrounding a Cu2+ defect spin occupying the interlayer Zn2+ site in the middle. Note that 12 19F sites in the field of view belong to the domain out of 20 19F sites, corresponding to 60%. Assuming that the inter-layer defect sites are randomly located without forming a cluster, Fig.1c suggests that kagome Cu2+ sites within the range up to third or fourth nearest-neighbor may be affected by each inter-layer Cu2+ defect spin at 2 K. As decreases at higher temperatures, the range of the spin polarized domain smoothly decreases.
In our recent work, we demonstrated based on 79Br NQR measurements that the crystal structure develops local distortions below K (), and their slow fluctuations freeze below K [30]. That is, the crystal structure of Zn0.95 is locally distorted without breaking the overall ideal kagome rotational symmetry of the lattice. The crystal structure of Cu4 is also distorted at low temperatures, as evidenced by the development of the superlattice structural peak in neutron scattering experiments [25], prior to the drastic growth of below K. It is possible that these paramagnetic domains in Zn0.95 are stabilized and grow in size owing to the local lattice distortion.
Turning our attention to the results in Fig. 8, s-1 observed for the paramagnetic peak of Zn0.95 is nearly temperature independent, and comparable to the high temperature asymptotic value of observed for Cu4. In contrast, Cu4 exhibits a continuous enhancement of with decreasing temperature due to the growth of short range order toward the long range antiferromagnetic order at K. According to Eq.(1), the local dynamical spin susceptibility in the vicinity of the interlayer Cu2+ defects of Zn0.95 therefore grows slowly as . This means that gapless low energy spin excitations exist locally in the vicinity of interlayer Cu2+ defects. We emphasize, however, that these gapless spin excitations in Zn0.95 are driven by the presence of interlayer defects and their influence on local magnetic and structural environments of the kagome planes, and should not be confused with the intrinsic gapless spin excitations expected for certain theoretical models of pristine kagome spin liquids [49, 57].
In this context, it is worth recalling that some gapless spin liquid models predict a power law behavior in the temperature dependence of [49]. The recent 17O results [20] as well as our initial 63Cu results [11] for herbertsmithite, both deduced from the empirical analysis of due to extremely large distributions of , appeared to confirm such expectations of a power law behavior. However, our recent ILTT1 analysis of observed at 63Cu sites showed that such an apparent power law temperature dependence previously proposed for herbertsmithite is purely fictitious [21]. Cu sites exhibit either gapped spin singlet behavior with activation type temperature dependence of or paramagnetic behavior with large, nearly temperature independent s-1. The latter is qualitatively similar to observed here at paramagnetic 19F sites. This suggests that the paramagnetic 63Cu sites observed for both Zn0.95 and herbertsmithite [21] may be also located in the same spin polarized domains observed here.
The absence of the signature of critical slowing down or spin freezing at 15 K for implies that the dimensions of the spin polarized domain remain finite. Assuming that these domains are centered around 5% interlayer defect spins, % at 2 K implies that the domains grow in space but span only a few triangles from defects, as schematically shown in Fig. 1c. The significant fraction % at 2 K with strongly enhanced also implies that, as far as the low energy spin excitations probed by NMR are concerned, one can expect to find the intrinsic kagome spin liquid behavior associated with spin singlet formation only in % or less of the sample volume. In Fig. 10, we show the temperature dependence of together with the upper bound of the spin singlet fraction as determined by 63Cu NQR measurements [21]. Indeed the upper bound in Zn0.95 is limited by the fraction of non-paramagnetic domains without spin polarization induced in the vicinity of interlayer Cu2+ defects. We recall that is an upper bound [21] and could easily be overestimated by a factor of due to difficulties in accounting for the transverse relaxation effects, but the magnitude of is still significant in comparison to %.
In conclusion, we have found two distinct magnetic signatures in the quantum spin liquid candidate Zn-barlowite, Zn0.95. One signature arises from domains that are nearest to interlayer Cu2+ impurities, and the local susceptibility and spin-lattice relaxation rate are similar to the paramagnetic state above of the antiferromagnetic parent compound barlowite, Cu4. The other signature arises from regions far from the impurities and therefore more closely reflects the intrinsic behavior of the kagome spins, where spin singlets gradually emerge with spatially inhomogeneous gaps [21]. Finally, it may be also interesting to apply the one- and two-dimensional NMR techniques based on ILT to other kagome spin liquid and related materials, which are known to exhibit distributions in their NMR properties [58, 59, 60]. Moreover, our approach might yield fresh insight into the distributions in local magnetic properties in unrelated disordered materials, such as diluted magnets [52] and heavy Fermions [53].
METHODS
We synthesized the deuterated (D = 2H) powder samples of ZnCu3(OD)6FBr and Cu4(OD)FBr based on the procedures described in detail in [25]. We confirmed the sample quality based on powder X-ray diffraction measurements. We conducted the spin echo 19F NMR measurements using standard pulsed NMR spectrometers. We conducted most of the measurements by applying saturation comb pulses prior to the spin echo sequence, and confirmed that the results are the same if we use an inversion pulse instead. The pulse separation time between the 90∘ and 180∘ pulses were 10 s to ensure that we do not overlook any signals with faster transverse relaxation time. We carried out the inverse Laplace transform of the recovery curve based on Tikhonov regularization using a fixed regularization parameter rather than optimizing at different temperatures and frequencies. This ensured that the effective resolution of ILT remains unchanged between different sets of measurements.
DATA AVAILABILITY
The data sets generated and/or analyzed during the current study are available from the corresponding author on reasonable request.
ACKNOWLEDGMENTS
The work at McMaster was supported by NSERC. P.M.S. was supported by the Rice University Consortium for Processes in Porous Media. The work at Stanford and SLAC (sample synthesis and characterization) was supported by the U.S. Department of Energy (DOE), Office of Science, Basic Energy Sciences, Materials Sciences and Engineering Division, under contract no. DE-AC02-76SF00515. R.W.S. was supported by a NSF Graduate Research Fellowship (DGE-1656518).
AUTHOR CONTRIBUTIONS
WY and J. Wang made equal contributions. TI and YSL planned the project. RWS, J. Wen, and YSL grew and characterized the samples. WY, J. Wang, PMS, and TI carried out NMR measurements and analyzed the data. TI and J. Wang wrote the manuscript with the input from all authors.
COMPETING INTERESTS
The Authors declare no Competing Financial or Non-Financial Interests.
References
- [1] Balents, L. Spin liquids in frustrated magnets. Nature 464, 199–208 (2010).
- [2] Norman, M. R. Colloquium: Herbertsmithite and the search for the quantum spin liquid. Rev. Mod. Phys. 88, 041002 (2016).
- [3] Zhou, Y., Kanoda, K. & Ng, T.-K. Quantum spin liquid states. Rev. Mod. Phys. 89, 025003 (2017).
- [4] Broholm, C. et al. Quantum spin liquids. Science 367, eaay0668 (2020).
- [5] Imai, T. & Lee, Y. S. Do quantum spin liquids exist? Phys. Today 69, 30–36 (2016).
- [6] Shores, M. P., Nytko, E. A., Bartlett, B. M. & Nocera, D. G. A structurally perfect S=1/2 kagomé antiferromagnet. J. Am. Chem. Soc. 127, 13462–13463 (2005).
- [7] Helton, J. S. et al. Spin dynamics of the spin- kagome lattice antiferromagnet . Phys. Rev. Lett. 98, 107204 (2007).
- [8] Mendels, P. et al. Quantum magnetism in the paratacamite family: Towards an ideal kagomé lattice. Phys. Rev. Lett. 98, 077204 (2007).
- [9] Rigol, M. & Singh, R. R. P. Magnetic susceptibility of the kagome antiferromagnet . Phys. Rev. Lett. 98, 207204 (2007).
- [10] Rigol, M. & Singh, R. R. P. Kagome lattice antiferromagnets and Dzyaloshinsky-Moriya interactions. Phys. Rev. B 76, 184403 (2007).
- [11] Imai, T., Nytko, E. A., Bartlett, B. M., Shores, M. P. & Nocera, D. G. , , and NMR in the kagome lattice . Phys. Rev. Lett. 100, 077203 (2008).
- [12] Olariu, A. et al. NMR study of the intrinsic magnetic susceptibility and spin dynamics of the quantum kagome antiferromagnet . Phys. Rev. Lett. 100, 087202 (2008).
- [13] Zorko, A. et al. Dzyaloshinsky-Moriya anisotropy in the spin-1/2 kagome compound . Phys. Rev. Lett. 101, 026405 (2008).
- [14] Freedman, D. E. et al. Site specific X-ray anomalous dispersion of the geometrically frustrated kagomé magnet, herbertsmithite, ZnCu3(OH)6Cl2. J. Am. Chem. Soc. 132, 16185–16190 (2010).
- [15] Imai, T., Fu, M., Han, T. H. & Lee, Y. S. Local spin susceptibility of the kagome lattice in ZnCu3(OD)6Cl2. Phys. Rev. B 84, 020411 (2011).
- [16] Han, T.-H. et al. Fractionalized excitations in the spin-liquid state of a kagome-lattice antiferromagnet. Nature 492, 406–410 (2012).
- [17] Fu, M., Imai, T., Han, T.-H. & Lee, Y. S. Evidence for a gapped spin-liquid grond state in a kagome Heisenberg anitiferromagnet. Science 350, 655 – 658 (2015).
- [18] Sherman, N. E., Imai, T. & Singh, R. R. P. Nuclear relaxation rates in the herbertsmithite kagome antiferromagnets . Phys. Rev. B 94, 140415 (2016).
- [19] Zorko, A. et al. Symmetry reduction in the quantum kagome antiferromagnet herbertsmithite. Phys. Rev. Lett. 118, 017202 (2017).
- [20] Khunita, P. et al. Gapless ground state in the archetypal quantum kagome antiferromagnet ZnCu3(OH)6Cl2. Nat. Phys. 16, 469 (2020).
- [21] Wang, J. et al. Emergence of spin singlets with inhomogeneous gaps in the kagome lattice Heisenberg antiferromagnets Zn-barlowite and herbertsmithite. Nat. Phys. 17, 1109–1113 (2021).
- [22] Huang, Y. Y. et al. Heat transport in herbertsmithite: Can a quantum spin liquid survive disorder? Phys. Rev. Lett. 127, 267202 (2021).
- [23] Murayama, H. et al. Universal scaling of the specific heat in S=1/2 quantum kagome antiferromagnet herbertsmithite. arXiv:2106.07223 (2021).
- [24] Feng, Z. et al. Gapped spin-1/2 spinon excitations in a new kagome quantum spin liquid compond Cu3Zn(OH)6FBr. Chin. Phys. Lett. 34, 077502 (2017).
- [25] Smaha, R. W. et al. Materializing rival ground states in the barlowite family of kagome magnets: quantum spin liquids, spin ordered, and valence bond crystal states. npj Quantum Materials 5, 23 (2020).
- [26] Smaha, R. W. et al. Site-specific structure at multiple length scales in kagome quantum spin liquid candidates. Phys. Rev. Materials 4, 124406 (2020).
- [27] Tustain, K. et al. From magnetic order to quantum disorder: a SR study of the Zn-barlowite series of S=1/2 kagomé antiferromagnets, ZnxCu4-x(OH)6FBr. npj Quantum Materials 5, 74 (2020).
- [28] Wei, Y. et al. Magnetic phase diagram of Cu4-xZnx(OH)6FBr studied by neutron-diffraction and SR techniques. Chin. Phys. Lett. 37, 107503 (2020).
- [29] Fu, Y. et al. Dynamic fingerprint of fractionalized excitations in single-crystalline Cu3Zn(OH)6FBr. Nat. Comm. 12, 3048 (2021).
- [30] Wang, J. et al. Freezing of the lattice in the kagome lattice Heisenberg antiferromagnet Zn-barlowite . Phys. Rev. Lett. 128, 157202 (2022).
- [31] Shimokawa, T., Watanabe, K. & Kawamura, H. Static and dynamical spin correlations of the random-bond antiferromagnetic Heisenberg model on the triangular and kagome lattices. Phys. Rev. B 92, 134407 (2015).
- [32] Kimchi, I., Sheckelton, J. P., McQueen, T. M. & Lee, P. Scaling and data collapse from local moments in frustrated disordered quantum spin systems. Nat. Comm. 9, 4367 (2018).
- [33] Kawamura, H. & Uematsu, K. Nature of the randomness-induced quantum spin liquids in two dimensions. J. of Physics: Cond. Matt. 31, 504003 (2019).
- [34] Song, Y. Q. et al. - correlation spectra obtained using a fast two-dimensional Laplace inversion. J. of Magn. Res. 154, 261–268 (2002).
- [35] Venkataramanan, L., Song, Y. Q. & Hurlimann, M. D. Solving Fredholm integrals of the first kind with tensor product structure in 2 and 2.5 dimensions. IEEE Trans. Sig. Process. 50, 1017–1026 (2002).
- [36] Mitchell, J., Chandrasekera, T. C. & Gladden, L. Numerical estimation of relaxation and diffusion distributions in two dimensions. Prog. Nucl. Magn. Reson. Spect. 62, 34–50 (2012).
- [37] Singer, P. M., Asthagiri, D., Chapman, W. G. & Hirasaki, G. J. NMR spin-rotation relaxation and diffusion of methane. J. Chem. Phys. 148, 164507 (2018).
- [38] Singer, P. M., Arsenault, A., Imai, T. & Fujita, M. NMR investigation of the interplay between lattice, charge, and spin dynamics in the charge-ordered high- cuprate . Phys. Rev. B 101, 174508 (2020).
- [39] Arsenault, A., Imai, T., Singer, P. M., Suzuki, K. M. & Fujita, M. Magnetic inhomogeneity in charge-ordered studied by NMR. Phys. Rev. B 101, 184505 (2020).
- [40] Takahashi, S. K. et al. Spin excitations of a proximate Kitaev quantum spin liquid realized in . Phys. Rev. X 9, 031047 (2019).
- [41] Wang, J. et al. NMR investigation on the honeycomb iridate . Phys. Rev. B 103, 214405 (2021).
- [42] Han, T.-H., Singleton, J. & Schlueter, J. A. Barlowite: A spin- antiferromagnet with a geometrically perfect kagome motif. Phys. Rev. Lett. 113, 227203 (2014).
- [43] Jeschke, H. O. et al. Barlowite as a canted antiferromagnet: theory and experiment. Phys. Rev. B 92, 094417 (2015).
- [44] Liu, Z., Zou, X., Mei, J.-W. & Liu, F. Selectively doping barlowite for quantum spin liquid: A first-principles study. Phys. Rev. B 92, 220102 (2015).
- [45] Han, T.-H., Isaacs, E. D., Schlueter, J. A. & Singleton, J. Anisotropy: Spin order and magnetization of single-crystalline barlowite. Phys. Rev. B 93, 214416 (2016).
- [46] Guterding, D., Valentí, R. & Jeschke, H. O. Reduction of magnetic interlayer coupling in barlowite through isoelectronic substitution. Phys. Rev. B 94, 125136 (2016).
- [47] Ranjith, K. M. et al. Magnetic resonance as a local probe for kagomé magnetism in barlowite Cu4(OH)6FBr. Sci. Rep. 8, 10851 (2018).
- [48] Tustain, K., Nilsen, G. J., Ritter, C., da Silva, I. & Clark, L. Nuclear and magnetic structures of the frustrated quantum antiferromagnet barlowite, . Phys. Rev. Materials 2, 111405 (2018).
- [49] Ran, Y., Hermele, M., Lee, P. A. & Wen, X.-G. Projected-wave-function study of the spin- Heisenberg model on the kagomé Lattice. Phys. Rev. Lett. 98, 117205 (2007).
- [50] Thayamballi, P. & Hone, D. Nuclear relaxation in a randomly diluted Heisenberg paramagnet. Phys. Rev. B 21, 1766–1773 (1980).
- [51] Lindsey, C. P. & Patterson, G. D. Detailed comparison of the Williams–Watts and Cole–Davidson functions. J. Chem. Phys. 73, 3348–3357 (1980).
- [52] Itoh, M., Yasuoka, H., King, A. R. & Jaccarino, V. Decay of the nuclear magnetization in the randomly diluted antiferromagnets FexZn1-xF2 and MnxZn1-xF2. J. Phys. Soc. Jpn. 55, 964–972 (1986).
- [53] Johnston, D. C. et al. Dynamics of magnetic defects in heavy fermion from stretched exponential NMR relaxation. Phys. Rev. Lett. 95, 176408 (2005).
- [54] Johnston, D. C. Stretched exponential relaxation arising from a continuous sum of exponential decays. Phys. Rev. B 74, 184430 (2006).
- [55] Mitrović, V. F. et al. Similar glassy features in the NMR response of pure and disordered . Phys. Rev. B 78, 014504 (2008).
- [56] Sun, B. & Dunn, K. Two-dimensional nuclear magnetic resonance petrophysics. MAGNETIC RESONANCE IMAGING 23, 259–262 (2005). 7th International Conference on Magnetic Resonance in Porous Media (MRPM7), Palaiseau, FRANCE, JUL 04-08, 2004.
- [57] Liao, H. J. et al. Gapless spin-liquid ground state in the kagome antiferromagnet. Phys. Rev. Lett. 118, 137202 (2017).
- [58] Kermarrec, E. et al. Spin dynamics and disorder effects in the kagome Heisenberg spin-liquid phase of kapellasite. Phys. Rev. B 90, 205103 (2014).
- [59] Klanjsek, M. et al. A high-temperature quantum spin liquid with polaron spins. Nat. Phys. 13, 1130–1134 (2017).
- [60] Lu, F. et al. The observation of quantum fluctuations in a kagome Heisenberg antiferromagnet. Communications Physics 5, 272 (2022).