\ul
Out-of-Distribution Detection for LiDAR-based 3D Object Detection
Abstract
3D object detection is an essential part of automated driving, and deep neural networks (DNNs) have achieved state-of-the-art performance for this task. However, deep models are notorious for assigning high confidence scores to out-of-distribution (OOD) inputs, that is, inputs that are not drawn from the training distribution. Detecting OOD inputs is challenging and essential for the safe deployment of models. OOD detection has been studied extensively for the classification task, but it has not received enough attention for the object detection task, specifically LiDAR-based 3D object detection. In this paper, we focus on the detection of OOD inputs for LiDAR-based 3D object detection. We formulate what OOD inputs mean for object detection and propose to adapt several OOD detection methods for object detection. We accomplish this by our proposed feature extraction method. To evaluate OOD detection methods, we develop a simple but effective technique of generating OOD objects for a given object detection model. Our evaluation based on the KITTI dataset shows that different OOD detection methods have biases toward detecting specific OOD objects. It emphasizes the importance of combined OOD detection methods and more research in this direction.
I Introduction
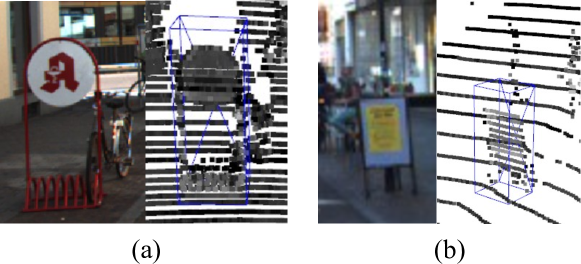
3D object detection is a crucial part of autonomous vehicles (AVs). However, state-of-the-art (SOTA) LiDAR-based 3D object detection methods rely on deep neural networks [1, 2, 3], which are susceptible to the out-of-distribution (OOD) problem: they can make predictions with high confidence given an input not drawn from the training distribution (not ID). It poses a safety concern that can hinder the deployment of AVs on public roads. For instance, misdetection of a bike rack or signboard on the roadside as a pedestrian (as shown in Figure 1) can cause the AV to apply a hard brake or other potentially dangerous evasive maneuvers. OOD detection [4] aims to detect such cases.
OOD detection in the context of 3D object detection has hardly been explored. Existing OOD detection research focuses mainly on image classification [4, 5, 6, 7, 8, 9, 10, 11, 12, 13, 14, 15, 16] or segmentation tasks [17, 18, 19, 20]. However, there are challenges unique to the object detection task that such methods do not address.
The definition of OOD in classification cannot be directly applied to object detection. In classification, the training distribution consists of a finite set of classes, and samples belonging to other classes are considered as OOD. For example, for the MNIST handwritten digit dataset [21], any image that does not contain handwritten digit is OOD. In object detection, however, in addition to a finite number of foreground (FG) classes, the model is also trained on a highly heterogeneous background (BG) class which includes all objects that do not belong to the FG classes. Since the union of FG and BG classes includes all possible objects, using the same OOD definition from classification would imply that all objects are ID and no object is OOD.
Furthermore, in contrast to image classification, inputs to object detection may contain multiple objects. It brings an extra challenge for OOD detection methods that rely on raw inputs or feature maps. While OOD detectors for classification can use the entire input or feature map, object detectors may produce an arbitrary number of predictions per input, and thus the OOD detectors need to extract inputs or features associated with each prediction.
Lastly, evaluating OOD detection methods requires access to OOD samples. OOD samples can be easily obtained for the classification task but not as straightforward for object detection due to sensor incompatibility between datasets and lack of labels. It means point clouds from different LiDAR sensors can differ significantly in terms of beam arrangement and intensity values, making it difficult to directly utilize data from different datasets. Moreover, LiDAR-based 3D object detection datasets only provide labels for a handful of foreground classes relevant to autonomous driving (e.g., cars, pedestrians, and cyclists). This makes it challenging to gather diverse OOD objects from existing datasets even though the LiDAR sensors are compatible. In order to tackle aforementioned challenges:
-
1.
We propose a definition of OOD for object detection. Our analysis of OOD detection for object detection identifies six types of OOD objects with respect to the FG classes. We focus on the three of them for which the detector produces detections.
-
2.
We adapt and extend six existing OOD detection methods from classification to object detection. We design a feature extraction method for individual objects for methods that require a feature map as input.
-
3.
We propose a simple yet effective method to generate OOD objects to augment the existing dataset and extensively evaluate our proposed OOD detection methods.
-
4.
We evaluate our OOD detection and object generation methods and demonstrate that different OOD detection methods have biases toward detecting specific types of OOD objects. Thus, the best practices previously identified for OOD detection in image classification may not hold in all cases.
As far as we are aware, we are the first to explore OOD detection for LiDAR-based 3D object detection and we wish to aid and stimulate future research on this exciting topic.
II Related work
II-A LiDAR-based 3D Object Detection
The goal of LiDAR-based 3D object detection is to produce 3D bounding boxes for the objects using LiDAR point cloud input. Many architectures have been proposed to detect 3D objects based on raw point cloud, voxelized point cloud, or both [22, 3, 23, 2].
In this work, we adopt PointPillars [3] as our object detector. PointPillars first voxelizes point cloud input into vertical pillars and extracts pillar features using PointNet [24]. The pillar features are then processed by a 2D convolutional backbone, followed by classification and regression heads to generate the final predictions. We choose PointPillars due to its good performance and low computational cost, which are essential for resource-constrained and safety-critical systems.
II-B Out-of-Distribution Detection
OOD detection has been investigated extensively under terms such as anomaly detection, novelty detection or open-set classificaiton [4]. The majority of existing work focuses on classification [5, 6, 7, 8, 9, 10, 11, 12, 13, 14, 15, 16], with some recent work on image segmentation [17, 18, 25, 19, 20].
Hendrycks and Gimpel [9] propose a baseline method for detecting OOD inputs for deep image classifiers using max-softmax scores. ODIN [5] further improves the baseline by applying temperature scaling and input perturbation. Hsu et al. [16] propose Generalized-ODIN, removing the need for OOD data for tuning. Lee et al. [12] propose to train jointly a classifier and a GAN network that generates OOD samples for training the classifier. Further, Lee et al. [8] use Mahalanobis distance of the input sample to the nearest class-conditional Gaussian distribution estimated from the in-distribution data as the sample’s OOD score.
One-class classifiers such as OC-SVM [26] have been successfully applied to OOD detection as well. Recently, Abdelzad et al. [27] propose to use an OC-SVM trained with features extracted from an optimal layer to detect OOD samples. It shows that features from earlier layers work well for OOD detection in image classification. Bishop [28] suggests that a natural way to detect OOD samples is to estimate the density of ID samples and check if samples are in a low density area. Some works [29, 30, 31, 32, 10] also use generative models [33, 7, 34] to detect OOD samples.
Several works in image segmentation [17, 18, 19, 20] have adapted OOD detection methods from image classification for OOD detection at pixel level. They aim to reject the OOD pixels and improve segmentation performance.
In the automotive domain, Blum et al. [25] create a dataset to benchmark OOD detection for image segmentation. Nitsch et al. [35] evaluates OOD detection for image detection applied to image patches. The OOD detector is trained on KITTI and Nuscenes and tested in ImageNet. Wong et al. [36] propose a method to tackle open set semantic segmentation in the 3D point cloud. The method can recognize and segment known and unknown classes in 3D point clouds.
III Out-of-Distribution in Object Detection
In this section, we propose a classification for ID and OOD objects in the context of object detection and provide examples for each case.
III-A Assumptions
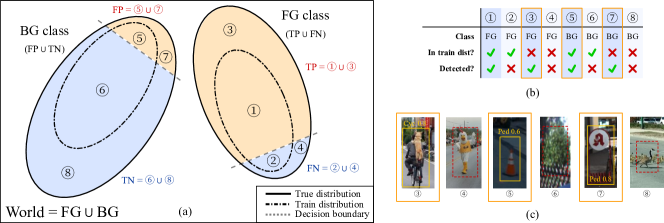
True Distributions: In object detection, all objects can be categorized as either foreground (FG) or background (BG) objects. FG classes are what the object detector is trained to detect, and BG classes are what the object detector is trained to ignore. We assume the existence of true distributions for FG and BG objects as indicated by the solid-line ovals in Figure 2a. For the sake of simplicity, but without loss of generality, we only consider a single FG class and a single BG class.
Training Distributions: FG or BG objects can be underrepresented in the training dataset due to the size of the dataset and how the data is collected. For instance, a dataset collected exclusively in Europe would not contain objects that are not sold in Europe. It results in a different distribution which we refer to as the training distribution (dashed ovals in Figure 2a).
Decision Boundary: Given a training dataset, the object detector learns a decision boundary that separates the FG and BG objects (dashed lines in Figure 2a). We assume this decision boundary is not perfect due to the inherent ambiguity between FG and BG objects (i.e., aleatoric uncertainty) and the shift between training distributions and true distributions (i.e., epistemic uncertainty). The decision boundary thus intersects the distributions which results in four types of detections: true positive (TP), false positive (FP), false negative (FN), and true negative (TN).
III-B Types of ID and OOD Objects:
As shown in Figure 2a and Figure 2b, we can divide all objects into eight categories based on 1) if they are FG or BG, 2) if they are represented by the training distribution, and 3) if they are detected by the object detector. We show examples for the OOD categories in Fig. 2c. The categories are as follows.
-
\footnotesize{\arabicenumi}⃝
Detected FG objects in the training distribution.
-
\footnotesize{\arabicenumi}⃝
Missed FG objects in the training distribution.
-
\footnotesize{\arabicenumi}⃝
Detected FG objects out of the training distribution. E.g., an unusual cyclist with a dog on his back correctly detected by the detector.
-
\footnotesize{\arabicenumi}⃝
Missed FG objects out of the training distribution. E.g., a person wearing costume not detected by the detector.
-
\footnotesize{\arabicenumi}⃝
BG objects (in training distribution) misdetected as FG. E.g., a common traffic cone detected as a pedestrian.
-
\footnotesize{\arabicenumi}⃝
Undetected BG objects (in training distribution). E.g., a common bush not detected as any FG object.
-
\footnotesize{\arabicenumi}⃝
BG objects (out of training distribution) misdetected as FG. E.g., an uncommon bike rack detected as a person.
-
\footnotesize{\arabicenumi}⃝
Undetected BG objects (out of training distribution). E.g., an uncommon goose not detected as any FG object.
In object detection, the goal is to detect FG objects, and BG objects are not localized. Thus, we define OOD objects for the FG training distribution, which are \footnotesize3⃝-\footnotesize8⃝. Objects in \footnotesize3⃝-\footnotesize4⃝ include underrepresented or unseen FG objects, and \footnotesize5⃝-\footnotesize8⃝ represent all BG objects that should not be detected by the object detector.
In this work, we only focus on detecting objects of type \footnotesize3⃝, \footnotesize5⃝, and \footnotesize7⃝, and do not consider objects of one FG class as OOD for another FG class. Detecting \footnotesize4⃝ is covered in the field of FN detection [37, 38] and is out of the scope of this paper. Type \footnotesize6⃝ and \footnotesize8⃝ are undetected BG objects, and thus do not affect the performance of the object detector and other downstream tasks. We leave detecting these types of OOD objects as future work as it would still be beneficial to detect these cases for data collection and other purposes.
IV OOD Point Cloud Generation
In this section, we describe our proposed method for generating point clouds with OOD objects. Our method inserts OOD objects into existing point clouds,which can be used to evaluate OOD detection methods for LiDAR-based 3D object detection.
We first build an OOD object database consisting of synthetic and real point clouds of individual OOD objects using LiDAR simulation and real sensor data from other compatible datasets. The intensity values for the object point clouds are adjusted to match the intensity distribution of the target dataset (i.e, in-distribution dataset). As discussed previously, we focus on objects of type \footnotesize3⃝, \footnotesize5⃝, or \footnotesize7⃝ defined in Section III.
To construct a point cloud with OOD objects, we first randomly sample an OOD object point cloud from the OOD object database and a scene point cloud from the target dataset. Then, we insert the OOD object into the scene via concatenation. We do not simulate “shadows” caused by occlusions during insertion, since the object detector is already exposed to similar object insertions as part of the augmentations during training.
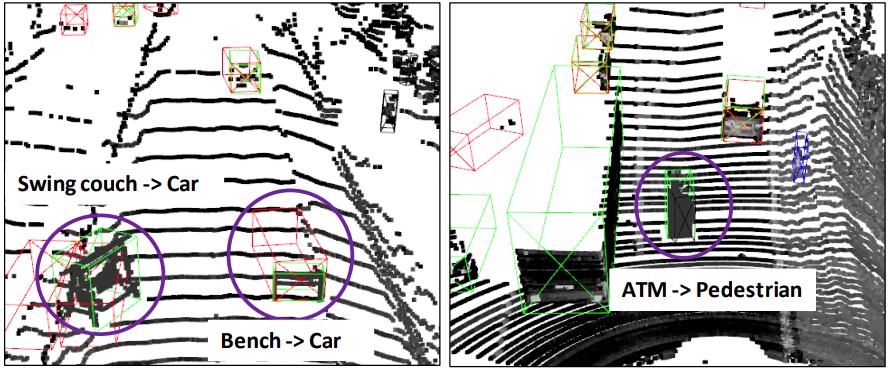
During insertion, we preserve the OOD object’s original distance to sensor to keep the point cloud density consistent with its location, but we randomly select the azimuth with respect to the sensor for more diversity. We further make sure that 1) the inserted OOD object does not overlap with any existing objects, 2) the inserted OOD object can be detected by the object detector with a confidence score greater than some threshold , and 3) the predictions for the original objects in the scene are not impacted by the new OOD object. It is because low confidence predictions can be easily filtered out by the object detector using its score threshold. As a result, point clouds generated using this method are tailored to a specific model. However, in practice we observed that both synthetic and real OOD objects used in this work can be consistently misdetected by multiple models. Figure 3 shows some examples of the resulting point clouds. We can see that the object detector misdetects the inserted OOD objects as FG objects. The code for OOD dataset generation will be released after this paper is published.
Note that the dataset splitting method [39] for generating an OOD dataset for object detection is not applicable in our context. In contrast to image-based object detection datasets such as COCO [40] and PASCAL [41], datasets for LiDAR-based 3D object detection, such as KITTI [42], Waymo [43], and NuScenes [44], contain only a handful of labeled classes that are relevant to autonomous driving. Furthermore, unknown objects in [39] are not guaranteed to be detected by the object detector.
V OOD Detection for 3D Object Detection
We adapt five OOD detection methods from classification to LiDAR-based 3D object detection, namely, max-softmax [9], uncertainty estimation (predictive entropy, aleatoric entropy and mutual information) [15], Mahalanobis distance [8], OC-SVM [26], and normalizing flows [45]. Among these methods, Mahalanobis distance, OC-SVM, and normalizing flows can be applied to intermediate features. We propose a feature extraction method for object detection and evaluate the quality of feature maps extracted from various layers for OOD detection.
V-A Feature Extraction
Feature extraction for the object detection task is different from classification since each input can produce an arbitrary number of predictions. Thus, using the entire feature map may inadvertently include features from other predictions or environmental objects. Instead, we identify a single feature vector within each feature map for each prediction.
In this work, we use PointPillars [3] as our object detector. In PointPillars, a set of predefined anchor boxes is assigned to each pixel in the backbone feature map. Labels and regression targets are assigned to the anchor boxes based on the overlap with FG objects. To train the OOD detection methods, we first identify the anchor boxes with positive FG labels. We then extract feature vectors at their corresponding pixel locations in the feature map. It is possible for one object to correspond to multiple feature vectors during training, in which case we treat them as independent training samples and do not perform any aggregation. During testing, we identify the anchors from which the final predictions are generated and use their corresponding feature vector in the feature map for OOD prediction.
In addition to the final backbone feature map, we also extract features from three intermediate layers after each convolution block in the backbone, which we denote conv2x, conv4x and conv8x. For feature maps that are smaller than the backbone feature map where the anchor boxes are defined, we apply nearest neighbors upsampling and use the aforementioned method to extract feature vectors for training and testing.
V-B OOD Detection Methods
Max-softmax: we follow previous work [9] and consider the maximum predicted class probability as the baseline method for OOD detection. Lower max-softmax score indicates the prediction is more likely to be an OOD object.
Uncertainty estimates: aleatoric and epistemic uncertainty estimates can be used as the OOD score [15]. Similar to previous work by Feng et al. [46], we modify the 3D object detector to obtain uncertainty estimates via MC-Dropout [47].
Mahalanobis distance: the Mahalanobis distance (in logit / feature space) measures the distance between a sample and class-conditional Gaussian distributions estimated from in-distribution data. It has been used to detect OOD samples in classification task [8]. In this work, we adopt this method to 3D object detection and experiment with logit layer and multiple feature layers.
OC-SVM: OC-SVM learns a decision boundary between in-distribution data and the origin in Hilbert space that maxizes the distance between the origin and the decision boundary [26]. The signed distance from the sample to the decision boundary can be used for OOD detection. Similar to Mahalanobis distance, OC-SVM can be applied to logit / feature space.
Normalizing flows: normalizing flows is a density estimation method [7]. It aims to learn a series of differentiable bijections that map complex distributions of observed data to simple distributions of latent variables. Normalizing flows can output log probabilities of the input sample. A well-trained normalizing flows model will assign high log-likelihoods for ID samples and low log-likelihoods for OOD samples. Therefore, predicted log-likelihoods can be used as an OOD score. In this work, we use RealNVP [45] in feature space as an efficient method to learn the density of features associated with ID samples.
VI Evaluation
VI-A Experimental Setup
Dataset: we use the KITTI dataset [42], which has 7481 frames with annotated 3D bounding boxes. We split the official dataset into training and validation splits (3712 and 3769 samples, respectively) [3]. We use the training split for training object detectors and extracting feature maps for the OOD detection methods.
Object detector: we train a PointPillars model for three foreground classes: Car, Pedestrian, and Cyclist. To estimate classification uncertainty using MC-Dropout [47], we add one dropout layer with dropout probability of 0.5 after each deconvolution block. The classification head is also modified to output softmax distribution instead of sigmoid scores. The performance of the modified model is on par with vainilla PointPillars.
OOD evaluation datasets: we use the method described in Section IV with detection threshold to generate OOD object datasets. We gather OOD objects from different sources to insert into the KITTI dataset. For synthetic objects, we use the Carla simulation [48]. For real objects, we use the KITTI ignored objects, the KITTI False Positive (FP) objects, and weird vehicle objects from the Waymo dataset. The KITTI FP objects are background objects classified as Pedestrians (see Figure 1). We manually label and categorize them into five classes: potted plant, bike rack, low traffic sign, sidewalk sign, and thin sign. We manually identify objects among the Waymo vehicle class that are not FG in KITTI, including motorcycle, scooter, digger and excavator. Figure 3 depicts examples of Carla objects inserted in scenes and detected by the object detector.
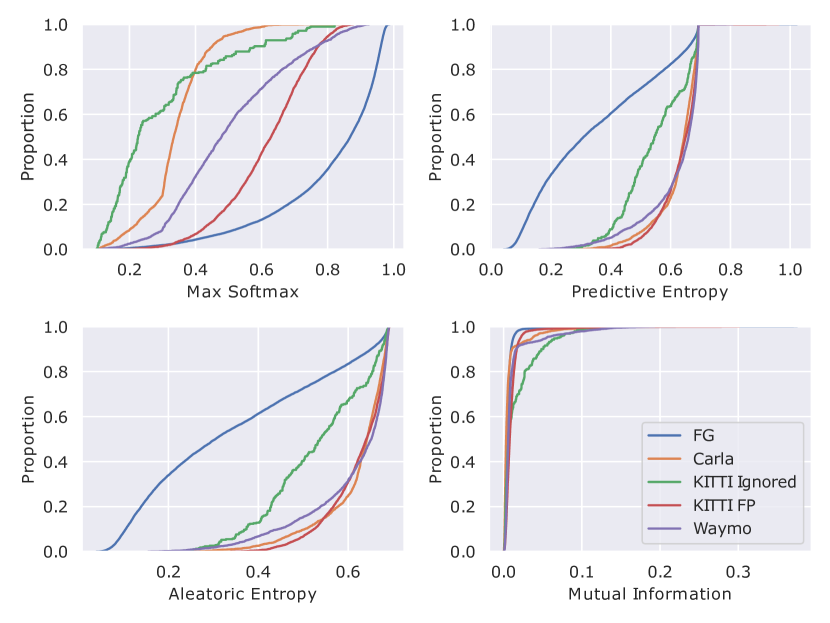
By collecting objects from different sources we ensure that our inserted objects are diverse. Figure 4 shows the cumulative distribution of softmax scores, predictive entropy, aleatoric entropy, and mutual information of the inserted objects (i.e., OOD) and foreground objects (i.e., ID). Our dataset covers objects with various ranges of uncertainties, sofmax predicted scores and predictive entropy.
OOD detection methods: we extract features from conv2x, con4x, con8x, and backbone to train OC-SVM, Mahalanobis distance, and normalizing flows. For the OC-SVM method, we train one OC-SVM with SGD per FG class and use the highest score as the OOD score. We set , and train with a batch size of 64 for 5 epochs. For Mahalanobis, we apply online mean/covariance update with a batch size of 64 for 5 epochs. Normalizing flows is implemented using RealNVP and trained with a batch size of 8 for 2320 steps.
Evaluation metrics: we adopt the evaluation metrics proposed by Hendrycks et al. [9]. We use AUROC and FPR at 95% TPR as our primary metrics due to the space limitation.
| OOD Method | Layer | AUROC | FPR @ 95 TPR | ||||||||
|---|---|---|---|---|---|---|---|---|---|---|---|
| All | Carla | Ignored | KITTI FP | Waymo | All | Carla | Ignored | KITTI FP | Waymo | ||
| Max Softmax | - | 89.950.2 | \ul96.040.4 | \ul95.580.5 | 82.840.4 | 83.182.0 | 33.831.3 | \ul10.391.1 | \ul21.233.6 | 36.410.6 | 52.176.1 |
| Predictive Entropy | - | 83.491.3 | 85.341.8 | 78.650.5 | 86.920.3 | 80.642.1 | 39.603.0 | 35.552.8 | 41.662.5 | 29.690.4 | 53.696.4 |
| Aleatoric Entropy | - | 83.091.4 | 85.301.9 | 78.240.8 | 86.760.3 | 80.012.3 | 41.773.6 | 37.873.4 | 43.933.3 | 30.090.3 | 53.976.1 |
| Mutual Information | - | 60.480.8 | 45.044.0 | 52.093.0 | 70.621.5 | 67.532.8 | 97.070.7 | 98.750.5 | 99.130.3 | 85.782.8 | 90.142.1 |
| Mahalanobis | Backbone | 83.770.9 | 88.341.6 | 86.253.0 | 72.482.2 | \ul88.300.5 | 51.011.0 | 37.492.2 | 54.3511 | 59.523.7 | 43.533.7 |
| OC-SVM | Conv8x | 65.443.0 | 66.492.9 | 66.952.9 | 63.223.0 | 64.742.3 | 66.205.0 | 63.495.6 | 62.585.7 | 72.036.8 | 67.813.7 |
| Normalizing Flows | Backbone | \ul90.280.5 | 93.630.5 | 85.811.0 | \ul91.711.0 | 85.440.9 | \ul26.721.9 | 19.900.7 | 31.170.5 | \ul16.251.3 | \ul33.032.4 |
VI-B Results and Discussion
The results for all inserted OOD objects as well as each OOD object type are shown in Table I. We apply class-balanced resampling of ID and OOD samples during the evaluation to remove any potential biases. For Mahalanobis distance, OC-SVM, and normalizing flows, we report the results of the layer with the best OOD performance. In total, we repeat dataset generation, model training, and evaluation process three times and average the results.
Overall observations: normalizing flows with backbone features and max-softmax achieve the best OOD detection performance. The performance of OC-SVM and epistemic uncertainty (mutual information) via MC-Dropout are significantly lower than other methods, suggesting that they may not be suitable for OOD detection in 3D object detection context.
Performance of different feature layers: the best performing layer for OOD detection can vary for different OOD detection methods. In our experiments, the backbone features are optimal for both Mahalanobis distance and normalizing flows, whereas OC-SVM works best with conv8x features.
Our results are different from existing work on image classification. Using logits with Mahalanobis distance as proposed by Lee et al. [8] is out-performed by the backbone features by a large margin in our experiments. Similarly, our OC-SVM model with early layer features could not achieve good separation between ID and OOD objects as observed by Abdelzad et al. [27] in image classification.
This suggests that the optimal layer for each method can depend on the specific model architecture or feature map distribution. Existing results for image classification tasks may not transfer to other tasks with specialized architectures such as PointPillars.
Performance on different types of OOD objects: the performance of each OOD detection method can vary significantly for different types of OOD objects. For instance, normalizing flows has 9% higher AUROC and 20% lower FPR compared to max-softmax for KITTI FP objects and has comparable results for Carla and Waymo objects. However, it becomes much worse than max-softmax for KITTI ignored objects with 10% difference in both AUROC and FPR. This can also be observed for other OOD methods.
This variation can be due to the noticeable differences in uncertainty and max-softmax probability between different OOD objects (Figure 4). The main observations are: i) the max-softmax scores and uncertainty estimations of the OOD objects can vary across different OOD types, which affects the performance of these methods, ii) Mahalanobis distance applied to the backbone layer is relatively stable across different types of OOD. However, for KITTI FP objects with both high max-softmax score and high uncertainty, its performance becomes significantly worse, and iii) for normalizing flows with backbone layer, OOD objects with higher aleatoric and lower epistemic uncertainty (Carla and KITTI FP) have better performance.
In our experiments, we do not have a single OOD detection method that works consistently well for all types of OOD objects. This shows that depending on the type of OOD objects and their characteristics, the optimal OOD detection method could be different. A similar observation in the classification context is also noted by Kaur et al. [49], who suggest that a combination of multiple OOD detection methods may be needed to cover different types of OOD. We leave in-depth investigation and evaluation of combined OOD detection methods for future work.
Qualitative results: we show in Figure 5 success and failure OOD detections for the two best-performing methods: max-softmax and normalizing flows.
VII Conclusion and Future Work
Deep LiDAR-based 3D object detectors play an important role in autonomous driving, and making them robust to OOD objects is key for assuring the safety of such systems. Although OOD detection has been defined and investigated extensively for classification, it has not been explored for LiDAR-based 3D object detection. In this paper, we define different types of OOD samples for object detection and adapt the state-of-the-art OOD detection methods from image classification to LiDAR-based 3D object detection. In order to use OOD detection methods that rely on intermediate layers, we also propose a method for extracting feature embeddings for the detected objects. To enable the evaluation of the OOD detection methods, we propose a simple yet effective method to generate OOD objects for LiDAR-based 3D object detectors. We evaluate the OOD detection methods on the KITTI dataset augmented with a diverse set of real and synthetic OOD objects, revealing a nuanced landscape of how the current OOD detection methods perform in the context of LiDAR-based 3D object detection. The results demonstrate that each method is biased toward detecting certain types of OOD objects. Furthermore, the best practices proposed for image classification, such as selecting features of specific layers for OOD detection, may not transfer to object detection. We hope that our OOD dataset generation and evaluation results will stimulate further research into effective OOD detection for LiDAR-based 3D object detection.
As future work, we plan to address the limitations of our proposed OOD dataset generation method. More specifically, we would like to 1) identify and insert unusual foreground objects (type \small3⃝ OOD), 2) ensure that the LiDAR intensity of the inserted objects is realistic and matches the intensity of the dataset, and 3) place OOD objects more realistically in the scene, possibly utilizing HD map information.
Furthermore, we would like to extend our work by evaluating the OOD detection and object generation methods over other large-scale automotive datasets such as Waymo. We are also interested in understanding the characteristics of OOD detection methods better and developing a combined OOD detection method that is not biased toward specific types of OOD objects.
References
- Zheng et al. [2021] W. Zheng, W. Tang, L. Jiang, and C.-W. Fu, “SE-SSD: Self-ensembling single-stage object detector from point cloud,” in CVPR, 2021, pp. 14 494–14 503.
- Shi et al. [2020] S. Shi, C. Guo, L. Jiang, Z. Wang, J. Shi, X. Wang, and H. L. Pv-rcnn, “Point-voxel feature set abstraction for 3D object detection. 2020 ieee,” in CVPR 2020, 2020, pp. 10 526–10 535.
- Lang et al. [2019] A. H. Lang, S. Vora, H. Caesar, L. Zhou, J. Yang, and O. Beijbom, “PointPillars: Fast encoders for object detection from point clouds,” in CVPR, 2019, pp. 12 697–12 705.
- Salehi et al. [2021] M. Salehi, H. Mirzaei, D. Hendrycks, Y. Li, M. H. Rohban, and M. Sabokrou, “A unified survey on anomaly, novelty, open-set, and out-of-distribution detection: Solutions and future challenges,” arXiv preprint arXiv:2110.14051, 2021.
- Liang et al. [2018] S. Liang, Y. Li, and R. Srikant, “Enhancing the reliability of out-of-distribution image detection in neural networks,” ICLR, 2018.
- Hendrycks et al. [2019a] D. Hendrycks, M. Mazeika, S. Kadavath, and D. Song, “Using self-supervised learning can improve model robustness and uncertainty,” NeurIPS, 2019.
- Rezende and Mohamed [2015] D. Rezende and S. Mohamed, “Variational inference with normalizing flows,” in ICLR, 2015, pp. 1530–1538.
- Lee et al. [2018a] K. Lee, K. Lee, H. Lee, and J. Shin, “A simple unified framework for detecting out-of-distribution samples and adversarial attacks,” NeurIPS, vol. 31, 2018.
- Hendrycks and Gimpel [2016] D. Hendrycks and K. Gimpel, “A baseline for detecting misclassified and out-of-distribution examples in neural networks,” ICLR, 2016.
- Ren et al. [2019] J. Ren, P. J. Liu, E. Fertig, J. Snoek, R. Poplin, M. A. DePristo, J. V. Dillon, and B. Lakshminarayanan, “Likelihood ratios for out-of-distribution detection,” NeurIPS, 2019.
- Zhang et al. [2020] H. Zhang, A. Li, J. Guo, and Y. Guo, “Hybrid models for open set recognition,” in ECCV 2020, 2020, pp. 102–117.
- Lee et al. [2018b] K. Lee, H. Lee, K. Lee, and J. Shin, “Training confidence-calibrated classifiers for detecting out-of-distribution samples,” ICLR, 2018.
- Vyas et al. [2018] A. Vyas, N. Jammalamadaka, X. Zhu, D. Das, B. Kaul, and T. L. Willke, “Out-of-distribution detection using an ensemble of self supervised leave-out classifiers,” in ECCV, 2018, pp. 550–564.
- Lakshminarayanan et al. [2016] B. Lakshminarayanan, A. Pritzel, and C. Blundell, “Simple and scalable predictive uncertainty estimation using deep ensembles,” NeurIPS 2017, 2016.
- Li and Gal [2017] Y. Li and Y. Gal, “Dropout inference in bayesian neural networks with alpha-divergences,” in ICLR, 2017, pp. 2052–2061.
- Hsu et al. [2020] Y.-C. Hsu, Y. Shen, H. Jin, and Z. Kira, “Generalized ODIN: Detecting out-of-distribution image without learning from out-of-distribution data,” in CVPR, 2020, pp. 10 951–10 960.
- Bevandić et al. [2018] P. Bevandić, I. Krešo, M. Oršić, and S. Šegvić, “Discriminative out-of-distribution detection for semantic segmentation,” arXiv preprint arXiv:1808.07703, 2018.
- Angus et al. [2019] M. Angus, K. Czarnecki, and R. Salay, “Efficacy of pixel-level OOD detection for semantic segmentation,” arXiv preprint arXiv:1911.02897, 2019.
- Marchal et al. [2020] N. Marchal, C. Moraldo, H. Blum, R. Siegwart, C. Cadena, and A. Gawel, “Learning densities in feature space for reliable segmentation of indoor scenes,” IEEE Robotics and Automation Letters, vol. 5, no. 2, pp. 1032–1038, 2020.
- Williams et al. [2021] D. Williams, M. Gadd, D. De Martini, and P. Newman, “Fool me once: Robust selective segmentation via out-of-distribution detection with contrastive learning,” ICRA, 2021.
- LeCun and Cortes [2010] Y. LeCun and C. Cortes, “MNIST handwritten digit database,” 2010. [Online]. Available: http://yann.lecun.com/exdb/mnist/
- Zhou and Tuzel [2018] Y. Zhou and O. Tuzel, “VoxelNet: End-to-end learning for point cloud based 3D object detection,” in CVPR, 2018, pp. 4490–4499.
- Shi et al. [2019] S. Shi, X. Wang, and H. Li, “PointRCNN: 3D object proposal generation and detection from point cloud,” in CVPR, 2019, pp. 770–779.
- Qi et al. [2017] C. R. Qi, H. Su, K. Mo, and L. J. Guibas, “PointNet: Deep learning on point sets for 3D classification and segmentation,” in CVPR, 2017, pp. 652–660.
- Blum et al. [2019] H. Blum, P.-E. Sarlin, J. Nieto, R. Siegwart, and C. Cadena, “Fishyscapes: A benchmark for safe semantic segmentation in autonomous driving,” in CVPR 2019 Workshops, 2019, pp. 0–0.
- Schölkopf et al. [2001] B. Schölkopf, J. C. Platt, J. Shawe-Taylor, A. J. Smola, and R. C. Williamson, “Estimating the support of a high-dimensional distribution,” Neural computation, vol. 13, no. 7, pp. 1443–1471, 2001.
- Abdelzad et al. [2019] V. Abdelzad, K. Czarnecki, R. Salay, T. Denounden, S. Vernekar, and B. Phan, “Detecting out-of-distribution inputs in deep neural networks using an early-layer output,” arXiv preprint arXiv:1910.10307, 2019.
- Bishop [1994] C. M. Bishop, “Novelty detection and neural network validation,” IEE Proceedings-Vision, Image and Signal processing, vol. 141, no. 4, pp. 217–222, 1994.
- An and Cho [2015] J. An and S. Cho, “Variational autoencoder based anomaly detection using reconstruction probability,” Special Lecture on IE, vol. 2, no. 1, pp. 1–18, 2015.
- Choi et al. [2018] H. Choi, E. Jang, and A. A. Alemi, “WAIC, but why? generative ensembles for robust anomaly detection,” arXiv preprint arXiv:1810.01392, 2018.
- Hendrycks et al. [2019b] D. Hendrycks, M. Mazeika, and T. Dietterich, “Deep anomaly detection with outlier exposure,” ICLR, 2019.
- Zisselman and Tamar [2020] E. Zisselman and A. Tamar, “Deep residual flow for out of distribution detection,” in CVPR 2020, 2020, pp. 13 994–14 003.
- Kingma and Welling [2014] D. P. Kingma and M. Welling, “Auto-encoding variational bayes,” ICLR, 2014.
- Oord et al. [2016] A. v. d. Oord, N. Kalchbrenner, O. Vinyals, L. Espeholt, A. Graves, and K. Kavukcuoglu, “Conditional image generation with PixelCNN decoders,” NeurIPS, 2016.
- Nitsch et al. [2021] J. Nitsch, M. Itkina, R. Senanayake, J. Nieto, M. Schmidt, R. Siegwart, M. J. Kochenderfer, and C. Cadena, “Out-of-distribution detection for automotive perception,” ITSC, 2021.
- Wong et al. [2020] K. Wong, S. Wang, M. Ren, M. Liang, and R. Urtasun, “Identifying unknown instances for autonomous driving,” in CoRL. PMLR, 2020, pp. 384–393.
- Rahman et al. [2019] Q. M. Rahman, N. Sünderhauf, and F. Dayoub, “Did you miss the sign? a false negative alarm system for traffic sign detectors,” in IROS, 2019, pp. 3748–3753.
- Yang et al. [2021] Q. Yang, H. Chen, Z. Chen, and J. Su, “Introspective false negative prediction for black-box object detectors in autonomous driving,” Sensors, vol. 21, no. 8, p. 2819, 2021.
- Miller et al. [2021] D. Miller, N. Sünderhauf, M. Milford, and F. Dayoub, “Uncertainty for identifying open-set errors in visual object detection,” arXiv preprint arXiv:2104.01328, 2021.
- Lin et al. [2014] T.-Y. Lin, M. Maire, S. Belongie, J. Hays, P. Perona, D. Ramanan, P. Dollár, and C. L. Zitnick, “Microsoft COCO: Common objects in context,” in ECCV, 2014, pp. 740–755.
- Everingham et al. [2015] M. Everingham, S. A. Eslami, L. Van Gool, C. K. Williams, J. Winn, and A. Zisserman, “The PASCAL visual object classes challenge: A retrospective,” International Journal of Computer Vision, vol. 111, no. 1, pp. 98–136, 2015.
- Geiger et al. [2013] A. Geiger, P. Lenz, C. Stiller, and R. Urtasun, “Vision meets robotics: The KITTI dataset,” The International Journal of Robotics Research, vol. 32, no. 11, pp. 1231–1237, 2013.
- Sun et al. [2020] P. Sun, H. Kretzschmar, X. Dotiwalla, A. Chouard, V. Patnaik, P. Tsui, J. Guo, Y. Zhou, Y. Chai, B. Caine et al., “Scalability in perception for autonomous driving: Waymo open dataset,” in CVPR, 2020, pp. 2446–2454.
- Caesar et al. [2020] H. Caesar, V. Bankiti, A. H. Lang, S. Vora, V. E. Liong, Q. Xu, A. Krishnan, Y. Pan, G. Baldan, and O. Beijbom, “nuscenes: A multimodal dataset for autonomous driving,” in CVPR, 2020, pp. 11 621–11 631.
- Dinh et al. [2016] L. Dinh, J. Sohl-Dickstein, and S. Bengio, “Density estimation using Real NVP,” ICLR, 2016.
- Feng et al. [2018] D. Feng, L. Rosenbaum, and K. Dietmayer, “Towards safe autonomous driving: Capture uncertainty in the deep neural network for LiDAR 3D vehicle detection,” in ITSC. IEEE, 2018, pp. 3266–3273.
- Gal and Ghahramani [2016] Y. Gal and Z. Ghahramani, “Dropout as a Bayesian Approximation: Representing Model Uncertainty in Deep Learning,” in ICLR, 2016, pp. 1050–1059.
- Dosovitskiy et al. [2017] A. Dosovitskiy, G. Ros, F. Codevilla, A. Lopez, and V. Koltun, “CARLA: An open urban driving simulator,” in CoRL. PMLR, 2017, pp. 1–16.
- Kaur et al. [2021] R. Kaur, S. Jha, A. Roy, O. Sokolsky, and I. Lee, “Are all outliers alike? on understanding the diversity of outliers for detecting oods,” arXiv preprint arXiv:2103.12628, 2021.