Towards measuring supermassive black hole masses with interferometric observations of the dust continuum
This work focuses on active galactic nuclei (AGNs), and the relation between the sizes of the hot dust continuum and the broad-line region (BLR). We find that the continuum size measured using optical/near-infrared interferometry (OI) is roughly twice that measured by reverberation mapping (RM). Both OI and RM continuum sizes show a tight relation with the H BLR size with only an intrinsic scatter of 0.25 dex. The masses of supermassive black holes (BHs) can hence be simply derived from a dust size in combination with a broad line width and virial factor. Since the primary uncertainty of these BH masses comes from the virial factor, the accuracy of the continuum-based BH masses is close to those based on the RM measurement of the broad emission line. Moreover, the necessary continuum measurements can be obtained on a much shorter timescale than those required monitoring for RM, and are also more time efficient than those needed to resolve the BLR with OI. The primary goal of this work is to demonstrate measuring the BH mass based on the dust continuum size with our first calibration of the – relation. The current limitation and caveats are discussed in detail. Future GRAVITY observations are expected to improve the continuum-based method and have the potential to measure BH masses for a large sample of AGNs in the low-redshift Universe.
Key Words.:
galaxies: active – galaxies: nuclei – galaxies: Seyfert – quasars: supermassive black holes1 Introduction
Measuring the mass of supermassive black holes (BHs) is challenging as this requires resolving stellar or gas dynamics inside the BH’s sphere of influence (e.g. Thomas et al., 2004; Onken et al., 2014; Saglia et al., 2016; Hicks & Malkan, 2008; Davis, 2014; Onishi et al., 2017; Boizelle et al., 2019). In active galactic nuclei (AGNs) with broad recombination lines, the reverberation mapping (RM) method has been developed to measure the size of the broad-line region (BLR) and hence lead to the measurement of the BH mass (Blandford & McKee, 1982; Peterson, 1993; Peterson et al., 2004). By monitoring the variability of the UV/optical continuum and an emission line, typically H, the BLR size can be obtained from the RM method. Assuming that the BLR is a virialized system, one can calculate the BH mass,
| (1) |
where is the BLR radius, is the velocity width of the broad emission line, is the corresponding virial factor, and is the gravitational constant. The FWHM or second moment () of the broad line is usually used as . The virial factor depends on the geometry, kinematics, and inclination of the BLR clouds and is likely different from object to object. For example, the virial factor is 0.75 assuming an isotropic velocity distribution of Keplerian motion (Netzer, 1990). The mean virial factor, , can be calibrated using nearby AGNs assuming that the AGN and quiescent galaxies follow the same – relation (e.g. Onken et al., 2004; Woo et al., 2010; Graham et al., 2011; Grier et al., 2013; Ho & Kim, 2014). This method based on RM measurements has been used successfully for many years, despite potential biases and caveats in the virial factor calibration (Shankar et al., 2019). For a particular source, the uncertainty in may come from its unknown inclination angle and other effects such as the radiation pressure (Collin et al., 2006; Mejía-Restrepo et al., 2018).
Moreover, a scaling relation between the BLR radius and AGN luminosity was discovered from RM measurements (Kaspi et al., 2000; Dalla Bontà et al., 2020, and references therein). This – relation enables one to estimate the BH mass only with the AGN luminosity and the FWHM of a broad emission line from single-epoch spectra (Shen, 2013). Thanks to its simplicity, the single-epoch method has been widely used with different broad lines in the UV and optical, although the uncertainty is around 0.5 dex or above (e.g. Vestergaard & Peterson, 2006). Other methods have been developed to estimate the BH mass and tested against the RM measured BH mass. For example, the coronal line [Si VI]1.963 mcan be used to estimate the BH mass with an uncertainty of about 0.5 dex (Prieto et al., 2022).
Recently, the BLRs of three AGNs have been spatially resolved by GRAVITY, a second-generation Very Large Telescope Interferometer (VLTI) instrument (Gravity Collaboration et al., 2018, 2020a, 2021b). GRAVITY has greatly improved the sensitivity of earlier efforts and has been able to combine all four of the 8-m Unit Telescope (UT) beams to yield six simultaneous baselines (Gravity Collaboration et al., 2017). With a few hours of on-source exposure, GRAVITY measures the differential phase signal of a broad emission line in the near-infrared (NIR) -band, which reflects the offsets of the photocenters from the center of the continuum emission in each wavelength channel (Petrov et al., 2001; Marconi et al., 2003). The BLR size is then inferred from the differential phase data by fitting a dynamical BLR model such as the widely used Pancoast et al. (2014a) model. The GRAVITY-measured BLR size and BH mass are in good agreement with RM measurements (Gravity Collaboration et al., 2021b, a).
GRAVITY can also resolve the size of the NIR continuum emission of the AGN, which comes from the thermal radiation of hot dust that is reprocessing the UV/optical continuum from the accretion disk (e.g. Rees et al., 1969; Barvainis, 1987). Spatial sizes of the dust continuum emission can be measured by both continuum RM (e.g. Clavel et al., 1989; Baribaud et al., 1992; Glass, 1992; Sitko et al., 1993; Minezaki et al., 2004; Suganuma et al., 2006; Koshida et al., 2014; Pozo Nuñez et al., 2014, 2015; Mandal et al., 2018; Minezaki et al., 2019; Sobrino Figaredo et al., 2020; Mandal et al., 2021a, b) as well as optical/NIR interferometry (OI; Swain et al., 2003; Wittkowski et al., 2004; Kishimoto et al., 2009, 2011; Gravity Collaboration et al., 2020b; Leftley et al., 2021). Similar to the BLR size, the dust continuum size also scales with the AGN luminosity (Suganuma et al., 2006; Kishimoto et al., 2011; Koshida et al., 2014; Minezaki et al., 2019; Gravity Collaboration et al., 2020b). Such a relation is expected if the dust temperature and the inner radius of the dust distribution are determined by radiation equilibrium and dust sublimation, respectively (Barvainis, 1987; Kishimoto et al., 2007). The dust continuum RM radius is a factor of four or five larger than the BLR radius (Koshida et al., 2014) and is consistent with BLR models that place hot dust on the outskirts of the BLR (e.g. Wang et al., 2017; Baskin & Laor, 2018). Moreover, RM-measured dust continuum sizes are systematically smaller than those measured from OI, likely because the RM size is weighted by the time lag over the emitting region while the OI size is weighted by the intensity of hot dust emission (Koshida et al., 2014; Kishimoto et al., 2011; Gravity Collaboration et al., 2020b).
GRAVITY can observe the dust continuum independently of the full spectroastrometric measurements and has demonstrated excellent efficiency (e.g. hour per source; Gravity Collaboration et al. 2020b and in preparation). Establishing a link between the BLR and dust continuum size will enable BH mass estimations from these more accessible dust continuum observations. In this work, we investigate the correlation between BLR and dust continuum size in the context of estimating the BH mass. The four methods discussed in this paper are:
-
1.
Reverberation mapping of the broad emission line, where a sequence of measurements over months or years, yielding the time delay for variations in the broad-line emission, leads to an estimate ; and hence, via Equation (1), the BH mass (Peterson, 2014). This method has enabled empirical calibration of a sample-average virial factor . More recently, the velocity resolved RM data can constrain a BLR dynamical model and enable the estimation of for individual sources (e.g. Pancoast et al., 2014a, b).
- 2.
-
3.
Continuum size measurements, the method introduced in this paper, where is estimated from an interferometric measurement of . Like the single-epoch method, this also relies on Equation (1) and a pre-calibration of the virial factor.
-
4.
Spectrally resolved differential phase measurements of the broad-line emission. Using the interferometric data as constraints on a dynamical BLR model allows one to derive BH mass; and hence also infer a value of the virial factor for individual sources that is independent of RM (Gravity Collaboration et al., 2020a).
We show that the H BLR size scales tightly with the dust continuum size, which allows us to estimate the BH mass from the dust continuum size with an uncertainty similar to the RM BLR method. We discuss the prospects of this method for BH mass estimations in the low-redshift Universe, especially with the upgrade of GRAVITY in Section 5. This work adopts the following parameters for a CDM cosmology: , , and km s-1 Mpc-1 (Planck Collaboration et al., 2016).
2 Samples
| Name | Redshift | (RM) | Ref. | (OI) | Ref. | FWHM | Ref. | |||||||||
| (ld) | (ld) | (ld) | () | () | () | |||||||||||
| (1) | (2) | (3) | (4) | (5) | (6) | (7) | (8) | (9) | (10) | (11) | (12) | |||||
| Mrk 335 | 0.0258 | 167.5 | 6.0 | 1 | 185 | 49 | 2 | 14.0 | 4.0 | 1707 | 79 | 43.8 | 3 | 6.90 | 0.13 | |
| UGC 545 | 0.0612 | … | … | 707 | 77 | 4 | 37.2 | 4.7 | 1131 | 37 | 44.5 | 5 | 6.97 | 0.06 | 0.39 | |
| Mrk 590a,b | 0.0264 | 33.5 | 4.2 | 1 | … | … | 25.6 | 5.9 | 2716 | 202 | 43.5 | 3 | 7.57 | 0.12 | ||
| 3C 120 | 0.0330 | 94.4 | 5.5 | 6 | 379 | 85 | 2 | 26.2 | 7.7 | 2472 | 729 | 44.0 | 3 | 7.49 | 0.29 | |
| H0507+164 | 0.0179 | 35 | 11 | 7 | … | … | 3.0 | 1.2 | 4062 | 247 | 42.6 | 8 | 6.99 | 0.18 | ||
| Akn 120 | 0.0327 | 138 | 18 | 1 | 387 | 77 | 4 | 39.5 | 8.2 | 6077 | 147 | 43.9 | 3 | 8.45 | 0.09 | |
| MCG+08-11-011 | 0.0205 | 72.7 | 1.6 | 1 | … | … | 15.7 | 0.5 | 4139 | 207 | 43.3 | 3 | 7.72 | 0.05 | ||
| Mrk 6a | 0.0195 | … | … | 214 | 60 | 9 | 18.5 | 2.5 | 5457 | 16 | 43.6 | 10 | 8.03 | 0.06 | ||
| Mrk 79 | 0.0222 | 67.7 | 4.8 | 1 | … | … | 15.6 | 5.0 | 4793 | 145 | 43.7 | 3 | 7.84 | 0.14 | ||
| PG 0844+349 | 0.0640 | 99 | 11 | 1 | … | … | 32.3 | 13.6 | 2694 | 58 | 44.2 | 3 | 7.66 | 0.18 | ||
| Mrk 110 | 0.0353 | 116.6 | 6.3 | 1 | … | … | 25.6 | 8.1 | 1634 | 83 | 43.7 | 3 | 7.13 | 0.14 | ||
| PG 0953+414 | 0.2341 | 566 | 44 | 1 | … | … | 150.1 | 22.1 | 3071 | 27 | 45.2 | 3 | 8.44 | 0.06 | ||
| NGC 3227 | 0.0038 | 14.37 | 0.70 | 1 | 45.0 | 7.2 | 4 | 3.8 | 0.8 | 4112 | 206 | 42.2 | 3 | 7.10 | 0.10 | |
| NGC 3516a | 0.0088 | 72.7 | 4.6 | 1 | … | … | 11.7 | 1.3 | 5384 | 269 | 42.8 | 3 | 7.82 | 0.06 | ||
| NGC 3783 | 0.0097 | 76.3 | 14.1 | 11 | 131 | 20 | 2 | 9.6 | 0.7 | 4486 | 35 | 43.0 | 12 | 7.58 | 0.03 | |
| NGC 4051 | 0.0023 | 16.30 | 0.57 | 1 | 38.1 | 6.0 | 13 | 2.1 | 0.8 | 1076 | 277 | 41.9 | 3 | 5.68 | 0.28 | |
| NGC 4151a | 0.0033 | 46.11 | 0.44 | 1 | 44.1 | 8.3c | 9 | 6.6 | 1.0 | 6371 | 150 | 42.1 | 3 | 7.72 | 0.07 | |
| 3C 273 | 0.1583 | 409 | 41 | 14 | 675 | 126 | 2 | 146.8 | 10.2 | 3314 | 59 | 45.9 | 3 | 8.50 | 0.03 | 0.28 |
| NGC 4593 | 0.0083 | 41.82 | 0.90 | 1 | 54.8 | 8.8 | 4 | 4.0 | 0.8 | 5142 | 572 | 42.6 | 3 | 7.31 | 0.13 | |
| MCG-6-30-15 | 0.0078 | 19.6 | 4.9 | 15 | … | … | 5.7 | 1.8 | 1947 | 58 | 41.6 | 3 | 6.63 | 0.14 | ||
| NGC 5548 | 0.0172 | 61.21 | 0.30 | 1 | … | … | 13.9 | 8.7 | 7256 | 2203 | 43.3 | 3 | 8.15 | 0.38 | ||
| Mrk 817 | 0.0313 | 92.6 | 8.9 | 1 | … | … | 19.9 | 8.3 | 5348 | 536 | 43.7 | 3 | 8.05 | 0.20 | ||
| PG 1613+658 | 0.1211 | 334 | 40 | 1 | … | … | 40.1 | 15.1 | 9074 | 103 | 44.8 | 3 | 8.81 | 0.16 | ||
| Z 229-15 | 0.0279 | 20.4 | 5.8 | 16 | … | … | 3.9 | 0.8 | 3350 | 72 | 42.9 | 17 | 6.93 | 0.09 | ||
| Mrk 509 | 0.0344 | 121.3 | 1.6 | 1 | 297 | 31 | 2 | 79.6 | 5.8 | 3015 | 2 | 44.2 | 3 | 8.15 | 0.03 | |
| NGC 7469 | 0.0163 | 85.29 | 0.43 | 1 | … | … | 10.8 | 2.4 | 4369 | 6 | 43.5 | 3 | 7.60 | 0.10 | ||
| NGC 1365a | 0.0055 | … | … | 38.1 | 4.8 | 2 | … | 1586 | 465 | 41.9 | 2f,18 | … | … | |||
| IRAS 03450+0055 | 0.0315 | 157.4 | 5.9 | 1 | … | … | … | 3098 | 55 | 43.9 | 1,19 | … | … | |||
| IRAS 09149-6206d | 0.0573 | … | … | 482 | 49 | 2 | … | 4281 | 121 | 45.0 | 20,21 | 8.06 | 0.25 | |||
| Mrk 1239 | 0.0199 | … | … | 189 | 30 | 4 | … | 830 | 10 | 44.5 | 22f | … | … | |||
| WPVS 48 | 0.0370 | 70.8 | 4.6 | 23 | … | … | … | 1890 | 60 | 43.6 | 24 | … | … | |||
| Mrk 744 | 0.0091 | 19.9 | 2.2 | 1 | … | … | … | 5616 | 129 | 41.8 | 1,21g | … | … | |||
| HE 10291401 | 0.0858 | … | … | 880 | 133 | 4 | … | 5684 | 284 | 44.6 | 21 | … | … | |||
| GQ Com | 0.1650 | 210 | 40 | 25 | … | … | … | 5036 | 252 | 44.6 | 26 | … | … | |||
| Mrk 231 | 0.0422 | … | … | 393 | 83 | 13 | … | 3130 | 156 | 45.0 | 2f,27 | … | … | |||
| ESO 323-G77 | 0.0150 | … | … | 100.0 | 4.8 | 28 | … | 2635 | 132 | 43.1 | 21 | … | … | |||
| IRAS 13349+2438 | 0.1076 | … | … | 1096 | 71 | 13 | … | 1796 | 90 | 45.0 | 29 | … | … | |||
| IC 4329A | 0.0161 | … | … | 178 | 10 | 4 | … | 6472 | 324 | 43.2 | 21 | … | … | |||
| PGC 50427e | 0.0235 | 46.7 | 2.2 | 30 | … | … | … | 3036 | 74 | 43.1 | 30 | 7.34 | 0.04 | |||
| PDS 456 | 0.1840 | … | … | 1599 | 213 | 2 | … | 3974 | 764 | 46.3 | 31 | … | … | |||
| PGC 89171 | 0.0270 | … | … | 303 | 36 | 4 | … | 2644 | 132 | 43.9 | 21 | … | … | |||
| NGC 7603 | 0.0288 | … | … | 332 | 66 | 4 | … | 6350 | 318 | 44.4 | 21 | … | … | |||
-
a
This target is discussed as a changing-look quasar in the literature.
-
b
Mrk 590 is a changing look AGN displaying strong variability over the time of BLR and dust continuum observations (Denney et al., 2014). We do not include it in our statistical analysis.
- c
- d
- e
-
f
We converted the bolometric luminosity to (5100 Å) using Equation (A.2) of Gravity Collaboration et al. (2020b).
-
g
H FWHM is converted from H FWHM assuming (Greene & Ho, 2005).
Notes.
Col. (1): Target name.
Col. (2): Redshift from NASA/IPAC Extragalactic Database (NED).
Col. (3): Dust continuum radius based on RM measurement.
Col. (4): Reference of (RM).
Col. (5): Dust continuum radius based on OI measurement.
Col. (6): Reference of (OI).
Col. (7): BLR radius based on H time lag.
Col. (8): H FWHM.
Col. (9): AGN optical luminosity at 5100 Å.
Col. (10): References of , FWHM, and (5100 Å).
Col. (11): BH mass derived from and FWHM from Columns (7) and (8) assuming the virial factor .
Col. (12): Eddington ratio derived from (5100 Å) and BH mass from Columns (9) and (11) with the bolometric correction factor 9 (Peterson et al., 2004).
References:
(1) Minezaki et al. (2019),
(2) Gravity Collaboration et al. (2020b),
(3) Du & Wang (2019),
(4) GRAVITY Collaboration (in preparation),
(5) Huang et al. (2019),
(6) Ramolla et al. (2018),
(7) Mandal et al. (2018),
(8) Stalin et al. (2011),
(9) Kishimoto et al. (2011),
(10) Du et al. (2018),
(11) Lira et al. (2011),
(12) Bentz et al. (2021),
(13) Kishimoto et al. (2009),
(14) Sobrino Figaredo et al. (2020),
(15) Lira et al. (2015),
(16) Mandal et al. (2021a),
(17) Barth et al. (2011),
(18) Onori et al. (2017),
(19) Rashed et al. (2015),
(20) Gravity Collaboration et al. (2020a),
(21) Koss et al. (2017),
(22) Pan et al. (2021),
(23) Pozo Nuñez et al. (2014),
(24) Probst & Kollatschny (2020),
(25) Sitko et al. (1993),
(26) Shangguan et al. (2018),
(27) Zheng et al. (2002),
(28) Leftley et al. (2021),
(29) Dong et al. (2018),
(30) Pozo Nuñez et al. (2015),
(31) Nardini et al. (2015).
2.1 Dust continuum measurements
We collect type 1 AGNs with dust continuum sizes measured by RM and/or OI in Table 1. The dust continuum sizes based on -band RM observations are mainly measured by Koshida et al. (2014). Minezaki et al. (2019) summarized the results of Koshida et al. (2014) in their Table 6, using the power index to remove the NIR emission from the accretion disk (i.e. ) to be consistent with their primary results. The assumption of the power index may introduce a difference in the time lag, which is typically not significant compared to the measurement uncertainty (Koshida et al., 2014; Minezaki et al., 2019). We, therefore, adopt the time lags from Minezaki et al. (2019) whenever available. The -band time lag probes the dust emission size at shorter wavelength for higher redshift sources, so we prefer not to include AGNs much higher than (see also Section 3.3). Minezaki et al. (2019) also reported -band continuum RM measurements for a sample of quasars at 0.1–0.6, most of which do not have H RM measurements. We only include three quasars from this sample, PG 0844+349, PG 0953+414, and PG 1613+658, because they have H RM measurements and are valuable to study the relation of the dust continuum and BLR sizes. -band RM measurements of the other targets, e.g. 3C 120 (Ramolla et al., 2018) and H 0507+164 (Mandal et al., 2018), are collected from individual papers.
We also find 23 AGNs with dust continuum sizes measured by OI, which consists of Keck (Kishimoto et al., 2009, 2011) and recent VLTI/GRAVITY observations (Gravity Collaboration et al. 2020b and in preparation). Kishimoto et al. measured the dust continuum size by fitting squared visibility amplitudes () with a thin-ring model. They corrected the influence of the accretion disk assuming a point source contribution to the visibilities. Gravity Collaboration et al. (2020b) measured the dust continuum size by fitting a Gaussian model to the . They converted the Gaussian FWHM to the thin-ring radius and corrected the radius assuming a 20% contribution of the coherent flux from the accretion disk. Recent GRAVITY observations measured the dust continuum size of seven AGNs with hour observation time (GRAVITY Collaboration in preparation). We follow the method of Gravity Collaboration et al. (2020b) to measure their continuum size. To estimate the uncertainty, we sum in quadrature the statistical uncertainty of the size measurements of individual exposures and a 10% systematic uncertainty (Gravity Collaboration et al. 2020b and in preparation).
2.2 BLR measurements
The BLR size can be probed by different broad emission lines. The H line has been the most extensively used in RM campaigns of low- AGNs (e.g. Bentz & Katz, 2015). Meanwhile, GRAVITY spectroastrometric observations probe the BLR with Pa and Br (Gravity Collaboration et al., 2018, 2020a, 2021b). Different broad lines of a BLR may show a different size due to the photoionization conditions and optical depth (Korista & Goad, 2004). In this work, we only study the relation of the dust continuum radius and H BLR radius from the RM time lag for simplicity. Meanwhile, future GRAVITY observations measuring the BLR and dust continuum simultaneously in -band will be powerful to investigate their relation (see Section 5). We collect the H BLR radii of most targets, together with their optical luminosities at 5100 Å and H line FWHMs, from Table 1 of Du & Wang (2019).111Similar data are also collected in Dalla Bontà et al. (2020). Du & Wang (2019) averaged the quantities if there is more than one measurement. We only find a few additional AGNs from the other references (see Table 1). We adjust the (5100 Å) to our cosmology when necessary unless the distances of some nearby AGNs are explicitly specified in the references.
2.3 AGN variability
We emphasize that the BLR and dust continuum sizes are usually measured in different epochs. While the BLR RM campaigns of many targets conducted from 2000–2010 coincide with dust continuum RM campaigns (Koshida et al., 2014; Minezaki et al., 2019), the time difference between BLR and dust measurements for some targets can be over a decade. For example, we adopt the BLR RM of NGC 3783 measured in 2020 (Bentz et al., 2021), while its dust continuum RM was measured around 2009 (Lira et al., 2011). We find that the early BLR RM measurements of NGC 3783 (Onken & Peterson, 2002) yielded a BLR radius and (5100 Å) quite close to the recent measurements. We, therefore, prefer to adopt the new measurements for simplicity. The asynchronous effect will contribute to the scatter of the size correlation (see discussion in Section 3).
Targets with substantial variability may show a large scatter in the – relation. We identify so-called ‘changing-look’ AGNs in our sample from the literature and discuss them in the following. In the end, we are convinced that only Mrk 590 is not suitable to be included in our analysis. Mrk 590 transformed from a classical type 1 AGN to type 1.9–2, as its continuum luminosity decreased by 100 over the past four decades (Denney et al., 2014). The lack of evidence of intrinsic absorption indicates that changes in continuum and emission lines are due to the decline of the BH accretion rate instead of obscuration along the line of sight. The BLR of Mrk 590 was monitored through the H line from 1990–1996 (Peterson et al., 1998) and recently, with H in 2018 (Mandal et al., 2021b). The BLR size of Mrk 590, around 25 ld, does not change significantly at the bright and faint states. The dust continuum RM campaign was conducted from 2003 to 2007 (Koshida et al., 2014) during the rapid decline of the AGN luminosity in Mrk 590. Kokubo & Minezaki (2020) found that the dust continuum size of Mrk 590 is quite small, only ld, reflecting the rapid replenishment of the dust in the innermost region of the dusty interstellar medium. We exclude Mrk 590 in our statistics to avoid the complicated physics of this target. There are other changing-look AGNs in our sample, e.g. Mrk 6 and NGC 4151 (flagged in Table 1). They change either from type 1 to type 2 or vice versa (see Marin et al. 2019; Senarath et al. 2021 and references therein). However, we find the BLR and continuum were measured when they stayed the same type, so we include them in our analysis. Moreover, some changing-look AGNs flagged in our sample are likely caused by temporary changes in the line-of-sight obscuration (e.g. Goodrich, 1989; Shapovalova et al., 2019). This mechanism does not relate to any intrinsic change in the AGN properties, so it will not affect the – relation that we are interested in for this work. Nevertheless, our results stay the same if we exclude all the changing-look AGNs. Clavel et al. (1989) published their -band RM measurement of Fairall 9 while its UV continuum flux was dropping by a factor of . However, an H RM measurement before it changed to the faint state does not exist. The extreme variability, from type 1 to almost type 2 (Kollatschny & Fricke, 1985; Lub & de Ruiter, 1992), prevents a simple choice of (5100 Å) and H FWHM for our analysis. Therefore, we chose to exclude Fairall 9 in this work.
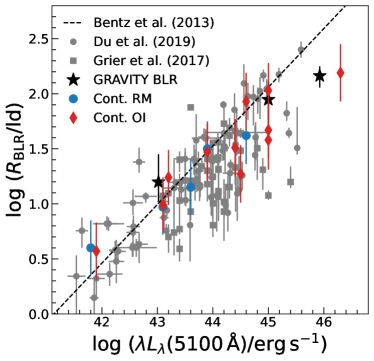
3 Scaling relations of BLR and dust continuum size
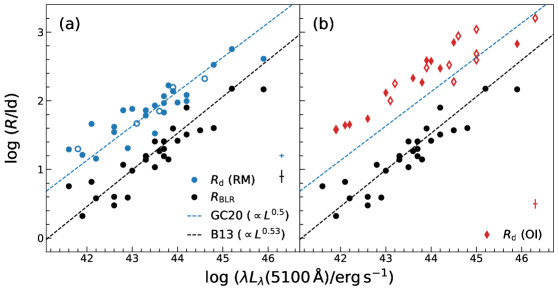
Figure 1 displays our sample. The dust – relations measured by both RM and OI are systematically above the BLR – relation. Moreover, the continuum size measured by OI is above that of RM. The – relations of dust RM and OI measurements have been discussed in many previous works (e.g. Suganuma et al., 2006; Kishimoto et al., 2009, 2011; Koshida et al., 2014; Minezaki et al., 2019; Gravity Collaboration et al., 2020b). One common explanation is that the RM-measured time lag is weighted by the amplitude of flux variations, which is expected to originate most strongly from the inner boundary of the hot dust; on the other hand, OI-measured sizes are mainly flux-weighted and, therefore, are elevated by contributions of lower temperature dust at larger radii (Kishimoto et al., 2009, 2011). Another slightly different explanation assumes that the dust structure is a ‘bowl shape’ (Kawaguchi & Mori, 2010): we mainly observe the foreground side at a low inclination angle for type 1 AGNs, and dust at larger radii is also closer to the observer, so the projected size increases more significantly than their RM time lag towards larger radii (Pozo Nuñez et al., 2014; Sobrino Figaredo et al., 2020). A more detailed discussion of BLR and dust structure models is beyond the scope of this paper. Throughout the paper, we use OI and RM to refer to the dust continuum measurements from these two different methods unless otherwise clarified.
Previous works studying both RM and OI observations have hinted that the slope of the dust continuum – relation is shallower than . The slopes in our current RM and OI samples are both about 0.4, consistent with previous works. We leave a more detailed discussion of the – relation in a separate paper (GRAVITY Collaboration et al. in preparation). In summary, previous RM studies provide various explanations of the shallower slope relating to the dust structure, dust response to the accretion disk emission, and its putative effect on the observed optical luminosity (e.g. Minezaki et al., 2019; Sobrino Figaredo et al., 2020). Based on the OI measurements, Gravity Collaboration et al. (2020b) suspect the continuum emission of the accretion disk may bias the OI size measurement for the most luminous sources.
Likewise, recent RM BLR measurements (Du et al., 2015; Grier et al., 2017) also find targets with significantly lower than the canonical BLR – relation (e.g. Bentz et al., 2013). Some works find that the deviation closely correlates with the accretion rate of the BH (Du et al., 2015; Du & Wang, 2019; Martínez-Aldama et al., 2019; Dalla Bontà et al., 2020), while the physical driver remains unclear in some other works (Grier et al., 2017; Fonseca Alvarez et al., 2020). The physical explanation of the deviation of BLR and dust continuum – relations is beyond the scope of the current paper. As discussed in the following sections, we find tight relations between and , which are close to linear, reflecting a simple link between the two physical structures.
3.1 Statistical analysis
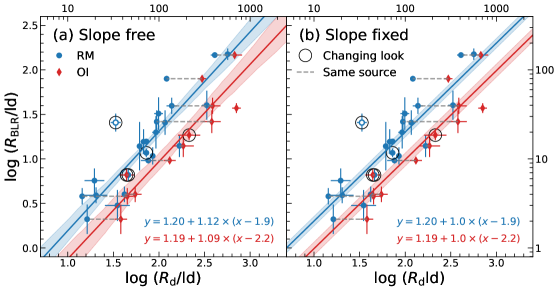
We find strong correlations between BLR and dust continuum sizes, as shown in Figure 2. We fit the relations for RM- and OI-measured separately as they show systematic differences. We fit the data with a power-law relation,
| (2) |
where and are the intercept and the slope, and is a pivot point fixed close to the median of of the data to reduce the degeneracy of and . We adopt the Bayesian Markov Chain Monte Carlo (MCMC) approach to fit the data. The likelihood is,
| (3) |
where is data, is the model value based on and Equation (2), and includes the measurement uncertainties of the dust continuum () and BLR () radius as well as the intrinsic scatter (). We adopt uniform priors of the parameters that are wide enough and sample the posterior with the widely used Python package of MCMC, emcee (Foreman-Mackey et al., 2013). We used 32 walkers and 5000 steps, with the first 500 steps discarded as burn-in steps. The fitting is well converged.
| Relation | ||||
|---|---|---|---|---|
| RM (free) | 1.9 | |||
| OI (free) | 2.2 | |||
| RM (fixed) | 1 | 1.9 | ||
| OI (fixed) | 1 | 2.2 |
Notes. We fit the – relation for AGNs with measured by RM and OI, respectively. , , and are the intercept, slope, and intrinsic scatter of a linear relation. is the pivot point fixed in the fitting. The first two rows provides the best-fit parameters with free, while the last two rows are results with fixed to unity. OI-measured is about 0.3 dex larger than that measured by the RM.
The best-fit relations are very close to linear (throughout the paper, ‘linear’ refers ) when we allow the slope to be free, as shown in Figure 2a. Therefore, we also fit the data with the slope fixed to unity (Figure 2b). The best-fit results are listed in Table 2. For simplicity, we will take the -fixed fitting results in the following discussion and derive the BLR radius and BH mass with in Section 4. Given current uncertainties, whether we adopt the relations with free or fixed does not affect these results.
The dust continuum size measured from RM is about 0.7 dex (five times) larger than the BLR size, which is consistent with previous works (e.g. Koshida et al., 2014; Kokubo & Minezaki, 2020). The dust continuum size measured by OI is about 0.3 dex (two times) larger than that measured by RM, again consistent with previous studies (Kishimoto et al., 2011; Koshida et al., 2014; Gravity Collaboration et al., 2020b). We do not find the slope of the – relation to significantly deviate from unity. However, for the relation to be linear, any departure from for the – relations of the dust continuum and the BLR must be similar. Our sample shows a more significant deviation in – (5100 Å) than that in – (5100 Å). This difference may contribute to the scatter of the – relation, which we will discuss in Section 3.3.
3.2 Intrinsic scatter
The intrinsic scatter of the best-fit relations is about 0.25 dex for both RM and OI relations. The physical difference between the BLR and dust structure for individual targets may contribute to the scatter. Such a variation was observed in the mid-IR, where a large scatter of the – relation was observed (Burtscher et al., 2013). However, besides the individual BLR and dust structure difference, for the – relation, the uncertainty of the bolometric luminosity of an AGN is another primary source of the scatter. Studying the BLR and dust structure with the – relation allows us to avoid the uncertain bolometric luminosity. However, AGN variability still likely introduces considerable intrinsic scatter because the BLR and dust continuum sizes are not measured in a state where they reflect the same AGN bolometric luminosity.
As described in Section 2.3, most of the dust continuum RM measurements are made between 2001 and 2008, while the OI measurements are around 2009–2010 (Keck interferometry) and 2018–2022 (GRAVITY). The BLR measurements are conducted from the 1980s until recent years. NGC 5548 is one of the best targets to investigate the variability: Du & Wang (2019) collected 18 epochs of its BLR RM measurements from 1989 to 2015, and the BLR radius (time lag) varies from 4.2 ld to 26.5 ld with a standard deviation of 0.24 dex. Mrk 335 and Mrk 817 also have four epochs of BLR measurements across years, and their BLR radii changes are dex. For the dust continuum, Koshida et al. (2014) reported 6 epochs of dust continuum RM measurements for NGC 5548 from 2001 to 2007; the RMS of the dust continuum radius is about 0.1 dex. Other AGNs, NGC 3227, NGC 4051, and NGC 4151, with epochs of dust RM measurements, also show similar dex RMS variation. NGC 3783 was observed from 1974–1990 (Glass, 1992) and later in 2006–2009 (Lira et al., 2011); the measured -band time lags are consistent within their uncertainties. It is not surprising that the dust continuum size shows less variability: the dust re-radiation effectively averages the variability of the central engine on a longer time scale, while the RM technique measures the averaged size over the monitoring period.
Since the BLR size variation of the AGNs with multiple measurements always reach dex, we conclude that the observed 0.25 dex intrinsic scatter of the – relations can be explained by the time variation of the BLR and dust continuum sizes, while the physical difference between the BLR and dust structures of individual targets also plays a role. Future simultaneous measurements of BLR and dust continuum sizes have the potential to reveal a tighter – relation, while the related caveats are discussed in Section 4.3.
3.3 Higher-order correlations
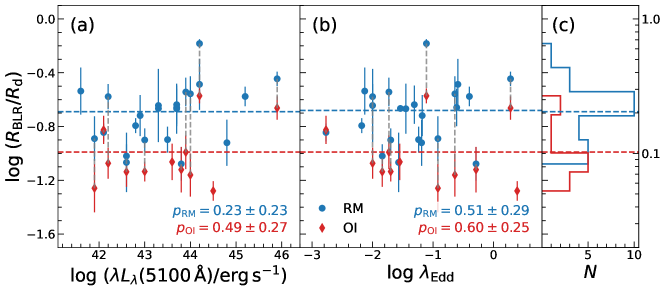
We investigate whether the scatter of the – relation correlates with the physical properties of the AGN. Since the – relations are remarkably close to linear (Section 3.1), we study the dependence of the ratio, , on the other physical parameters of the AGN. We calculate Spearman’s rank correlation coefficients to test the significance of the correlations. We perturb 500 times with the measurement uncertainties of and to calculate the -value distribution. The resulting -values do not support any significant correlations (i.e. ). We find that the conclusions do not change when we study the deviation of the – relations from the best-fit results with free.
We first investigate against the AGN luminosity and the Eddington ratio (Figure 3). Although the -values do not support significant correlations, we notice that, at , the three data points of PG 0953+414 and 3C 273 are all above the averaged values of . This trend may drive the slope to values slightly larger than 1 when we fit the – relation with the slope free. Unfortunately, our current sample has too few luminous AGNs to confirm such a trend. Previous BLR RM studies have found that the Eddington ratio may drive the deviation of the – relation such that highly accreting AGNs display shorter time lags (e.g. Du et al., 2015). We do not find a dependence of on the Eddington ratio. Nevertheless, our targets do not show significant deviation from the Bentz et al. (2013) relation either (Figure 1). It is worth noting that Mrk 509, which displays the highest deviation of has only and intermediate Eddington ratio. More observations are needed to understand the details of the – relation.
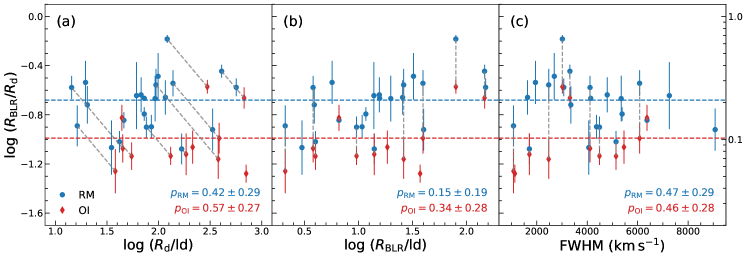
We further investigate the dependence of on , , and the FWHM of H (Figure 4). Again, Spearman’s rank correlation coefficients do not support a significant correlation with any of the three parameters. We only find a tentative trend that all three targets, PG 0953+414, 3C 373, and Mrk 509, with ld in Figure 4b show above the averaged values. This trend is similar to what is discussed above for AGNs, although we caution that the intrinsic scatter of the – relation will naturally lead to the correlation between and .
Moreover, in our sample, AGNs with the largest radii are at . Their -band measurements probe continuum emission at a slightly shorter wavelength (m) than the rest of the sample. One may simply expect the continuum size to be smaller at shorter wavelengths because of a larger contribution from higher temperature dust that is closer to the central engine (e.g., Oknyansky et al., 2015). Indeed, a sharp decrease in the time lag towards shorter wavelength was observed for NGC 4151 (Oknyanskij et al., 1999) and GQ Com (Sitko et al., 1993). However, it is more common that the time lags of dust emission only decrease moderately towards shorter wavelength (Oknyansky et al., 2015). A bi-conical dust distribution can explain this because dust with different temperatures is located on similar isodelay surfaces. Therefore, we suggest that the redshift effect is not likely to cause the observed deviation. However, it is hard to draw a firm conclusion with the limited number of measurements. More observations of AGNs with high luminosity and/or at high redshift would be essential to investigate this problem further.
4 Estimating BH masses with dust continuum sizes
4.1 BLR radius based on dust continuum measurements
We can now use the measured dust continuum radius to estimate the BLR radius for AGNs lacking BLR measurements. We adopt the best-fit parameters with in Table 2 so that Equation (2) can be written as
| (4) |
We adopt 0.25 dex as the uncertainty of based on the intrinsic scatter of the – relation. We expect the uncertainty of the – relations to be reduced in the future with more observations of the BLR and continuum close in time and of more luminous AGNs with large BLR sizes (however, see Section 4.3).
In Table 3, we report the derived from Equation (4) for AGNs in the lower part of Table 1. We plot these targets in Figure 5 with their against (5100 Å). The continuum-based follows the – relation of the direct BLR measurements. Similar to Du & Wang (2019) and Grier et al. (2017)’s results, we find AGNs more likely below the Bentz et al. (2013) relation, especially for the luminous () objects. Although we are still limited by the small number of objects, the distribution of our targets closely resembles the RM measured sample. Four targets, Mrk 1239, Mrk 231, IRAS 091496206, and PDS 456, show the most significant deviation from the Bentz et al. (2013) relation. As discussed in Section 4.2, all of them, except for IRAS 091496206, are at or above or above their Eddington luminosity. The Eddington ratio of IRAS 091496206 (about 0.4) is also high among the typical AGNs (e.g. the rest of the sample). Thus the large deviations from the – relation could be related to their high accretion rates (Du & Wang, 2019).
| Name | ||||
| (ld) | () | |||
| (1) | (2) | (3) | (4) | |
| NGC 1365 | 0.57 | 0.26 | 6.26 | |
| IRAS 03450+0055 | 1.50 | 0.25 | 7.77 | |
| IRAS 091496206 | 1.67 | 0.25 | 8.23 | |
| Mrk 1239 | 1.27 | 0.26 | 6.40 | 0.96 |
| WPVS 48 | 1.15 | 0.25 | 6.99 | |
| HE 10291401 | 1.93 | 0.26 | 8.73 | |
| Mrk 744 | 0.60 | 0.25 | 7.39 | |
| GQ Com | 1.62 | 0.26 | 8.32 | |
| Mrk 231 | 1.58 | 0.27 | 7.87 | |
| ESO 323-G77 | 0.99 | 0.25 | 7.12 | |
| IRAS 13349+2438 | 2.03 | 0.25 | 7.83 | |
| IC 4329A | 1.24 | 0.25 | 8.17 | |
| PGC 50427 | 0.97 | 0.25 | 7.22 | |
| PDS 456 | 2.19 | 0.26 | 8.68 | 0.47 |
| PGC 89171 | 1.47 | 0.26 | 7.61 | |
| NGC 7603 | 1.51 | 0.26 | 8.41 | |
Notes. Col. (1): Target name. Col. (2): BLR radius derived from with Equation (4). However, we find the difference between the results using the best-fit relations with fixed and free is much smaller than the uncertainties. Col. (3): BH mass derived from and H FWHM assuming the virial factor . Col. (4): Eddington ratio derived from (5100 Å) (Col. (9) of Table 1) and BH mass from Col. (3).
4.2 BH mass
Since our continuum-based is fully consistent with RM-measured , one can simply adopt Equation (1) and the virial factor previously calibrated for the RM method to derive the BH mass. We adopt to be consistent with Du & Wang (2019). The FWHM of the H line can be obtained from a single-epoch spectrum (Table 1). We further calculate the Eddington ratios of these targets with the bolometric luminosities scaled from (5100 Å) by a bolometric correction factor of 9 (Peterson et al., 2004). Four AGNs, Mrk 1239, Mrk 231, IRAS 13349+2438, and PDS 456, are close to or above the Eddington accretion. Their optical spectra (see their references in Col. (10) of Table 1) commonly show features of narrow widths of the broad H lines, weak or no [O III] 4959,5007 lines, and strong Fe II features. These features strongly indicate that these targets have high accretion rates (Boroson & Green 1992; Shen & Ho 2014 and references therein), consistent with our Eddington ratios. The BH masses of IRAS 091496206 and PGC 50427 are and , based on the spectroastrometry of the broad Br line Gravity Collaboration et al. (2020a) and the RM of H line (Pozo Nuñez et al., 2015), respectively. Our derived BH masses by the continuum-based method are very close ( dex) to those from the direct BLR measurements.
The primary uncertainty of the RM method to measure the BH mass comes from the virial factor. The calibration of typically shows dex intrinsic scatter (Woo et al., 2010; Ho & Kim, 2014), which consists of the variation of the BLR structure of individual targets and the intrinsic scatter of the – relation (Gebhardt et al., 2000; Ferrarese & Merritt, 2000). The sample selection and regression method may introduce a factor of 2 systematic difference of the virial factor (Graham et al., 2011; Park et al., 2012). The virial factor may differ by a factor of 2 depending on the bulge type (classical bulge and pseudo bulge; Ho & Kim 2014), which might be correlated to the systematics of the sample selection. For individual AGNs, one way to measure their virial factors is via dynamically modeling the velocity-resolved RM data (Pancoast et al., 2014a, b). Based on dynamical modeling results, Williams et al. (2018) find 0.2–0.5 dex uncertainties on the predictive distribution of the virial factor corresponding to different definitions of the line width. One should be cautious that the small scatter (e.g. 0.2 dex) may be due to the narrow range of parameter space spanned by their small sample. Altogether, to derive the BH mass, the uncertainty of the virial factor is likely dex. Since the continuum-based method shares the same uncertainty of the virial factor as the RM method, the – relation provides a promising method to measure the BH mass close, if not equivalent, to the accuracy of the RM method.
The single-epoch method is generally believed to be much more uncertain than RM due to the intrinsic scatter and the systematic bias of the – relation. The systematic deviation of the measured from the canonical – relation is discussed in Section 3 and Section 4.1. Dalla Bontà et al. (2020) recently provided the state-of-the-art calibration of the single-epoch method with the RM database (Bentz & Katz, 2015) and SDSS RM (Grier et al., 2017) samples. Their calibration empirically includes the secondary dependence of the Eddington ratio which results in an intrinsic scatter of of 0.31 dex for the virial product () when the line dispersion (in contrast to the FWHM) is used. This scatter is equivalent to the intrinsic scatter we find for the – relation ( dex) which will be the main contributor to the continuum-based virial product. We expect the continuum-based method scatter can be reduced with future observations of the BLR and the dust continuum size close in time, but we discuss the caveats in Section 4.3. We believe the direct dust continuum size measurement, which we have shown is tightly linked to the BLR size, is promising to provide high-accuracy BH masses in the future (more discussion in Section 5).
4.3 Caveats
The primary goal of this work is to propose the idea of measuring the BH mass based on the dust continuum size, particularly with time-efficient OI observations. The current calibration is not ideal because the BLR and dust continuum are not measured in the same AGN luminosity state. The line width measurements in the lower part of Table 1 are collected from different epochs too. This may introduce significant uncertainty on the BH mass (Table 3), because the latter is . Due to this reason, we caution that the BH mass and Eddington ratio in Table 3 are only for the purpose to discuss the new method instead of rigorous measurements.
In practice, it may not be easy to measure the BLR and dust continuum size when they reflect the same luminosity state in order to calibrate the – relation. It is more feasible to measure the BLR and the dust continuum sizes close in time (see also Section 5). In this way, the different time lags of the BLR and the hot dust will contribute to the intrinsic scatter of their size relation. The BLR size and the line width may show quicker and stronger variations than the dust continuum because the BLR has 5–10 times smaller size than the dust continuum. We expect a stronger averaging effect on the dust continuum too. For an extreme example, the dust continuum size may be correlated with a long-term average of the AGN luminosity over the previous several years, as discussed by Kishimoto et al. (2013) for NGC 4151. Future observations are important to quantify how much we can improve the – relation from the first calibration provided in this work.
The current calibration of the – relation is limited by the sample size. As briefly discussed in Section 3, various physical mechanisms may lead to the deviation of for both the BLR and the hot dust. Such deviations may reflect variations of BLR and hot dust structures, which may not necessarily follow each other. For example, the BLR radius may have a secondary dependence on the BH accretion rate (Du et al., 2015; Du & Wang, 2019), while the dust sublimation radius does not depend on it (Barvainis, 1987; Kishimoto et al., 2007). This difference means that the – relation may depend on some secondary physical parameters, such as the accretion rate. Such a dependence is not found in the current sample (Section 3.3), but we cannot rule out the possibility that we are limited by the parameter space of the current sample. Following Du et al. (2015, Equation 2), we calculate the dimensionless accretion rate, and find that our targets span , with 23% of our targets falling in their super-Eddington regime (). We do not find a correlation between and , but this correlation is worth revisiting with future larger samples including more high accretion rate AGNs.
5 Prospects
OI observations have great potential to measure the BLR and continuum of AGNs in the future. Current GRAVITY observations are limited to the brightest targets (). With the ongoing upgrade to significantly improve its sensitivity and sky coverage, GRAVITY+ will be capable of observing AGNs in on-axis mode or even fainter AGNs in off-axis mode with a phase reference source at (GRAVITY+ Collaboration et al., 2022), enabling observations of thousands of AGNs from out to .
Dust continuum sizes are a side product of GRAVITY(+) spectroastrometry observations of the BLR if the AGN itself is bright enough to be the phase reference. Half of the AGN emission is split into the low-resolution beam combiner (or the ‘fringe tracker’), which is used as the phase reference of the long-time exposure in the science channel to measure the BLR spectroastrometric signal (Gravity Collaboration et al., 2017). The dust continuum size can be measured from the visibility of the fringe tracker data. Since the spectroastrometric measurement constrains the BLR geometry and dynamics and the BH mass for individual AGNs, we can use the simultaneous measurements of the BLR and continuum to calibrate the virial factor in Equation (1) directly for instead of . This approach will further improve the accuracy of BH masses from the continuum-based method.
GRAVITY can efficiently measure the dust continuum size, e.g. hour observation for one source with current sensitivity (GRAVITY Collaboration et al. in preparation). We can put all AGN light into the fringe tracker so that the continuum method can measure the BH mass of AGNs a factor of two (or 0.75 mag) fainter than the spectroastrometry method. GRAVITY+ observations will be able to measure the dust continuum size and derive the BLR size of a few hundreds of AGNs, including many sources with . They will be crucial to understanding the dependence of BLR properties and the BH accretion on the AGN properties.
6 Summary
In this paper, we collect 42 AGNs with dust continuum size measurements from RM and/or OI observations. Among them, the BLR size based on H RM measurements of 26 AGNs are available. We find close linear relations between the BLR and dust continuum radius with an intrinsic scatter of only 0.25 dex. The dust continuum radius measured by OI is about twice as large as that measured by RM. Dust continuum radii measured by RM and OI are about five and ten times the radius of the BLR, respectively. We provide simple scaling relations to derive the BLR radius based on the dust continuum radius, measured with RM and OI separately. For the remaining 16 AGNs, we calculate their BLR radii, BH masses, and Eddington ratios using the – relations. We find that these AGNs consistently follow the BLR – relation of previous RM and GRAVITY measurements. All targets significantly below the Bentz et al. (2013) relation show a high Eddington ratio.
The accuracy of the continuum-based BH mass is comparable to that of the integrated broad emission line RM measurements since the primary uncertainty comes from the virial factor. The primary goal of this paper is to propose a new method to measure the BH mass based on the dust continuum size. We discuss the caveats of the method in detail. More continuum observations close in time with BLR measurements will be essential to study better the – relation in the future. In particular, it is important to test whether luminous AGNs with large BLRs show a different – relation compared to their low-luminosity counterparts. With its improved sensitivity, GRAVITY+ will be powerful to improve the continuum-based method and to efficiently measure the BH mass for a large sample of AGNs in the low-redshift Universe using this method.
Acknowledgements.
We thank the anonymous referees for their careful reading and suggestions that helped to improve this manuscript. This research has made use of the NASA/IPAC Extragalactic Database (NED) which is operated by the California Institute of Technology, under contract with the National Aeronautics and Space Administration. This research has made use of the SIMBAD database, operated at CDS, Strasbourg, France.References
- Baribaud et al. (1992) Baribaud, T., Alloin, D., Glass, I., & Pelat, D. 1992, A&A, 256, 375
- Barth et al. (2011) Barth, A. J., Nguyen, M. L., Malkan, M. A., et al. 2011, ApJ, 732, 121
- Barvainis (1987) Barvainis, R. 1987, ApJ, 320, 537
- Baskin & Laor (2018) Baskin, A. & Laor, A. 2018, MNRAS, 474, 1970
- Bentz et al. (2013) Bentz, M. C., Denney, K. D., Grier, C. J., et al. 2013, ApJ, 767, 149
- Bentz & Katz (2015) Bentz, M. C. & Katz, S. 2015, PASP, 127, 67
- Bentz et al. (2021) Bentz, M. C., Street, R., Onken, C. A., & Valluri, M. 2021, ApJ, 906, 50
- Blandford & McKee (1982) Blandford, R. D. & McKee, C. F. 1982, ApJ, 255, 419
- Boizelle et al. (2019) Boizelle, B. D., Barth, A. J., Walsh, J. L., et al. 2019, ApJ, 881, 10
- Boroson & Green (1992) Boroson, T. A. & Green, R. F. 1992, ApJS, 80, 109
- Burtscher et al. (2013) Burtscher, L., Meisenheimer, K., Tristram, K. R. W., et al. 2013, A&A, 558, A149
- Clavel et al. (1989) Clavel, J., Wamsteker, W., & Glass, I. S. 1989, ApJ, 337, 236
- Collin et al. (2006) Collin, S., Kawaguchi, T., Peterson, B. M., & Vestergaard, M. 2006, A&A, 456, 75
- Dalla Bontà et al. (2020) Dalla Bontà, E., Peterson, B. M., Bentz, M. C., et al. 2020, ApJ, 903, 112
- Davis (2014) Davis, T. A. 2014, MNRAS, 443, 911
- Denney et al. (2014) Denney, K. D., De Rosa, G., Croxall, K., et al. 2014, ApJ, 796, 134
- Dong et al. (2018) Dong, X. Y., Wu, X.-B., Ai, Y. L., et al. 2018, AJ, 155, 189
- Du et al. (2018) Du, P., Brotherton, M. S., Wang, K., et al. 2018, ApJ, 869, 142
- Du et al. (2015) Du, P., Hu, C., Lu, K.-X., et al. 2015, ApJ, 806, 22
- Du & Wang (2019) Du, P. & Wang, J.-M. 2019, ApJ, 886, 42
- Ferrarese & Merritt (2000) Ferrarese, L. & Merritt, D. 2000, ApJ, 539, L9
- Fonseca Alvarez et al. (2020) Fonseca Alvarez, G., Trump, J. R., Homayouni, Y., et al. 2020, ApJ, 899, 73
- Foreman-Mackey et al. (2013) Foreman-Mackey, D., Hogg, D. W., Lang, D., & Goodman, J. 2013, PASP, 125, 306
- Gebhardt et al. (2000) Gebhardt, K., Bender, R., Bower, G., et al. 2000, ApJ, 539, L13
- Glass (1992) Glass, I. S. 1992, MNRAS, 256, 23P
- Goodrich (1989) Goodrich, R. W. 1989, ApJ, 340, 190
- Graham et al. (2011) Graham, A. W., Onken, C. A., Athanassoula, E., & Combes, F. 2011, MNRAS, 412, 2211
- Gravity Collaboration et al. (2017) Gravity Collaboration, Abuter, R., Accardo, M., et al. 2017, A&A, 602, A94
- GRAVITY+ Collaboration et al. (2022) GRAVITY+ Collaboration, Abuter, R., Allouche, F., et al. 2022, arXiv e-prints, arXiv:2206.00684
- Gravity Collaboration et al. (2021a) Gravity Collaboration, Amorim, A., Bauböck, M., et al. 2021a, A&A, 654, A85
- Gravity Collaboration et al. (2021b) Gravity Collaboration, Amorim, A., Bauböck, M., et al. 2021b, A&A, 648, A117
- Gravity Collaboration et al. (2020a) Gravity Collaboration, Amorim, A., Bauböck, M., et al. 2020a, A&A, 643, A154
- Gravity Collaboration et al. (2020b) Gravity Collaboration, Dexter, J., Shangguan, J., et al. 2020b, A&A, 635, A92
- Gravity Collaboration et al. (2018) Gravity Collaboration, Sturm, E., Dexter, J., et al. 2018, Nature, 563, 657
- Greene & Ho (2005) Greene, J. E. & Ho, L. C. 2005, ApJ, 630, 122
- Grier et al. (2013) Grier, C. J., Martini, P., Watson, L. C., et al. 2013, ApJ, 773, 90
- Grier et al. (2017) Grier, C. J., Trump, J. R., Shen, Y., et al. 2017, ApJ, 851, 21
- Hicks & Malkan (2008) Hicks, E. K. S. & Malkan, M. A. 2008, ApJS, 174, 31
- Ho & Kim (2014) Ho, L. C. & Kim, M. 2014, ApJ, 789, 17
- Huang et al. (2019) Huang, Y.-K., Hu, C., Zhao, Y.-L., et al. 2019, ApJ, 876, 102
- Jones et al. (2009) Jones, D. H., Read, M. A., Saunders, W., et al. 2009, MNRAS, 399, 683
- Kaspi et al. (2000) Kaspi, S., Smith, P. S., Netzer, H., et al. 2000, ApJ, 533, 631
- Kawaguchi & Mori (2010) Kawaguchi, T. & Mori, M. 2010, ApJ, 724, L183
- Kishimoto et al. (2022) Kishimoto, M., Anderson, M., ten Brummelaar, T., et al. 2022, arXiv e-prints, arXiv:2209.06061
- Kishimoto et al. (2011) Kishimoto, M., Hönig, S. F., Antonucci, R., et al. 2011, A&A, 527, A121
- Kishimoto et al. (2009) Kishimoto, M., Hönig, S. F., Antonucci, R., et al. 2009, A&A, 507, L57
- Kishimoto et al. (2013) Kishimoto, M., Hönig, S. F., Antonucci, R., et al. 2013, ApJ, 775, L36
- Kishimoto et al. (2007) Kishimoto, M., Hönig, S. F., Beckert, T., & Weigelt, G. 2007, A&A, 476, 713
- Kokubo & Minezaki (2020) Kokubo, M. & Minezaki, T. 2020, MNRAS, 491, 4615
- Kollatschny & Fricke (1985) Kollatschny, W. & Fricke, K. J. 1985, A&A, 146, L11
- Korista & Goad (2004) Korista, K. T. & Goad, M. R. 2004, ApJ, 606, 749
- Koshida et al. (2014) Koshida, S., Minezaki, T., Yoshii, Y., et al. 2014, ApJ, 788, 159
- Koss et al. (2017) Koss, M., Trakhtenbrot, B., Ricci, C., et al. 2017, ApJ, 850, 74
- Leftley et al. (2021) Leftley, J. H., Tristram, K. R. W., Hönig, S. F., et al. 2021, ApJ, 912, 96
- Lira et al. (2011) Lira, P., Arévalo, P., Uttley, P., McHardy, I., & Breedt, E. 2011, MNRAS, 415, 1290
- Lira et al. (2015) Lira, P., Arévalo, P., Uttley, P., McHardy, I. M. M., & Videla, L. 2015, MNRAS, 454, 368
- Lub & de Ruiter (1992) Lub, J. & de Ruiter, H. R. 1992, A&A, 256, 33
- Mandal et al. (2018) Mandal, A. K., Rakshit, S., Kurian, K. S., et al. 2018, MNRAS, 475, 5330
- Mandal et al. (2021a) Mandal, A. K., Rakshit, S., Stalin, C. S., et al. 2021a, MNRAS, 501, 3905
- Mandal et al. (2021b) Mandal, A. K., Schramm, M., Rakshit, S., et al. 2021b, MNRAS, 508, 5296
- Marconi et al. (2003) Marconi, A., Maiolino, R., & Petrov, R. G. 2003, Ap&SS, 286, 245
- Marin et al. (2019) Marin, F., Hutsemékers, D., & Agís González, B. 2019, in SF2A-2019: Proceedings of the Annual meeting of the French Society of Astronomy and Astrophysics, ed. P. Di Matteo, O. Creevey, A. Crida, G. Kordopatis, J. Malzac, J. B. Marquette, M. N’Diaye, & O. Venot, Di
- Martínez-Aldama et al. (2019) Martínez-Aldama, M. L., Czerny, B., Kawka, D., et al. 2019, ApJ, 883, 170
- Mejía-Restrepo et al. (2018) Mejía-Restrepo, J. E., Lira, P., Netzer, H., Trakhtenbrot, B., & Capellupo, D. M. 2018, Nature Astronomy, 2, 63
- Minezaki et al. (2004) Minezaki, T., Yoshii, Y., Kobayashi, Y., et al. 2004, ApJ, 600, L35
- Minezaki et al. (2019) Minezaki, T., Yoshii, Y., Kobayashi, Y., et al. 2019, ApJ, 886, 150
- Nardini et al. (2015) Nardini, E., Reeves, J. N., Gofford, J., et al. 2015, Science, 347, 860
- Netzer (1990) Netzer, H. 1990, in Active Galactic Nuclei, ed. R. D. Blandford, H. Netzer, L. Woltjer, T. J. L. Courvoisier, & M. Mayor, 57–160
- Oknyanskij et al. (1999) Oknyanskij, V. L., Lyuty, V. M., Taranova, O. G., & Shenavrin, V. I. 1999, Astronomy Letters, 25, 483
- Oknyansky et al. (2015) Oknyansky, V. L., Gaskell, C. M., & Shimanovskaya, E. V. 2015, Odessa Astronomical Publications, 28, 175
- Onishi et al. (2017) Onishi, K., Iguchi, S., Davis, T. A., et al. 2017, MNRAS, 468, 4663
- Onken et al. (2004) Onken, C. A., Ferrarese, L., Merritt, D., et al. 2004, ApJ, 615, 645
- Onken & Peterson (2002) Onken, C. A. & Peterson, B. M. 2002, ApJ, 572, 746
- Onken et al. (2014) Onken, C. A., Valluri, M., Brown, J. S., et al. 2014, ApJ, 791, 37
- Onori et al. (2017) Onori, F., Ricci, F., La Franca, F., et al. 2017, MNRAS, 468, L97
- Pan et al. (2021) Pan, X., Zhou, H., Yang, C., et al. 2021, ApJ, 912, 118
- Pancoast et al. (2014a) Pancoast, A., Brewer, B. J., & Treu, T. 2014a, MNRAS, 445, 3055
- Pancoast et al. (2014b) Pancoast, A., Brewer, B. J., Treu, T., et al. 2014b, MNRAS, 445, 3073
- Park et al. (2012) Park, D., Kelly, B. C., Woo, J.-H., & Treu, T. 2012, ApJS, 203, 6
- Peterson (1993) Peterson, B. M. 1993, PASP, 105, 247
- Peterson (2014) Peterson, B. M. 2014, Space Sci. Rev., 183, 253
- Peterson et al. (2004) Peterson, B. M., Ferrarese, L., Gilbert, K. M., et al. 2004, ApJ, 613, 682
- Peterson et al. (1998) Peterson, B. M., Wanders, I., Bertram, R., et al. 1998, ApJ, 501, 82
- Petrov et al. (2001) Petrov, R. G., Malbet, F., Richichi, A., et al. 2001, Comptes Rendus Physique, 2, 67
- Planck Collaboration et al. (2016) Planck Collaboration, Ade, P. A. R., Aghanim, N., et al. 2016, A&A, 594, A13
- Pozo Nuñez et al. (2014) Pozo Nuñez, F., Haas, M., Chini, R., et al. 2014, A&A, 561, L8
- Pozo Nuñez et al. (2015) Pozo Nuñez, F., Ramolla, M., Westhues, C., et al. 2015, A&A, 576, A73
- Prieto et al. (2022) Prieto, A., Rodríguez-Ardila, A., Panda, S., & Marinello, M. 2022, MNRAS, 510, 1010
- Probst & Kollatschny (2020) Probst, M. A. & Kollatschny, W. 2020, Contributions of the Astronomical Observatory Skalnate Pleso, 50, 360
- Ramolla et al. (2018) Ramolla, M., Haas, M., Westhues, C., et al. 2018, A&A, 620, A137
- Rashed et al. (2015) Rashed, Y. E., Eckart, A., Valencia-S., M., et al. 2015, MNRAS, 454, 2918
- Rees et al. (1969) Rees, M. J., Silk, J. I., Werner, M. W., & Wickramasinghe, N. C. 1969, Nature, 223, 788
- Saglia et al. (2016) Saglia, R. P., Opitsch, M., Erwin, P., et al. 2016, ApJ, 818, 47
- Senarath et al. (2021) Senarath, M. R., Brown, M. J. I., Cluver, M. E., et al. 2021, MNRAS, 503, 2583
- Shangguan et al. (2018) Shangguan, J., Ho, L. C., & Xie, Y. 2018, ApJ, 854, 158
- Shankar et al. (2019) Shankar, F., Bernardi, M., Richardson, K., et al. 2019, MNRAS, 485, 1278
- Shapovalova et al. (2019) Shapovalova, A. I., Popović, , L. Č., et al. 2019, MNRAS, 485, 4790
- Shen (2013) Shen, Y. 2013, Bulletin of the Astronomical Society of India, 41, 61
- Shen & Ho (2014) Shen, Y. & Ho, L. C. 2014, Nature, 513, 210
- Sitko et al. (1993) Sitko, M. L., Sitko, A. K., Siemiginowska, A., & Szczerba, R. 1993, ApJ, 409, 139
- Sobrino Figaredo et al. (2020) Sobrino Figaredo, C., Haas, M., Ramolla, M., et al. 2020, AJ, 159, 259
- Stalin et al. (2011) Stalin, C. S., Jeyakumar, S., Coziol, R., Pawase, R. S., & Thakur, S. S. 2011, MNRAS, 416, 225
- Suganuma et al. (2006) Suganuma, M., Yoshii, Y., Kobayashi, Y., et al. 2006, ApJ, 639, 46
- Swain et al. (2003) Swain, M., Vasisht, G., Akeson, R., et al. 2003, ApJ, 596, L163
- Thomas et al. (2004) Thomas, J., Saglia, R. P., Bender, R., et al. 2004, MNRAS, 353, 391
- Vestergaard & Peterson (2006) Vestergaard, M. & Peterson, B. M. 2006, ApJ, 641, 689
- Wang et al. (2017) Wang, J.-M., Du, P., Brotherton, M. S., et al. 2017, Nature Astronomy, 1, 775
- Williams et al. (2018) Williams, P. R., Pancoast, A., Treu, T., et al. 2018, ApJ, 866, 75
- Wittkowski et al. (2004) Wittkowski, M., Kervella, P., Arsenault, R., et al. 2004, A&A, 418, L39
- Woo et al. (2010) Woo, J.-H., Treu, T., Barth, A. J., et al. 2010, ApJ, 716, 269
- Zheng et al. (2002) Zheng, X. Z., Xia, X. Y., Mao, S., Wu, H., & Deng, Z. G. 2002, AJ, 124, 18