A UFO Seen Edge-On:
Resolving Ultrafast Outflow Emission on 200-pc Scales with Chandra
in the Active Nucleus of Mrk 34
Abstract
We present Chandra ACIS imaging spectroscopy of the nucleus of the Seyfert 2 Galaxy Mrk 34. We identify spatially and spectrally resolved features in the band that includes Fe K, Fe XXV and Fe XXVI. These features indicate high-velocity ( line-of-sight) material spanning , within pc of the nucleus. This outflow could have deprojected velocities greater than the [O III] emitting outflows, and could potentially dominate the kinetic power in the outflow. This emission may point to the origins of the optical and X-ray winds observed at larger radii, and could indicate a link between ultra-fast outflows and AGN feedback on kpc scales.
1 Introduction
Active galactic nuclei (AGN) are observed to generate jets and winds, which are thought to play critical roles in galaxy evolution in the form of ‘feedback’, which may stimulate or suppress star formation via the expulsion of star-forming gas from the host galaxy, by regulating the temperature and density of the remaining ISM, and by affecting the rate at which the nuclear black hole accretes matter.
AGN feedback is likely a complex, multi-stage process (Hopkins & Elvis 2010; Gaspari & Sądowski 2017; Harrison et al. 2018). Ultra-fast outflows seen in absorption (UFOs, Laha et al. 2021) reach , which is clearly capable of expelling ISM. But even the closest UFOs are spatially unresolved and inferences that such velocities are sustained beyond pc scales therefore require indirect constraints. Large-scale outflows in the host ISM may reach kpc scales but rarely exceed in spatially resolved optically-emitting or molecular gas (e.g. Fischer et al. 2013). In the case of [O III] kinematics, only velocities in excess of typical rotational velocities () can be attributed to outflows capable of producing effective AGN feedback (Fischer et al. 2017). Understanding the transition between these two regimes is critical to modeling the physics of AGN feedback, but this interface regime is particularly challenging to observe due to the the low emissivity of hot plasmas and the instrumental limits of modern X-ray telescopes.
A growing number of observations indicate evidence for such an interface region at pc scales. BALQSO spectra indicating UFO-like velocities may be common at pc scales (Arav et al. 2018). Possible evidence for multiphase gas entrained in ultrafast outflows (E-UFOs) has also been seen in unresolved spectra at pc scales (Serafinelli et al. 2019).
With the availability of increasingly deep Chandra observations, the Fe K complex has recently become a promising tool for studying spatially resolved AGN-host interactions on sub-kpc scales. This complex includes neutral Fe K (6.4 keV rest energy) as well as helium-like Fe XXV triplet at keV and the 7.0 keV Ly of hydrogenic Fe XXVI. A growing number of observations of local Seyfert 2 galaxies like NGC 6240, ESO 428-G014, IC 5063, NGC 3393 and others have shown extended hard (3-8 keV) emission, extending to kpc scales in some cases (Fabbiano et al. 2017, 2018a, 2018b, 2019; Jones et al. 2020, 2021; Ma et al. 2020; Maksym et al. 2017, 2019; Travascio et al. 2021; Wang et al. 2014), as well as reflected Fe K (Fabbiano et al. 2017, 2019; Jones et al. 2020; Travascio et al. 2021) and Fe XXV excited via collisions between AGN outflows and molecular clouds in the ISM (Travascio et al. 2021).
Mrk 34 (; Hubble distance Mpc; 1″= 1014 pc for , Revalski et al. 2018) is known to have powerful outflows associated with spatially extended radio emission and narrow line emission in the optical and X-rays (Falcke et al. 1998; Revalski et al. 2018, 2019; Trindade Falcão et al. 2021b; Bessiere & Ramos Almeida 2022). A radial increase in outflow gas mass in Mrk 34, with increasing towards pc, leads Revalski et al. (2018, 2019) to suggest that [O III] gas is accelerated in situ. But models by Trindade Falcão et al. (2021b) indicate that the [O III] gas may originate from a lower-ionization, higher-density state, and that this process may be facilitated by an X-ray wind which can be more kinematically powerful than the optical gas by a factor of .
Mrk 34 is highly obscured (log ; Gandhi et al. 2014; Zhao et al. 2020), and is therefore another excellent candidate for similar spatial mapping of extended hard emission. In this paper, we examine spatially resolved emission in Chandra observations of Mrk 34 in the 5.5-7.0 keV band. We find evidence for high-velocity iron outflows which may provide a link between ultrafast outflows seen in absorption and kpc-scale winds seen in emission.
2 Observations and Processing
Mrk 34 was observed by Chandra with ACIS on 2017 January 30 to spatially resolve X-ray emission from termination shocks in two of the most powerful kinematic outflows with angular scales accessible to Chandra (Obsid 18121, PI: Elvis). Detailed spatial and spectroscopic analysis of the other program target, Mrk 78, was published by (Fornasini et al. 2022) and is similarly in preparation for the Mrk 34 observations (Maksym et al). Data were reduced using standard Chandra methods and version 4.13 of the CIAO package (Fruscione et al. 2006), with CALDB version 4.9.3. We reprocessed the data using chandra_repro and found no significant background flares. Useful exposure time totaled 99.1 ks. We used wavdetect to identify matches between field X-ray sources and SDSS (Ahn et al. 2012), and cross-registered the astrometry with wcs_match and wcs_update.We excluded matches with residuals , leaving 3 sources with positional uncertainties of each.
Mrk 34 was previously observed by the VLA on 1991 Sep. 1 in the X-band (8.44 GHz) as part of program AW0278. We used the processed NRAO archival image which has a beam size of and rms sensitivity of 26 Jy.
3 Data Reduction and Results
3.1 Nuclear Spectroscopy
In order to identify useful line emission features for sub-arcsecond imaging, we initially assumed the active galactic nucleus to be located at the centroid of the 6-7 keV band for the purpose of spectroscopy. We extracted a spectrum of the nucleus for a circle at this position (J2000 ), which is comparable to the encircled energy radius for this band. The spectrum has 5 photons per energy bin, which when fitted with lstat (Loredo 1992) is a useful compromise between the energy resolution of unbinned cstat fitting (Cash 1979) and the ability to subtract an unmodeled background with fitting.
We fit this spectrum with XSpec, excluding the soft emission below 3 keV (observer) which is typically dominated by ionized reflection or emission from collisionally excited plasma on scales reaching the extended narrow line region (ENLR pc scales; see e.g. Maksym et al. 2017, 2019 and for Mrk 34, Trindade Falcão et al. 2021b and Maksym et al. in prep).
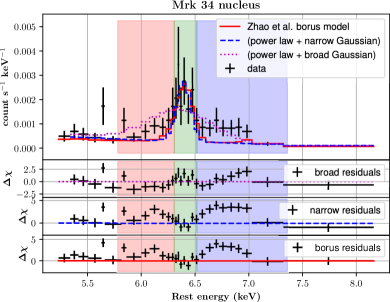
We can model the continuum with a simple absorbed power law model fit to 3-8 keV (observer) which excludes the Fe K complex by ignoring data points between 5.5-7.0 keV (observer). We then model an expected neutral Fe K contribution to the observed excess emission by adding a ( keV) Gaussian at keV (rest).
The best fit for this model produces an effective 5.5-7.0 keV (observer) and Gaussian width . This is an order of magnitude larger than velocities characteristic of the torus and
the NLR and is sufficiently broad that it would be affected if Fe XXV contributes significantly. The residual structure also suggests that a narrow Fe K line should be considered.
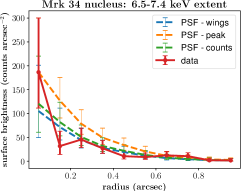
When we assume a single unresolved Gaussian at Fe K, residual excess “wings" are seen immediately redward (5.8-6.3 keV, rest) and blueward (6.5-7.0 keV, rest) of Fe K, suggestive of outflows at (assuming an ionization state of Fe XVII at most; Figure 1).
Using additional Gaussian components, we estimate the (red, blue) wing to have significance and equivalent width . The center of the blue wing is at keV (rest), and is therefore consistent with Fe XXV at . Narrow Fe XXVI is consistent with a detection, and .
For comparison, also in Fig. 1 we show a fit to a physically motivated model which also incorporates very hard X-ray constraints ( keV).
We also adopt a variant of the Zhao et al. (2020) model, which used a combination of an AGN torus model (borus02; Baloković et al. 2018) and absorbed power laws with high energy cutoffs in a joint fit to this dataset and NuSTAR.
Zhao et al. (2020) fit this model using several types of constraints, but we begin with the “free" fit parameters from Zhao et al. (2020) Table 2. These parameters are comparable to other configurations which they consider, which assume [O III]-derived constraints or torus inclination. In order to avoid model-dependent contamination of the hard continuum model via constraints from complex soft (0.3-3 keV) extended emission, we excluded the Zhao et al. (2020) soft thermal plasma component and froze all other parameters except a normalization constant. The spectral shape of the unresolved obscured emission is therefore constrained by the NuSTAR data. But with from the torus the hard Chandra continuum effectively reduces to the absorbed power law.
Excluding the Fe K complex ( keV observer) from the fit tends to produce excess in the 6.0-6.2 keV band for the Zhao et al. (2020) model, corresponding to narrow emission from neutral Fe K at 6.4 keV (rest). Leaving the borus02 iron abundance free can reduce this excess, but with unphysically low values for an AGN nucleus (). This suggests that the binning scheme used by Zhao et al. (2020) is too coarse (20 counts bin-1) to spectrally resolve the relevant substructure seen here in the Fe K complex and continuum.
Fig. 1 shows that the excess “wing" emission observed above the power law is nearly identical compared to this more physically motivated model, and therefore does not appear to be strongly model-dependent.
3.2 Multi-band Imaging
In order to examine whether the possible Fe K wings have spatial extent and structure, we produced images dividing Fe K into three bands (‘red wing’, 5.8-6.3 keV rest; ’core’, 6.3-6.5 keV; ‘blue wing’ blue, 6.5-7.4 keV). For comparison, we have also included a hard ‘continuum’ band ( keV rest), which has long been broadly assumed to be point-like in AGN but has recently been observed to have extent in numerous instances (e.g. Maksym et al. 2017; Ma et al. 2020; Jones et al. 2021).
We binned the photon events at 1/16th native ACIS pixel scale () and applied Gaussian smoothing with pixels (). We also used dmimgadapt to generate adaptively smoothed images that preserve features with photon counts ( significance). VLA radio contours are overlaid to enable comparison to analysis of the Mrk 34 outflows in other work. We also used a spectrum of the nucleus, marx (Davis et al. 2012) and SAOTrace111https://cxc.harvard.edu/ciao/PSFs/chart2/runchart.html to simulate an event file of the ACIS point spread function with 5.5-7.0 keV counts at ( observed).
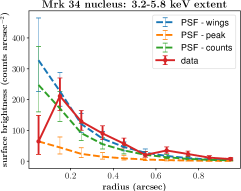
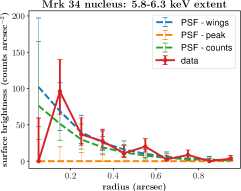
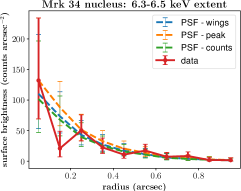
Figure 2 shows the single band results of this smoothing (column #1 for Gaussian smoothing, column #2 for adaptive smoothing). Figure 2 column #3 shows radial profiles of the Mrk 34 nucleus for , binned at intervals. The band-specific centroid for each unsmoothed photon image is set to and compared against the band-specific PSF simulation. The PSF is shown with counts and errors according to three different normalizations: median surface brightness for the bins, the bin only, and total counts.
The hard continuum (3.2-5.8 keV, 114 counts for ) shows two features roughly NW and SE of the band centroid, separated by PSF FWHM. The radial profile of this band shows a central bin with a significant deficit when normalized to match the PSF wings, and its test is inconsistent with the PSF at .
The red wing (5.8-6.3 keV, 41 counts for ) also shows significant resolved structure. It also has a significant radial profile deficit at . The radial profile alone rejects the PSF model at only 90% significance, but there is also significant azimuthal structure with a N-S orientation. When data are divided into four equal N, S, E and W bins, the PSF model is rejected at .
PSF comparisons fail to show extent within the blue wing (6.5-7.4 keV rest, 42 counts, ) and core Fe K band (6.3-6.5 keV, 46 counts, ).
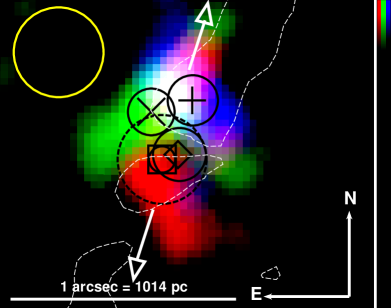
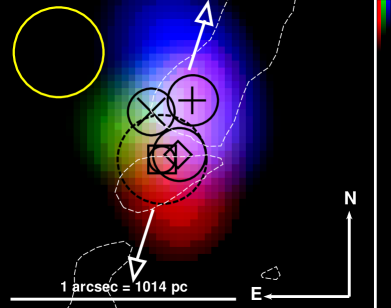
For cross-band comparison, we produced an image (Fig. 3) which overlays the Fe K bands (red, 5.8-6.3 keV rest; green ’core’, 6.3-6.5 keV; blue, 6.5-7.4 keV), as well as centroid positions for the Fe K bands and the hard continuum.
Positional uncertainties are determined via dmstat and are typically . The centroid positions of the red, core and blue wings of the Fe K complex all vary by from each other. The hard continuum centroid is consistent with the other bands, but its large positional uncertainty is attributable to observed NW-SE substructure larger than the PSF uncertainty in the Fe K complex bands. There is therefore spatial structure not only within bands (in the hard continuum and red wing) but via intra-band comparison across all four bands (including also the Fe K core) at the limits of the Chandra PSF.
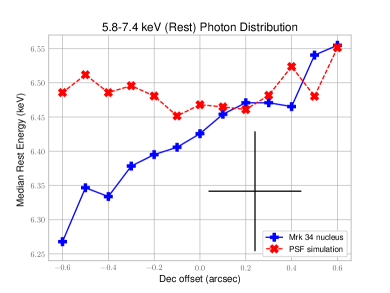
In order to further quantify this observed energy-dependent spatial structure in terms of observed N-S trends (and for comparison against outflow structures observed in the radio and optical, e.g. Revalski et al. 2018), we calculated the median photon energy as a function of offset in the 5.8-7.4 keV rest band for a series of boxes in (), each offset by in . The result is shown in Fig. 4, along with a similar energy profile for the PSF simulation. The median energy of the Mrk 34 nucleus shifts almost monotonically by 288 eV () over ( kpc). This exceeds both the ACIS-S energy FWHM of eV at 5.9 keV, and the in-band simulated PSF FWHM of ). The bins’ median energies for the PSF simulation span eV. This span is greatest between the core and larger radii, and likely dominated by the tendency of the PSF to spread at larger energies222https://cxc.harvard.edu/proposer/POG/.
4 Discussion
Chandra ACIS imaging spectroscopy of the Mrk 34 nucleus shows evidence for spatially resolved ( pc) excess emission in the red and blue wings of Fe K, which corresponds to projected velocities of , and is robust against both physically motivated broad-band models (Zhao et al. 2020) and a simple power law continuum. Given the Compton-thick column density inferred by Zhao et al. (2020), this spectral structure is unlikely to be attributable to the accretion disk, which would be highly obscured. Rather, the Fe K complex emission should be emitted from the torus which would not be extended, pc from the bolometric luminosity (Trindade Falcão et al. 2021b) and the dust sublimation radius (Nenkova et al. 2008a, b), or from beyond the torus.
The hard continuum and Fe K complex show clear evidence for spatial extent, both within bands (in the hard continuum and red wing) and across bands (including also the Fe K core), ruling out a torus origin. We observe a spatially resolved trend of increasing median photon energy from south to north within the Fe K complex. This trend and the observed N-S structure within the red wing suggest a southern structure dominated by red wing photons, as well as a northern structure which is more spectroscopically complex, containing the blue wing and possibly contributions from other parts of the Fe K complex. This structure may be related to the dual peak structure seen in the hard continuum.
The representative scale of the multiband N-S structure between the centroid of the blue wing and the southernmost resolved features of either the hard continuum or the red wing is , which corresponds to pc. We can assume bilateral symmetry from a central nucleus and adopt the same bi-cone geometry as found for the [O III] outflow. The projected morphological orientation of the Fe K complex is consistent with structure described in other bands (Falcke et al. 1998; Fischer et al. 2013; Revalski et al. 2018; Trindade Falcão et al. 2021b).
4.1 Low-ionization Fluorescence

Although some of the blue wing may arise from thermal outflows, fluorescence provides a simpler explanation than thermal outflows for various reasons. First, the large EW of the red and blue wings ( keV) suggests reflection by the K transition of nearly neutral Fe species, such as might be found in dust, molecular clouds, or a moderately ionized X-ray wind (K transitions from Fe XXI are confused with Fe I by the ACIS-S CCD).
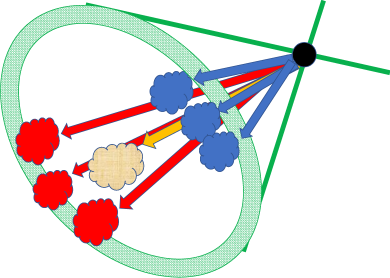
A spatially resolved outflow could explain both red and blue wings via bilateral symmetry similar to that seen from low-velocity outflows in optical and radio emission. If we assume the Fischer et al. (2013) bi-conical outflow model (SE, axial inclination towards the observer from the plane of the sky) and the blue-red N-S orientation of the Fe K wings, then the red and blue wings have the opposite projected velocities expected from a simple bulk outflow near the bi-cone axis. Figs. 5 and 6 illustrate the velocity structure of this model in comparison with results from our data.
The velocity splitting produced by [O III] in the Fischer et al. (2013) outflow model suggests that the X-ray emitting gas might also demonstrate velocity splitting due to a hollow conical structure. If so, the blue-red N-S orientation of the Fe K wings requires them to be produced at an angle in the bi-cone which has a small inclination from plane of the sky and small projected velocities, such that (where is the inner opening angle and is the outer opening angle).
This model implies a negligible spatial deprojection, difference. The observed spatial extent of the Fe K structure, pc, is larger than the torus. The pc region is associated with rapid radial increases in optical kinetic energy, kinetic power momentum and momentum outflow, and the X-ray features we describe are interior to the associated turnovers in these quantities at pc (Revalski et al. 2018, 2019).
Since , the median photon energy shift in Fig. 4 ( eV) from the central bin corresponds to deprojected . The red wing model excess is fit as a Gaussian at keV ( deprojected). The velocity shift for the blue wing would have a similar value. For comparison, the fastest optically emitting material in Mrk 34 has a deprojected velocity of , with the same [N, S] orientation for [blue, red] shifts.
Complementary counterpart features produced on the opposite side of the Mrk 34 cone are likely to be difficult to observe with Chandra given the corresponding projection angles. Redshifted Fe K gas in the NW cone may suffer from obscuration by host ISM (e.g. a likely E-W nuclear dust feature seen by HST Falcke et al. 1998), relativistic de-beaming and greater low-energy continuum from spatially confused emission. The energy response of Chandra ACIS drops more rapidly above keV than any gain from Blueshifted Fe K gas in the SE cone would fall, implying a detection for a red wing counterpart projected at a blueshift of . By comparison, the energy band (systemic; 7.0-9.1 keV observer) contains [4, 8] photons for , including continuum. This band’s centroid is south of the blue wing centroid, and consistent with the southern feature in the red wing.
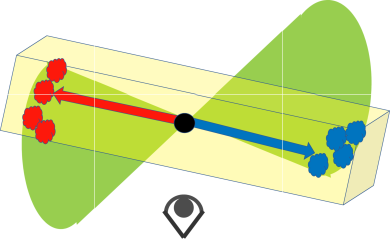
Unlike Fischer et al. (2013), Revalski et al. (2018, 2019) assume that the [O III] gas in Mrk 34 is confined to the plane of the galaxy (Fig. 7). In this model, the velocity deprojection factor would only be , implying deprojected . This interpretation is complicated by the lack of measured [O III] outflow components with the appropriate blue/red shift direction at but unlike Fischer et al. (2013) does not require explaining the nondetection of an opposite-shift counterpart in the same cone.
In either model, the deprojected velocities would be solidly in the regime of ultrafast outflows which in X-rays have normally been seen (unlike Compton-thick Mrk 34) as absorption at in an otherwise weakly obscured continuum, and commonly attributed to Fe XXV or Fe XXVI, Tombesi et al. 2010, 2014; Gofford et al. 2013; Chartas et al. 2021 (but see also a P-Cygni-like profile in Nardini et al. 2015). The velocity structure of Mrk 34 suggests bulk motion faster than the optical gas. With kinetic energy , such gas could produce the kinetic power in the X-ray winds described by Trindade Falcão et al. (2021b) with . Such winds might easily carry the bulk of the outflow kinetic energy and drive the acceleration of [O III] gas.
Since strong Fe K is likely to require a large column density (), it is likely to be associated with dusty molecular clouds. Such dense, low-ionization gas might then be converted into an [O III] wind expanding at larger radii, as per Trindade Falcão et al. (2021b). As per the galaxy-scale outflows in IC 5063, such clouds may be launched from the ISM via ablation at small radii (Maksym et al. 2020, 2021; Travascio et al. 2021) and entrained, or near the plane of the galaxy. Alternately, high-velocity dust may originate in the AGN wind itself, as outflowing clouds condense to form molecular structures as they cool (Elvis et al. 2002).
4.2 Spatially Resolved Obscuration
Local column overdensities may contribute to some of the observed spatial structure. HST observations (Falcke et al. 1998) show evidence for dust lanes which cut E-W across the nucleus. Such dust lanes could, for certain column densities, suppress the relatively soft continuum emission and red wing, e.g. at the spatial location of the blue wing. The blue wing is spatially coincident with the brightest radio hot spot, which may indicate the nucleus (such that deprojection may not be appropriate for the blue wing), but the absolute and relative astrometric uncertainty do not require this. If the blue wing is coincident with the nucleus, then the inferred radial extent is greater for the southern outflow (which is receding relative to the observer) but implies a larger radial extent for that outflow and implies a lack of a northern biconical counterpart.
4.3 Thermal Outflows
The blue wing energy range is consistent highly ionized Fe XXV at , which corresponds to depending upon the deprojection model. Others have observed extended Fe XXV in association with strong AGN outflow-ISM shocks (e.g. NGC 6240, Wang et al. 2014; NGC 4945, Marinucci et al. 2017; and IC 5063, Travascio et al. 2021). The proximity of the blue wing to the peak 8.44 GHz may point to a similar scenario in Mrk 34.
The spatial extent of the observed structure is consistent with that of optically emitting gas in a region where the kinetic power of the optically emitting gas rises steadily with increasing radius (Revalski et al. 2018, 2019). This could be true whether the blue wing were associated with the nucleus or offset from it. If the emission does originate from the continuum or highly-ionized Fe XXV then it may point to shocks in the hot component of a multi-phase medium. Simulations by e.g. Mukherjee et al. 2018 indicate the presence for K gas in IC 5063. Fe XXV in Mrk 34 suggests K, and for Fe XXVI to be negligible would be narrowly constrained.
One major difficulty in this scenario includes the large wing EW. In addition, the red wing emission is particularly difficult to explain via Fe XXV, requiring deprojected . If associated with bipolar outflows, such a feature may leave similarly blueshifted features at other energies (possibly via other species), which we have not been able to identify.
In principle, “Back-streaming" from jet-ISM interactions could cause a combination of low-velocity and high-velocity features. For example, Das et al. (2005) claim such effects for faint, high velocity [O III] clouds in NGC 4151 as the result of shocks. If some of the red and blueshifted iron line emission is co-located (such as with the northern component of the spatially bifurcated red wing, which is spatially consistent with the blue wing and the brightest radio hotspot) then Fe XXV and possibly Fe XXVI could be formed at a shock, while redshifted emission could be part of the backflow.
4.4 An Obscured Relativistic Jet
Bremsstrahlung from a relativistic jet at the nucleus might mimic an excess spanning the red and blue wings when obscured by Compton-thick material. Such an excess might be variable on observable timescales, and would appear as continuum emission at microcalorimeter (e.g. XRISM or Athena) resolution. Doppler effects from sufficiently relativistic extended outflows (either a wind or jet) might affect assumptions of spatial symmetry.
5 Conclusion
The spatially and spectrally extended X-ray emission associated with the Fe K complex of Mrk 34 is likely associated with the well-known powerful kpc-scale outflows which have been studied in optical and radio emission. This X-ray emission is likely due to redshifted and blueshifted Fe K fluorescence and may be associated with molecular clouds at the brightest radio knots, near the base of the outflow. Some of this emission may be associated with shock emission from a hot collisionally ionized plasma that also produces highly ionized Fe XXV, as has been observed in IC 5063 (Travascio et al. 2021).
In any event, the source of the emission is likely to be expanding from the nucleus at a velocity a factor of greater than outflows observed in optical spectroscopy. Regardless of the specific origin of the part of emission, then, it is likely to be a multi-phase medium with fast-moving hot gas which may indicate a critical link between sub-pc scale ultra-fast outflows previously seen in absorption, as well as kpc-scale feedback mechanisms. Using Chandra observations of NGC 5728, Trindade Falcão et al. (2023a, b) have recently demonstrated a new example of emission attributable to Fe K emission which is spatially and spectrally extended, and suggestive of ultrafast outflows on pc scales. Although several aspects of the specific physical interpretation remain uncertain, their work demonstrates larger spatial extent, superior photon statistics, and confirms the existence of systems with properties similar to those we attribute to this novel Fe K complex in Mrk 34. Such interactions between the hot outflows and dense molecular clouds near the nucleus may form the base of the expanding [O III] and X-ray winds via similar mechanisms to those described by Trindade Falcão et al. (2021b).
New observations are necessary to better describe the origins of this extended emission. Deeper imaging spectroscopy with Chandra or a high-resolution implementation of AXIS would provide better statistical constraints on these models, and microcalorimeter spectroscopy from XRISM or Athena would spectrally resolve composite nuclear models. NuSTAR may constrain the presence of a line-of-sight component for the bi-conical outflow. Lynx is necessary to unambiguously associate reliable emission models with the spatial features described here. Imaging spectroscopy with JWST and ngVLA is necessary to investigate the roles of outflowing molecular gas and moderately ionized winds, both of which are likely present, regardless of the specific iron excitation mechanisms.
References
- Ahn et al. (2012) Ahn, C. P., Alexandroff, R., Allende Prieto, C., et al. 2012, ApJS, 203, 21. doi:10.1088/0067-0049/203/2/21
- Arav et al. (2018) Arav, N., Liu, G., Xu, X., et al. 2018, ApJ, 857, 60. doi:10.3847/1538-4357/aab494
- Arnaud (1996) Arnaud, K. A. 1996, Astronomical Data Analysis Software and Systems V, 101, 17
- Baloković et al. (2018) Baloković, M., Brightman, M., Harrison, F. A., et al. 2018, ApJ, 854, 42. doi:10.3847/1538-4357/aaa7eb
- Bessiere & Ramos Almeida (2022) Bessiere, P. S. & Ramos Almeida, C. 2022, MNRAS, 512, L54. doi:10.1093/mnrasl/slac016
- Cash (1979) Cash, W. 1979, ApJ, 228, 939. doi:10.1086/156922
- Chartas et al. (2021) Chartas, G., Cappi, M., Vignali, C., et al. 2021, ApJ, 920, 24. doi:10.3847/1538-4357/ac0ef2
- Das et al. (2005) Das, V., Crenshaw, D. M., Hutchings, J. B., et al. 2005, AJ, 130, 945. doi:10.1086/432255
- Davis et al. (2012) Davis, J. E., Bautz, M. W., Dewey, D., et al. 2012, Proc. SPIE, 8443, 84431A. doi:10.1117/12.926937
- Elvis et al. (2002) Elvis, M., Marengo, M., & Karovska, M. 2002, ApJ, 567, L107. doi:10.1086/340006
- Fabbiano et al. (2017) Fabbiano, G., Elvis, M., Paggi, A., et al. 2017, ApJ, 842, L4. doi:10.3847/2041-8213/aa7551
- Fabbiano et al. (2018a) Fabbiano, G., Paggi, A., Karovska, M., et al. 2018, ApJ, 855, 131. doi:10.3847/1538-4357/aab1f4
- Fabbiano et al. (2018b) Fabbiano, G., Paggi, A., Karovska, M., et al. 2018, ApJ, 865, 83. doi:10.3847/1538-4357/aadc5d
- Fabbiano et al. (2019) Fabbiano, G., Siemiginowska, A., Paggi, A., et al. 2019, ApJ, 870, 69. doi:10.3847/1538-4357/aaf0a4
- Falcke et al. (1998) Falcke, H., Wilson, A. S., & Simpson, C. 1998, ApJ, 502, 199. doi:10.1086/305886
- Fischer et al. (2013) Fischer, T. C., Crenshaw, D. M., Kraemer, S. B., et al. 2013, ApJS, 209, 1. doi:10.1088/0067-0049/209/1/1
- Fischer et al. (2017) Fischer, T. C., Machuca, C., Diniz, M. R., et al. 2017, ApJ, 834, 30. doi:10.3847/1538-4357/834/1/30
- Fischer et al. (2018) Fischer, T. C., Kraemer, S. B., Schmitt, H. R., et al. 2018, ApJ, 856, 102. doi:10.3847/1538-4357/aab03e
- Fornasini et al. (2022) Fornasini, F. M., Elvis, M., Maksym, W. P., et al. 2022, ApJ, 931, 65. doi:10.3847/1538-4357/ac694d
- Fruscione et al. (2006) Fruscione, A., McDowell, J. C., Allen, G. E., et al. 2006, Proc. SPIE, 6270, 62701V. doi:10.1117/12.671760
- Gandhi et al. (2014) Gandhi, P., Lansbury, G. B., Alexander, D. M., et al. 2014, ApJ, 792, 117. doi:10.1088/0004-637X/792/2/117
- Gaspari & Sądowski (2017) Gaspari, M. & Sądowski, A. 2017, ApJ, 837, 149. doi:10.3847/1538-4357/aa61a3
- Gofford et al. (2013) Gofford, J., Reeves, J. N., Tombesi, F., et al. 2013, MNRAS, 430, 60. doi:10.1093/mnras/sts481
- Harrison et al. (2018) Harrison, C. M., Costa, T., Tadhunter, C. N., et al. 2018, Nature Astronomy, 2, 198. doi:10.1038/s41550-018-0403-6
- Hopkins & Elvis (2010) Hopkins, P. F. & Elvis, M. 2010, MNRAS, 401, 7. doi:10.1111/j.1365-2966.2009.15643.x
- Jones et al. (2020) Jones, M. L., Fabbiano, G., Elvis, M., et al. 2020, ApJ, 891, 133. doi:10.3847/1538-4357/ab76c8
- Jones et al. (2021) Jones, M. L., Parker, K., Fabbiano, G., et al. 2021, ApJ, 910, 19. doi:10.3847/1538-4357/abe128
- Joye & Mandel (2003) Joye, W. A. & Mandel, E. 2003, Astronomical Data Analysis Software and Systems XII, 295, 489
- Laha et al. (2021) Laha, S., Reynolds, C. S., Reeves, J., et al. 2021, Nature Astronomy, 5, 13. doi:10.1038/s41550-020-01255-2
- Loredo (1992) Loredo, T. J. 1992, Statistical Challenges in Modern Astronomy, 275. doi:10.1007/978-1-4613-9290-3_31
- Ma et al. (2020) Ma, J., Elvis, M., Fabbiano, G., et al. 2020, ApJ, 900, 164. doi:10.3847/1538-4357/abacbe
- Maksym et al. (2016) Maksym, W. P., Fabbiano, G., Elvis, M., et al. 2016, ApJ, 829, 46
- Maksym et al. (2017) Maksym, W. P., Fabbiano, G., Elvis, M., et al. 2017, ApJ, 844, 69. doi:10.3847/1538-4357/aa78a4
- Maksym et al. (2019) Maksym, W. P., Fabbiano, G., Elvis, M., et al. 2019, ApJ, 872, 94. doi:10.3847/1538-4357/aaf4f5
- Maksym et al. (2020) Maksym, W. P., Schmidt, J., Keel, W. C., et al. 2020, ApJ, 902, L18. doi:10.3847/2041-8213/abb9b6
- Maksym et al. (2021) Maksym, W. P., Fabbiano, G., Elvis, M., et al. 2021, ApJ, 917, 85. doi:10.3847/1538-4357/ac0976
- Marinucci et al. (2017) Marinucci, A., Bianchi, S., Fabbiano, G., et al. 2017, MNRAS, 470, 4039. doi:10.1093/mnras/stx1551
- Mukherjee et al. (2018) Mukherjee, D., Wagner, A. Y., Bicknell, G. V., et al. 2018, MNRAS, 476, 80
- Nardini et al. (2015) Nardini, E., Reeves, J. N., Gofford, J., et al. 2015, Science, 347, 860. doi:10.1126/science.1259202
- Nenkova et al. (2008a) Nenkova, M., Sirocky, M. M., Ivezić, Ž., et al. 2008, ApJ, 685, 147. doi:10.1086/590482
- Nenkova et al. (2008b) Nenkova, M., Sirocky, M. M., Nikutta, R., et al. 2008, ApJ, 685, 160. doi:10.1086/590483
- Revalski et al. (2018) Revalski, M., Dashtamirova, D., Crenshaw, D. M., et al. 2018, ApJ, 867, 88. doi:10.3847/1538-4357/aae3e6
- Revalski et al. (2019) Revalski, M., Dashtamirova, D., Crenshaw, D. M., et al. 2019, ApJ, 881, 167. doi:10.3847/1538-4357/ab364f
- Serafinelli et al. (2019) Serafinelli, R., Tombesi, F., Vagnetti, F., et al. 2019, A&A, 627, A121. doi:10.1051/0004-6361/201935275
- Tombesi et al. (2010) Tombesi, F., Cappi, M., Reeves, J. N., et al. 2010, A&A, 521, A57. doi:10.1051/0004-6361/200913440
- Tombesi et al. (2014) Tombesi, F., Tazaki, F., Mushotzky, R. F., et al. 2014, MNRAS, 443, 2154. doi:10.1093/mnras/stu1297
- Travascio et al. (2021) Travascio, A., Fabbiano, G., Paggi, A., et al. 2021, ApJ, 921, 129. doi:10.3847/1538-4357/ac18c7
- Trindade Falcão et al. (2021a) Trindade Falcão, A., Kraemer, S. B., Fischer, T. C., et al. 2021, MNRAS, 500, 1491. doi:10.1093/mnras/staa3239
- Trindade Falcão et al. (2021b) Trindade Falcão, A., Kraemer, S. B., Fischer, T. C., et al. 2021, MNRAS, 505, 3054. doi:10.1093/mnras/stab1549
- Trindade Falcão et al. (2023a) Trindade Falcao, A., Fabbiano, G., Elvis, M., et al. 2023, arXiv:2303.00789
- Trindade Falcão et al. (2023b) Trindade Falcao, A., Fabbiano, G., Elvis, M., et al. 2023, arXiv:2303.00782
- Wang et al. (2014) Wang, J., Nardini, E., Fabbiano, G., et al. 2014, ApJ, 781, 55. doi:10.1088/0004-637X/781/1/55
- Zhao et al. (2020) Zhao, X., Marchesi, S., Ajello, M., et al. 2020, ApJ, 894, 71. doi:10.3847/1538-4357/ab879d