MUSE 3D spectroscopy of BA-type supergiants in NGC 300
Abstract
We present the results obtained using spectroscopic data taken with the intermediate-resolution Multi Unit Spectroscopic Explorer (MUSE) of B and A-type supergiants and bright giants in the Sculptor Group galaxy NGC 300. For our analysis, a hybrid local thermodynamic equilibrium (LTE) line-blanketing+non-LTE method was used to improve the previously published results for the same data. In addition, we present some further applications of this work, which includes extending the flux-weighted gravity luminosity relationship (FGLR), a distance determination method for supergiants. This pioneering work opens up a new window to explore this relation, and also demonstrates the enormous potential of integral field spectroscopy (IFS) for extragalactic quantitative stellar studies.
keywords:
Galaxies: individual (NGC 300) – Galaxies: distances and redshifts – Stars: early-type – Stars: fundamental parameters – supergiants1 Introduction
Resolving individual stars in other galaxies has been a turning point for astronomy (e.g., Hubble, 1929; Baade, 1944). The best candidates for such observations are massive BA-type supergiants, as they are the brightest objects in optical light, reaching absolute visual magnitudes of (e.g. Humphreys & Davidson, 1979; Humphreys & Aaronson, 1987). The spiral galaxy NGC 300 is located at the Sculptor Group, close to the Galactic southern pole. These galaxies are the least affected by Galactic extinction and therefore convenient targets to study. Moreover, NGC 300 is oriented face-on, being a great candidate for quantitative multi-object slit spectroscopy (e.g., Bresolin et al., 2002, 2004; Urbaneja et al., 2005). An extremely powerful tool for this purpose is the so-called integral field spectroscopy (IFS). This technique allows for a spectrum for each pixel across an image to be obtained simultaneously. The Multi Unit Spectroscopic Explorer (MUSE, Bacon et al., 2014) on the European Southern Observatory Very Large Telescope (ESO VLT) is groundbreaking in this context, as it combines a wide field of view with high spatial sampling. Spectroscopic analysis of the brightest objects in nearby galaxies, i.e. supergiant stars, can be performed to determine their stellar parameters.
The present study based on González-Torà et al. (2022) provides a detailed analysis of MUSE spectra of BA-type supergiants and bright giants in NGC 300 in the field seen in Figure 1 from (Roth et al., 2018, henceforth Paper I). The analysis is based on synthetic spectra accounting for deviations from local thermodynamic equilibrium (LTE).
2 Methods
The spectroscopic data were obtained using MUSE (Bacon et al., 2014), in the wide field mode (WFM) with 11′ spatial coverage and 0.2′′ sampling. The pointing observed under the best seeing conditions (FWHM = 0.47′′-0.59′′, measured from the data) was investigated.
The initial reduction was achieved with the MUSE pipeline V1.0 (see Paper I for details Weilbacher et al., 2020). The final data were produced in the form of a datacube, and the spectra of 606 individual sources were extracted using the PampelMUSE software (Kamann et al., 2013).
Out of these 606 extracted sources, 26 were classified as late-B to early-A supergiants or bright giants in Paper I with a 7 S/N 20, the minimum was demanded for our analysis to provide valid results. They are identified in Fig. 1. Due to model restrictions, we ended up with 16 objects that fulfilled the criteria for a quantitative analysis (see González-Torà et al., 2022, for more details).
We consider a grid of model atmospheres covering the parameter space defined by the effective temperature and surface gravity . We adopt the modelling methodology by Przybilla et al. (2006) for the analysis of our final sample of 16 stars. Very briefly, the method employs a combination of model atmosphere structures calculated under the assumption of LTE+line-blanketing and a detailed non-LTE level population as well as line-formation calculations. The reader is referred to Przybilla et al. (2006) for the advantages and drawbacks of this hybrid approach, as well as its limitations.
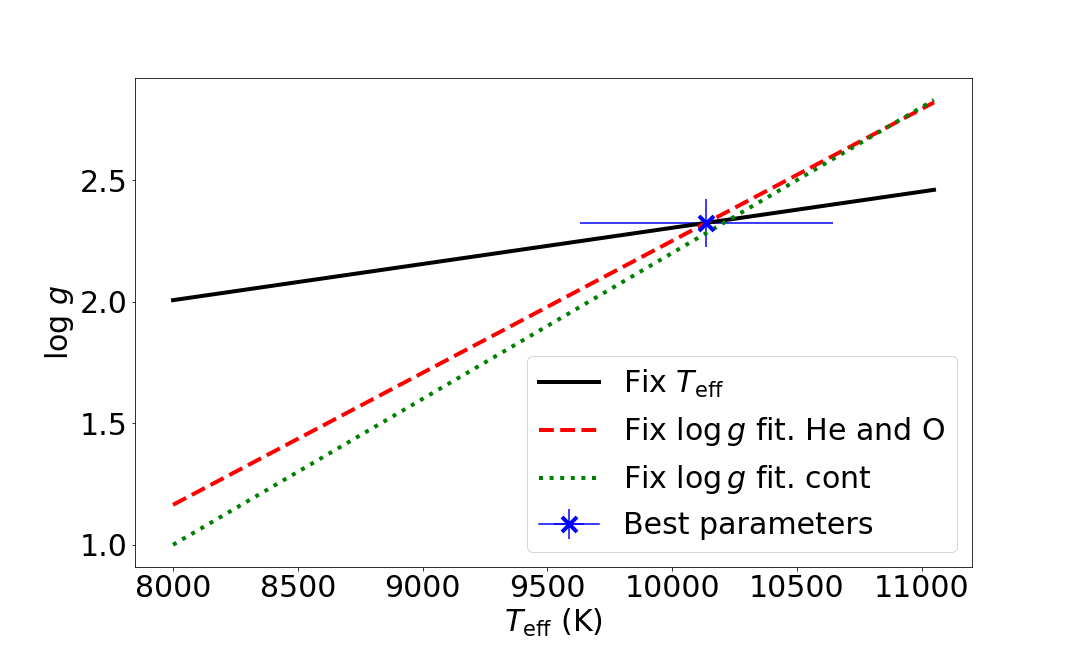
We followed a well-established methodology to find the best solution for each object. First, by adopting , we found the model that best reproduces the features sensitive to gravity changes (the hydrogen Balmer lines); this step was repeated for different adopted values, hence allowing us to define the locus of models for which the Balmer lines are equally well represented. This is referred as the locus. Similarly, but adopting the surface gravity, we identified the model that best reproduces the sensitive features (in our case either the metal lines He i and O i lines, or the metal-line dominated 4950-5600 Å region). We repeated this step for different values of , defining the locus. Finally, the intersection of both lines represents the best possible solution for a given object in the – plane (see Fig. 2).
A catalogue of Johnson - and -band magnitudes for sources in NGC 300, based on the work by Pietrzyński et al. (2001), was kindly provided by F. Bresolin (private communication). It allowed to calculate bolometric magnitudes from the extinction-corrected apparent -band magnitudes, the distance to NGC 300 of = 1.860.07 Mpc as determined by Rizzi et al. (2006)., and the bolometric corrections () for each object individually, calculated from tailored models.
3 The flux-weighted gravity luminosity relationship (FGLR)
The FGLR was first derived by Kudritzki et al. (2003) as a new method for distance determination of supergiants:
| (1) |
with determined by the mass-luminosity relation ( ) exponent to = 2.5, and the so-called flux-weighted gravity, defined as = .
This relation holds for all supergiants and bright giants that have a constant luminosity track when they move to the right of the Hertzsprung-Russell diagram (HRD). Therefore, this relation can be used to estimate the bolometric magnitudes, luminosities, and distances of supergiants and bright giants for which only spectral information is available. If we are able to resolve massive stars in distant galaxies, this can be a very powerful tool to determine extragalactic distances.
To study the FGLR, the stars need to be at the correct evolutionary stage. To verify that, we plotted the stars in relation to evolutionary tracks from Ekström et al. (2012) in the regular HRD (Fig. 3a) and compared their position with respect to the same tracks in the sHRD (Fig. 3b). The sHRD (Langer & Kudritzki, 2014) shows which is the inverse of , with respect to . Using the sHRD, we can place the stars with only their spectroscopic information and without any knowledge of their distance or brightness. The advantage of the sHRD is that the stars fall into different iso-gravity lines, enabling to discriminate stars with different radii as well as multiple sytems.
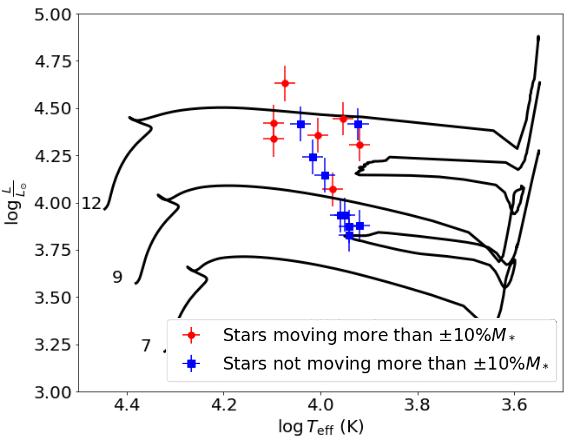
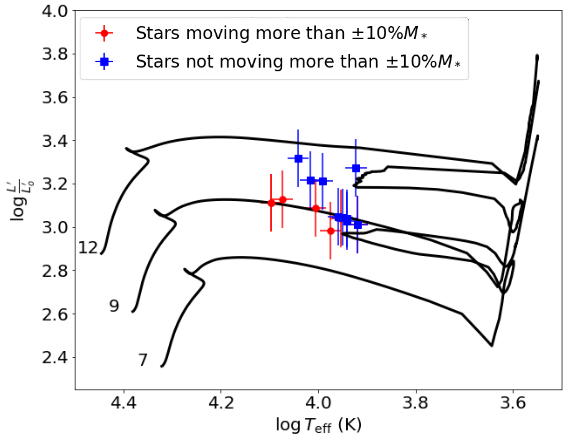
The red dots in Figs. 3a and 3b represent stars that move more than the 10% threshold (corresponding to their mass error), which indicates that they are not well-behaved objects. These stars show significantly larger spectroscopic than evolutionary masses that are derived from comparison with evolutionary tracks. The blue squares in Figs. 3a and 3b do not move by more than the threshold, and we can assume a good correspondence between their spectral information and their true evolutionary stage and their single star status. The latter stars are certain to be in the supergiant stage and therefore the FGLR would hold.
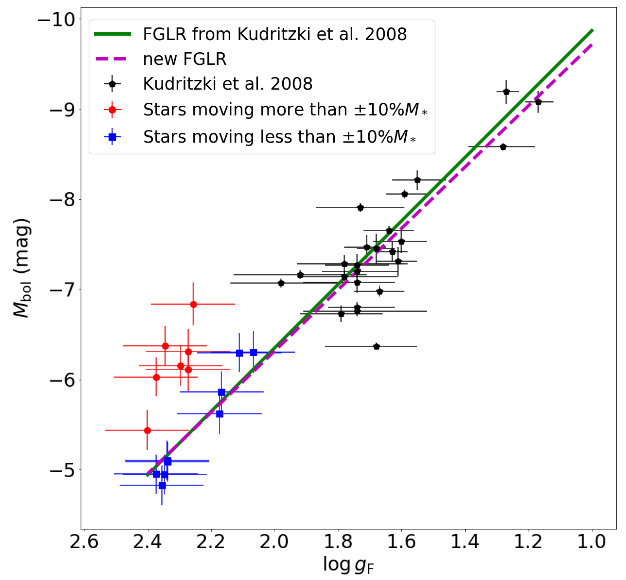
To prove our last point, we considered our 16 stars along with the objects previously studied by Kudritzki et al. (2008) to derive the FLGR. As we can see in Fig. 4, the blue squares follow the old FGLR within their error limits. The initial FGLR gives the old parameters determined by Kudritzki et al. (2008): = and = 8.11. Adding the contribution of our newly found supergiants (blue squares in Fig. 4), we obtained = 3.400.04 and = 8.020.14. The results from this work are also in accordance with the new FGLR distance to NGC 300 = 26.340.06 by Sextl et al. (2021).
3.1 Discrepant cases
As seen in Fig. 4, stars depicted by blue squares follow – within the uncertainties – the trend defined by the FGLR, while the ones represented by red dots deviate to some extent. For the stars depicted by red circles, either the derived luminosity is too high, or the flux-weighted gravity is too large (or both). The main reason for the luminosity (bolometric magnitude) to be too high would be for the apparent magnitude to be too high. This could mean that what is seen as a single star is a combination of several unresolved sources instead. Inspecting the MUSE datacube (see Fig. 1), none of these objects show signs of being an extended source, which makes it unlikely that they are large star clusters. On the other hand, it cannot be ruled out that they are small stellar aggregates that are not resolved at the distance of NGC 300.
An alternative explanation for this deviation could be the following: as we increase the and move to the bottom left of the FGLR, the stars decrease in mass. Population simulations predict that the FGLR will get wider for lower masses, as discussed by Meynet et al. (2015). Because of the so-called initial mass function (IMF) effect, we always expect to find a higher number of low mass stars than of massive stars (e.g. Salpeter, 1955; Kroupa, 2001), widening the FGLR because of the increased scatter.
4 Conclusions
We performed a quantitative spectroscopic analysis of 16 BA-type supergiants and bright giants in NGC 300, based on VLT/MUSE IFS data. Our focus lied on determining basic atmospheric and fundamental stellar parameters. This allowed us to extend the FGLR towards less luminous stars than studied before. However, the study has faced limitations by the relatively low 20 of the spectra. For future work, the and spatial resolution should be improved by taking advantage of the adaptive optics mode of MUSE and longer exposure times. This would not only reduce the uncertainties for similar studies as this work, but would also help to determine metallicities and likely elemental abundances for selected individual chemical elements. Therefore, demonstrating the full potential of MUSE for extragalactic stellar astrophysics. In addition, BlueMUSE is the new proposed medium-resolution IFS instrument at the VLT. Optimized for the optical blue, BlueMUSE will be the perfect instrument to study hot massive stars as most of their spectral features are located in its spectral range - a Highlight Science Case outlined in the BlueMUSE White Paper(Richard et al., 2019).
References
- Baade (1944) Baade, W. 1944, ApJ, 100, 137
- Bacon et al. (2014) Bacon, R., et al. 2014, The Messenger, 157, 13
- Bresolin et al. (2002) Bresolin, F., Gieren, W., Kudritzki, R.-P., Pietrzyński, G., & Przybilla, N. 2002, ApJ, 567, 277
- Bresolin et al. (2004) Bresolin, F., Pietrzyński, G., Gieren, W., Kudritzki, R.-P., Przybilla, N., & Fouqué, P. 2004, ApJ, 600, 182
- Ekström et al. (2012) Ekström, S., et al. 2012, A&A, 537, A146
- González-Torà et al. (2022) González-Torà, G., Urbaneja, M. A., Przybilla, N., Dreizler, S., Roth, M. M., Kamann, S., & Castro, N. 2022, A&A, 658, A117
- Hubble (1929) Hubble, E. P. 1929, ApJ, 69, 103
- Humphreys & Aaronson (1987) Humphreys, R. M., & Aaronson, M. 1987, AJ, 94, 1156
- Humphreys & Davidson (1979) Humphreys, R. M., & Davidson, K. 1979, ApJ, 232, 409
- Kamann et al. (2013) Kamann, S., Wisotzki, L., & Roth, M. M. 2013, A&A, 549, A71
- Kroupa (2001) Kroupa, P. 2001, MNRAS, 322, 231
- Kudritzki et al. (2003) Kudritzki, R. P., Bresolin, F., & Przybilla, N. 2003, ApJ, 582, L83
- Kudritzki et al. (2008) Kudritzki, R. P., Urbaneja, M. A., Bresolin, F., Przybilla, N., Gieren, W., & Pietrzyński, G. 2008, ApJ, 681, 269
- Langer & Kudritzki (2014) Langer, N., & Kudritzki, R. P. 2014, A&A, 564, A52
- Meynet et al. (2015) Meynet, G., Kudritzki, R. P., & Georgy, C. 2015, A&A, 581, A36
- Pietrzyński et al. (2001) Pietrzyński, G., Gieren, W., Fouqué, P., & Pont, F. 2001, A&A, 371, 497
- Przybilla et al. (2006) Przybilla, N., Butler, K., Becker, S. R., & Kudritzki, R. P. 2006, A&A, 445, 1099
- Richard et al. (2019) Richard, J., et al. 2019, arXiv e-prints, arXiv:1906.01657
- Rizzi et al. (2006) Rizzi, L., Bresolin, F., Kudritzki, R. P., Gieren, W., & Pietrzyński, G. 2006, ApJ, 638, 766
- Roth et al. (2018) Roth, M. M., et al. 2018, A&A, 618, A3 (Paper I)
- Salpeter (1955) Salpeter, E. E. 1955, ApJ, 121, 161
- Sextl et al. (2021) Sextl, E., Kudritzki, R.-P., Weller, J., Urbaneja, M. A., & Weiss, A. 2021, ApJ, 914, 94
- Urbaneja et al. (2005) Urbaneja, M. A., et al. 2005, ApJ, 622, 862
- Weilbacher et al. (2020) Weilbacher, P. M., et al. 2020, A&A, 641, A28
Question How do you know that the stars are in the right evolutionary stage?