New Constraints on Warm Dark Matter from the Lyman- Forest Power Spectrum
Abstract
The forest of Lyman- absorption lines detected in the spectra of distant quasars encodes information on the nature and properties of dark matter and the thermodynamics of diffuse baryonic material. Its main observable – the 1D flux power spectrum (FPS) – should exhibit a suppression on small scales and an enhancement on large scales in warm dark matter (WDM) cosmologies compared to standard CDM. Here, we present an unprecedented suite of 1080 high-resolution cosmological hydrodynamical simulations run with the Graphics Processing Unit-accelerated code Cholla to study the evolution of the Lyman- forest under a wide range of physically-motivated gas thermal histories along with different free-streaming lengths of WDM thermal relics in the early Universe. A statistical comparison of synthetic data with the forest FPS measured down to the smallest velocity scales ever probed at redshifts [1] yields a lower limit keV (95 percent CL) for the WDM particle mass and constrains the amplitude and spectrum of the photoheating and photoionizing background produced by star-forming galaxies and active galactic nuclei at these redshifts. Interestingly, our Bayesian inference analysis appears to weakly favor WDM models with a peak likelihood value at the thermal relic mass of keV. We find that the suppression of the FPS from free-streaming saturates at because of peculiar velocity smearing, and this saturated suppression combined with a slightly lower gas temperature provides a moderately better fit to the observed small-scale FPS for WDM cosmologies.
I Introduction
The -cold dark matter (CDM) cosmological paradigm has been immensely successful at matching across cosmic time observations spanning physical scales from the horizon length [2] all the way down to galaxy scales [e.g., 3, 4, 5], and a vast menagerie of hypothetical non-baryonic elementary particles has been proposed to explain the astrophysical data [6]. Cold dark matter particles have negligible thermal velocities in the matter-dominated era and therefore clump gravitationally even on the smallest sub-galactic scales, a property that has caused persistent challenges with observations of the abundances and density profiles of dwarf galaxies in the local Universe [e.g., 7]. Warm dark matter (WDM) is a simple modification of CDM that has been proposed to suppress small-scale power and alleviate some of these problems [8]. WDM particles of a few keV have significant intrinsic velocities from having decoupled as thermal relics or been produced by non-equilibrium processes, and one of the effects of their Mpc-range free-streaming length is to limit the gravitational collapse of structures and produce a cut-off in the matter power spectrum.
Intergalactic hydrogen at redshift scatters Lyman- radiation and produces absorption features in the spectra of distant quasars. This “Lyman- forest” is a powerful cosmological probe as it traces density fluctuations, the underlying dark matter web-like distribution (the “cosmic web”), and the ionization state and temperature of the intergalactic medium (IGM) at scales and redshifts that cannot be probed by any other observable [9, 10, 11, 12]. The primary statistic derived from spectroscopic data is the 1D power spectrum (FPS) of the flux distribution in the forest – the Fourier transform of the fractional flux autocorrelation function in velocity space – which arguably provides the best tool for distinguishing between CDM and WDM models [13, 14, 15, 16, 17]. The FPS is observationally-accessible over a wide range of redshifts, involves the fundamental, well-known physics of the hydrogen atom, and is largely free from the uncertain baryonic physics (star formation, feedback, and metal cooling) that affects, e.g., the abundance of Milky Way satellites and the central density cores of dwarf galaxies [18]. Interpreting such observations requires expensive hydrodynamical simulations of the IGM that cover an extensive range of uncertain IGM photoionization and photoheating histories and consistently maintain high resolution throughout a statistically representative sub-volume of the Universe, a traditional limiting factor in previous analyses [e.g., 14, 19, 20, 21, 22]. At present, the tightest lower limit to the mass of a thermal WDM relic, keV (95 percent CL), is obtained for highly conservative thermal histories of intergalactic gas and without a marginalization over the properties of the cosmic ionizing background [17].
In this Paper, we revisit these constraints in light of recent measurements with the Keck and VLT telescopes of the Lyman- FPS down to the smallest scales ever probed at redshifts [1], using a massive suite of 1080 high-resolution cosmological hydrodynamics simulations that are part of the Cholla IGM Photoheating Simulations (CHIPS) suite [23, 24]. High-redshift observations provide better limits on the mass of a WDM particle, as free-streaming becomes more prominent in velocity space and the effect of the non-linear evolution of the matter density field – resulting in a transfer of power from large scales to small scales – is weaker at these epochs. There is also observational evidence for a local minimum of the temperature of the IGM – and therefore a corresponding minimum in the thermal cut-off length scale – in the redshift range [24, 25], making this era an optimal epoch for deriving bounds on dark matter properties.
II Basic equations and characteristic scales
The hydrogen and helium photoheating and photoionization rates per atom depend on the intensity of a uniform UV background radiation field as
| (1) | |||||
| (2) |
where and are the threshold frequency and photoionization cross-section, respectively. The total photoheating rate is summed over the species H , He , and He each of proper number density , . These rates, together with radiative recombinations, adiabatic compression, Compton and expansion cooling, and the gas density and peculiar velocity fields shaped by gravity and by pressure forces, fully determine the hydrogen Lyman- absorption optical depth in velocity space [26],
| (3) |
Here, , and are the frequency and upward oscillator strength of the Lyman- transition, is the Doppler parameter, the gas temperature, the Hubble parameter, and are, respectively, the real-space coordinate (in km s-1) and the peculiar velocity along the line of sight, and we have assumed a Gaussian profile. Denoting with some mean redshift of interest, e.g. the redshift of a simulation output or the average redshift of any given data subset, one can write
| (4) |
where is the comoving position at which the redshift from Hubble expansion is exactly , and is the Hubble expansion rate. Line center in the rest frame of intervening hydrogen occurs at velocity , which is related to the observed frequency by
| (5) |
Because of peculiar velocities, a photon observed at can have the same rest-frame frequency at more than one place in its trajectory from the quasar to the observer.
In practice, only a limited range of values contributes to , and one can replace in Equation (3) with . We can then define the flux contrast , where is the flux at velocity and is the mean transmitted flux at a given redshift, and decompose each absorption spectrum into Fourier modes . Their variance as a function of the Fourier wavenumber is the FPS over some velocity interval ,
| (6) |
which is commonly expressed in terms of the dimensionless quantity .
Four physical effects (cf. [16]) act to erase small-scale power in the FPS:
-
1.
Doppler broadening caused by gas thermal velocities along the line of sight. Assuming a Gaussian smoothing kernel in the field of the form , where is the broadening velocity scale, a cut-off in the FPS arises then at the proper wavenumber
(7) where .
-
2.
Pressure support. Pressure smooths gas density fluctuations in the spatial Fourier domain with a Gaussian kernel [27, 28]
(8) where is a comoving wavenumber,
(9) is the ‘filtering scale’, and is the wavenumber corresponding to the Jeans scale. Here, is the sound speed, is the mean molecular weight ( for an admixture of ionized hydrogen and singly ionized helium), is the mean total (dark matter plus baryons) mass density of the Universe, and is the scale factor. The factor accounts for the fact that the filtering scale depends on the prior thermal history of the IGM, and not just the instantaneous Jeans scale. Typically, after reionization [28].
Mapping the 3D filtering scale to a broadening velocity scale along the line of sight results in a cut-off of the FPS at proper wavenumber
(10) where the second equality is valid at high enough redshifts. Under the physically-motivated assumptions that the gas temperature decays as after reionization completes around redshift , the factor at the redshifts of interest here [27]. Pressure filtering, always lagging behind the growth of the Jeans length, is therefore subdominant compared to the thermal broadening of the absorption spectrum [29, 30, 31, 1].
-
3.
Non-linear peculiar velocities in the gas. Peculiar motions smear power along line-of-sight (the “fingers-of-God” effect”) over a range of scales comparable with the one-dimensional velocity dispersion. A fit to the results of numerical simulations with a Gaussian in Fourier space yields [32]
(11) Setting , a cut-off in the FPS arises at proper wavenumber
(12) -
4.
Dark matter free-streaming. This effect can be described by the wavenumber, , at which the WDM matter power spectrum is suppressed relative to the CDM case by a factor of 2 [33],
(13) for a standard thermal relic. The conversion to a proper wavenumber in inverse km s-1, , yields a cut-off in the FPS at
(14) Note how the free-streaming cut-off moves toward larger scales (smaller ) at higher redshift.
The numerical values of , and above suggest that free-streaming, thermal and velocity broadening effects all set in at similar scales. Thus, comparing the observations of the FPS to a large set of models that accurately depict the suppression on the FPS in the non-linear regime associated to each of these mechanisms is critical to constrain the WDM particle mass. In the following section, we present our grid of simulations that evolve a total of 1080 models, which simultaneously vary the impact of free-streaming, Doppler broadening, and pressure smoothing. A comparison between our grid of models and the observed FPS will provide new constraints on the mass of the dark matter particle that, for the first time, marginalize over all the important confounding physical effects.
III Simulations
The simulations used in this work were performed using the GPU-native MPI-parallelized code Cholla [34], and evolve the equations of hydrodynamics on a uniform Cartesian grid while simultaneously tracking the non-equilibrium ionization states of hydrogen and helium using the GRACKLE library [35]. A spatially uniform, time-dependent UV radiation background was assumed in the form of redshift-dependent photoionization and photoheating rates per ion, and , for the species H , He , and He . The initial conditions at were generated using the MUSIC code [36] for a flat cosmology with parameters , , , , , and , consistent with constraints from Planck data [2]. The initial conditions for all runs were generated from identical random number seeds to preserve the same amplitude and phase for all initial Fourier modes across the simulation suite. The volume and numerical size of the simulations correspond to = 25 Mpc and = 210243 cells and particles. All simulations were run on the Summit computing system at the Oak Ridge National Laboratory. The effect of a thermally produced WDM particle was introduced by modifying the input transfer function following the fitting formula of [33], and no attempt was made to explicitly incorporate particle thermal velocities in the initial conditions [37]. WDM thermal velocities will be only a few percent of the velocities due to gravitational acceleration at the cosmic time of our initial conditions, and should not be important on the scales resolved by our simulations.
To compare the properties of the IGM in our simulations to observations, we extracted synthetic Lyman- forest spectra measuring H densities, temperatures, and peculiar velocities of the gas using 4096 skewers randomly distributed for each simulation along each axis of the box. The optical depth along each discretized line of sight was estimated as described in [23]. From the set of lines of sight, we computed the transmitted flux and the mean one-dimensional power spectrum of the fractional transmission (see §5.4 in [23] for a detailed description).
III.1 WDM Effects on the IGM
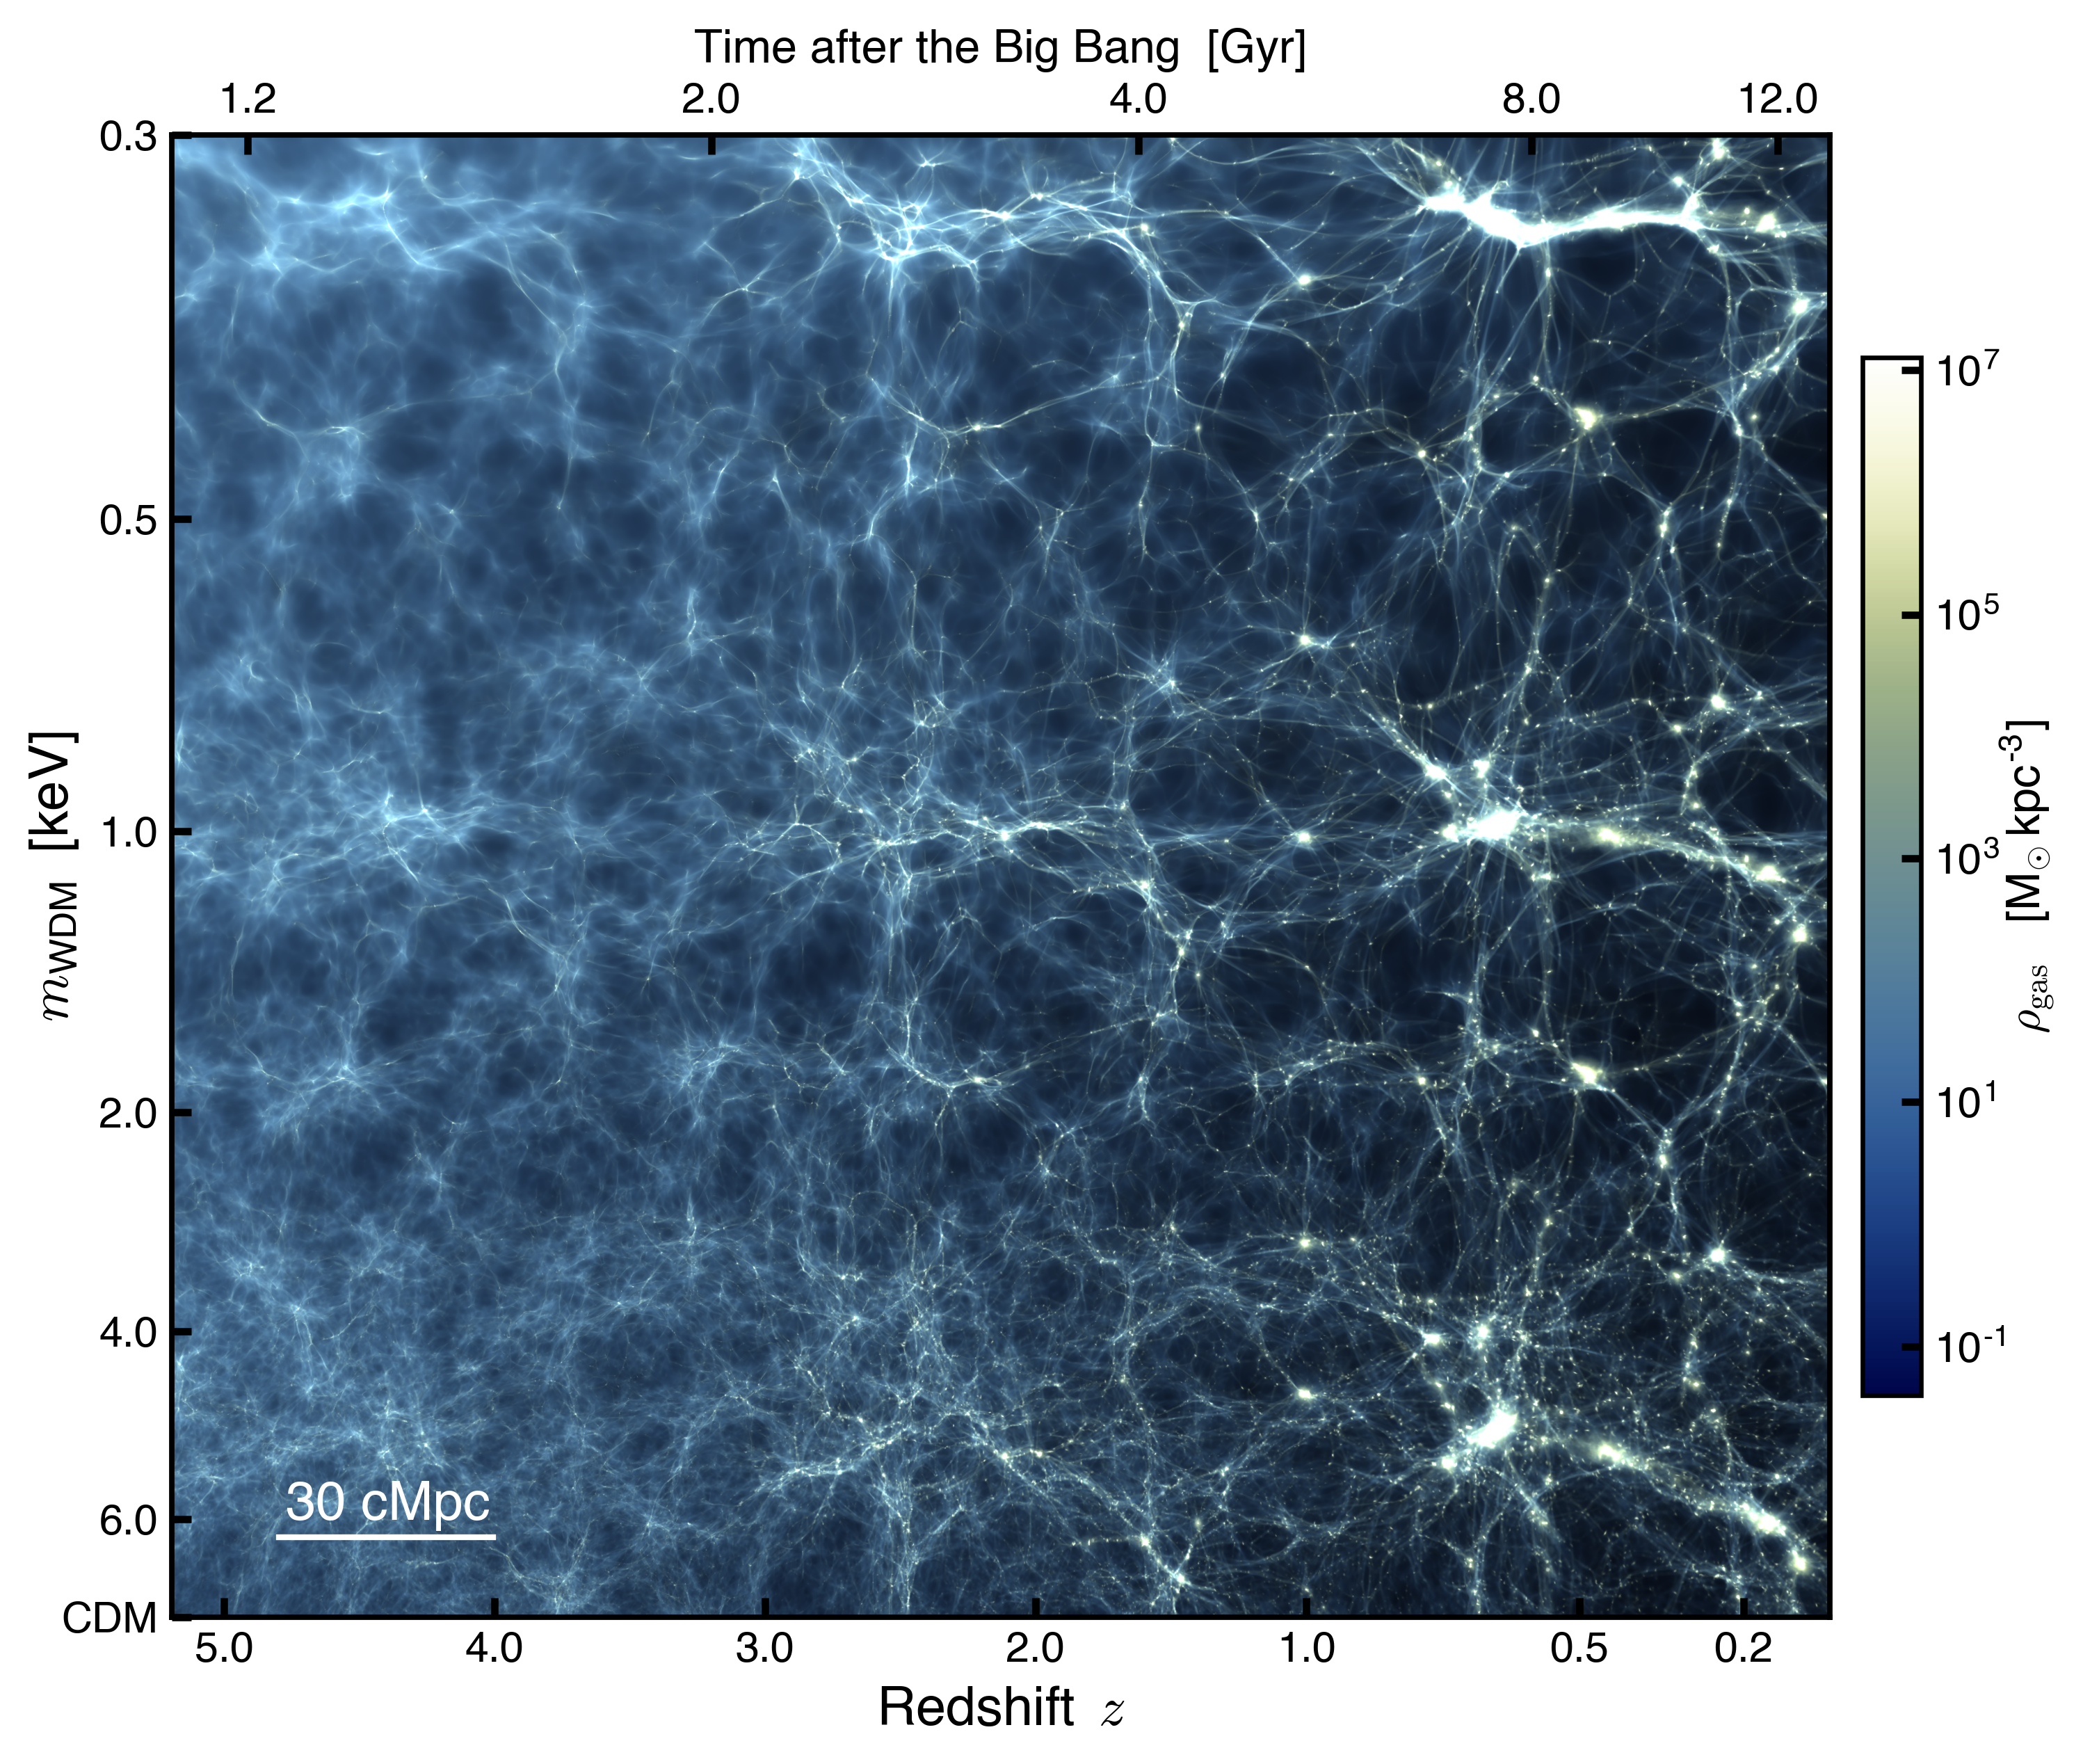
The impact of particle free-streaming on the gas density structure of the IGM at fixed thermal history is shown in Figure 1. The image displays a slice through the gaseous cosmic web at generated from a set of 8 simulations that vary the mass of the dark matter particle increasing from 0.3 keV to . The simulations follow the thermal history produced by the baseline photoheating and photoionization history presented in [24].
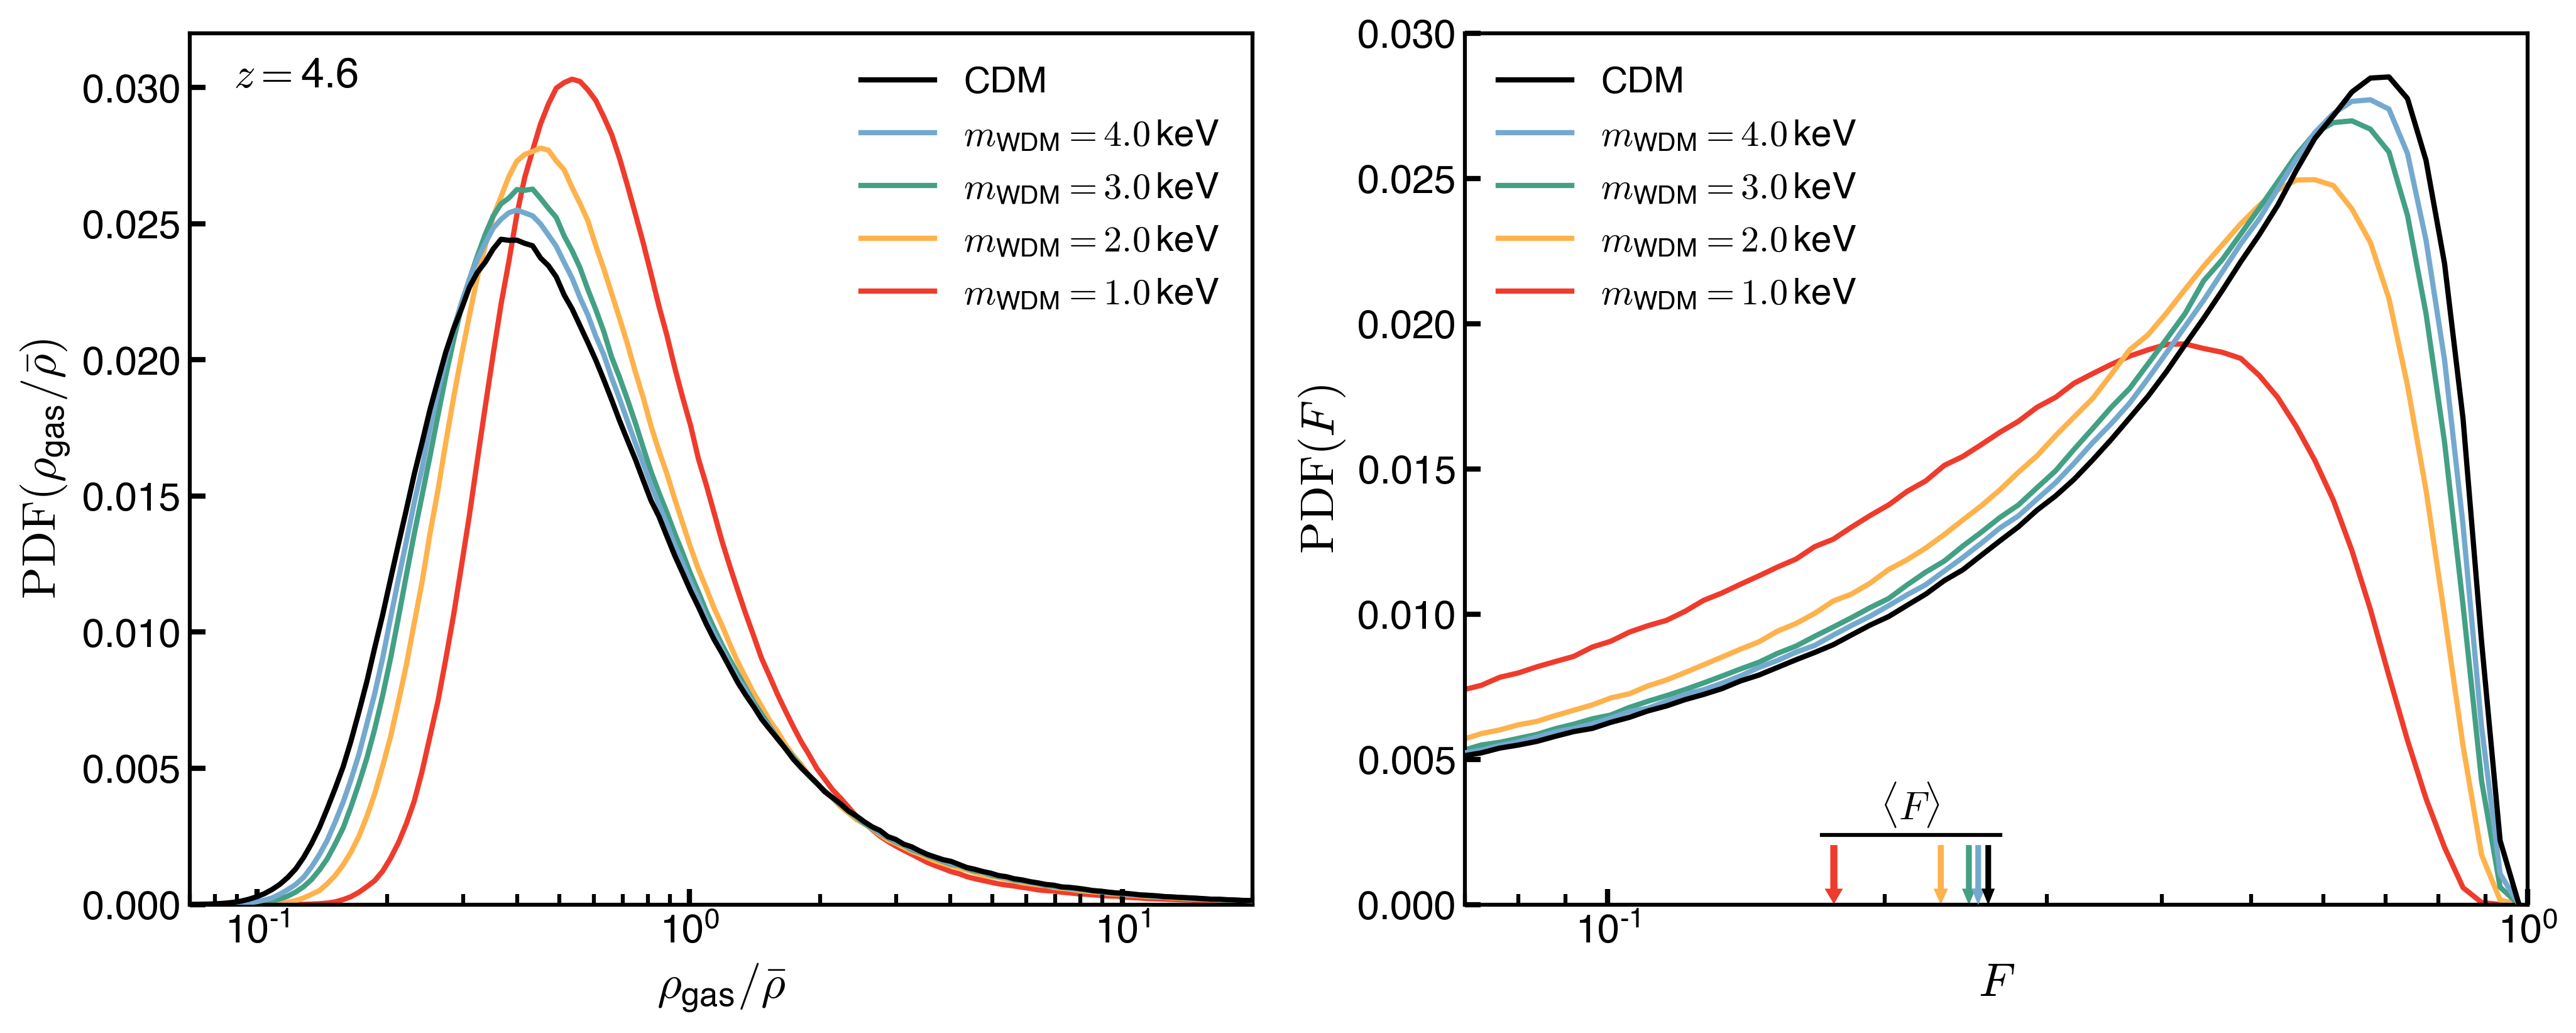
The main effect of the free-streaming of keV particles on the matter density distribution is to suppress the formation of small-scale structure, reducing the clumpiness of the cosmic web. As free-streaming washes out small-scale inhomogeneities and decreases the concentration of overdense regions, baryon redistribution leaves an excess (relative to CDM) of close-to-mean density gas to permeate the IGM. Figure 2 (left) shows the change in the volume-weighted probability distribution function of the gas density at for different cosmologies compared to a CDM simulation with the same thermal history. The enhanced fraction of close-to-mean density as a consequence of free-streaming increases the opacity of the IGM to Lyman- scattering. Figure 2 (right) shows the probability distribution function of the Lyman- transmitted flux along the skewer set for the WDM and CDM runs at . The distribution of transmitted flux shifts to lower values with increasing free-streaming lengths. The arrows at the bottom of the figure display the decrease of the mean transmission of the forest as decreases.
While free-streaming (in the regime keV) changes the IGM opacity it has a negligible effect on its density-temperature relation, often approximated with a power-law model , and the parameters and are virtually unchanged – for fixed photoionization and photoheating histories – from the CDM case.
III.2 WDM Effects on the Flux Power Spectrum
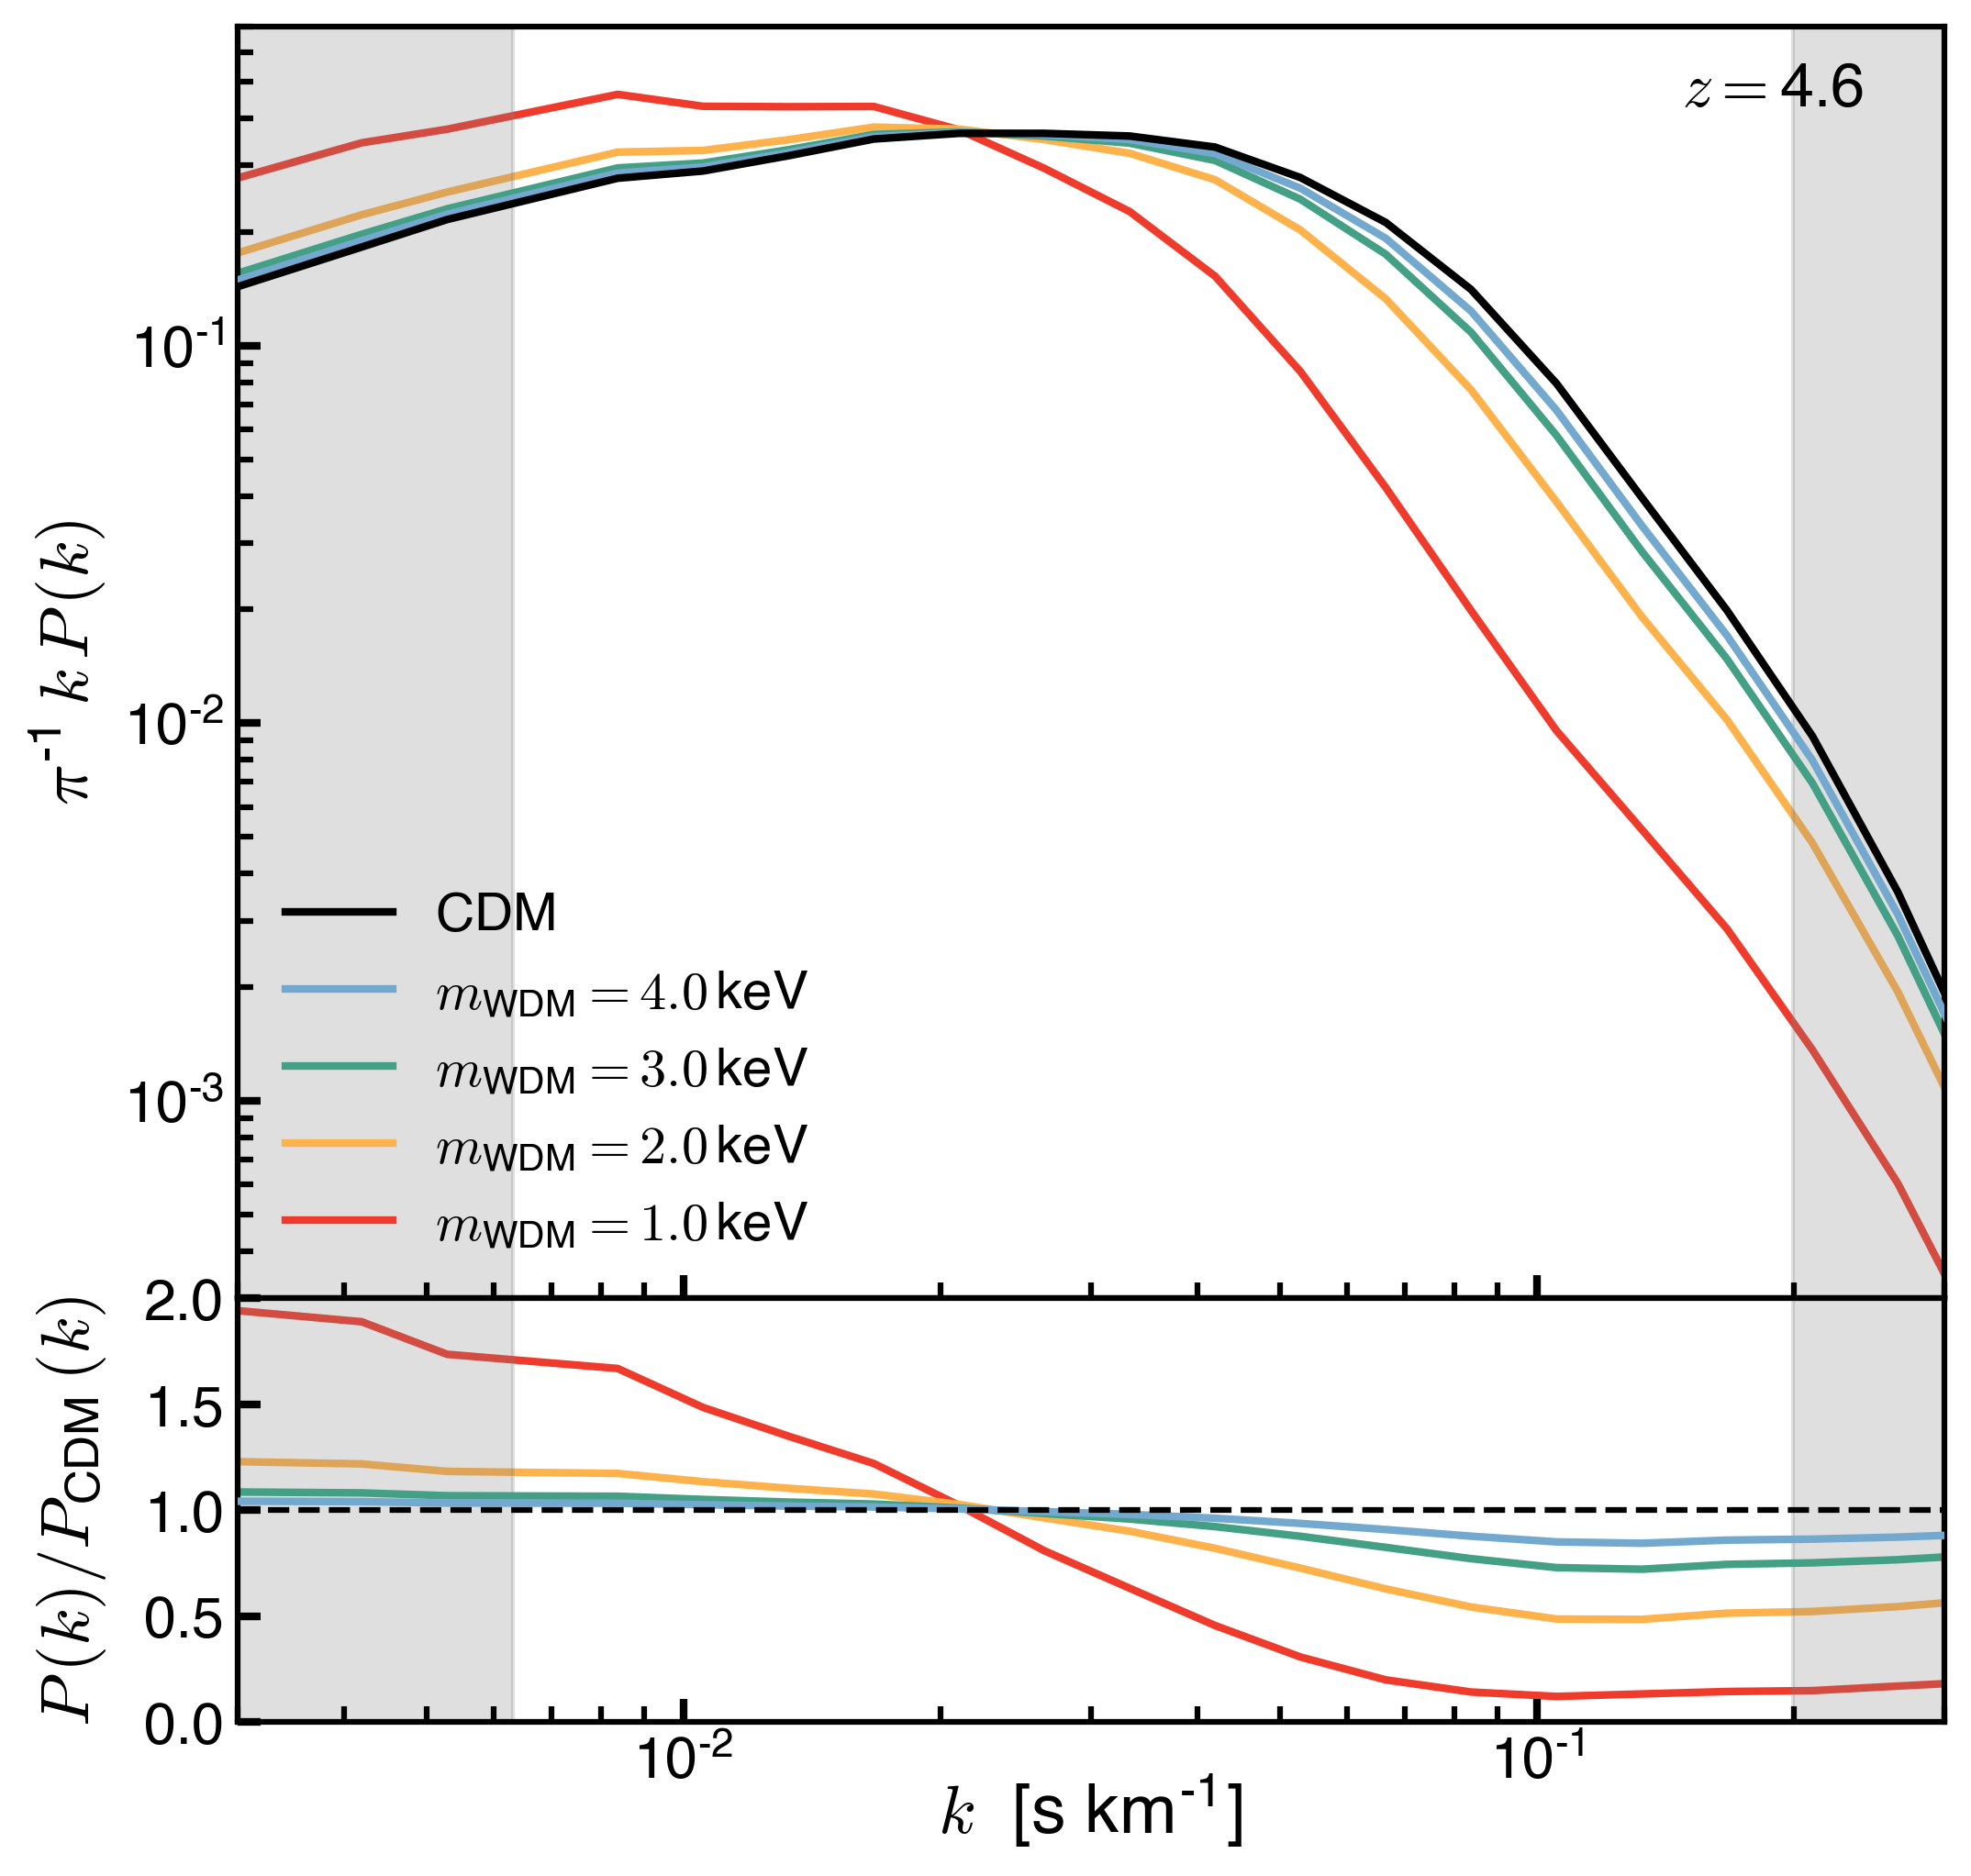
The suppression of small-scale density fluctuations from free-streaming translates into a decrease of the small-scale FPS compared to CDM. Figure 3 shows the dimensionless FPS of the Lyman- transmitted flux, , measured at in simulations with different WDM particle mass. The ratio of with respect to the standard CDM case is depicted in the bottom panel. Free-streaming affects the FPS differently on small and large scales. On small scales, , the suppression of density fluctuations reduces power. On large scales, , there is an increase of the overall normalization of associated with the reduction of the mean transmitted flux .
III.3 Simulation Grid
To constrain WDM cosmologies, we have performed an unprecedented grid of 1080 high-resolution simulations (with = 25 Mpc and = 210243) for a variety of particle masses and thermal histories of the IGM that alter the impact of free-streaming, Doppler broadening, and pressure smoothing on the forest FPS. Here, we use the fiducial model for the hydrogen and helium photoionization and photoheating rates of [24] (hereafter V22) as a template to generate different gas reionization and thermal histories. The V22 photorates are a modification of the rates by [38] and were determined by running hundreds of cosmological simulations to produce a reheating history in agreement with observations of the hydrogen Lyman- FPS as well as the effective opacity of the He Lyman- forest (see [24] for details).111In our modeling, the ionization and thermal evolution of the IGM is primarily determined by the radiation emitted by star-forming galaxies and active galactic nuclei (AGNs) over cosmic history. The photoionization and photoheating rates of [38] were computed from the intensity of the UV background (UVB) radiation field, which was in turn determined by the emissivity of the radiating sources. An improved treatment of the IGM opacity to ionizing radiation that consistently captures the transition from a neutral to an ionized IGM was also adopted in [38]. This UVB model, when applied to cosmological simulations, results in a hydrogen reionization era that completes by redshift (V22).
Our grid of models is based on three different transformations of the V22 fiducial rates:
-
1.
We rescale the hydrogen (H ) and helium (He ) photoionization rates by a constant factor . This rescaling mainly impacts the neutral hydrogen (and helium) fractions, changing the mean transmitted flux and therefore the overall normalization of the FPS.
-
2.
We modify the H and He photoheating rates by rescaling the mean energy of the ejected photoelectrons by a factor . This modification changes the temperature of the IGM and the impact of thermal Doppler broadening on the small-scale FPS.
-
3.
We change the timing of hydrogen reionization by offsetting the H and He photoionization and photoheating rates by an amount – a value shifts reionization to earlier times. This shift affects the time available for the IGM to cool by adiabatic expansion and respond to thermally induced pressure gradients, changing the impact of pressure smoothing on the small-scale FPS.
The transformations applied to the H and He photorates described above can be expressed as
| (15) | ||||
In this work we shall compare the results of our simulations to observational determinations of the FPS in the redshift range . In the V22 model the IGM cools roughly adiabatically after reionization at until AGNs begin to photoionize He and heat intergalactic gas at , resulting in a local minimum of the IGM temperature at this epoch. The effect of He reheating becomes dominant, however, only at and does not significantly impact the FPS at . Accordingly, we do not marginalize over the reionization history of helium, and fix the He photorates to those of V22. We note that since our simulations assume a spatially-uniform UV background, there are no couplings between, e.g., the UV radiation field, the dark matter density, and peculiar motions that would affect the interpretation of our power spectrum results.
Each model in our simulation suite is therefore characterized by the four-dimensional parameter vector , and our parameter grid is shown in Table 1. The range of dark matter masses were chosen to span from very light WDM (keV) to CDM. After running some test calculations the ranges of thermal parameters (, ) were chosen to encompass the parameter space with large likelihood. The range of shifts span about 200 million years of cosmic time around the end of reionization. Full cosmological hydrodynamical simulations were performed for all possible combinations of these four parameters, requiring the suite of 1080 simulations used for our analysis.
| Parameter | Parameter Values |
|---|---|
| [keV] | 1, 2, 3, 4, 5, 6, 8, 12, 20, 40, 80, CDM |
| 0.6, 0.8, 1.0, 1.2, 1.4, 1.8 | |
| 0.1, 0.5, 0.9, 1.3, 1.7 | |
| -0.5, 0.0, 0.5 |
-
•
NOTE.- The grid of models consist of the 1080 possible combinations of the parameters . Each simulation evolves an and box.
III.4 Effects of Model Variations on the Flux Power Spectrum
Suppression of small-scale fluctuations in the Lyman- forest can be attributed to decreased small-scale inhomogeneities in the intergalactic gas due to the free-streaming of WDM particles, but also to Doppler broadening of absorption lines and pressure smoothing of gas overdensities. Providing accurate constraints on the WDM particle mass from observations of the FPS requires differentiating the impact that these processes have on , and sampling over a dense set of models that simultaneously vary the effect of each mechanism.
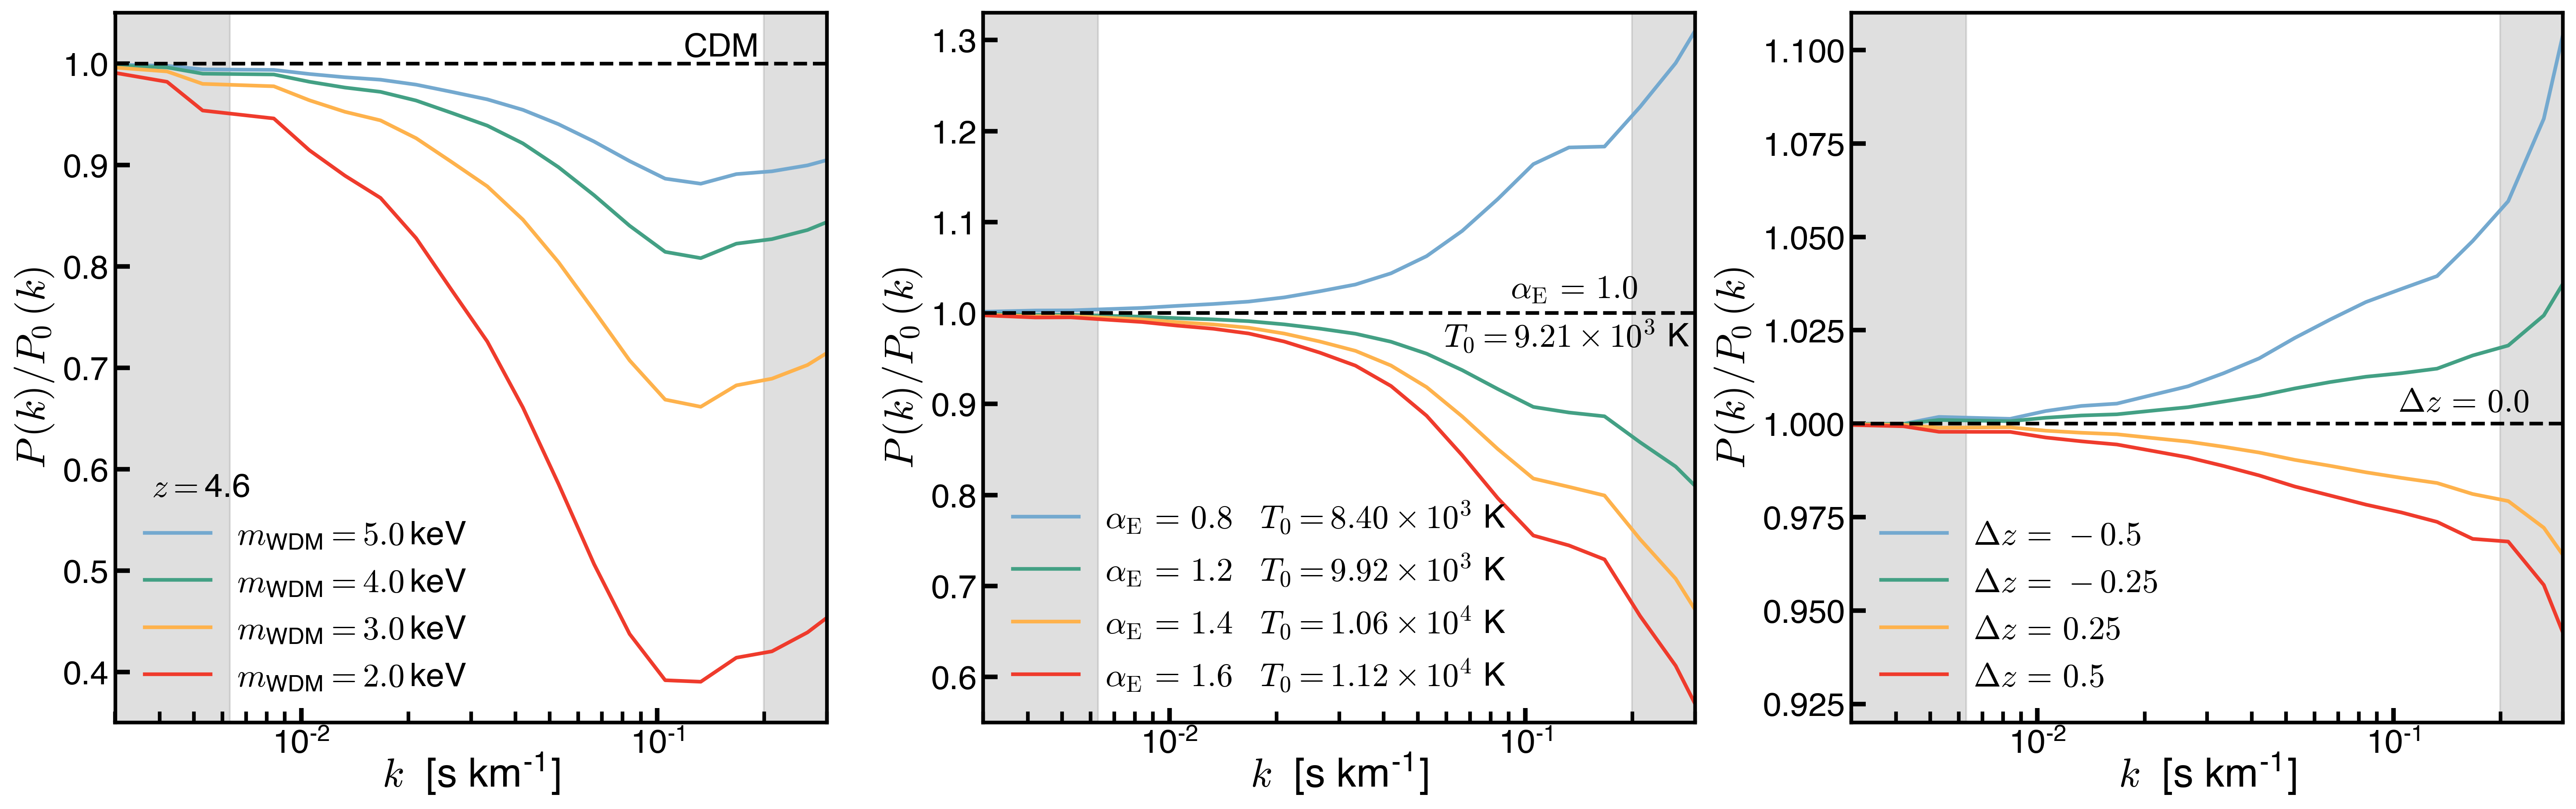
Figure 4 illustrates the impact on the FPS of free-streaming (left), thermal broadening (center), and pressure smoothing (right) at . Shown is the ratio of the measured in simulations that independently vary the model parameters (left), (center) and (right) to the measured from a simulation that adopts the fiducial V22 model corresponding to a CDM cosmology and parameters , , and . To isolate small-scale effects, for this comparison the Lyman- optical depths of the skewers from each simulation were rescaled to produce the same of the fiducial model as this equalizes on large scales. Additionally, for the simulations that vary (right), we separate the impact of pressure smoothing by also rescaling the instantaneous gas temperature along the skewers to have the same value at mean density as the fiducial model. Variations of the model parameter mainly impact the ionization fraction of intergalactic hydrogen, changing the mean transmitted flux and thereby rescaling the overall normalization of the FPS. For a detailed analysis on this effect we refer the reader to Appendix B of [24].
As shown in Figure 4 (center), the effect from increasing/decreasing the IGM temperature is to suppress/boost the FPS for relative to the fiducial model. On these scales is also altered by pressure smoothing (right). An earlier (later) reionization epoch suppresses (boosts) power as overdensities have more (less) time to respond to thermally-induced pressure gradients. Figure 4 also makes clear the small-scale behavior of WDM models (left) relative to the fiducial CDM model. On (quasi-)linear scales (e.g., ), the effect on the power spectrum of increasing the WDM particle mass is well captured by the exponential cut-off of Equation (14). The suppression of due to free-streaming increases with decreasing , and extends to where it saturates owing to peculiar motions. We argue that this important feature could be key for constraining the nature of dark matter.
Interestingly, we find that if is measured in configuration (‘real’) space instead of redshift space (ignoring gas peculiar velocities) then the suppression of continues to . Figure 5 displays the ratio for simulations with WDM particle mass (blue) and (green). Dashed lines show the same ratio but in this case the FPS is computed from synthetic spectra in real space. Here, the effective opacity of the skewers of the WDM simulations has been rescaled to match CDM on large scales.
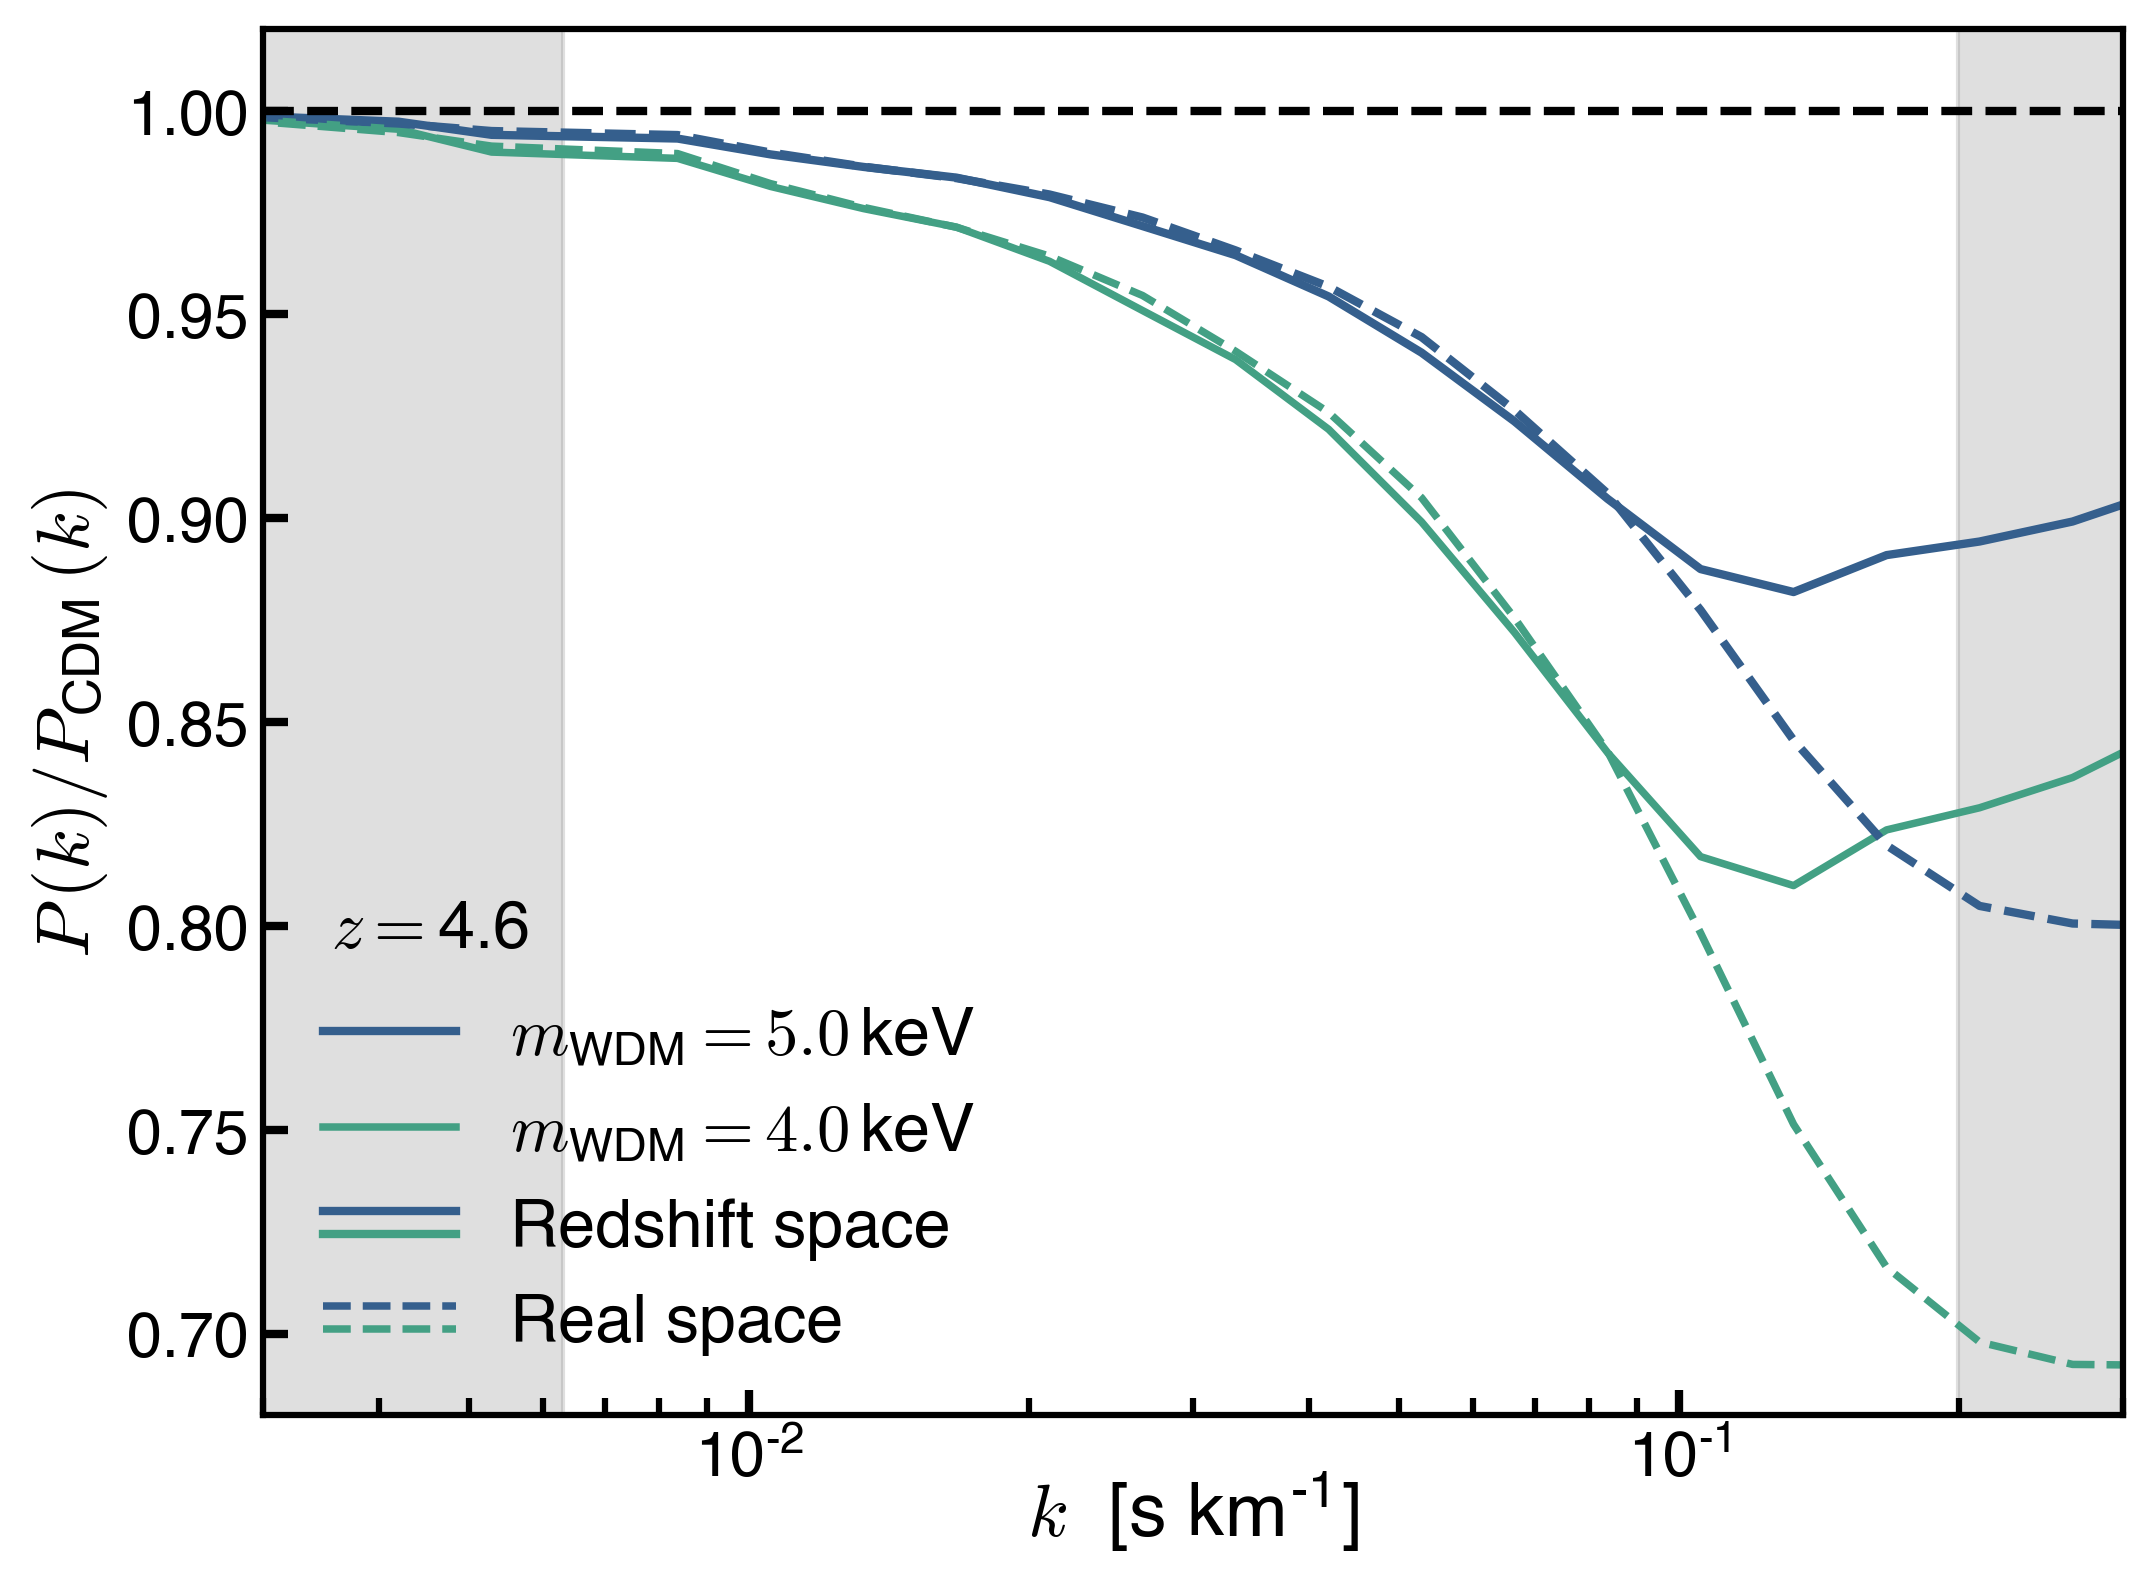
The comparison presented in Figure 5 suggests that peculiar velocities play an influential role shaping the structure of the Lyman- forest on small scales. We conclude that for peculiar velocities are more important for shaping than free-streaming. Since peculiar velocities and thermal broadening on the smallest scales affect WDM and CDM models similarly, the decrease in from WDM relative to CDM saturates at .
IV Statistical Comparison
In this section we present the observations of used for this work and we describe the methodology used for the Bayesian approach used in this work to constrain the models used for our simulation suite.
IV.1 Observational Flux Power Spectrum
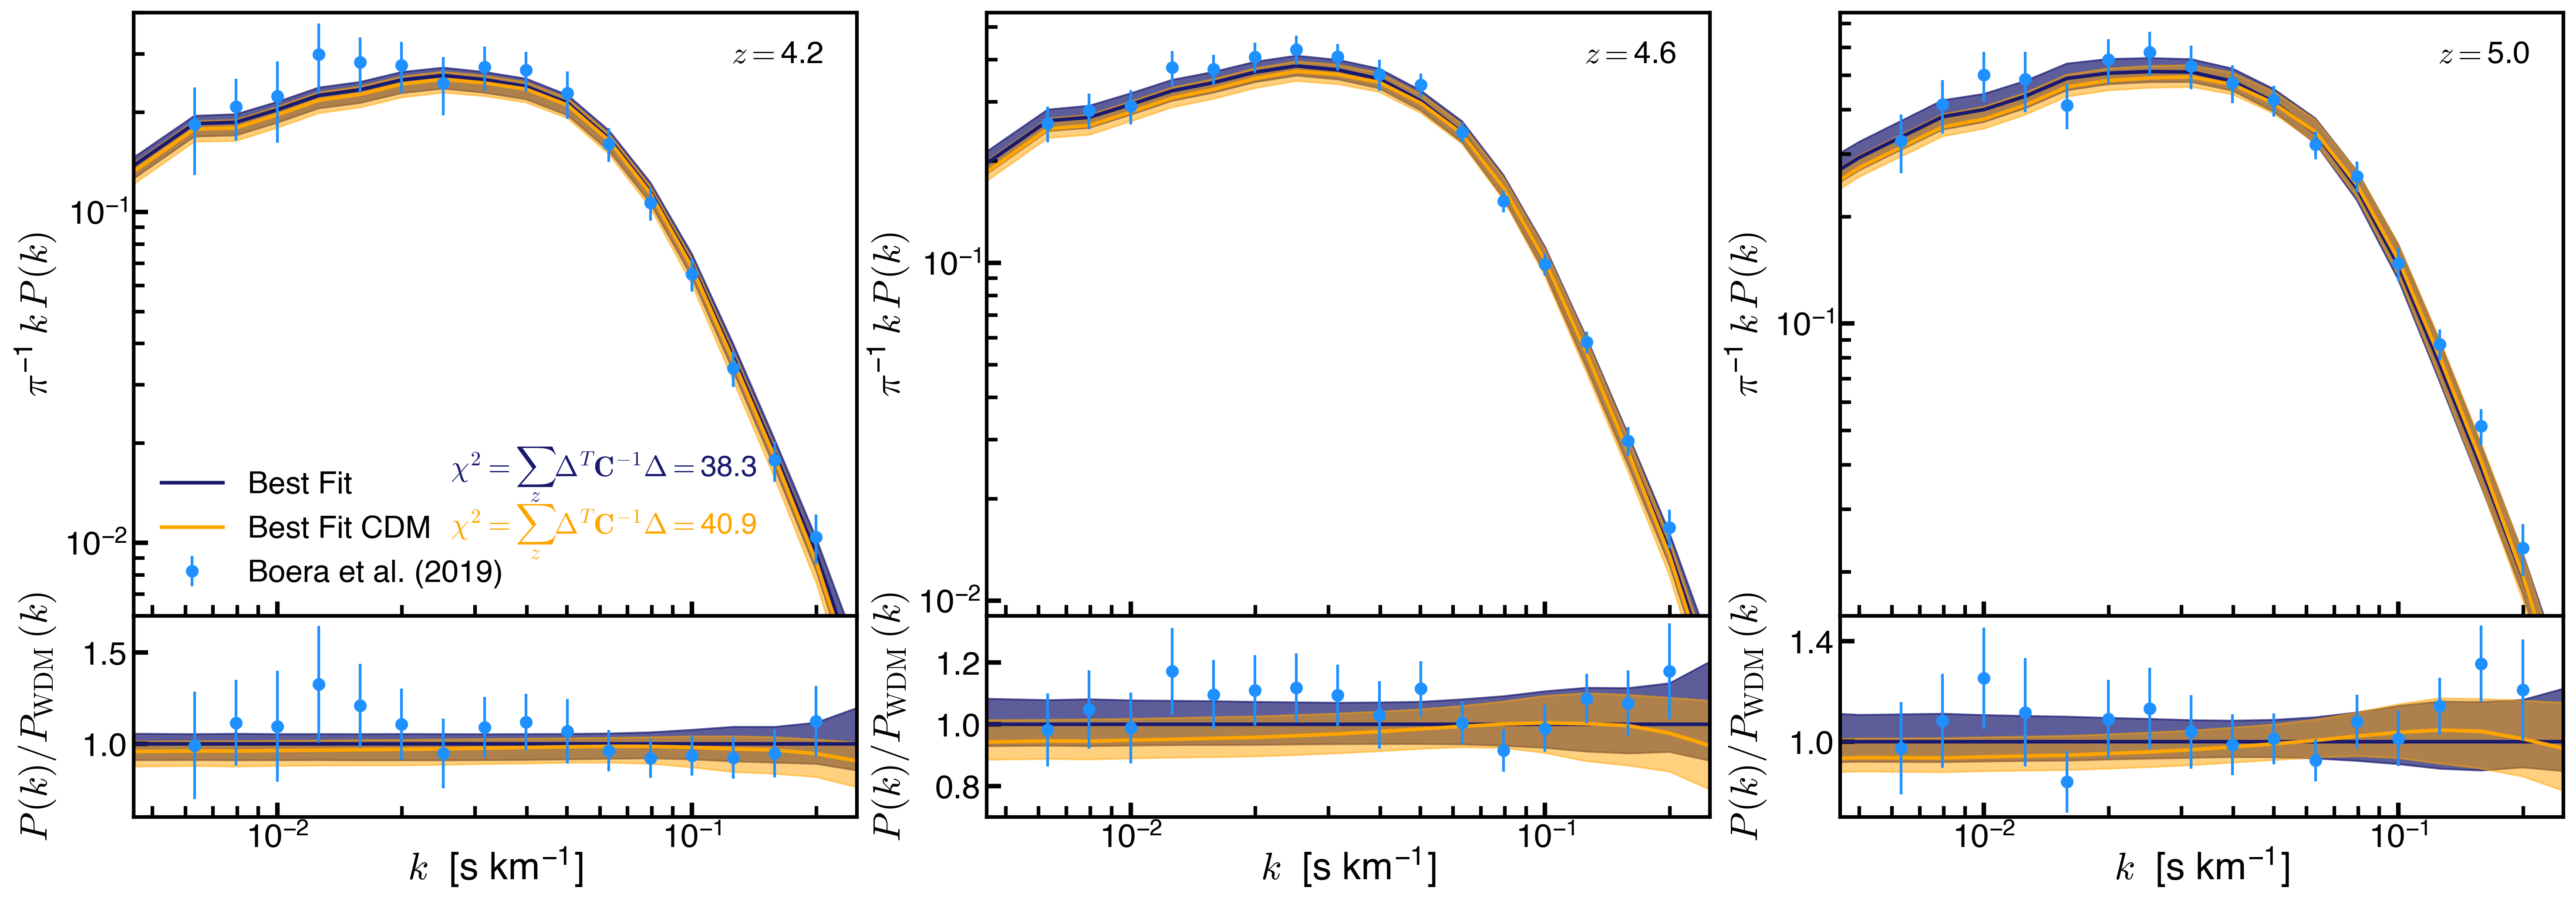
For this work we employ observations of the Lyman- forest power spectrum from the Keck observatory and the Very Large Telescope, presented in [1]. These measurements represent the highest resolution determination of to date and probe the structure of the forest in the redshift range . Since the impact of free-streaming on is greater at high redshift the data set from [1] is arguably the most constraining determination of to infer the nature of dark matter currently available. The measurements of from [1] along our best-fit determination obtained from our analysis are shown in Figure 6.
IV.2 MCMC Inference
To constrain WDM cosmologies from the observations of , we use an MCMC approach to sample over our suite of models and obtain best-fit distributions for our parameters. The likelihood function for the model given by the parameters is evaluated as
| (16) |
where denotes the difference vector between the observational and the model , and corresponds to the covariance matrix associated with the observation of as reported by [1]. These authors have considered how systematic uncertainties may affect their covariance matrix, and find that the level of potential systematics is . To compute for arbitrary values of the parameters not directly simulated by our grid, we perform a four-dimensional linear interpolation of the FPS measured from the sixteen neighboring simulations in parameter space. The methodology for our inference approach differs from previous works in a number of key respects:
-
1.
Our WDM-CHIPS simulation grid captures a wide range of free-streaming lengths and UVB models to sample over a variety of cosmic structure formation and gas thermal histories, and thereby produce different statistical properties for the Lyman- forest. Due to the computational cost of the simulations, evolving such a large grid of high-resolution cosmological hydrodynamical simulations had not been achieved before. With the advent of efficient numerical codes like Cholla and capable systems like Summit, it is now possible to simulate thousands of models.
-
2.
We evaluate the performance of a given model in matching the observations of by marginalizing over the self-consistently evolved hydrogen reionization history in the redshift interval . The IGM thermal properties at one redshift cannot be disentangled from its properties at previous epochs, thus the marginalization over the parameter posterior distributions should not be performed independently at each redshift [c.f. 39, 31, 40, 1, 41, 42]).
-
3.
We do not modify, in post-processing, the mean transmitted flux in the forest by rescaling the Lyman- optical depth, nor do we assume an instantaneous power-law temperature-density relation (cf. [14, 20, 1, 22]). The latter does not accurately reproduce the thermal state of IGM gas in the range . Instead, in our approach simulations self-consistently evolve the ionization and thermal structure of the IGM determined by the wide range of photoionization and photoheating histories applied in our model grid.
V Results
By comparing the high-resolution observation of the flux power spectrum from [1] to our suite of simulations that simultaneously vary the impact of free-streaming from WDM cosmologies on the matter distribution and different reionization and thermal histories of the IGM, we infer new constraints on the WDM particle mass . In this section we present the posterior distribution from our MCMC analysis and the marginalized and thermal evolution of the IGM for our best-fit models. To complement our results, we repeat our analysis by modifying from the simulations to account for a non-uniform UV background, and finally, we show hypothetical constraints on from an artificially increased number of quasars.
V.1 Distribution of the Model Parameters
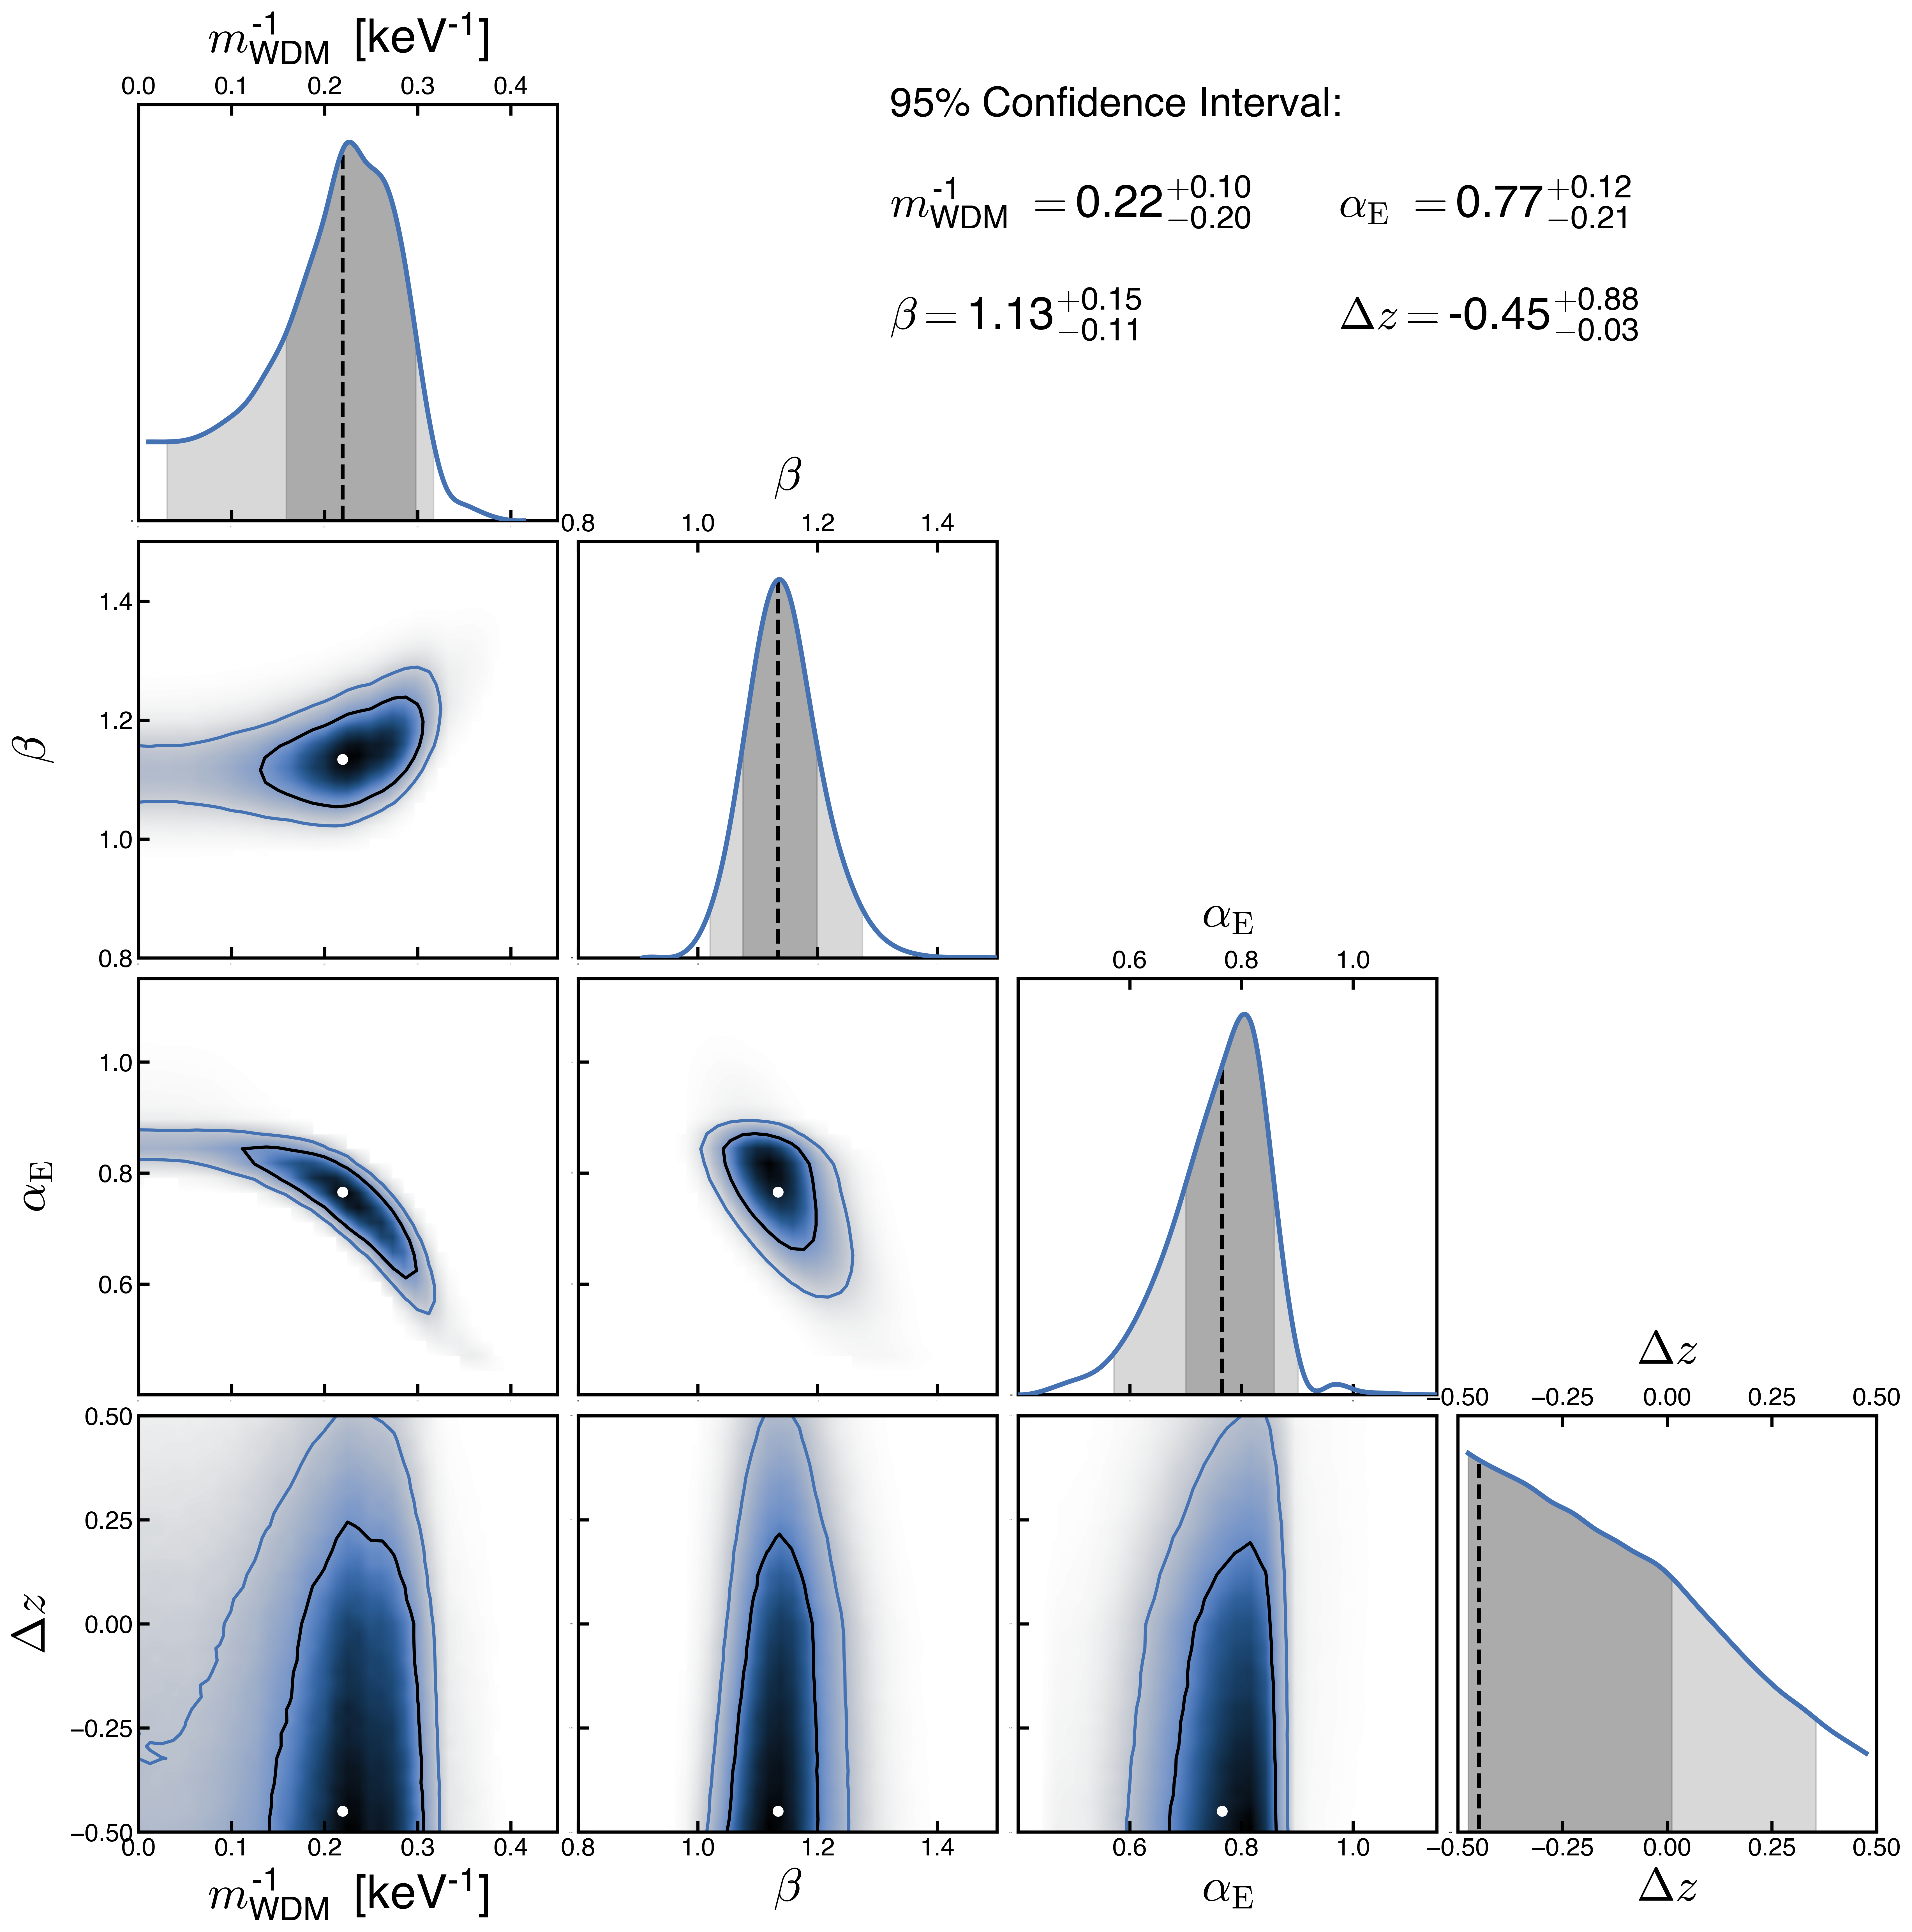
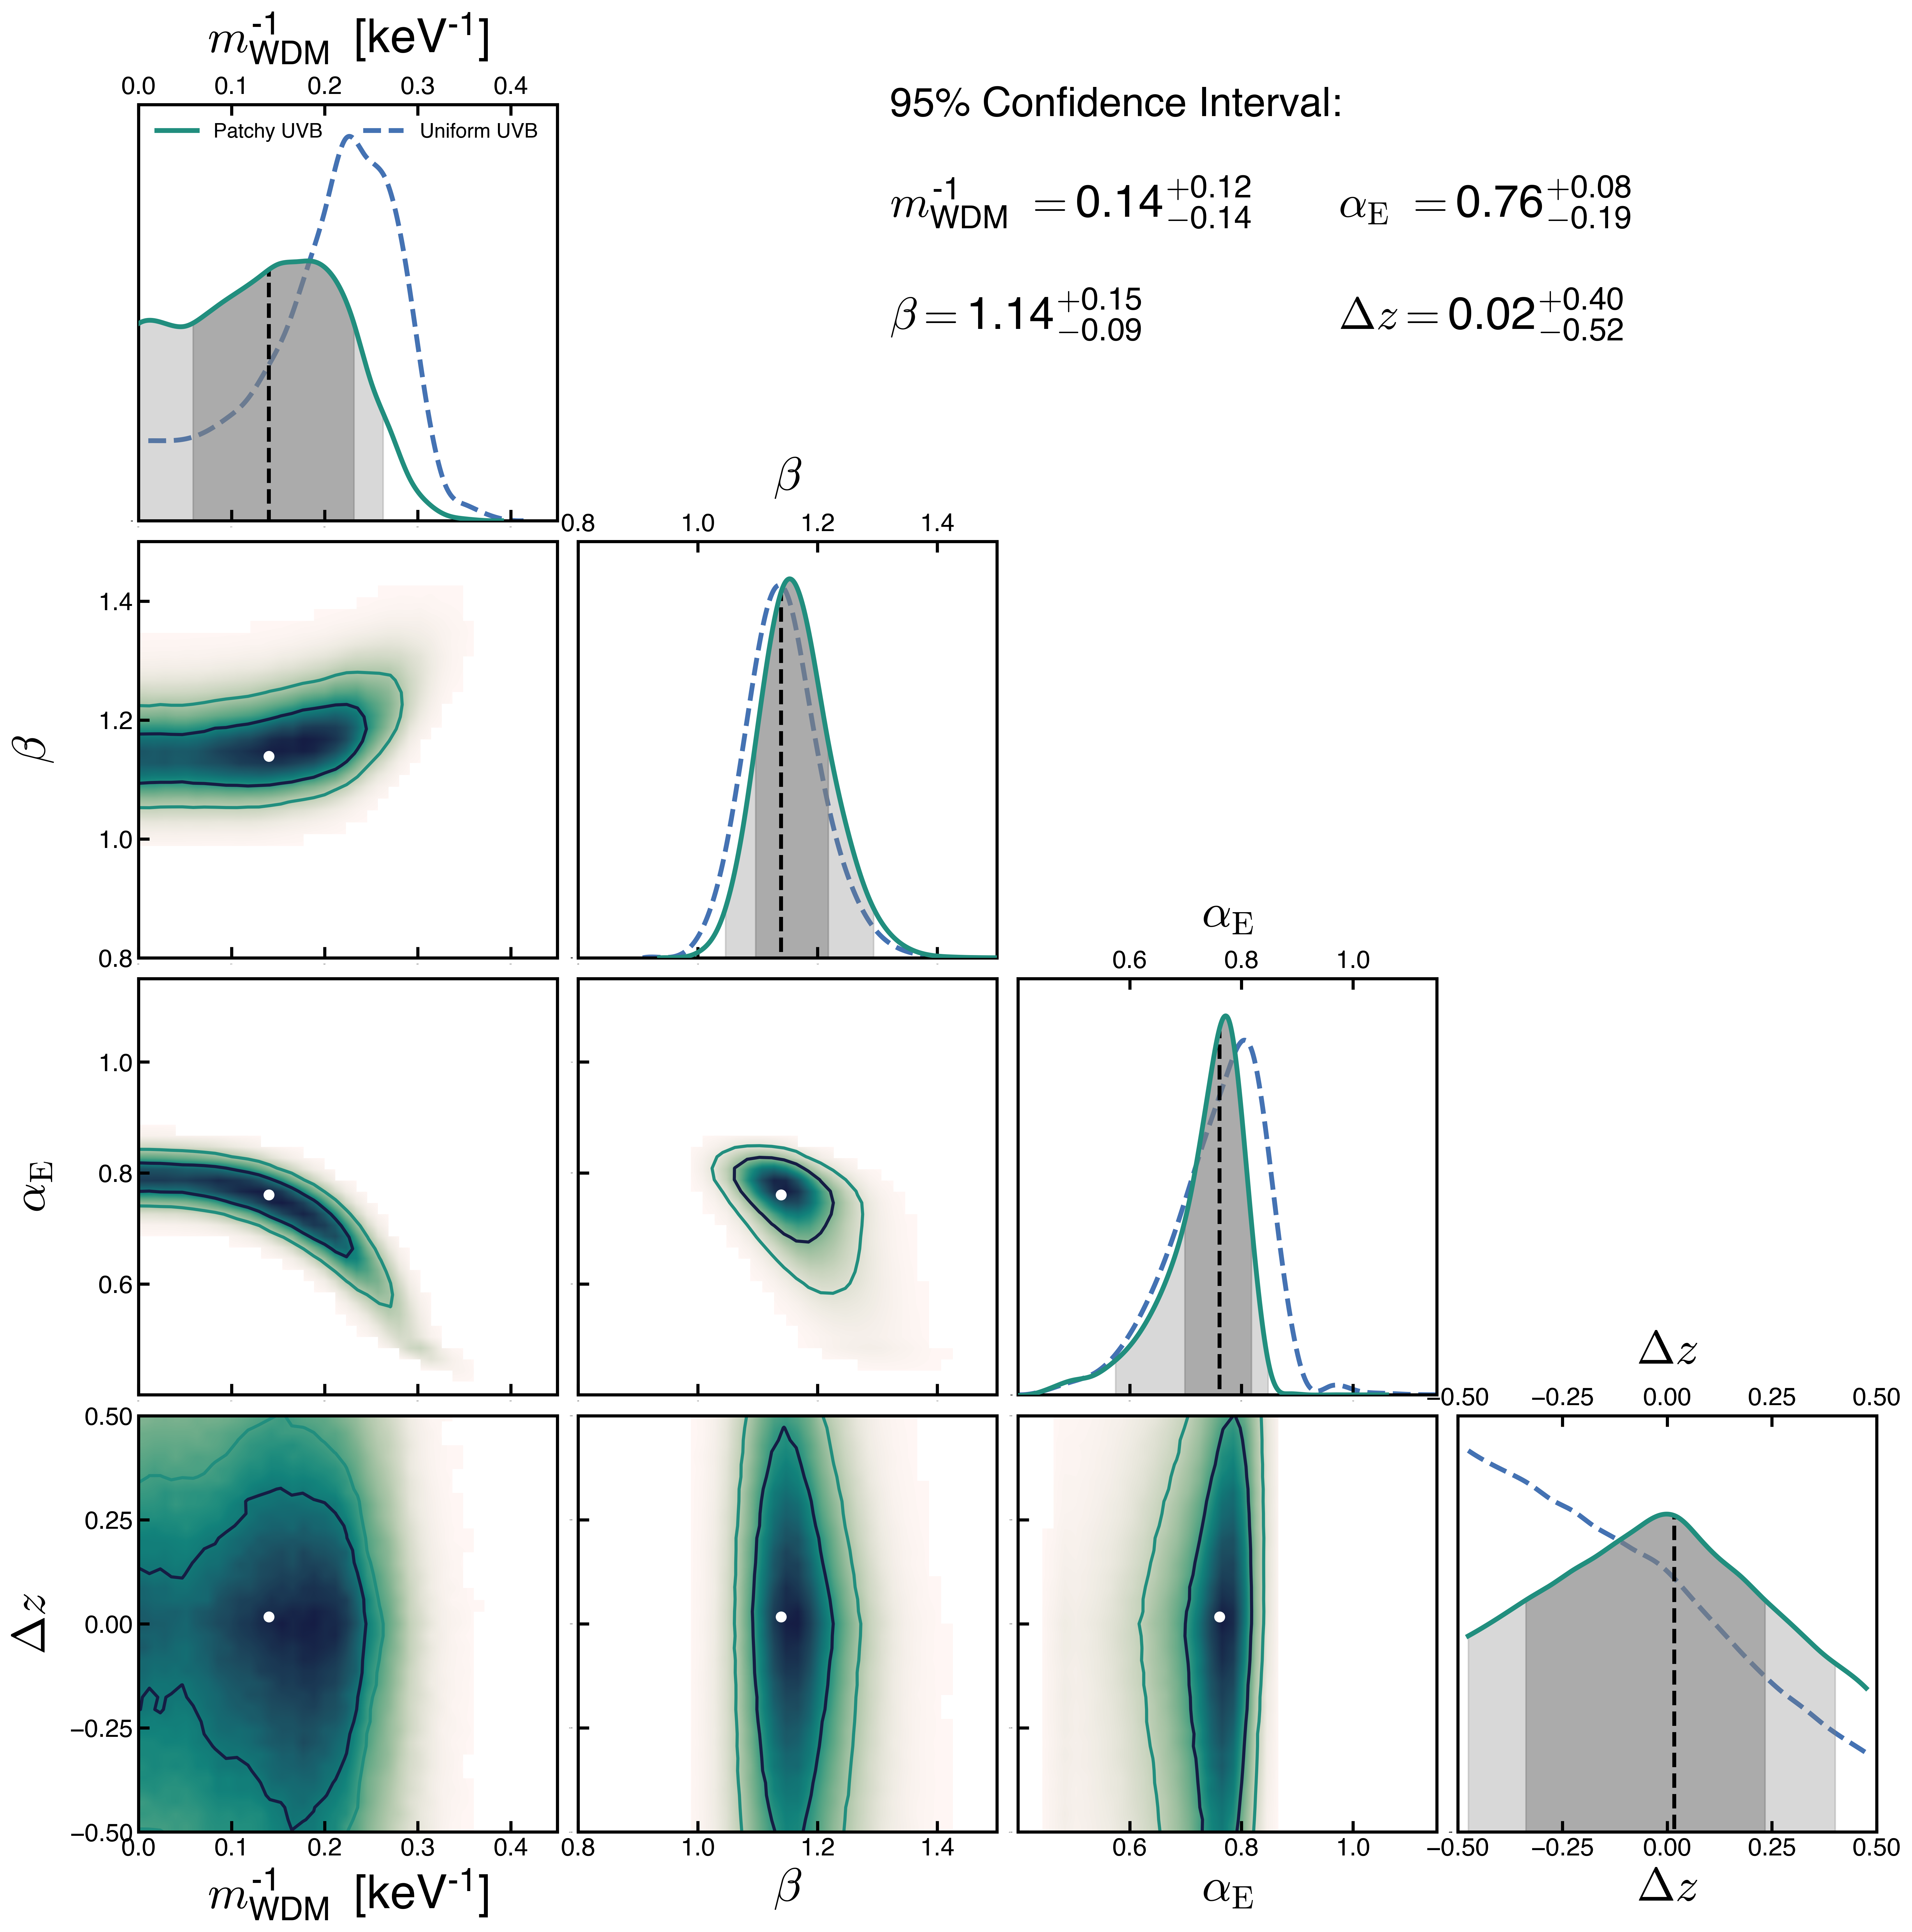
The posterior distribution of our four model parameters resulting from the Bayesian inference procedure is shown in Figure 7. A clear global maximum of the 1D marginalized distributions is shown for and the parameters and responsible for rescaling the photoionization and photoheating rates. The distribution of the parameter is not fully contained by our grid of models, but we argue that this issue does not represent a significant challenge to our conclusions. Values of would reduce the suppression of the small-scale from pressure smoothing which could be compensated by free-streaming or thermal broadening, possibly shifting our constraint of to slightly lower values.
The marginalized distribution for (top left panel, Figure 7) is well constrained and it peaks at . Arguably, the preference for a non-zero free-streaming length is weakly significant as the CDM cosmology is contained within the interval of the marginalized distribution. The principal result from our analysis is the lower limit (at the level) obtained for the WDM particle mass. We have also performed our MCMC analysis sampling in space (instead of space) applying a flat prior in mass the mass range of keV, and we find that our conclusions are unchanged. We also note that the sensitivity of the best-fit WDM mass on the UVB parameters (and hence on the reionization history) is largely a thermal Doppler broadening (and to a less extent, a pressure) effect.
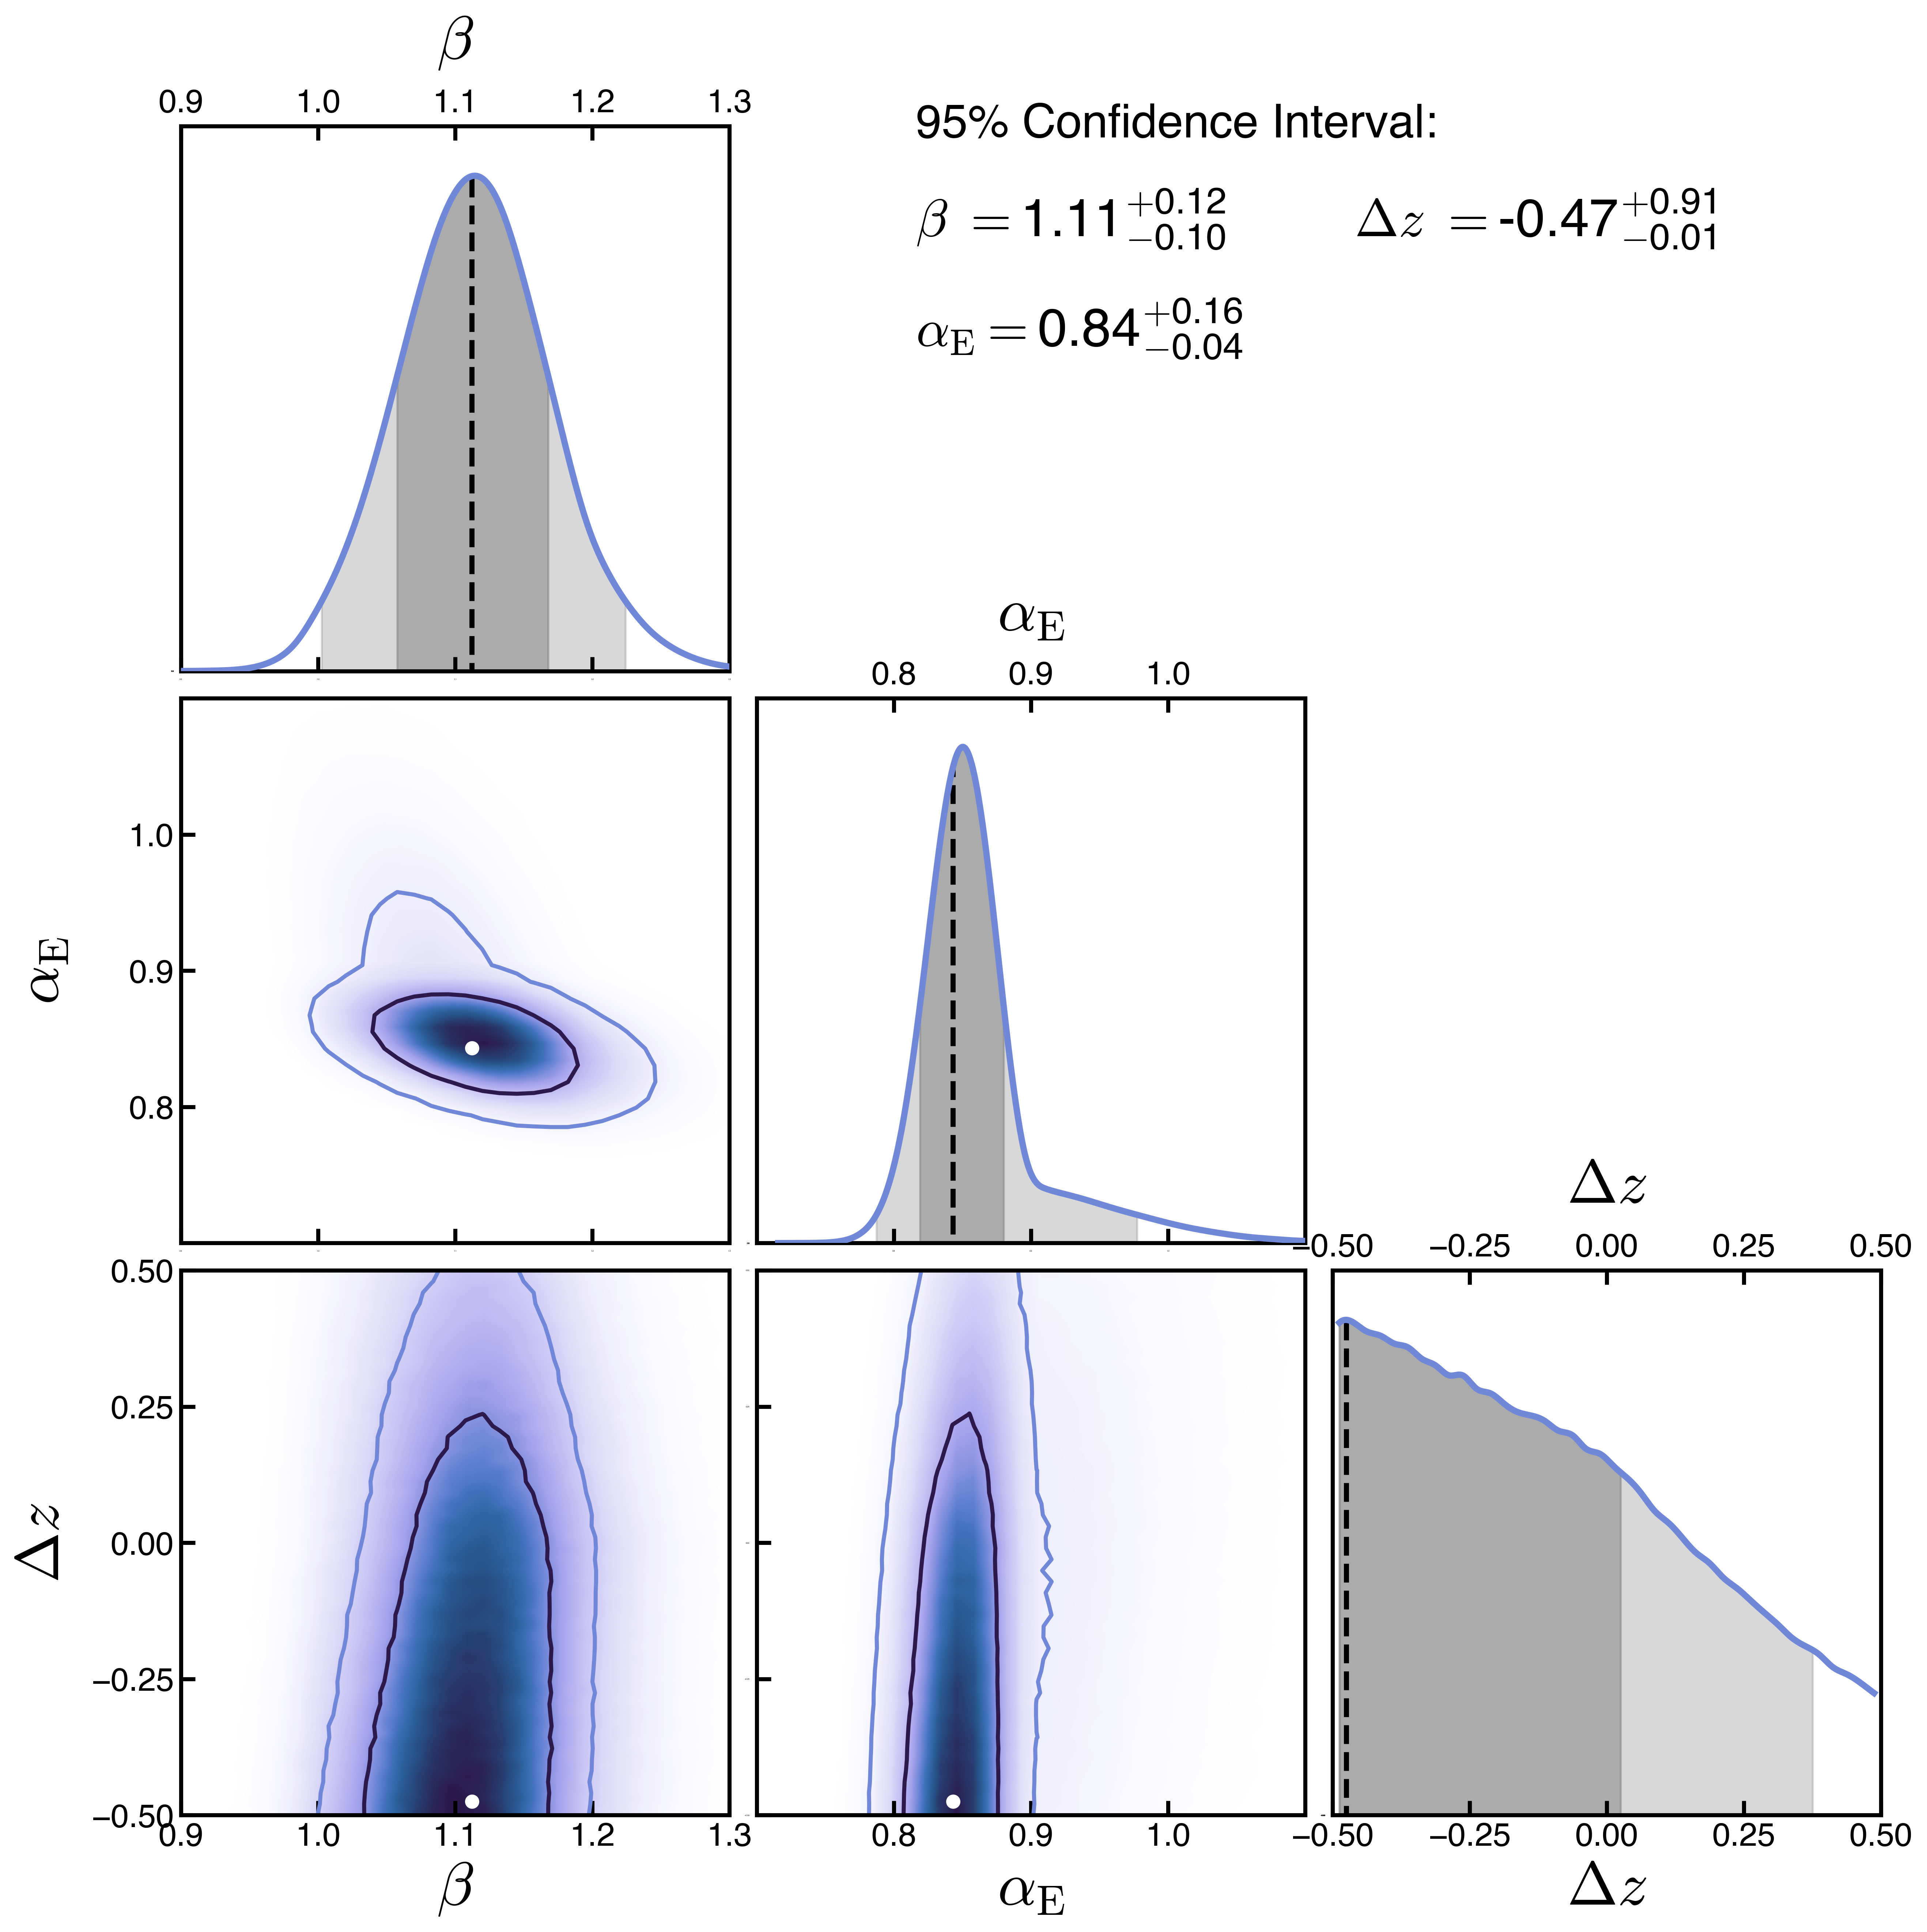
To find the best-fit model to for a CDM cosmology, we repeat our MCMC approach but restricted to the models that evolve the CDM cosmology varying only the photoionization and photoheating history. Figure 8 shows the one- and two-dimensional projections of the posterior distribution for the UV background (UVB) parameters obtained from the comparison of from [1] to the grid of 90 CDM simulations. The posterior distribution of the UVB parameters from our CDM fit differs slightly from the distribution of parameters obtained from the inference that included WDM cosmologies (see Figure 7). The main difference between the two distributions is that the parameters and peak at slightly shifted values. In particular, the product , which rescales the photoheating rates, is higher for the CDM case. Higher photoheating rates directly result in increased IGM temperatures (see Section V.3).
V.2 Best-Fit Power Spectrum
The marginalized flux power spectrum over the posterior distribution obtained from our MCMC analysis along the observational data used to constrain the model is shown in Figure 6. Lines and shaded regions show the best-fit and the 95% confidence range. The result from the fit performed by sampling over the entire WDM model grid (purple) and restricting to the CDM grid (orange) are shown separately. As shown, both results provide a good match to the observed nevertheless, the relative difference between the model and the data quantified as is slightly lower for the best-fit WDM model (), compared to from the CDM best-fit model. Here denotes the covariance matrix taken from [1] and is the difference vector between the observed and model .
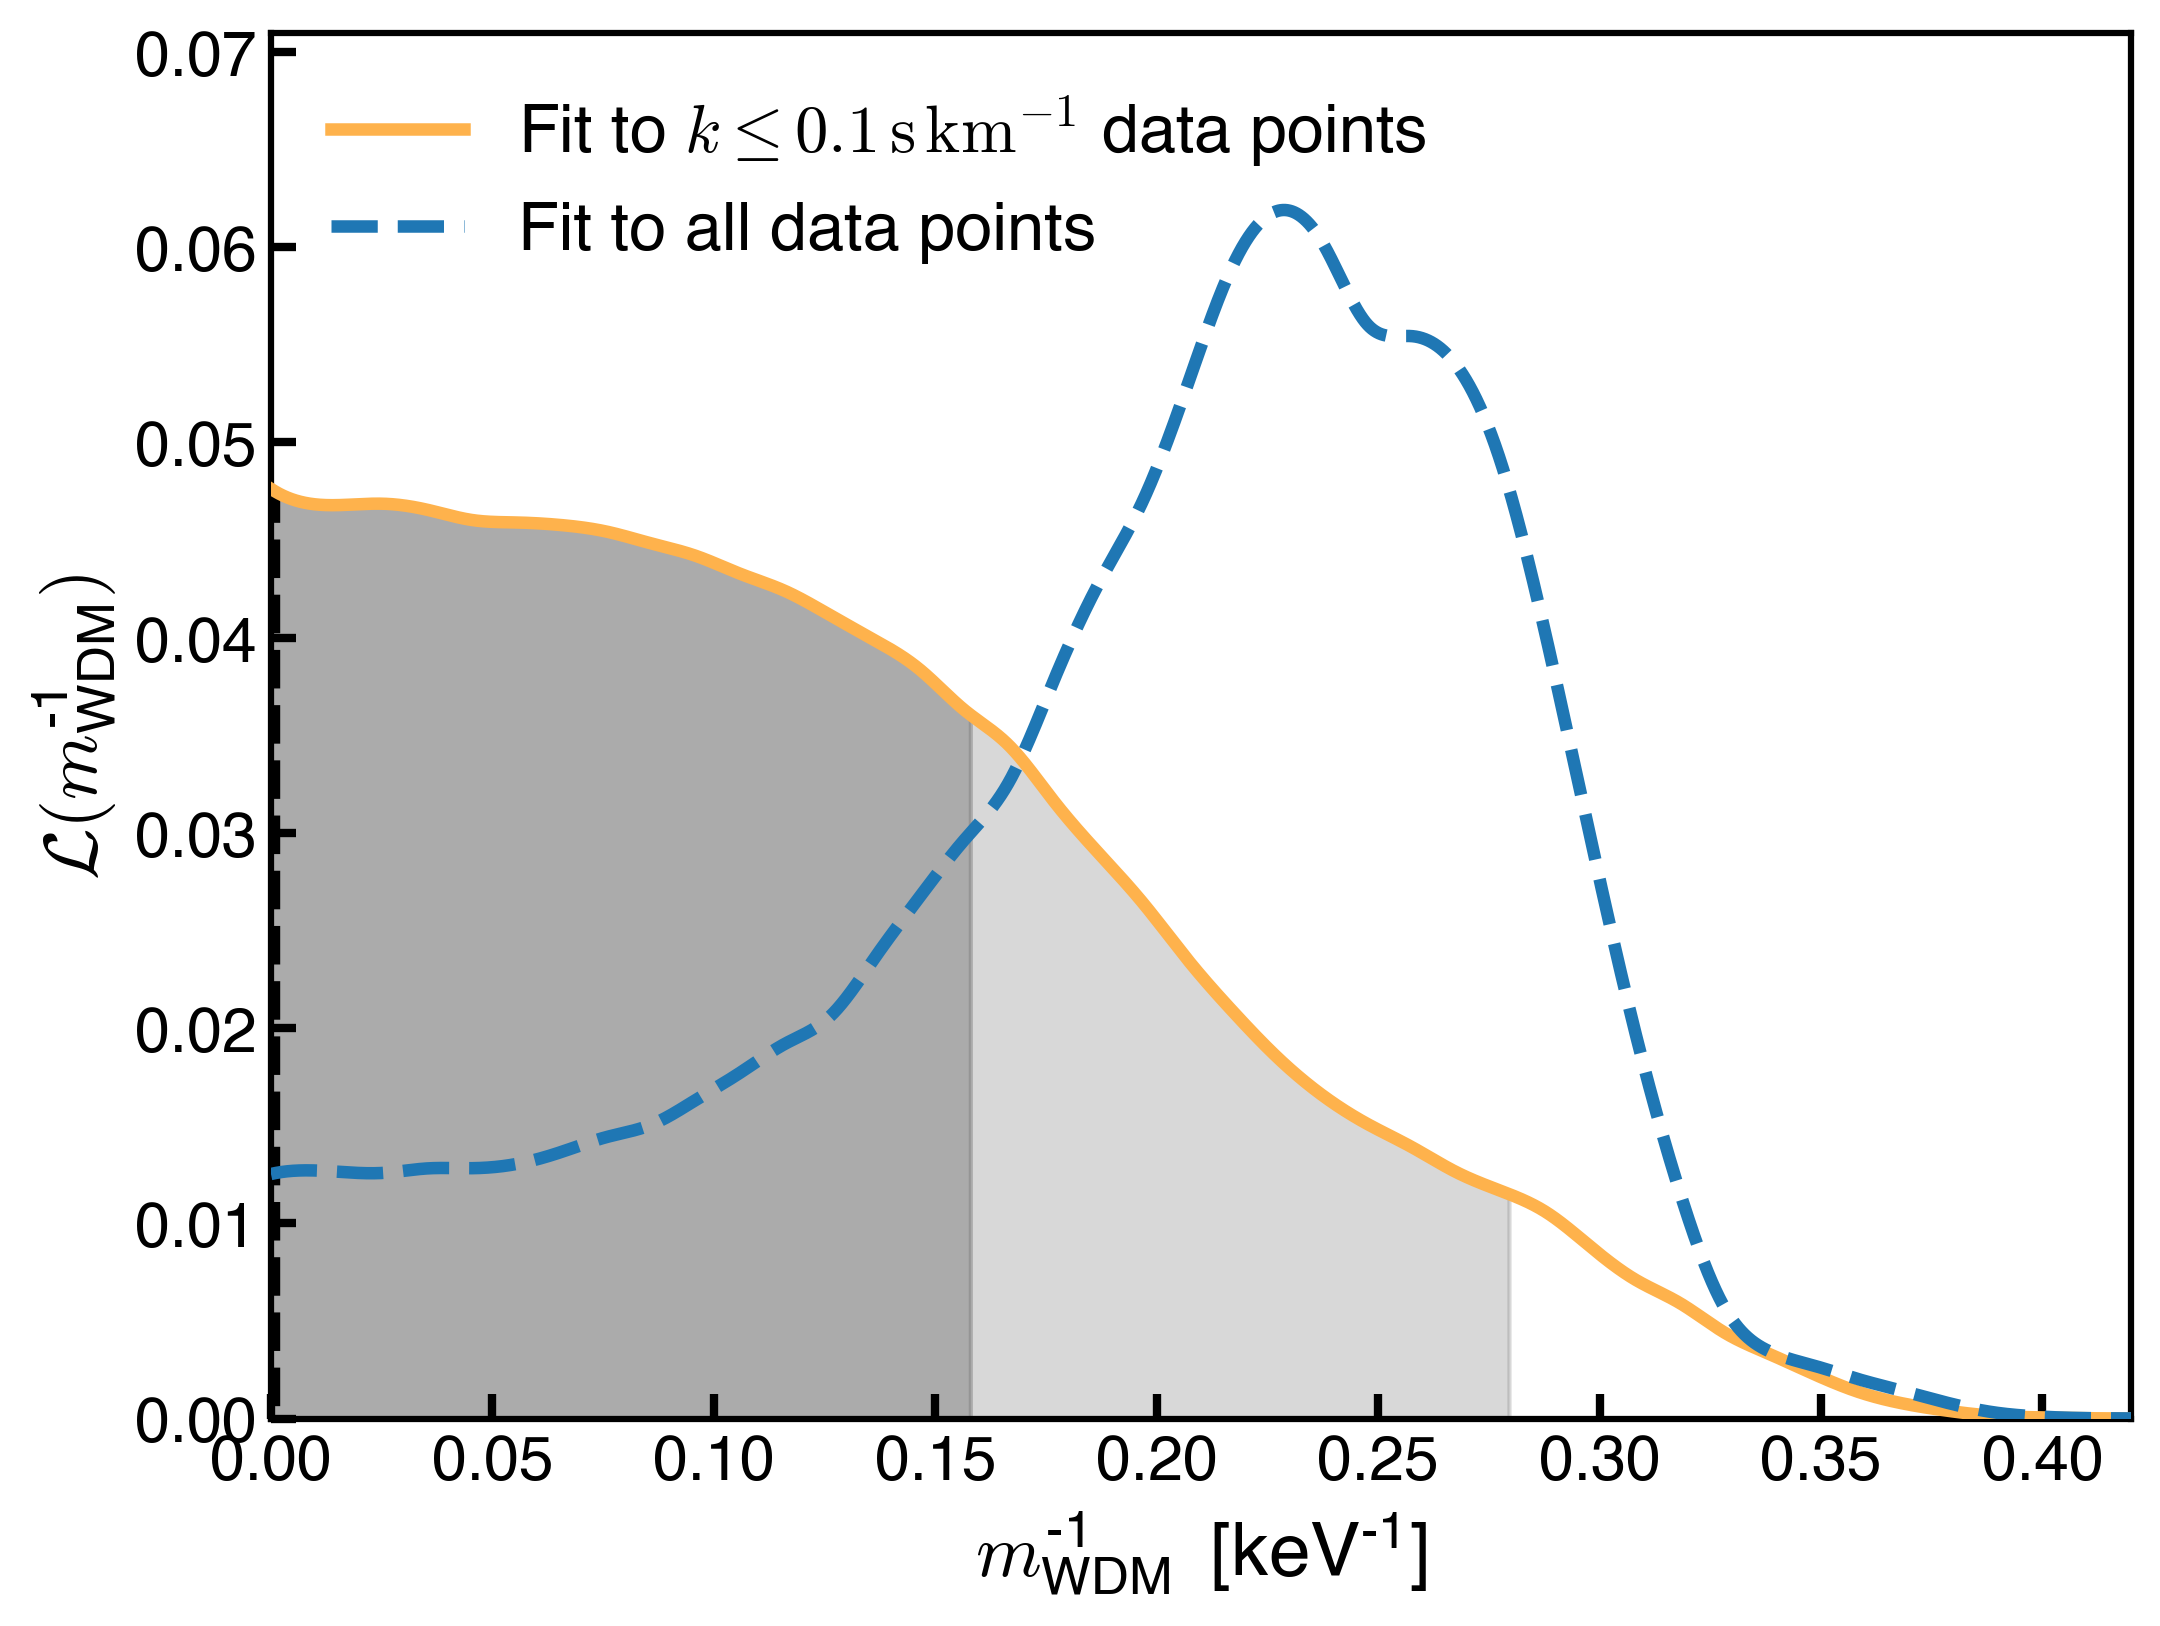
We find that the preference for a non-zero free-streaming scale derived from our analysis is driven by the smallest scales probed by the high-resolution measurement of from [1]. We repeated our inference methodology but excluding the three last data points () from the likelihood calculation. Here we found that excluding the high- measurements places CDM as the preferred cosmology. The marginalized posterior distributions for from the fits limited to and to full data set are displayed in Figure 9. As shown, the likelihood peaks at CDM and the lower limit constraint at the level shifts to .
In section III.4 we showed that free-streaming and Doppler broadening impact differently on small scales (). As the temperature of the gas is increased/decreased, the impact of thermal broadening is to decrease/increase the small-scale . While free-streaming decreases small-scale density fluctuations, its effect on the flux power spectrum saturates at due to the impact from peculiar velocities (see Figs. 4, 5).
We have shown that the preference for a WDM cosmology over CDM originates from the measurement of . Also, we showed that on these scales () the suppression of due to free-streaming saturates while the suppression of from thermal broadening increases monotonically. Therefore, we conclude that the saturated suppression of due to a combined with a moderately lower IGM temperature provides a slightly better fit to the observation of compared to the CDM best-fit model with higher IGM temperatures at (see Fig. 10).
V.3 Thermal Evolution of the IGM
One of the advantages of our approach compared to previous works that aim to constrain the WDM free-streaming from observations of the Lyman- forest power spectrum is that our simulations self-consistently evolve the IGM thermal and ionization history during and after reionization by sampling over a large grid models that vary the UVB photoionization and photoheating rates. Instead, the methodology adopted by previous works [14, 20, 16, 17] was to change the temperature and the ionization fraction of the IGM in post-processing by rescaling and the effective optical depth of the simulated skewers.
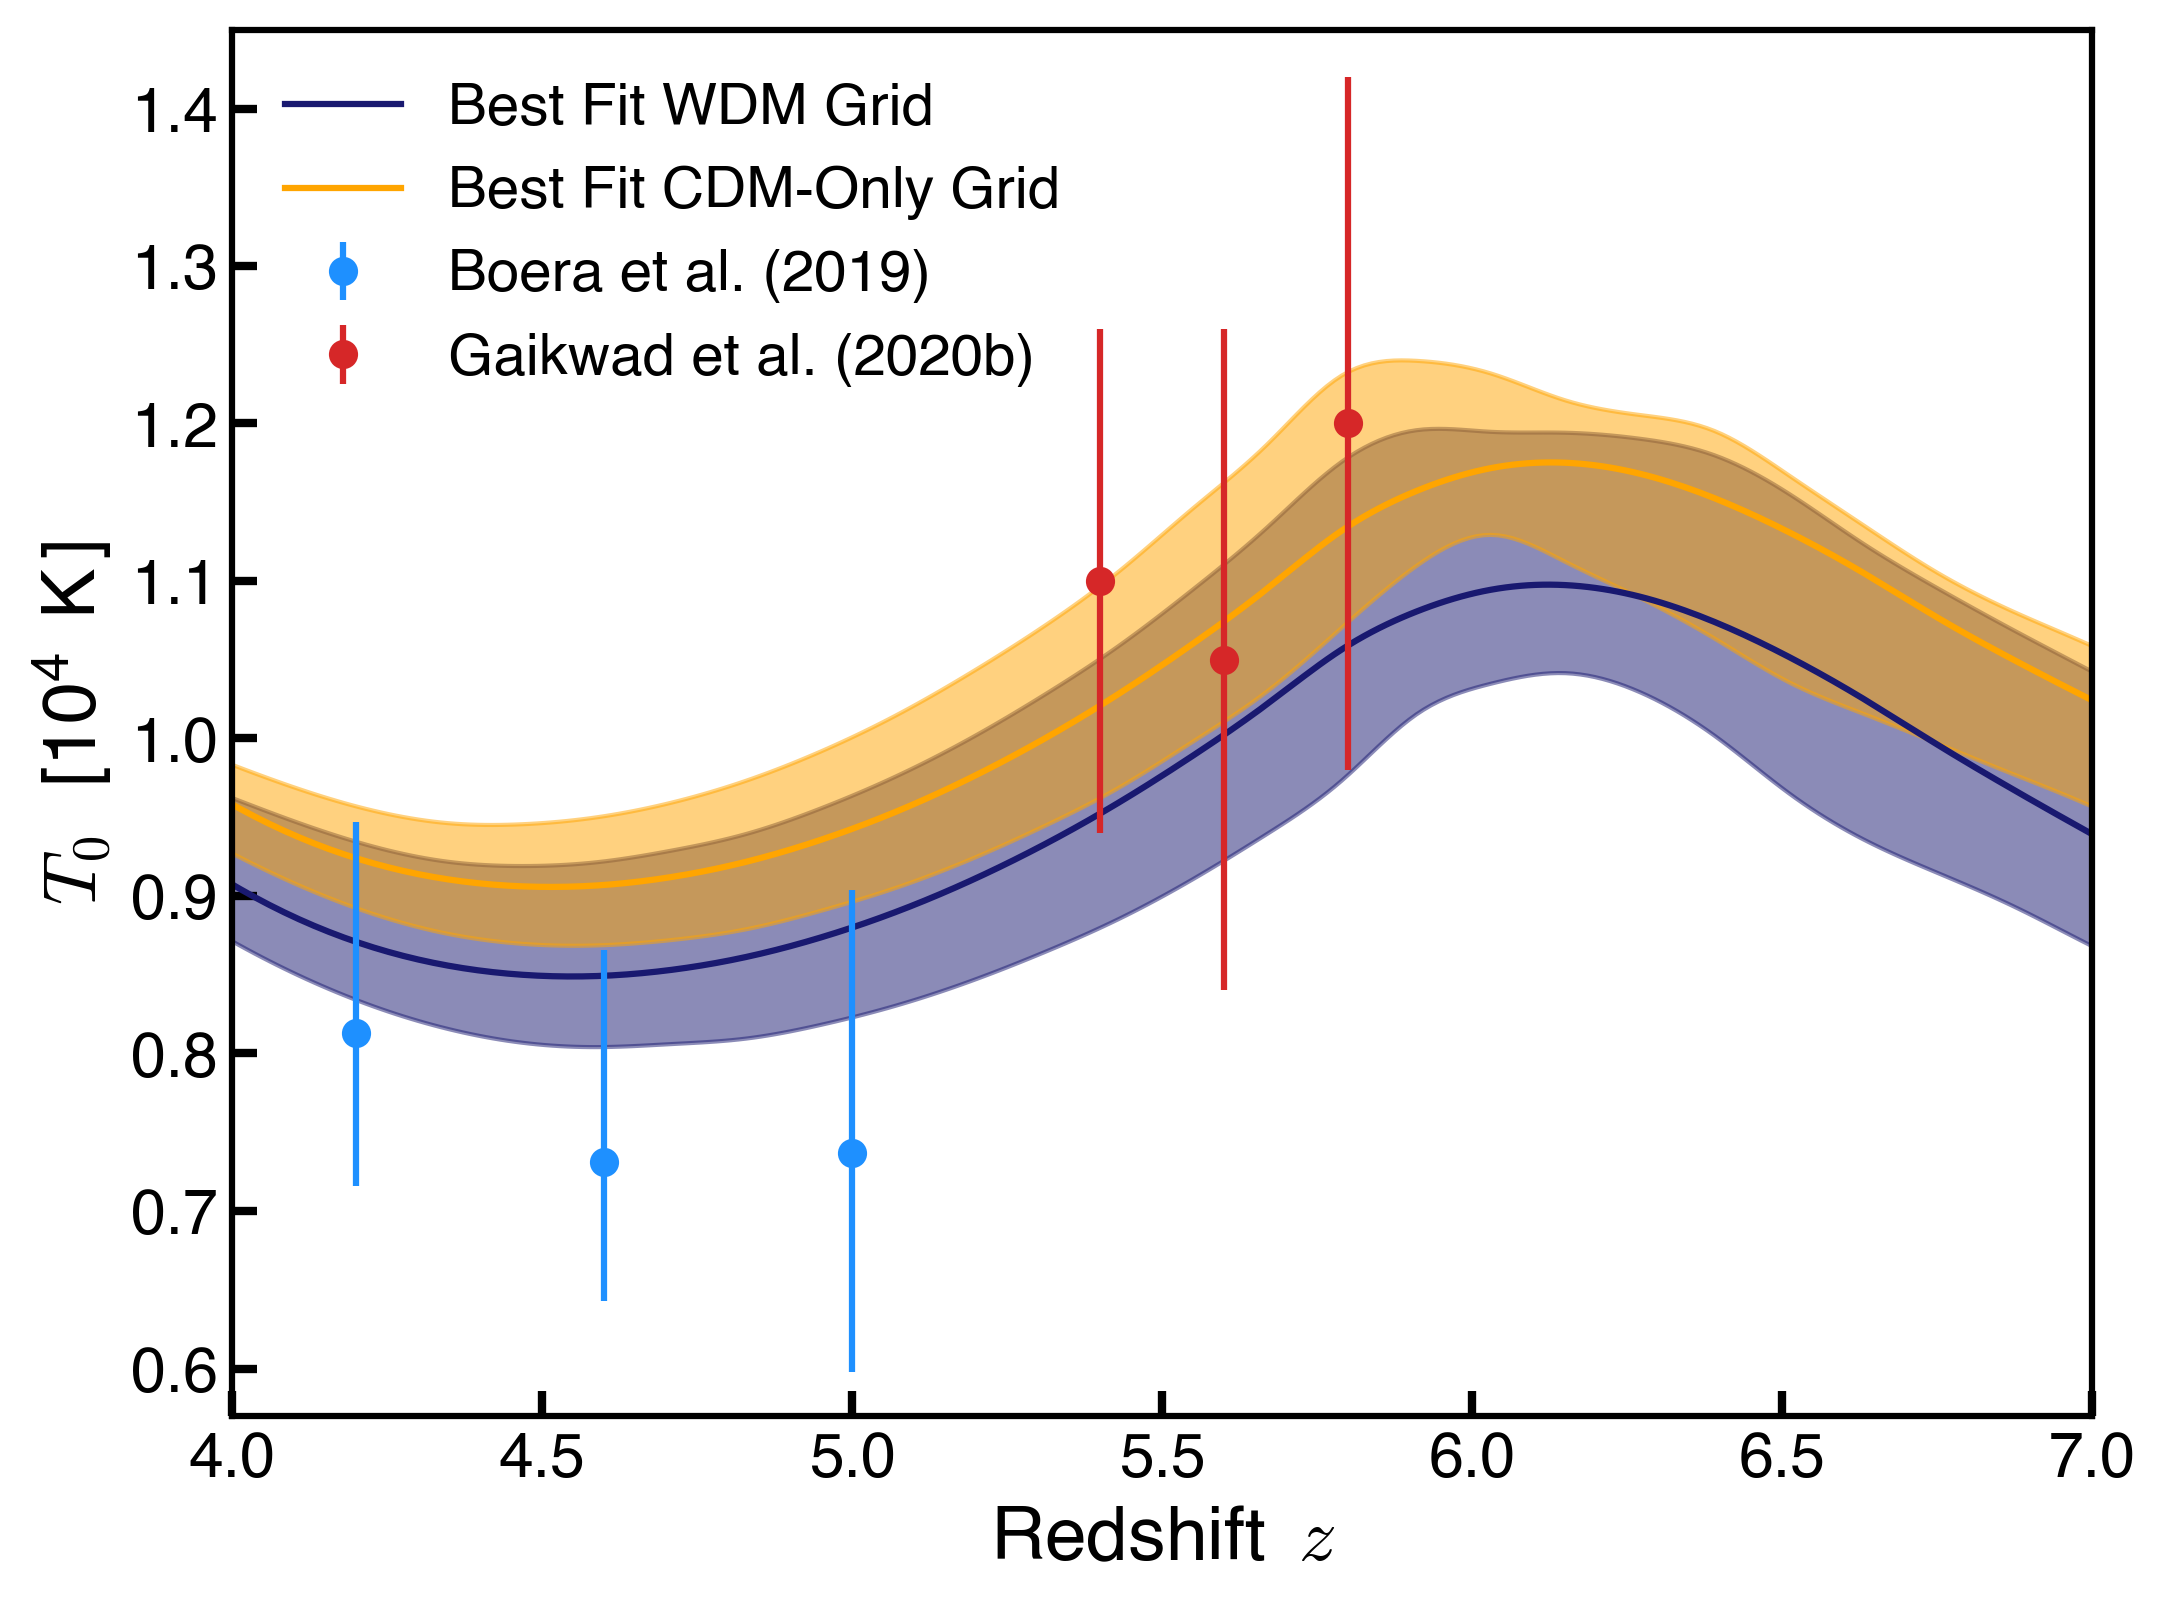
Figure 10 shows the redshift evolution of the temperature of the gas at mean density marginalized over the posterior distribution from our MCMC analysis; shaded bars show the interval. The best-fit model for WDM cosmologies with keV results in moderately lower (%) IGM temperatures (purple) due to the slightly reduced photoheating rates compared to the CDM best-fit model (orange). Lower temperatures are expected from the WDM models as they decrease the impact of thermal broadening in suppressing which compensates for the suppression due to free-streaming.
In Figure 10, we compare the IGM temperature inferred by this work to other measurements at [1, 25]. The high-redshift inference presented by [25] was obtained by characterizing the transmission spikes observed in spectra. The thermal histories obtained from our analysis are consistent with the results from [25], suggesting a peak in due to hydrogen reonization at .
The measurement of presented in [1] for was made by fitting the observed to simulated spectra according to a CDM cosmology where the instantaneous density-temperature distribution of the gas is modified in post-processing changing parameters and from the power-law relation . Despite using the same observational determination of for our inference, the IGM temperatures obtained in this work during are slightly higher than those inferred by [1]. Restricting to a CDM cosmology, we find a best-fit is % higher at redshift and compared to the result from [1]. At redshift the difference lowers to 10 - 15% and our result agrees with their inference within . The evolution of from our best-fit WDM model is also higher (5 - 10%) than the results from [1], but in this case our results also agree to within .
V.4 Thomson Scattering Optical Depth
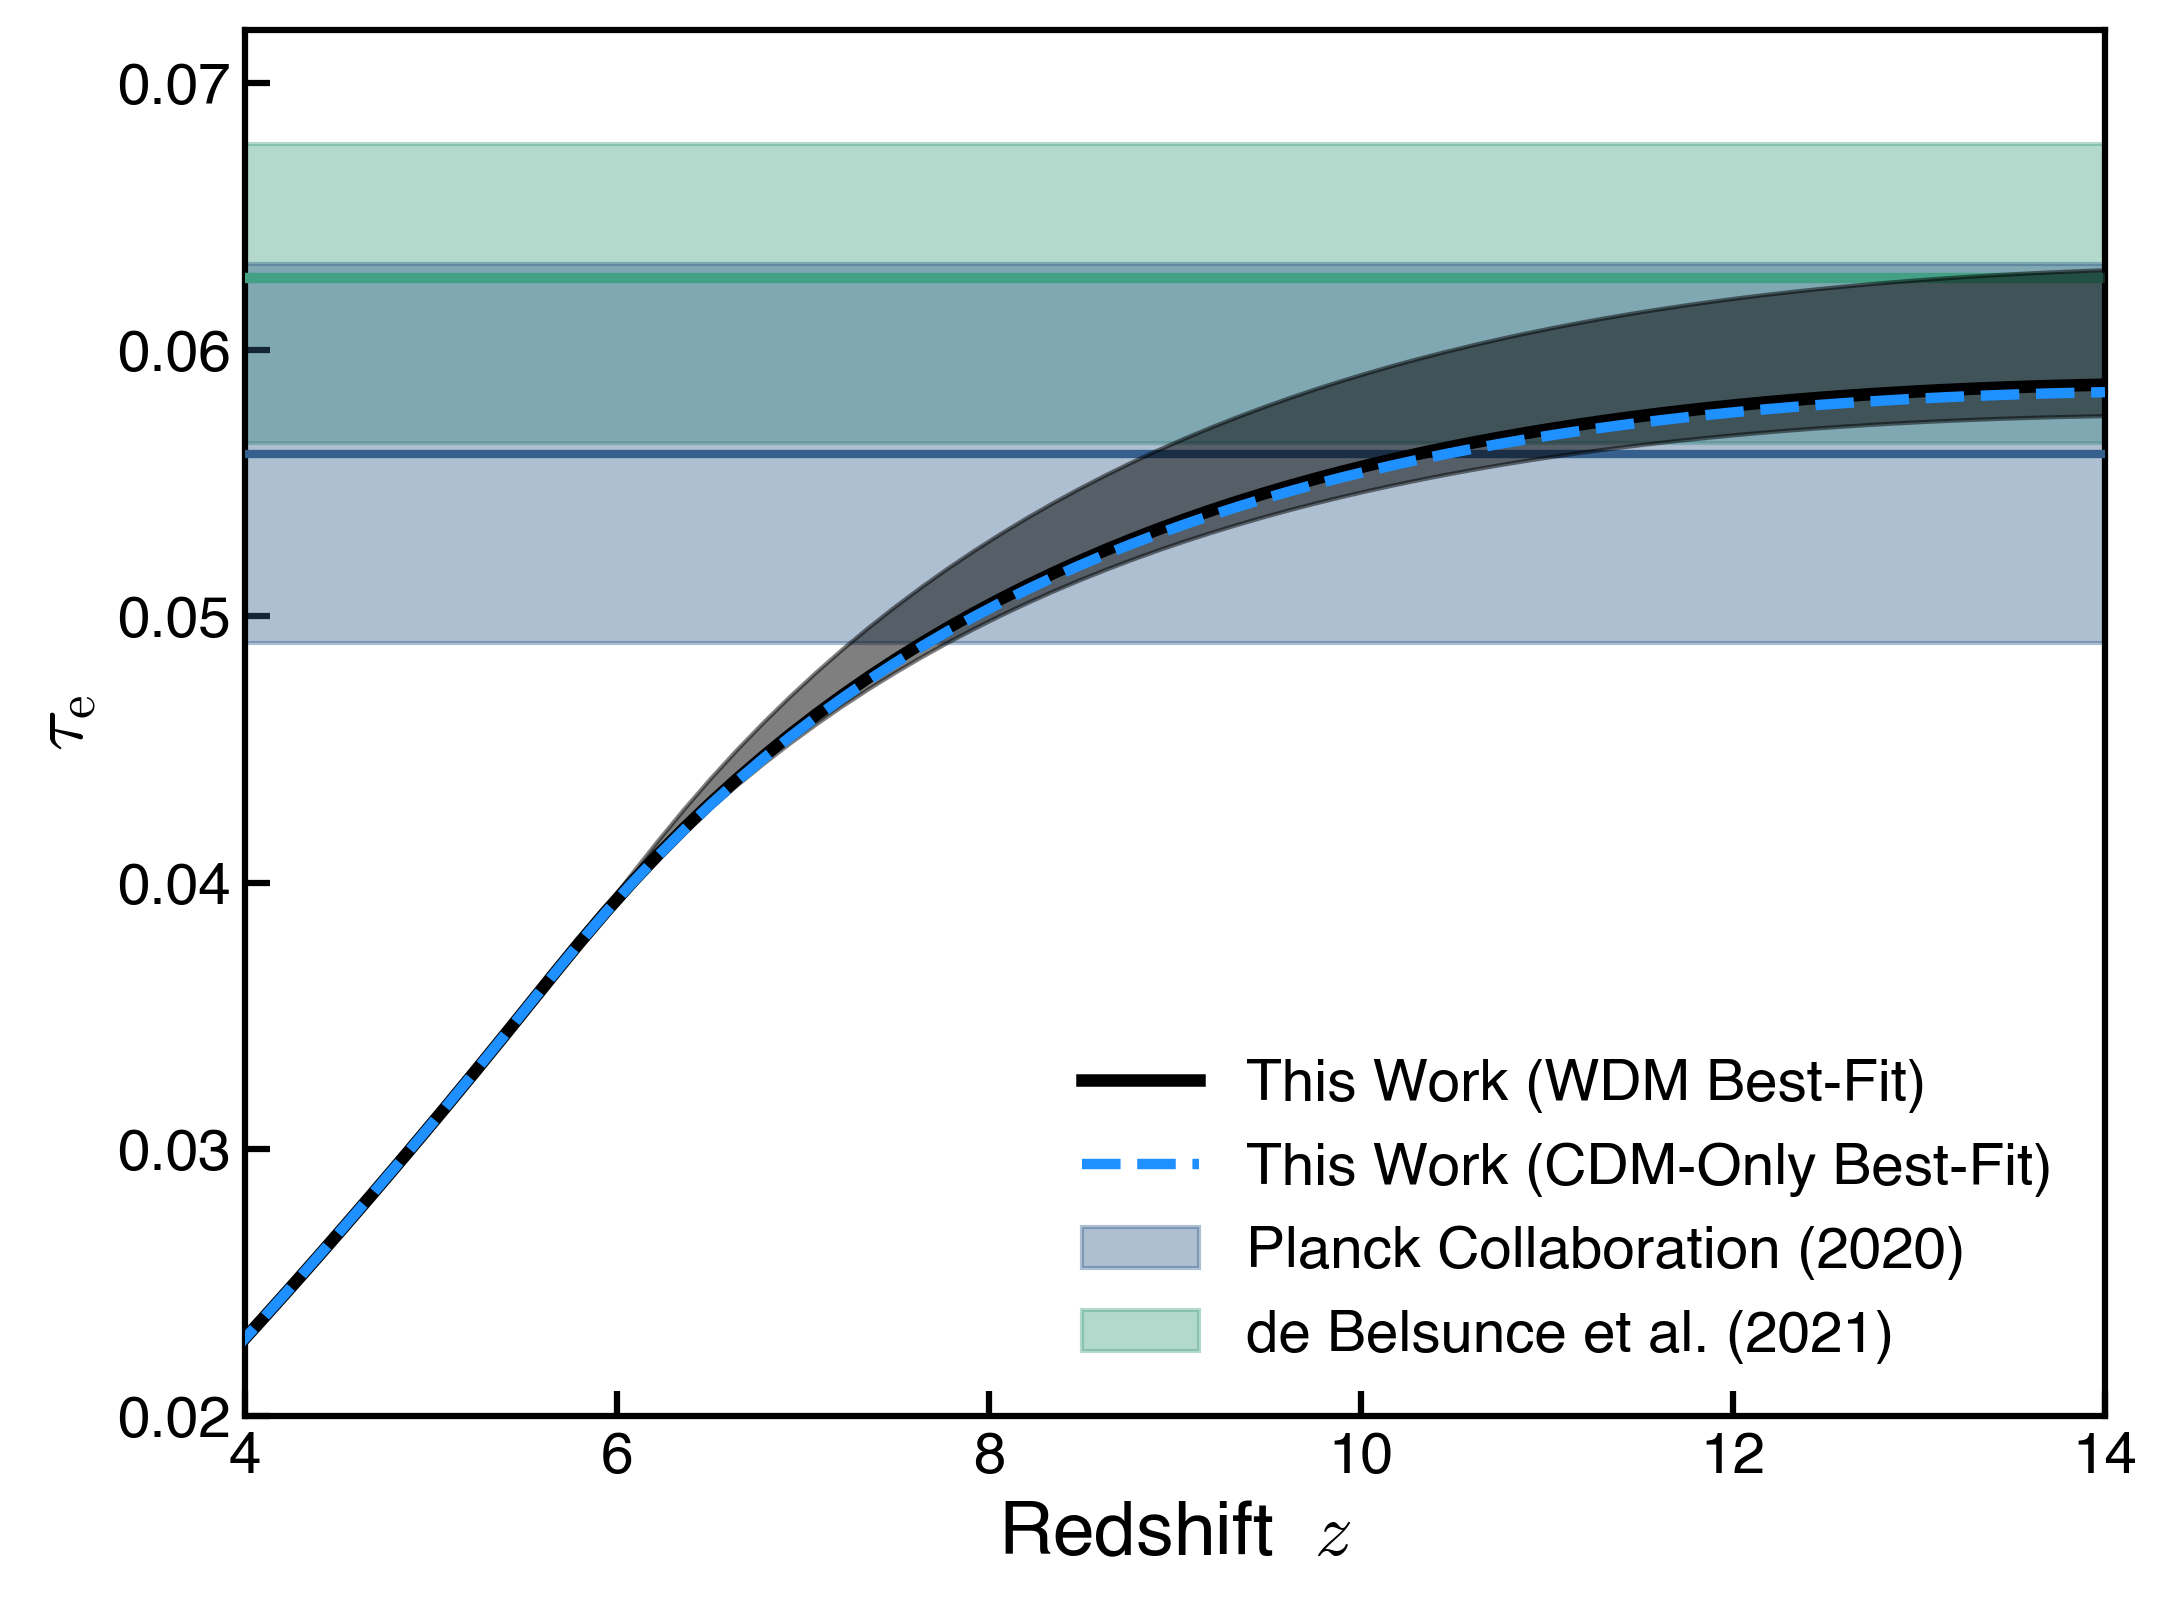
Our WDM and CDM-Only best-fit models result in very similar reionization histories with Thomson scattering optical depths that are consistent with constraints from the Planck satellite [43, 44]. Figure 11 shows such constraints together with the marginalized Thomson scattering optical depth, , for our WDM best-fit model (black line, with the shaded regions displaying the 1 interval), and for our CDM-Only best-fit model (blue line). We measure and from our WDM and CDM-Only best-fit simulations, respectively.
V.5 Constraining WDM with Increased Quasar Sightlines
Upcoming surveys of the Lyman- forest (e.g., DESI [46], WEAVE [47], EUCLID [48], LSST) will drastically increase the available observations of quasar sightlines, which will significantly improve the statistics of measurements derived from the forest. The improved statistics will allow tighter constraints on cosmological parameters as well as on WDM and the sum of the neutrino masses from their role in suppressing small-scale structure in the forest.
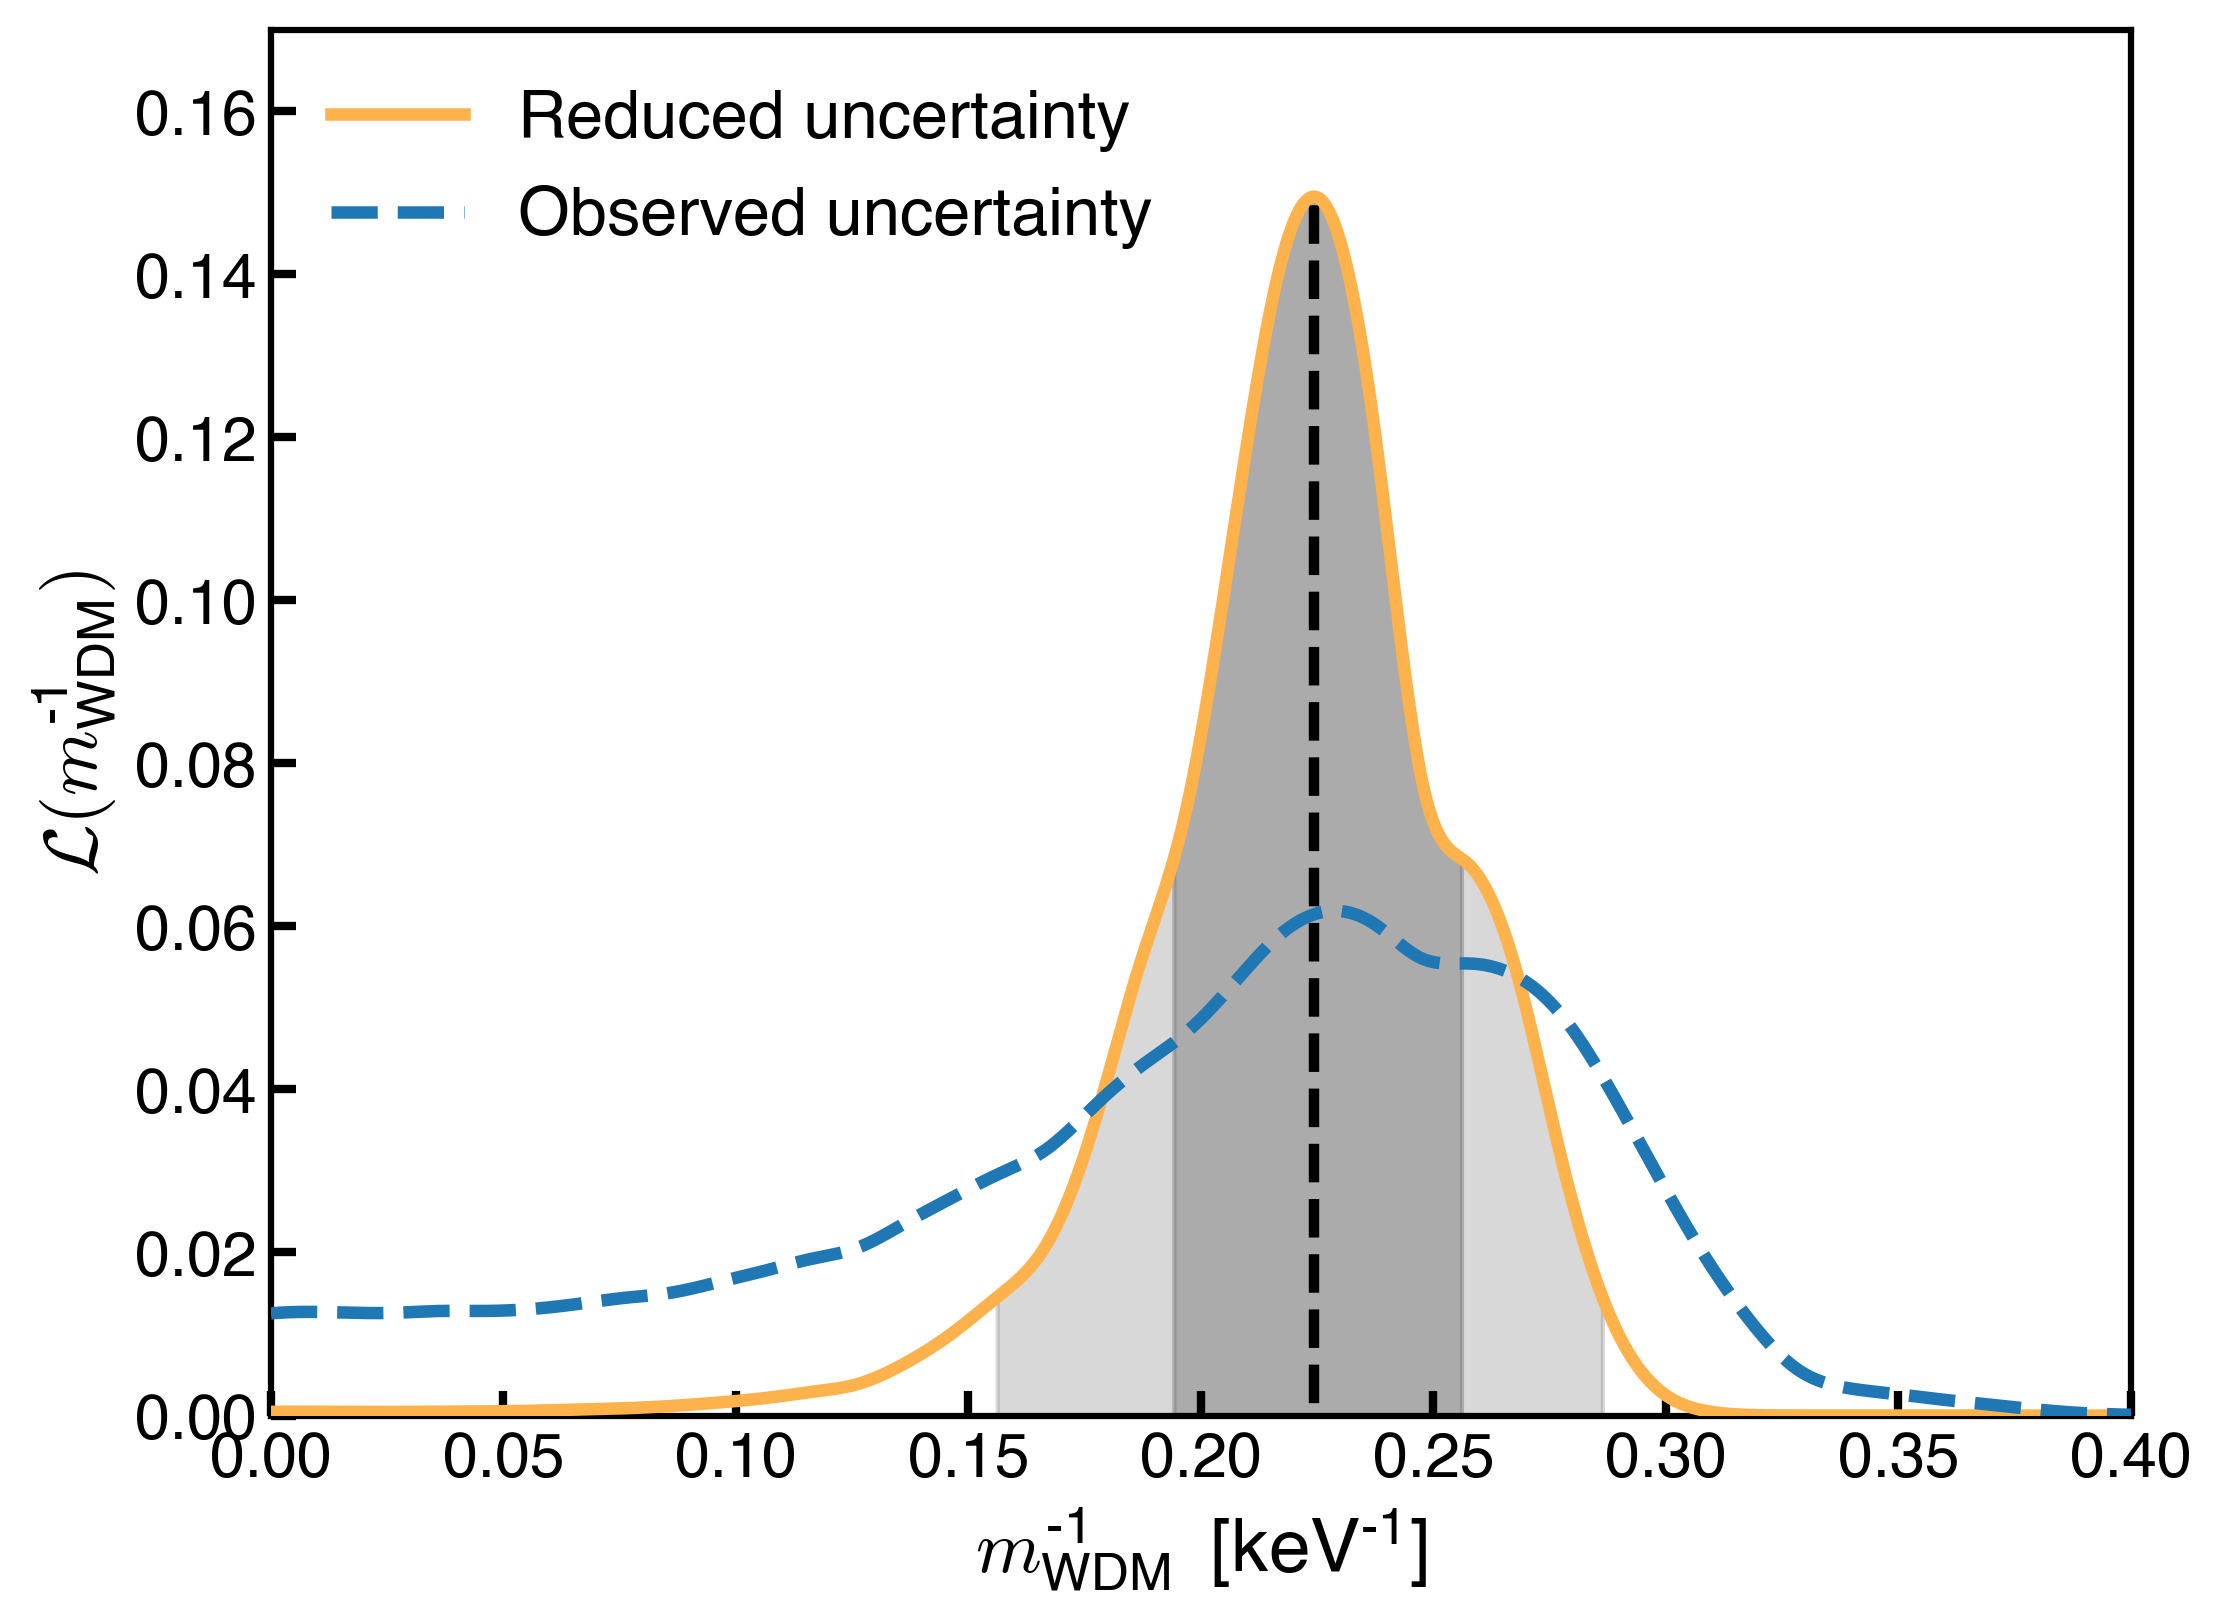
To assess how better statistics would impact the constraining power of high-redshift and high-resolution observations of the Lyman- forest for WDM cosmologies, we repeat our analysis but decreasing the uncertainty on the observed by a factor of one half, which would correspond to increasing the number of observed quasar spectra from fifteen used by [1] for their measurement of , to about sixty (a factor of four increase).
In our approach, we approximate a more constraining dataset by rescaling the covariance matrix of by a factor of one-fourth in Equation (16). Note that the observational measurements of the FPS are not altered, and only the covariance matrix is reduced. Figure 12 shows the marginalized likelihood for obtained from our analysis using the reduced uncertainty. In this hypothetical case, the improved statistics of the measurement provide a tighter constraint for the WDM particle mass measured as at the 95% confidence level. This exercise demonstrates that increasing the sample of high- and high-resolution observations of the Lyman- forest should place tight constraints on WDM cosmologies.
V.6 Modified for Inhomogeneous UVB
One of the main limitations of our analysis is that the WDM-CHIPS simulations evolve under a homogeneous UVB in the form of uniform photoionization and photoheating rates. We evaluate the effect of this assumption on our conclusions by repeating our analysis but using the modification to prescribed by [45] to account for the impact of a nonuniform UVB on the simulated .
In [45], a set of simulations that apply a uniform UVB were compared to a set that follows a hybrid-RT method. For the latter, spatially-varying maps for the H photoionization and photoheating rates were computed in post-processing and used as input for a re-run of the base simulation, incorporating the response of the gas to the non-uniform photoionization and photoheating. For the comparison, pairs of uniform and nonuniform UVB simulations were calibrated to have the same average ionization and thermal history. The authors concluded that simulations with a patchy reionization show a suppression (%) of the FPS on small scales () with respect to the uniform UVB case. This effect is mainly driven by the Doppler broadening associated with the high temperatures of recently ionized regions and the divergent peculiar velocities of thermally pressurized gas [49]. On large scales () the variation of the IGM neutral fraction due to large-scale fluctuations of the gas temperature leads to an increase on .
The likelihood distribution from our MCMC inference where we modify the from each one of the simulations in our WDM-CHIPS grid to account for an inhomogeneous reionization according to the transformation presented in [45] is shown in Figure 13. Dashed blue lines correspond to the one-dimensional marginalized distributions obtained from fitting the base from the simulations with a uniform reionization.
Figure 13 shows that modifying the models to account for patchy reionization mainly affects the likelihood of . While WDM cosmologies are still preferred over CDM when fitting the non-uniform UVB models, the likelihood shifts to higher values of compared to the result from uniform UVB models. An inclination for models with reduced free-streaming compensates for the reduction of small-scale due to patchy reionization. In this case the maximum likelihood occurs at and the lower limit at 95% level is at . Notably, for the patchy UVB models, the CDM cosmology is contained within the 95% interval of the likelihood distribution.
We note that the difference between the observed and model defined as (see § IV.2 is larger for the nonuniform UVB modified best-fit models compared to the best-fit models sampling from the uniform UVB simulated . When fitting with measured directly from the uniform UVB simulations, we measure for the best-fit model with and a slightly higher for the CDM best-fit model. On the other hand, when sampling over the modified to account for patchy reionization, we measure larger values and for the WDM and CDM best-fit models, respectively. The higher values of obtained for the patchy reionization modified models show that, in the context of this work, measured directly from the uniform UVB simulations provide a better match to the observation from [1], therefore we use the likelihood distribution obtained from the sampling over the uniform UVB models to construct the main results from our analysis.
VI Conclusions
To constrain cosmological models where dark matter free-streaming smooths the matter distribution in the Universe, we have used the GPU-native code Cholla to perform a massive suite of high-resolution hydrodynamical cosmological simulations that simultaneously vary the effect of free-streaming from WDM particles and the IGM reionization history. We compare the power spectrum of the synthetic Lyman- forest from our simulations to the high-resolution observational measurement presented by [1] to determine via a likelihood analysis the optimal model for cosmological free-streaming that best matches the observation. A summary of the efforts and conclusions from this work follows.
-
•
We present the WDM-CHIPS suite consisting of a grid of 1080 high-resolution simulations (, ) that vary the free-streaming from WDM cosmologies and the photoionization and photoheating rates from the metagalactic UVB. The UVB rates applied for our grid use the model from [24] as a template, and use three parameters that control a rescaling amplitude and redshift-timing of the hydrogen photoionization and photoheating rates. Combined with the WDM particle mass , our four-dimensional grid of models densely sample a wide range of self-consistently evolved reionization and thermal histories of the IGM. This represents a significant improvement over previous studies that aimed to constrain WDM cosmologies from observations of the Lyman- forest [33, 14, 20, 16, 17].
-
•
The large range of thermal histories produced by the different UVB models in our grid of simulations results in synthetic measurements of Lyman- spectra where the impact from Doppler broadening and pressure smoothing on suppressing the small-scale varies widely. This flexibility is important as these mechanisms have similar effects as free-streaming decreasing small-scale fluctuations in the Lyman- forest. Additionally, our approach does not require an assumption of a power-law relation for the density-temperature distribution of the gas. Self-consistent evolution of the IGM phase structure proves to be important as we find that a single power law does not accurately describe the distribution in the density range relevant to generating the signal of the Lyman- forest (see Appendix E of [24]).
-
•
We compare our grid of models to the high-redshift () observational measurement of the Lyman- forest power spectrum from [1]. The observations presented in [1] provide the highest resolution measurement of at the time that work was executed. We perform a Bayesian MCMC sampling to determine the best-fit model for free-streaming due to WDM cosmologies and the IGM photoionization and photoheating history.
-
•
From our MCMC analysis, we find that a cosmological model with non-vanishing free-streaming is preferred over CDM. The likelihood function peaks at the thermal relic mass of and a we measure a lower limit of at the 95% CL. We find a weak () preference for WDM over CDM, but both are statistically consistent with the currently available data.
-
•
We repeat our MCMC analysis, restricting to CDM only but with a variable UVB. We find that the best-fit CDM model mainly differs from the WDM optimal model in that the IGM temperatures are slightly lower (%) for the WDM case. We find that both thermal histories are in good agreement with the inference from [25] at and moderately higher than the temperatures from [1] at .
-
•
We introduce the effect of a patchy reionization in our models by modifying from our uniform UVB simulations according to the prescription presented in [45]. The likelihood distribution from our MCMC approach using the modified shows that the preference for a WDM cosmology is maintained but the distribution shifts to higher values of . The maximum likelihood and the 95% lower limit constraint are and , respectively. Additionally, the CDM case is consistent with the best-fit WDM model when accounting for an inhomogeneous UVB. Notably, the different between the observed and best-fit model is higher for the modified model to account for a nonuniform UVB, and we therefore use the likelihood distribution obtained from the uniform UVB models as the basis for our results.
Acknowledgements.
This research used resources of the Oak Ridge Leadership Computing Facility at the Oak Ridge National Laboratory, which is supported by the Office of Science of the U.S. Department of Energy under Contract DE-AC05-00OR22725, using Summit allocations AST169 and AST175. An award of computer time was provided by the INCITE program, via project AST175. We acknowledge use of the lux supercomputer at UC Santa Cruz, funded by NSF MRI grant AST1828315, and support from NASA TCAN grant 80NSSC21K0271. B.V. is supported in part by the UC MEXUS-CONACyT doctoral fellowship. B.E.R. acknowledges support from NASA contract NNG16PJ25C and grants 80NSSC18K0563 and 80NSSC22K0814. E.E.S. acknowledges support from NASA grant 80NSSC22K0720 and STScI grant HST-AR-16633.001-A. We wish to thank Nick Gnedin and Avery Meiksin for many useful inputs and valuable discussions.References
- Boera et al. [2019] E. Boera, G. D. Becker, J. S. Bolton, and F. Nasir, Revealing Reionization with the Thermal History of the Intergalactic Medium: New Constraints from the Ly Flux Power Spectrum, ApJ 872, 101 (2019), arXiv:1809.06980 [astro-ph.CO] .
- Planck Collaboration et al. [2020a] Planck Collaboration, N. Aghanim, Y. Akrami, M. Ashdown, J. Aumont, C. Baccigalupi, and et al., Planck 2018 results. VI. Cosmological parameters, A&A 641, A6 (2020a), arXiv:1807.06209 [astro-ph.CO] .
- Chabanier et al. [2019] S. Chabanier, M. Millea, and N. Palanque-Delabrouille, Matter power spectrum: from Ly forest to CMB scales, MNRAS 489, 2247 (2019), arXiv:1905.08103 [astro-ph.CO] .
- Colín et al. [2000] P. Colín, V. Avila-Reese, and O. Valenzuela, Substructure and Halo Density Profiles in a Warm Dark Matter Cosmology, ApJ 542, 622 (2000), arXiv:astro-ph/0004115 [astro-ph] .
- Avila-Reese et al. [2001] V. Avila-Reese, P. Colín, O. Valenzuela, E. D’Onghia, and C. Firmani, Formation and Structure of Halos in a Warm Dark Matter Cosmology, ApJ 559, 516 (2001), arXiv:astro-ph/0010525 [astro-ph] .
- Feng [2010] J. L. Feng, Dark Matter Candidates from Particle Physics and Methods of Detection, ARA&A 48, 495 (2010), arXiv:1003.0904 [astro-ph.CO] .
- Bullock and Boylan-Kolchin [2017a] J. S. Bullock and M. Boylan-Kolchin, Small-Scale Challenges to the CDM Paradigm, ARA&A 55, 343 (2017a), arXiv:1707.04256 [astro-ph.CO] .
- Bode et al. [2001] P. Bode, J. P. Ostriker, and N. Turok, Halo Formation in Warm Dark Matter Models, ApJ 556, 93 (2001), arXiv:astro-ph/0010389 [astro-ph] .
- Hernquist et al. [1996] L. Hernquist, N. Katz, D. H. Weinberg, and J. Miralda-Escudé, The Lyman-Alpha Forest in the Cold Dark Matter Model, ApJ 457, L51 (1996), arXiv:astro-ph/9509105 [astro-ph] .
- Croft et al. [1998] R. A. C. Croft, D. H. Weinberg, N. Katz, and L. Hernquist, Recovery of the Power Spectrum of Mass Fluctuations from Observations of the Ly Forest, ApJ 495, 44 (1998), arXiv:astro-ph/9708018 [astro-ph] .
- Meiksin [2009] A. A. Meiksin, The physics of the intergalactic medium, Reviews of Modern Physics 81, 1405 (2009), arXiv:0711.3358 [astro-ph] .
- McQuinn [2016] M. McQuinn, The Evolution of the Intergalactic Medium, ARA&A 54, 313 (2016), arXiv:1512.00086 [astro-ph.CO] .
- Seljak et al. [2006] U. Seljak, A. Makarov, P. McDonald, and H. Trac, Can sterile neutrinos be the dark matter?, Phys. Rev. Lett. 97, 191303 (2006).
- Viel et al. [2013] M. Viel, G. D. Becker, J. S. Bolton, and M. G. Haehnelt, Warm dark matter as a solution to the small scale crisis: New constraints from high redshift Lyman- forest data, Phys. Rev. D 88, 043502 (2013), arXiv:1306.2314 [astro-ph.CO] .
- Baur et al. [2016] J. Baur, N. Palanque-Delabrouille, C. Yèche, C. Magneville, and M. Viel, Lyman-alpha forests cool warm dark matter, J. Cosmology Astropart. Phys 2016, 012 (2016), arXiv:1512.01981 [astro-ph.CO] .
- Garzilli et al. [2019] A. Garzilli, A. Magalich, T. Theuns, C. S. Frenk, C. Weniger, O. Ruchayskiy, and A. Boyarsky, The Lyman- forest as a diagnostic of the nature of the dark matter, MNRAS 489, 3456 (2019), arXiv:1809.06585 [astro-ph.CO] .
- Garzilli et al. [2021] A. Garzilli, A. Magalich, O. Ruchayskiy, and A. Boyarsky, How to constrain warm dark matter with the Lyman- forest, MNRAS 502, 2356 (2021).
- Bullock and Boylan-Kolchin [2017b] J. S. Bullock and M. Boylan-Kolchin, Small-Scale Challenges to the CDM Paradigm, ARA&A 55, 343 (2017b), arXiv:1707.04256 [astro-ph.CO] .
- Lukić et al. [2015] Z. Lukić, C. W. Stark, P. Nugent, M. White, A. A. Meiksin, and A. Almgren, The Lyman forest in optically thin hydrodynamical simulations, MNRAS 446, 3697 (2015), arXiv:1406.6361 [astro-ph.CO] .
- Iršič et al. [2017] V. Iršič, M. Viel, M. G. Haehnelt, J. S. Bolton, S. Cristiani, G. D. Becker, V. D’Odorico, G. Cupani, T.-S. Kim, T. A. M. Berg, S. López, S. Ellison, L. Christensen, K. D. Denney, and G. Worseck, New constraints on the free-streaming of warm dark matter from intermediate and small scale Lyman- forest data, Phys. Rev. D 96, 023522 (2017), arXiv:1702.01764 [astro-ph.CO] .
- Bolton et al. [2017] J. S. Bolton, E. Puchwein, D. Sijacki, M. G. Haehnelt, T.-S. Kim, A. Meiksin, J. A. Regan, and M. Viel, The Sherwood simulation suite: overview and data comparisons with the Lyman forest at redshifts 2 z 5, MNRAS 464, 897 (2017), arXiv:1605.03462 [astro-ph.CO] .
- Walther et al. [2021] M. Walther, E. Armengaud, C. Ravoux, N. Palanque-Delabrouille, C. Yèche, and Z. Lukić, Simulating intergalactic gas for DESI-like small scale Lyman forest observations, J. Cosmology Astropart. Phys 2021, 059 (2021), arXiv:2012.04008 [astro-ph.CO] .
- Villasenor et al. [2021a] B. Villasenor, B. Robertson, P. Madau, and E. Schneider, Effects of Photoionization and Photoheating on Ly Forest Properties from Cholla Cosmological Simulations, ApJ 912, 138 (2021a), arXiv:2009.06652 [astro-ph.CO] .
- Villasenor et al. [2021b] B. Villasenor, B. Robertson, P. Madau, and E. Schneider, Inferring the Thermal History of the Intergalactic Medium from the Properties of the Hydrogen and Helium Lyman-alpha Forest, arXiv e-prints , arXiv:2111.00019 (2021b), arXiv:2111.00019 [astro-ph.CO] .
- Gaikwad et al. [2020] P. Gaikwad, M. Rauch, M. G. Haehnelt, E. Puchwein, J. S. Bolton, L. C. Keating, G. Kulkarni, V. Iršič, E. Bañados, G. D. Becker, E. Boera, F. S. Zahedy, H.-W. Chen, R. F. Carswell, J. Chardin, and A. Rorai, Probing the thermal state of the intergalactic medium at z > 5 with the transmission spikes in high-resolution Ly forest spectra, MNRAS 494, 5091 (2020), arXiv:2001.10018 [astro-ph.CO] .
- Hui et al. [1997] L. Hui, N. Y. Gnedin, and Y. Zhang, The Statistics of Density Peaks and the Column Density Distribution of the Ly Forest, ApJ 486, 599 (1997), arXiv:astro-ph/9608157 [astro-ph] .
- Gnedin and Hui [1998] N. Y. Gnedin and L. Hui, Probing the Universe with the Lyalpha forest - I. Hydrodynamics of the low-density intergalactic medium, MNRAS 296, 44 (1998), arXiv:astro-ph/9706219 [astro-ph] .
- Gnedin et al. [2003] N. Y. Gnedin, E. J. Baker, T. J. Bethell, M. M. Drosback, A. G. Harford, A. K. Hicks, A. G. Jensen, B. A. Keeney, C. M. Kelso, M. C. Neyrinck, S. E. Pollack, and T. P. van Vliet, Linear Gas Dynamics in the Expanding Universe, ApJ 583, 525 (2003), arXiv:astro-ph/0206421 [astro-ph] .
- Peeples et al. [2010] M. S. Peeples, D. H. Weinberg, R. Davé, M. A. Fardal, and N. Katz, Pressure support versus thermal broadening in the Lyman forest - I. Effects of the equation of state on longitudinal structure, MNRAS 404, 1281 (2010), arXiv:0910.0256 [astro-ph.CO] .
- Kulkarni et al. [2015] G. Kulkarni, J. F. Hennawi, J. Oñorbe, A. Rorai, and V. Springel, Characterizing the Pressure Smoothing Scale of the Intergalactic Medium, ApJ 812, 30 (2015), arXiv:1504.00366 [astro-ph.CO] .
- Nasir et al. [2016] F. Nasir, J. S. Bolton, and G. D. Becker, Inferring the IGM thermal history during reionization with the Lyman forest power spectrum at redshift z = 5, MNRAS 463, 2335 (2016), arXiv:1605.04155 [astro-ph.CO] .
- Gnedin and Hamilton [2002] N. Y. Gnedin and A. J. S. Hamilton, Matter power spectrum from the Lyman-alpha forest: myth or reality?, MNRAS 334, 107 (2002), arXiv:astro-ph/0111194 [astro-ph] .
- Viel et al. [2005] M. Viel, J. Lesgourgues, M. G. Haehnelt, S. Matarrese, and A. Riotto, Constraining warm dark matter candidates including sterile neutrinos and light gravitinos with WMAP and the Lyman- forest, Phys. Rev. D 71, 063534 (2005), arXiv:astro-ph/0501562 [astro-ph] .
- Schneider and Robertson [2015] E. E. Schneider and B. E. Robertson, CHOLLA: A New Massively Parallel Hydrodynamics Code for Astrophysical Simulation, ApJS 217, 24 (2015), arXiv:1410.4194 [astro-ph.IM] .
- Smith et al. [2017] B. D. Smith, G. L. Bryan, S. C. O. Glover, N. J. Goldbaum, M. J. Turk, J. Regan, J. H. Wise, H.-Y. Schive, T. Abel, A. Emerick, B. W. O’Shea, P. Anninos, C. B. Hummels, and S. Khochfar, GRACKLE: a chemistry and cooling library for astrophysics, MNRAS 466, 2217 (2017), arXiv:1610.09591 [astro-ph.CO] .
- Hahn and Abel [2011] O. Hahn and T. Abel, Multi-scale initial conditions for cosmological simulations, MNRAS 415, 2101 (2011), arXiv:1103.6031 [astro-ph.CO] .
- Macciò et al. [2013] A. V. Macciò, O. Ruchayskiy, A. Boyarsky, and J. C. Muñoz-Cuartas, The inner structure of haloes in cold+warm dark matter models, MNRAS 428, 882 (2013), arXiv:1202.2858 [astro-ph.CO] .
- Puchwein et al. [2019] E. Puchwein, F. Haardt, M. G. Haehnelt, and P. Madau, Consistent modelling of the meta-galactic UV background and the thermal/ionization history of the intergalactic medium, MNRAS 485, 47 (2019), arXiv:1801.04931 [astro-ph.GA] .
- Bolton et al. [2014] J. S. Bolton, G. D. Becker, M. G. Haehnelt, and M. Viel, A consistent determination of the temperature of the intergalactic medium at redshift z = 2.4, MNRAS 438, 2499 (2014), arXiv:1308.4411 [astro-ph.CO] .
- Hiss et al. [2018] H. Hiss, M. Walther, J. F. Hennawi, J. Oñorbe, J. M. O’Meara, A. Rorai, and Z. Lukić, A new measurement of the temperature–density relation of the IGM from voigt profile fitting, The Astrophysical Journal 865, 42 (2018).
- Walther et al. [2019] M. Walther, J. Oñorbe, J. F. Hennawi, and Z. Lukić, New Constraints on IGM Thermal Evolution from the Ly Forest Power Spectrum, ApJ 872, 13 (2019), arXiv:1808.04367 [astro-ph.CO] .
- Gaikwad et al. [2021] P. Gaikwad, R. Srianand, M. G. Haehnelt, and T. R. Choudhury, A consistent and robust measurement of the thermal state of the IGM at 2 z 4 from a large sample of Ly forest spectra: evidence for late and rapid He II reionization, MNRAS 506, 4389 (2021), arXiv:2009.00016 [astro-ph.CO] .
- Planck Collaboration et al. [2020b] Planck Collaboration, N. Aghanim, Y. Akrami, M. Ashdown, J. Aumont, C. Baccigalupi, M. Ballardini, A. J. Banday, R. B. Barreiro, N. Bartolo, S. Basak, R. Battye, K. Benabed, J. P. Bernard, M. Bersanelli, P. Bielewicz, J. J. Bock, J. R. Bond, J. Borrill, F. R. Bouchet, F. Boulanger, M. Bucher, C. Burigana, R. C. Butler, E. Calabrese, J. F. Cardoso, J. Carron, A. Challinor, H. C. Chiang, J. Chluba, L. P. L. Colombo, C. Combet, D. Contreras, B. P. Crill, F. Cuttaia, P. de Bernardis, G. de Zotti, J. Delabrouille, J. M. Delouis, E. Di Valentino, J. M. Diego, O. Doré, M. Douspis, A. Ducout, X. Dupac, S. Dusini, G. Efstathiou, F. Elsner, T. A. Enßlin, H. K. Eriksen, Y. Fantaye, M. Farhang, J. Fergusson, R. Fernandez-Cobos, F. Finelli, F. Forastieri, M. Frailis, A. A. Fraisse, E. Franceschi, A. Frolov, S. Galeotta, S. Galli, K. Ganga, R. T. Génova-Santos, M. Gerbino, T. Ghosh, J. González-Nuevo, K. M. Górski, S. Gratton, A. Gruppuso, J. E. Gudmundsson, J. Hamann, W. Handley, F. K. Hansen, D. Herranz, S. R. Hildebrandt, E. Hivon, Z. Huang, A. H. Jaffe, W. C. Jones, A. Karakci, E. Keihänen, R. Keskitalo, K. Kiiveri, J. Kim, T. S. Kisner, L. Knox, N. Krachmalnicoff, M. Kunz, H. Kurki-Suonio, G. Lagache, J. M. Lamarre, A. Lasenby, M. Lattanzi, C. R. Lawrence, M. Le Jeune, P. Lemos, J. Lesgourgues, F. Levrier, A. Lewis, M. Liguori, P. B. Lilje, M. Lilley, V. Lindholm, M. López-Caniego, P. M. Lubin, Y. Z. Ma, J. F. Macías-Pérez, G. Maggio, D. Maino, N. Mandolesi, A. Mangilli, A. Marcos-Caballero, M. Maris, P. G. Martin, M. Martinelli, E. Martínez-González, S. Matarrese, N. Mauri, J. D. McEwen, P. R. Meinhold, A. Melchiorri, A. Mennella, M. Migliaccio, M. Millea, S. Mitra, M. A. Miville-Deschênes, D. Molinari, L. Montier, G. Morgante, A. Moss, P. Natoli, H. U. Nørgaard-Nielsen, L. Pagano, D. Paoletti, B. Partridge, G. Patanchon, H. V. Peiris, F. Perrotta, V. Pettorino, F. Piacentini, L. Polastri, G. Polenta, J. L. Puget, J. P. Rachen, M. Reinecke, M. Remazeilles, A. Renzi, G. Rocha, C. Rosset, G. Roudier, J. A. Rubiño-Martín, B. Ruiz-Granados, L. Salvati, M. Sandri, M. Savelainen, D. Scott, E. P. S. Shellard, C. Sirignano, G. Sirri, L. D. Spencer, R. Sunyaev, A. S. Suur-Uski, J. A. Tauber, D. Tavagnacco, M. Tenti, L. Toffolatti, M. Tomasi, T. Trombetti, L. Valenziano, J. Valiviita, B. Van Tent, L. Vibert, P. Vielva, F. Villa, N. Vittorio, B. D. Wandelt, I. K. Wehus, M. White, S. D. M. White, A. Zacchei, and A. Zonca, Planck 2018 results. VI. Cosmological parameters, A&A 641, A6 (2020b), arXiv:1807.06209 [astro-ph.CO] .
- de Belsunce et al. [2021] R. de Belsunce, S. Gratton, W. Coulton, and G. Efstathiou, Inference of the optical depth to reionization from low multipole temperature and polarization Planck data, MNRAS 507, 1072 (2021), arXiv:2103.14378 [astro-ph.CO] .
- Molaro et al. [2022] M. Molaro, V. Iršič, J. S. Bolton, L. C. Keating, E. Puchwein, P. Gaikwad, M. G. Haehnelt, G. Kulkarni, and M. Viel, The effect of inhomogeneous reionization on the Lyman forest power spectrum at redshift z ¿ 4: implications for thermal parameter recovery, MNRAS 509, 6119 (2022), arXiv:2109.06897 [astro-ph.CO] .
- DESI Collaboration et al. [2016] DESI Collaboration, A. Aghamousa, J. Aguilar, S. Ahlen, S. Alam, L. E. Allen, C. Allende Prieto, J. Annis, S. Bailey, and C. Balland, The DESI Experiment Part I: Science,Targeting, and Survey Design, arXiv e-prints , arXiv:1611.00036 (2016), arXiv:1611.00036 [astro-ph.IM] .
- Pieri et al. [2016] M. M. Pieri, S. Bonoli, J. Chaves-Montero, I. Pâris, M. Fumagalli, J. S. Bolton, M. Viel, P. Noterdaeme, J. Miralda-Escudé, N. G. Busca, H. Rahmani, C. Peroux, A. Font-Ribera, and S. C. Trager, WEAVE-QSO: A Massive Intergalactic Medium Survey for the William Herschel Telescope, in SF2A-2016: Proceedings of the Annual meeting of the French Society of Astronomy and Astrophysics, edited by C. Reylé, J. Richard, L. Cambrésy, M. Deleuil, E. Pécontal, L. Tresse, and I. Vauglin (2016) pp. 259–266, arXiv:1611.09388 [astro-ph.CO] .
- Amiaux et al. [2012] J. Amiaux, R. Scaramella, Y. Mellier, B. Altieri, C. Burigana, A. Da Silva, P. Gomez, J. Hoar, R. Laureijs, E. Maiorano, D. Magalhães Oliveira, F. Renk, G. Saavedra Criado, I. Tereno, J. L. Auguères, J. Brinchmann, M. Cropper, L. Duvet, A. Ealet, P. Franzetti, B. Garilli, P. Gondoin, L. Guzzo, H. Hoekstra, R. Holmes, K. Jahnke, T. Kitching, M. Meneghetti, W. Percival, and S. Warren, Euclid mission: building of a reference survey, in Space Telescopes and Instrumentation 2012: Optical, Infrared, and Millimeter Wave, Society of Photo-Optical Instrumentation Engineers (SPIE) Conference Series, Vol. 8442, edited by M. C. Clampin, G. G. Fazio, H. A. MacEwen, and J. Oschmann, Jacobus M. (2012) p. 84420Z, arXiv:1209.2228 [astro-ph.IM] .
- Wu et al. [2019] X. Wu, M. McQuinn, R. Kannan, A. D’Aloisio, S. Bird, F. Marinacci, R. Davé, and L. Hernquist, Imprints of temperature fluctuations on the z 5 Lyman- forest: a view from radiation-hydrodynamic simulations of reionization, MNRAS 490, 3177 (2019), arXiv:1907.04860 [astro-ph.CO] .