A multiscale and multiphysics framework to simulate radiation damage in nano-crystalline materials
Abstract
This work presents a multiscale and multiphysics framework to investigate the radiation-induced damage in nano-crystalline materials. The framework combines two methodologies, including molecular dynamics simulations with electronic effects and long-term atomistic diffusion simulations in nano-crystalline materials. Using this framework, we investigated nano-crystalline materials’ self-healing behavior under radiation events. We found that the number of defects generated in nano-crystals during the cascade simulations was less than in single crystals. This behavior was due to the fast absorption of interstitial atoms in the grain boundary network during the cascade simulations, while vacancies migrated to the boundaries in a much longer time scale than interstitial atoms. Thus, nano-crystalline materials showed a self-healing behavior where the number and size of the defects are drastically reduced with time. We found that the self-healing behavior of nano-crystalline materials is limited, and about 50% of vacancies survived. This effect resulted from clusters of vacancies’ collective behavior, which are much more stable than individual vacancies.
keywords:
T-MD , electronic heat conduction , long-term diffusion , radiation , nano-crystalline materials , nickel , molecular dynamics , mutiscale and multiphysics simulations.1 Introduction
Understanding and predicting the behavior of materials under radiation environments is paramount for a wide range of industrial applications, including next-generation of nuclear plants, especially as the world is transitioning in more environmentally friendly ways to generate energy [1, 2, 3, 4]. In space missions, radiation also plays an important role in determining the life of electronic components, and thus, developing materials with improving shielding capabilities is also of interest [5]. Materials subjected to radiation environments experience a large spectrum of microstructural changes, impacting the mechanical properties of these materials over time. The processes involved in radiation-induced damage can span multiple length and time scales and are thus inherently multiscale and hierarchical [6]. Radiation-induced damage manifests in the generation of Frenkel pair of vacancies and self-interstitial atoms (SIAs) and clusters formed from the combination of these defects. The interactions of such radiation-induced defects through migration, recombination, and annihilation dictate the degree of damage over time. The accumulation of the radiation-induced damage causes severe microstructural changes that result in mechanical degradation of the material in the form of hardening, swelling, and embrittlement [7]. Hence, understanding and predicting the evolution of defect clusters during radiation events is of utmost importance to design effective radiation-resistant materials. The limitations of experimental techniques require developing numerical models and simulations to understand the atomistic mechanisms of the induced radiation defects and mitigate the adverse effects of radiation-induced defects.
Due to the rapid development of successes during primary cascade events that could span from a few femtoseconds (fs) to nanoseconds (ns), the in-situ characterization of these events is highly challenging. This issue makes modeling techniques, especially molecular dynamics (MD) simulations, the preferred method to understand the fundamental aspects of radiation damage in materials. Several MD studies have helped to understand the atomistic mechanisms during the cascade damage process in many materials, including metals and multicomponent alloys [8, 9], semiconductors [10], and others materials [11]. MD simulations have also been used as the primary tool to understand damage mechanisms in radiation environments. Remarkably, nano-crystalline (NC) materials were studied extensively using MD simulations due to their improved radiation resistance compared to the bulk counterparts [12, 13, 14]. In NC materials, the high misorientation angle grain boundaries (GBs) act as a trap for defects resulting from irradiation [15]. This effect has been evident in several studies where the damage due to irradiation decreased when the grain size was decreased [16, 17]. For instance, the density of stacking fault tetrahedra (SFT) was reported much lower in the nano-crystalline materials compared to the coarser-grained material [18]. Moreover, the presence of high misorientation angle GBs results in thermal unsuitability of the radiation-induced defects in gold, palladium, and zirconium oxide [19, 20].
One possible explanation for such ability of GBs to alleviate radiation-induced defects in NC materials is that the high density of grain boundaries provides a high sink to annihilate the defects clusters. It has been shown that point-defects diffusion becomes easier in the interstitial-loaded GBs than in clean boundaries [21, 22]. Most MD simulations have predicted that a single GB can accommodate multiple cascades without a substantial decrease in the sink efficiency and will outperform a single crystal of the same composition with regards to radiation tolerance [23]. Another suggested mechanism is the faster migration of self interstitial atoms (SIAs) than vacancies’ migration velocity towards the GBs. This faster diffusion of interstitials creates a bulk rich of vacancies and a GB network full of SIAs. Eventually, vacancies migrate in a much slower time scale compared to SIAs, and these two types of defect recombine [21]. MD has also helped elucidate the mechanism of defects formation as it has been shown that SFT forms due to the agglomeration of the vacancy clusters via the classical Silcox and Hirsch mechanism [24, 25].
Although classical MD has proven to be a powerful tool to model the primary cascade damage process, one drawback stems from the inability to model the electronic effects, which are essential for heat transport [26]. In materials, heat is carried out by phonons and electrons and, in metals, electrons are the primary heat carriers, representing up to 95% of the total heat conductivity [27, 28]. In classical MD, phonons are explicitly resolved; hence their contribution to the system’s temperature and conductivity is included. However, the electronic effects are not considered in traditional MD, limiting the applicability of MD to radiation simulations of low energy. Radiation damage problems may involve a considerable heat exchange between phonons and electrons, especially when the primary knock-on atom (PKA) energy is high [29, 30], deeming traditional MD results inaccurate.
The two-temperature molecular dynamics (2T-MD) models [31, 32] were developed to account for the electronic temperature effects, which are absent in classical MD. Due to the importance of electronic effects during cascade damage, several 2T-MD implementations have proliferated in the recent years [33, 34, 35, 36, 37, 38, 39, zarkadoula2018effects]. In the 2T-MD method, an electronic subsystem is modeled using a classical Fourier law to describe heat transport by the electrons. The electronic model is then coupled to the phonons in MD via a classical (e.g., non-quantum) relationship. This model can be implemented using various basis sets, including finite difference (FD) and finite element (FE) methods. In either of those approaches, the system of atoms is divided into small cells (usually called voxel), and the Laplacian of the electronic temperature required to compute heat diffusion is explicitly evaluated. Several numerical drawbacks exist with these approaches as they required the MD system to be discretized into elements to evaluate the Laplacian by recourse of a mesh. However, MD is a meshless method, and the introduction of this mesh makes the implementation seamed and laborious. At the same time, the discretization of the system in small voxels hampers the resolution of large temperature gradients during the PKA. Practically speaking, the size of these voxels has to be reduced significantly to represent the temperature gradients accurately. As a result, these voxels contain a hand full of atoms. An alternative approach preserving the true meshless nature of MD was proposed by Ullah et al. and called 2T-MD method [37]. In 2T-MD, a Fokker-Plank equation is used to describe the energy exchange between electrons associated with atomic sites [40]. The Fokker-Plank equation computes the probability that two near electronic sites exchange energy due to temperature differences. By taking a long-wave behavior, it can be calibrated such that the energy time-evolution and energy exchange match precisely the Fourier law [40]. Thus, the use of the Fokker-Plank on top of MD allows the full atomic resolution in MD, which translates into the ability to simulate the large temperature gradients between two neighboring atoms.
Another significant disadvantage of MD is its inability to simulate long-term diffusion of defects. For instance, after forming defect clusters during the primary radiation damage, those defects interact with each other and with the GBs through thermal fluctuations and the defect’s long-range elastic stress field. The defects’ long-term diffusion controls the damage induced in the material and consequently is of great importance in engineering applications [41]. Classical MD is unable to model these long-term processes since the time scale of these events ranges from a few nanoseconds to a few seconds or more [42]. In order to remedy this limitation, several attempts have been made to extend the time scale accessible by MD, for example, the Hyperdynamics [43], Temperature Accelerated Dynamics [44], and Parallel Replica Dynamics approach [45] are some examples to mention but a few. While these methods are helpful for many applications, the number of atoms that can be modeled and the number of state transition events tracked down are limited. In order to overcome these challenges, several techniques have been developed, including kinetic Monte-Carlo (KMC) techniques [46, 47, 48], and phase-field approaches [49, 50] which were successful in simulating the defects evolution. These methods work best for interfaces with relatively regular, ordered structures and are therefore of limited utility for non-coherent interfaces containing disordered regions, which is the case for NC materials. Furthermore, diffusive molecular dynamics (DMD) based on the Maximum entropy principle method (MXE) [51, 52, 53, 54, 55] and mean-field theory has been proven to be a valuable framework to simulate the time evolution of multiple vacancies and other defects. An appealing approach of DMD is that it can be calibrated to macroscopic diffusion data of NC materials without the need to have prior knowledge of specific transition paths in these structures.
The motivation of this study is to present a (temporal) multiscale and multiphysics framework to simulate radiation damage in nano-crystalline materials. The rapid energy exchange between phonons, electrons, and PKA are described with the 2T-MD method that allows us to include electronic effects in MD. Using Ni as representative material, we investigated when the electronic effects become essential in radiation damage of materials, and compare single crystals vs. nano-crystalline cells. To complete the description of radiation damage in nano-crystalline materials, we studied the long-term diffusion of defects using the MXE method [55]. We found that vacancies resting in the bulk of nanograins after the cascade simulations are absorbed by the GBs due to a combined effect of thermal excitations, differences in the chemical gradient, and long-range elastic effects generated by the defects. As a results, around of the vacancies generated during the PKA event were annihilated at the grain boundaries, suggesting a self-healing behavior of NC materials under radiation damage.
The paper is organized as follows. First, in Section 2.3, we present the 2T-MD and MXE methodology to investigate electronic effects and the long-term behavior of materials. Next, in Section 3, we present the main results of the work. We start by comparing traditional MD with 2T-MD in bulk and NC samples. Then, we proceed to simulate the long-term behavior of the NC materials using MXE. The spatial-temporal evolution of defects is then described for time scales as long as seven days ( hrs). These results are then discussed in Section 4, and the manuscript is closed with the main conclusions in Section 5.
2 Methods
2.1 2T-MD method
Here, we describe the 2T-MD method used to include electronic effects in MD. Consider a system of atoms at finite temperature . The two-temperature model assumes that the temperature field of this system can be separated into two interacting subsystems, e.g., phonons (lattice) and electrons. The lattice temperature of the th atom is denoted as and its associated electronic temperature as . has the classical definition of , where is the kinetic energy of all atoms, and are the mass and the modulus of the thermal velocity of the th atom, respectively, and is Boltzmann’s constant. Following Ullah and Ponga [37], is assumed to fluctuate from atom to atom, and it represents the collective contribution to the electronic temperature of many electrons surrounding the th atom.
Furthermore, 2T-MD evolves the local electronic temperature according to the following master equation [37, 40]
| (1) |
where is a pair-wise exchange rate thermal coefficient for the electronic temperature between the th and th atoms whose value is defined in the sequel. is the normalized electronic temperature field for the th atom, is normalized difference in the electronic temperature between the th and th atoms. is an arbitrary maximum temperature value used to map . is the electronic heat capacity, and is the material’s electron-phonon constant that defines the strength of the coupling between the lattice and electronic subsystems. represents the lattice temperature computed using a cluster of atoms that surrounds the th atom. The cluster is generated using a cutoff radius that is taken equal to the cutoff of the interatomic potential for convenience.
The pair-wise thermal exchange rate thermal coefficient can be computed using the experimentally characterized material’s thermal diffusivity (, where is the thermal conductivity of the material, its density, and the heat capacity at constant pressure) [37, 40]
| (2) |
where is the dimension of the problem and is the coordination number of the pristine lattice. Since depends on the temperature, so do and . Temperature dependence of and is calculated using simple linear relation of , and where is thermal conductivity at K [56]. At each time step and are calculated using mean electronic and lattice temperature of the system. Looking closely at Eq. 1, the first term on the right-hand side measures the rate of electronic energy exchanged between two adjacent particles, and it is arbitrarily selected to be around the nearest neighbors of the th particle, which makes the model local. The second term on the right-hand side is a linear coupling term between the electrons and phonons, which calculates the amount of energy exchanged between lattice and electronic subsystems. This amount of energy has to be introduced(removed) into(from) the lattice by modifying the MD equation of motion by including a damping force . The modified equation of motion is
| (3) |
where is the acceleration vector of the th atom, is the force acting on th atom due to the interatomic interactions, and is the damping force that appears due to the lattice heating (cooling) coming from the electronic temperature. is a coupling coefficient of the th atom whose strength is to be computed at each time step. The rate of work (power) done by the damping force is given by
| (4) |
The work rate at the th atom has to be balanced with the amount of energy exchange by the electronic temperature per unit of time. Letting be the average atomic volume, the energy exchange between the lattice and the th atom is
| (5) |
It is easy to see that has to be computed at each time step to conserve energy in the system due to the energy exchange between the electrons and the phonons. The rate work done by the damping force has to be equal to the amount of energy exchange by the electrons in Eq. 5 leading to
| (6) |
where is the local kinetic energy of th atom. We notice that the quantity could be instantaneously zero at specific time steps leading to instabilities in the simulation, as the coupling coefficient will tend to infinity. This issue appears because the work done by the damping force tends to zero, and thus, even if is large, it cannot accommodate this situation, ultimately affecting the system’s stability. In order to avoid these numerical instabilities, we opted for avoiding energy exchange between phonons and electrons when at the th atom, where is a tolerance of eV. This simple solution works well and does not affect the thermal behavior of the system. The parameters used in the T-MD model for Ni are specified in Table 1.
| Material property | Value | Units | Ref. |
|---|---|---|---|
| Wm-3K-1 | [30] | ||
| Jm-3K-2 | [30] | ||
| Wm-1K-1 | [56] | ||
| kgm-3 | [37] | ||
| JK-1kg-1 | [37] | ||
| eV | [57] | ||
| eV | [57] | ||
| THz-1 | [58] |
2.2 Long-term diffusion
After simulating the defects formed during the cascade damage, it is now required to simulate the long-term diffusion of the defects. The diffusion of defects, especially vacancies, is dominated by two factors that are material-dependent. In crystalline materials, the probability that a vacancy will migrate from one atomic site to another per unit time can be modeled using an Arrhenius law, i.e.,
| (7) |
where is an attempt frequency (with units of inverse time, i.e., [time-1]) and is the free-energy barrier that the vacancy has to overcome in order to move from one site to another. is the usual thermodynamic factor. In most crystalline materials, , and vacancy migration is a slow process compared to the dynamics of the atoms in the material. Thus, simulation of vacancy migration is often referred as to rare event in MD simulations beside being a common phenomenon in materials [43, 44, 45, 46, 47, 49, 50].
In order to endeavor to simulate vacancy and interstitial diffusion in non-crystalline materials, we now briefly describe the maximum entropy principle method (MXE) [52, 55] that was used to simulate the long term diffusion process. The central assumption of MXE is that the diffusion process’s temporal scale is much larger than the characteristic time of the atoms’ dynamics. Consequently, the microscopic state variables such as the particle’s instantaneous position and its occupancy of a lattice site can be treated as random variables. The method’s main idea is to supply the driving forces for state transition through a non-equilibrium statistical thermodynamics model, which is coupled with a kinetic model for the evolution of the probabilities of lattice occupancy with time. Thus, MXE bypasses the simulation of these rare events by using effective kinematic laws that can be fitted to experimental parameters such as diffusivity and migration energies [55]. Using this methodology, we were able to simulate the effective migration of vacancies and interstitials in NC-Ni. Now we will review the details of the method.
2.2.1 Non-equilibrum thermodynamic model
Consider a system of lattice sites; each can be occupied by an atom of one of species. As a consequence, the occupancy function is introduced as
| (8) |
Now, microstates of the system are described by the instantaneous positions , instantaneous momenta as well as the instantaneous occupancy . As usual in statistical mechanics, the probability distribution function is defined as a function of the three variable as in the extended phase-space. This probability can be interpreted as how often is the system can be at a particular microscopic state . The statistical treatment of thermodynamic systems is usually performed by invoking to phase-averaged quantities that can be determined using this probability density function (p.d.f.). Let be an instantaneous function defined over the system. Its phase average or expected value can be computed using as,
| (9) |
Quantities between represent the phase average of a given function defined over the system [59]. In order to work with these expected values, we proceed to determine the p.d.f. of the system by using the maximum entropy principle. The next step in the MXE formalism is assuming that the system follows Jaynes’ principle of maximum entropy. This principle proposes that the least biased is the one that maximizes the information-theoretical entropy
| (10) |
which can be cast into an optimization problem to find the optimum . The maximization is then subjected to the two known constraints of the system, i.e.,
| (11a) | |||
| (11b) | |||
where and are the th atomic molar fraction of the specie and average local energy. and are the expected particle atomic molar fraction and expected particle energies respectively. represents the probability that the th atomic site to be occupied with an atom of one of the species. When the atomic molar fraction is , it represents a full certainty of the atomic site to be occupied; when , it represents a full certainty of an empty site (i.e., a vacancy). is the local energy associated with the th site, including potential and kinetic energy. The maximization of Eq. 10 is subjected to the local constraints results in a probability density function of the form
| (12) |
with
| (13) |
where and can be regarded as the grand-canonical distribution and grand-canonical partition function of the system, respectively. The quantities and are related to the physical quantities of atomic temperatures, , and the local particle chemical potential, , respectively, as
| (14) |
and
| (15) |
It is worth mentioning that, unlike classical mechanics, in the MXE formalism, the local chemical potential and temperature are not required to be in equilibrium. This characteristic makes the method capable of modeling systems away from equilibrium. Using Eqs. 10, 12 and 13, the grand-canonical total entropy is
| (16) |
and, consequently, the grand-canonical free entropy is
| (17) |
Equation 17 is very complex to solve due to the couple form of the grand-canonical partition function. Hence, a mean-field approximation is employed to derive a functional equation, see for instance [52, 55]. The mean-field grand-canonical free-entropy of the system is simplified to
| (18) |
where and are the atomic molar fraction and mean-field frequency of the th site, respectively. is the phase average of the interatomic potential with respect to the mean-field probability density function , e.g.,
| (19) |
is the phase average of the interatomic potential, also referred to as the thermalized potential, since atomic interactions are computed by considering the value of the positions and vibrations at a specific temperature. The non-equilibrium statistical thermodynamics model formulated in Eq. 18 calculates the mean positions and frequencies at a specific distribution of atomic molar fractions associated with each atomic site.
2.2.2 Kinetic diffusion model
The non-equilibrium statistical thermodynamics model formulated in Equation 18 allows for variations of the temperature and chemical potential in the system. The next step to close the system of equation is to introduce a kinetic model that computes the probabilities of lattice occupancy with time. There are many different approaches for the kinetic model, and all of them follow from phenomenological models. In this work, we follow the one used by Mendez et al. and other works [55, 51, 53, 54] based on a master equation for mass diffusion. The advantage of using a master equation is ability to link the phenomenological parameters in the model to well defined materials properties that can be obtained from experiments, such as vacancy diffusivity. Moreover, a versatile user-package is available with LAMMPS code, LAMMPS-MXE [55] which allows for further modification and development.
Hence, the mass transport governing equation is
| (20) |
where is the pair-wise mass exchange rate that can be computed as
| (21) |
where is the vacancy diffusion coefficient obtained from experiments. Alternatively, one can compute as,
| (22) |
where is the hopping frequency, and is the migration energy, which is the energy barrier required to perform one hop of the quantity from the th site to the th site. In diffusion related problems, one can define a characteristic time step s. In the MXE simulations, the integration time step used to update Eq. 20 was .
The probability that to adjacent sites exchange mass is given by
| (23) |
where is the difference of the chemical potential, which is the driving force for the diffusion process. The material properties of Ni used for 2T-MD and MXE methods are summarized in Table 1
After reviewing the whole model, the procedure of the implementation can be introduced. It can be divided into two main steps, a diffusive step which involves the mass transport and the structure relaxation. At first the problem is initialized by defining all the position, occupancy vectors, temperature and frequency. While fixing the atomic positions and frequencies, the atomic molar fractions are updated according to Eq. 20 in the diffusive step. It is worth mentioning that the time-step size is several order of magnitude larger than the classical MD time-step. The atomic forces are calculated accordingly. Finally the positions and frequencies are updated using Eq. 18 by maximizing the grand-canonical free-entropy, while the atomic molar fractions are held fixed. This approach allows the model to capture multiple simultaneous transition events.
2.3 Simulations set up
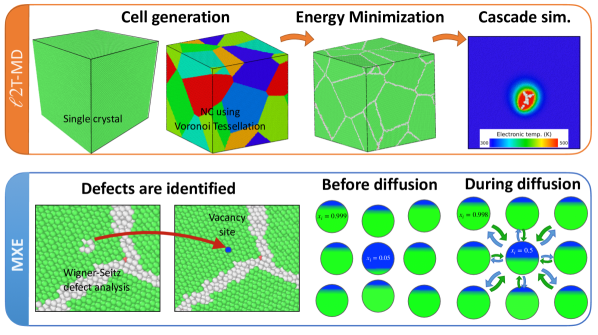
We now describe the computational set up for the simulations, including the cascade simulations and long-term diffusive simulations carried out with 2T-MD and MXE, respectively. A schematic of the set up is shown in Fig. 1 for reference. MD simulations were performed using Large-scale Atomic/Molecular Massively Parallel Simulator (LAMMPS) [60]. The embedded atom model (EAM) potential developed by Bonny et al. [61] was used to model the inter-atomic interactions. This potential was developed to study the production and evolution of radiation defects, particularly point defects. Nickel (Ni) face-centered cubic (FCC) –with lattice parameter nm– single-crystal simulation cells with side lengths and nm were used as a reference depending on the PKA energy. Periodic boundary conditions were employed in all three directions for all simulation cells. NC simulations cells consisted of seven randomly oriented grains generated using a Voronoi tessellation algorithm (see top left panel in Fig. 1).
In order to promote the complete relaxation of the GB network in NC cells, a computational annealing procedure was used. The annealing process consisted of several cycles of high-temperature, followed by low-temperature cycles, and energy minimization procedures, similar to previous works [62, 63]. Firstly, energy minimization was done at K using the Polak-Ribière conjugate gradient algorithm. Then, the atoms were given an initial temperature of K. After that, the simulation cell’s temperature was subsequently raised from K to K in picoseconds using NoséHoover thermostat at zero pressure, then relaxed for picoseconds at K then quenched to K at picoseconds and relaxed for another picoseconds. The final relaxation step was subjected to another energy minimization at K.
The next step was to start the cascade simulations. Cascade simulations were performed by giving one atom located at the center of the cell a random high-velocity corresponding to recoil energies of , and keV in an NVE ensemble. This atom is often referred to as PKA. The electronic stopping was incorporated in the simulations through electron stopping fix in LAMMPS [64, 65]. The stopping-power values were calculated using the Stopping and Range of Ions in Matter (SRIM) software [66] with a minimum cut-off energy of eV. The electronic temperature effects were included using the 2T-MD method [37], as discussed in Section 2.1. We compared the classical MD with MD plus the electronic stopping effects (referred as to MD+SRIM), and 2T-MD including SRIM (referred as to 2T-MD) simulations and assessed the effects of incorporating the electronic effects on defects evolution and final structure. For the 2T-MD simulation, the lattice and electronic subsystems were initially at K before energizing the PKA. A variable time step was used, having the maximum time step restricted to fs for the cascade simulations to limit the maximum distance for every time-step moved by the PKA atom to . At each MD step, between 10 to 15 electronic temperature integration time-steps were performed. The total time of the cascade simulations was about ps, which was sufficient for the radiation-induced defects as well as the lattice and electronic temperatures to reach steady states. Each cascade simulation was repeated ten times with different random PKA directions to ensure sufficient statistical representation.
Grain boundaries effects on the defects annihilation were assessed using the distribution of interstitial and vacancies. Defected clusters of atoms caused by the PKA were used to quantify the damage. The Ovito software was used for visualization of the defect structures [68], and the DXA algorithm was used for dislocation loops analysis with trial circuit length of and circuit stretchability value of [69].
After PKA simulations were performed with the 2T-MD method, Wigner-Seitz defect analysis was performed to determine the vacancies and SIAs using Ovito (see Fig. 1 for a schematic view of the steps in the MXE simulations). The vacancies positions were filled with atomic sites having an atomic molar fraction of to simulate the presence of vacancies in the MXE framework, while all occupied sites including interstitialswere assigned a value of . To avoid numerical instabilities, the atomic molar fraction of the vacancies was chosen to be , indicating a low probability that a Ni-atom will occupy the site. The probability of occupancy is schematically shown in Fig. 1, where green color in the atoms refer to highly occupied sites (i.e., ) while empty sites (i.e., ) are shown in blue.
To exactly balance the number of vacancies in the sample, the atomic molar fraction in all occupied sites was set up to a value slightly smaller than one to compensate for this small probability of vacancies , with , where is the number of vacancies identified after the PKA simulation and is the total number of atoms in the sample. For instance, using , and , , resulting in an atomic molar fraction of for an occupied site.
3 Results
3.1 Electronic temperature effects on radiation damage simulations
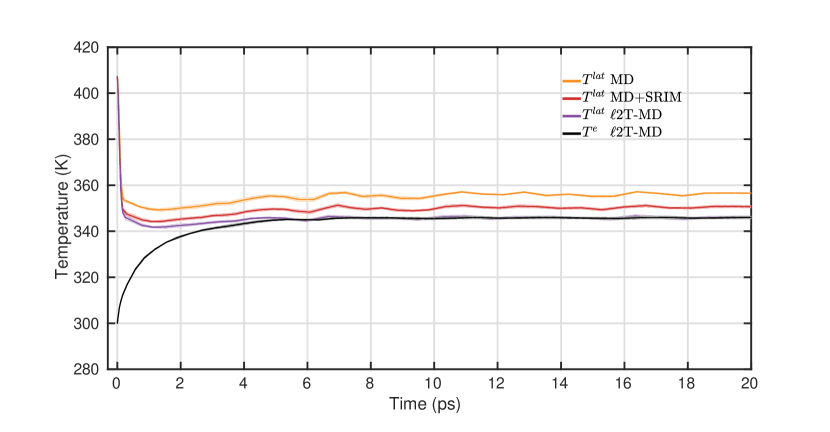
Before investigating the effects of the electronic subsystem on the radiation-induced defects, the lattice temperature is compared for three different systems i) classical MD which will be referred to as MD; ii) classical MD plus the electronic stopping effects referred as MD+SRIM; iii) and classical MD plus electronic stopping effects and electronic temperature effects refereed as 2T-MD. The temperature’s time evolution for the three systems at a PKA energy of keV is shown in Fig. 2. Looking at the results, we observed that the lattice temperature was initially at around K when the PKA was inserted in the simulation and stabilized after about ps for all systems. The steady-state value of the lattice temperature was around K for MD, followed by MD+SRIM K, and 2T-MD K. This behavior is expected as in the MD system, the lattice is the only mediator for heat capacity, whereas in MD+SRIM and 2T-MD electronic systems account for additional heat capacity. For the 2T-MD, we also observed that the electronic temperature increased from K to K at around ps and remained more or less constant after that. Supplementary Video 1 shows the time evolution of the electronic temperature for a slice of the cell for a keV PKA with the defect clusters superimposed in the video.
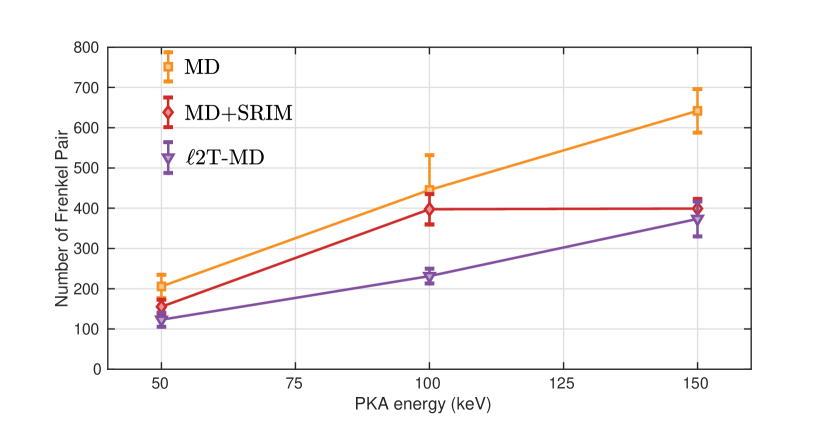
We now focus on the number of FPs that survived the PKA responsible for the damage to the material. Figure 3 shows the number of FPs in steady-state for classical MD, MD+SRIM, and 2T-MD. At low PKA energies ( keV), the number of FPs is significantly different between the 2T-MD and MD, while there is a small overlap between the MD+SRIM and 2T-MD. For medium PKA energy ( keV), the difference between MD and 2T-MD is more evident ,while MD+SRIM totally overlap with MD. Similar behaviour was observed for the high PKA energy of keV between MD and 2T-MD, however, for MD+SRIM it overlaps with 2T-MD. For both MD and 2T-MD, the FP number increase linearly between keV and keV, however for MD+SRIM, the linear increase is broken between keV and keV. As the PKA energy increased, the number of MD predicted FPs was overestimated compared to 2T-MD. For instance, for a PKA with keV, MD predicts near FPs, whereas 2T-MD predicts FPs or a difference of in the surviving defects, while for MD+SRIM the overestimation of FP was around compared to 2T-MD. It is also important to remark that the FPs affect a small number of atoms in their neighborhood, changing the energy landscape. Thus, the number of atoms in defected cluster also increases significantly for MD and MD+SRIM compared to 2T-MD.
We also point out that the MD+SRIM predicted a much closer number of FPs to MD for the moderate PKA energy of keV,while, for MD the overestimation of FP was around compared to 2T-MD . However, as the PKA energy increased, the overestimation of MD compared to 2T-MD was around .These observations illustrate the need to include electronic effects for all PKA energies studied. We also point out that the overestimation percentage is material-dependent and might differ for other materials with different heat capacity, electronic conductivity, and electron-phonon constant [70, 71, zarkadoula2017effects].
Generally the 2T-MD method predicts a lower amount of defects compared to classical MD even at low PKA energies of keV. The smaller number of defects is due to the energy absorbed by the electronic subsystem, which is not accounted for in classical MD. Even though the lattice temperature is not substantially different in the MD and 2T-MD systems, the energy dissipated by the electronic system resulted in a lower number of FPs than traditional MD.
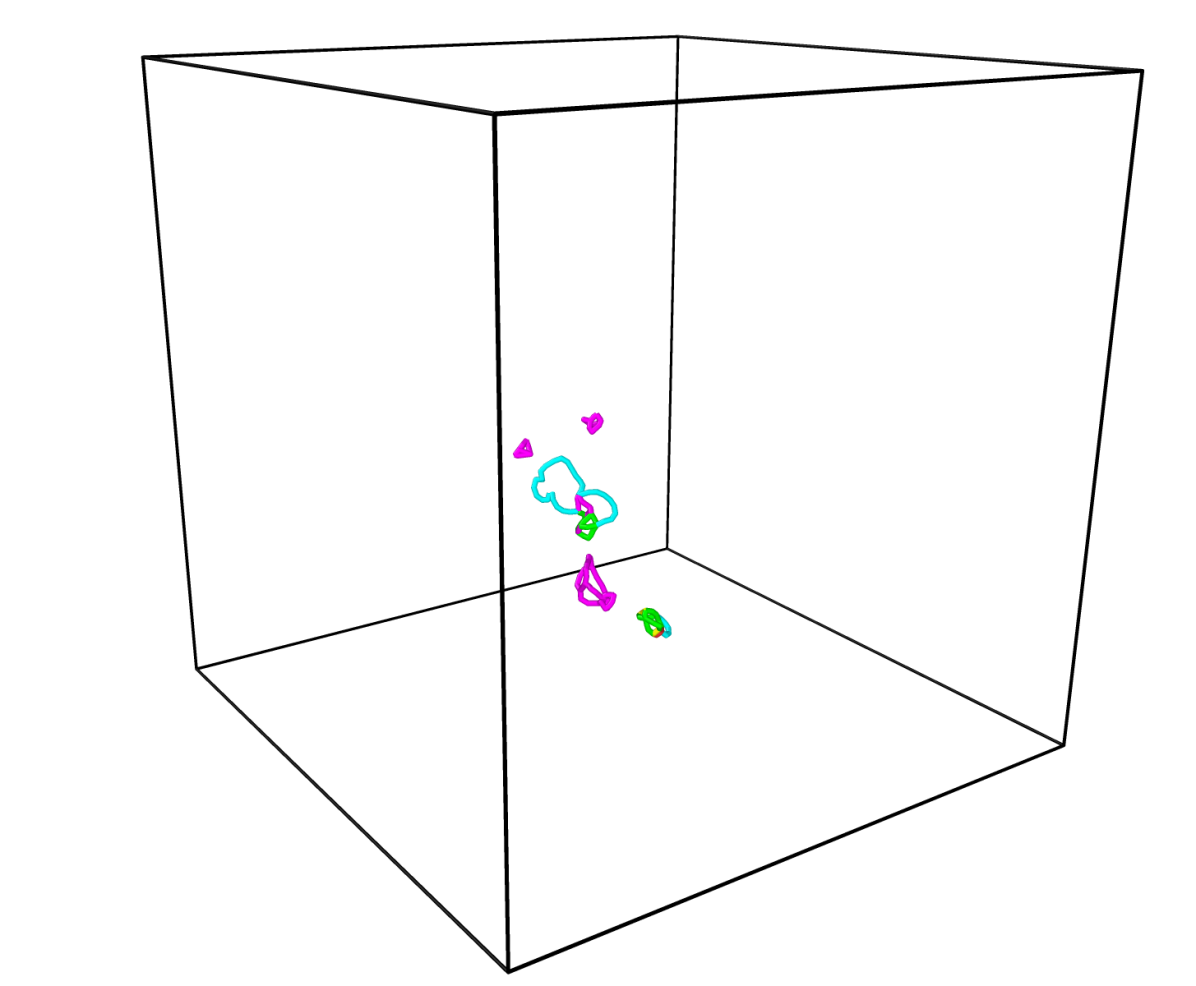
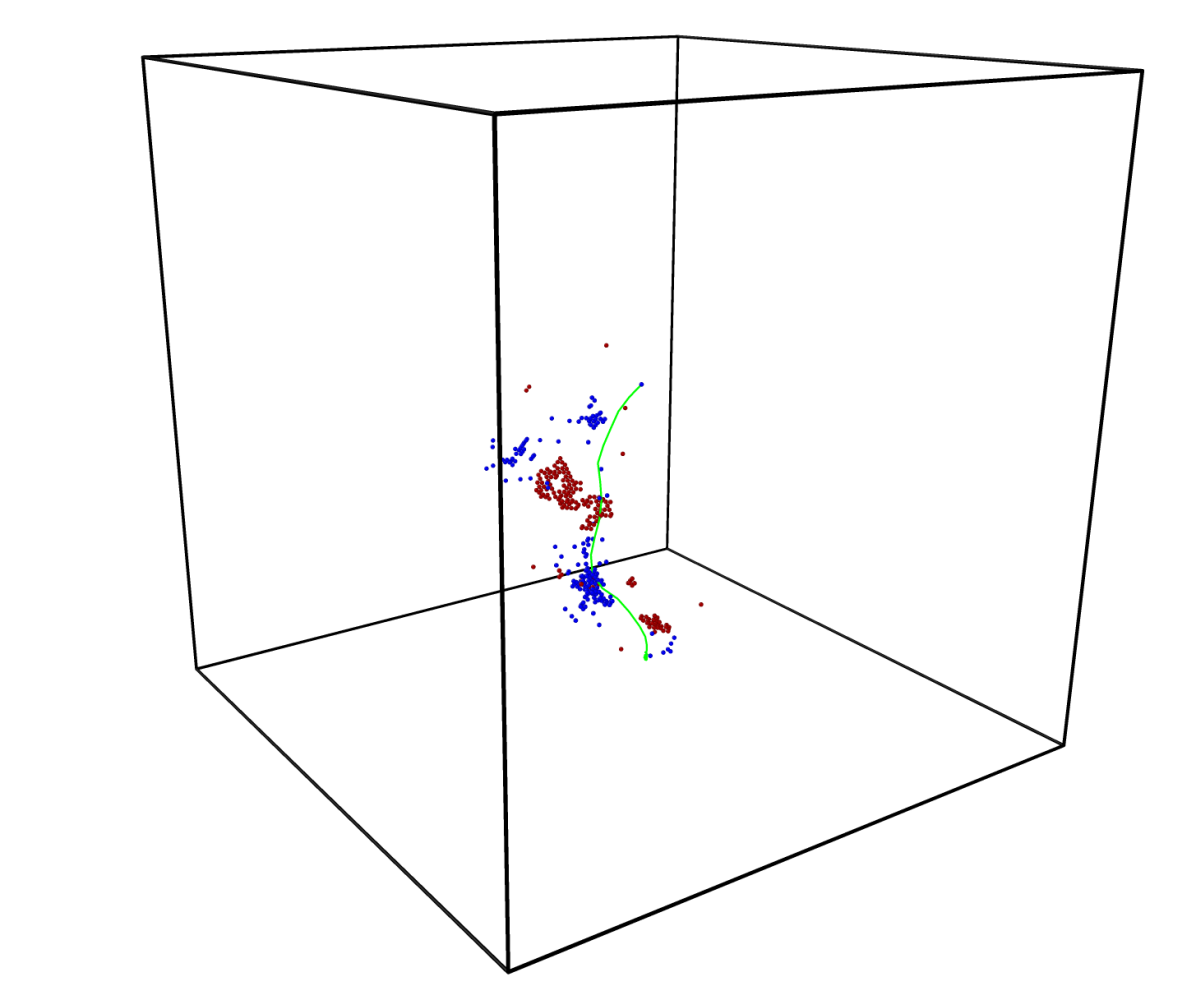
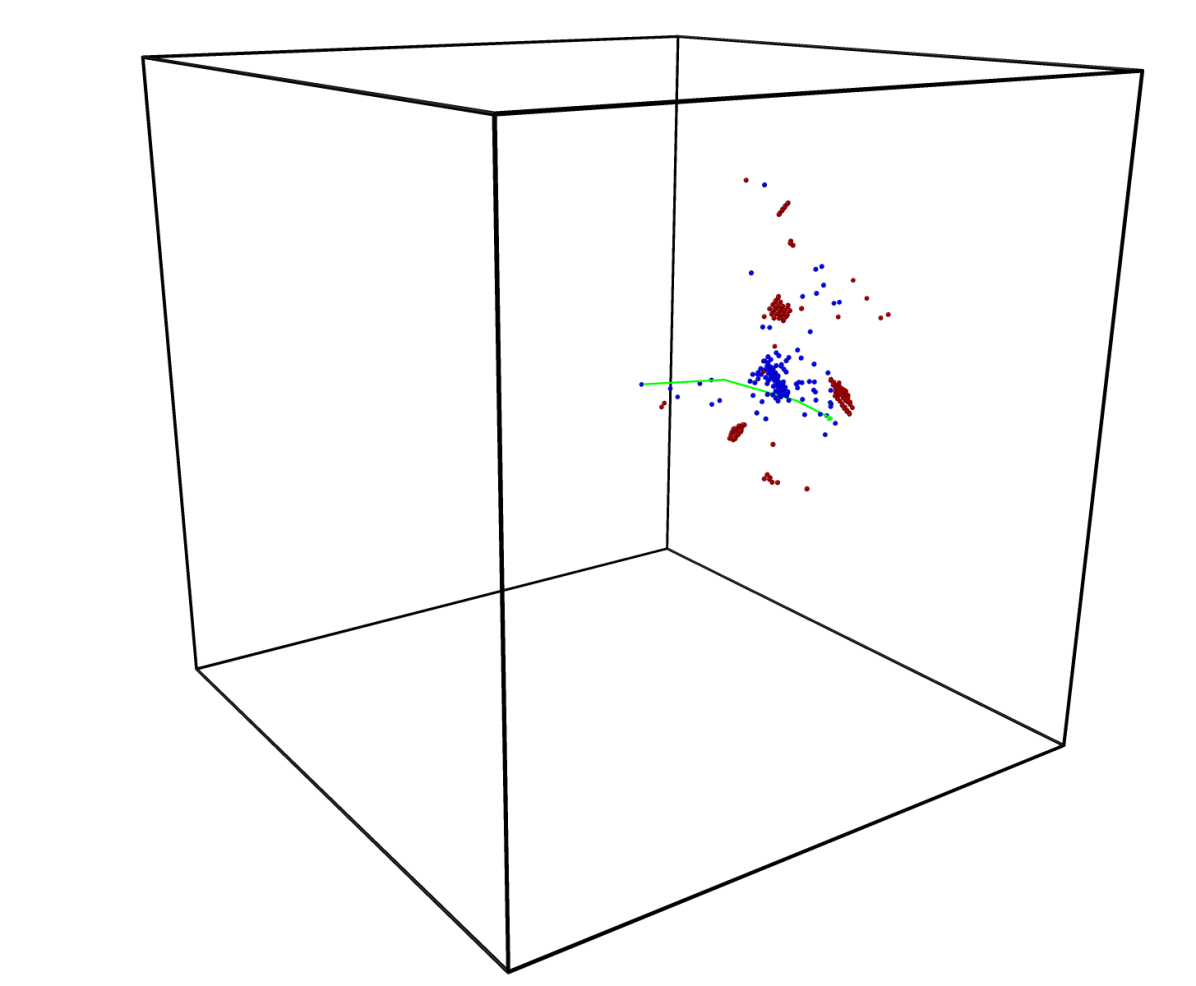
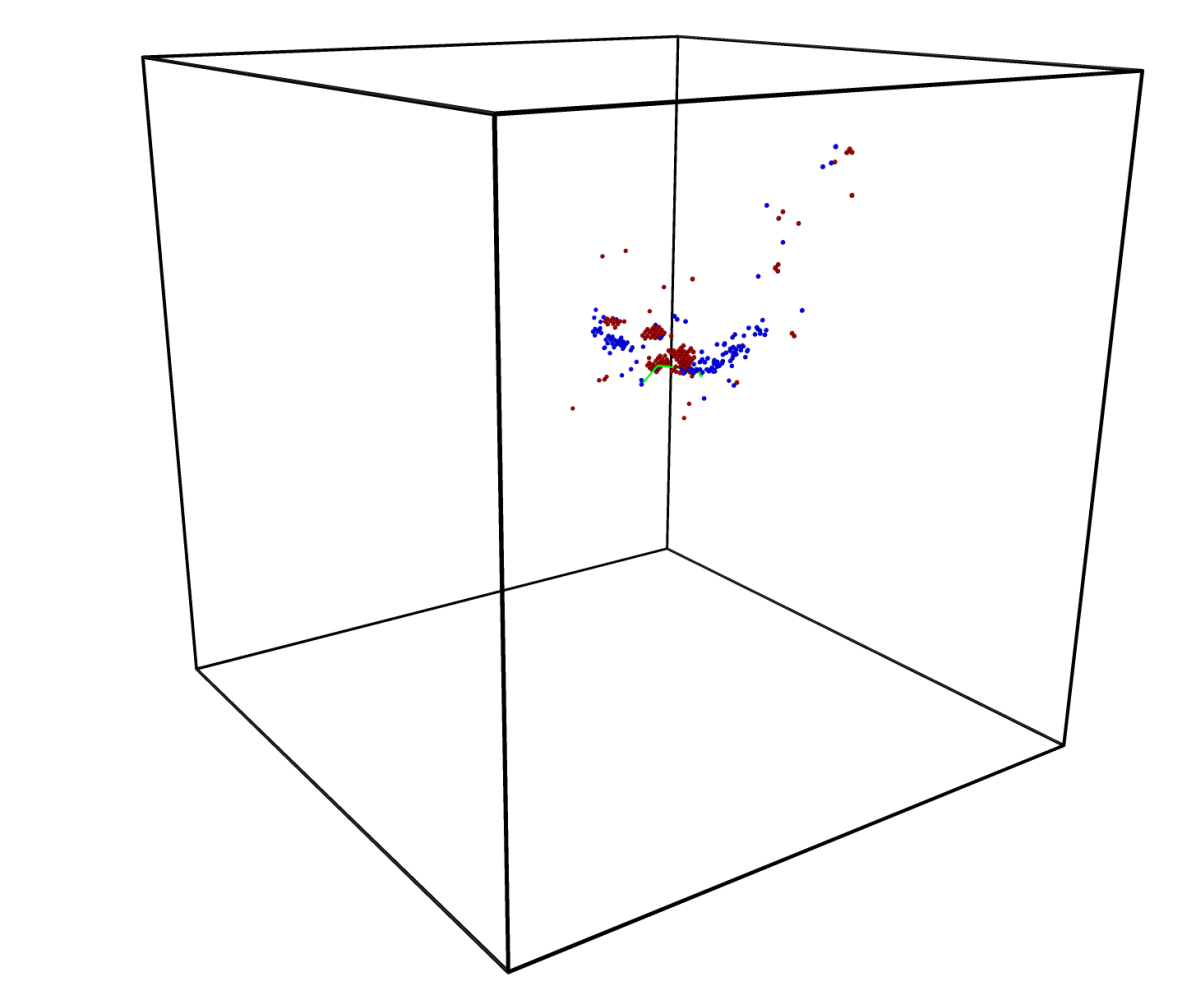
Having quantitatively compared the number of FPs between the three techniques, we now focus our attention on the distribution and clustering of the defects. Figure 4 shows only the spatial distribution of the dislocation loops originated from the cascade simulation, along with the SIAs and vacancies for MD, MD+SRIM, and 2T-MD for a recoil energy of keV. Figures 4(d)-(f) shows the corresponding vacancies (blue) and SIAs (red), which some clusters and forms the dislocation loops after the cascade simulation. It was observed that the single crystal contained defects in the form of dislocation loops, as shown in Fig. 4, and individual interstitial and vacancies accompanied these loops. When the electronic effects were taken into account, they altered the dislocation loops size and configuration compared to MD (cf. Fig. 4(a) with Fig. 4(b) and Fig. 4(c) for dislocation loops in the MD, MD+SRIM, and 2T-MD simulations, respectively). In the classical MD simulations, the defects clustered along the trajectory of the PKA and generated much bigger dislocation loops (see Fig. 4(a)). On the other hand, for MD+SRIM and 2T-MD, dislocation loops were smaller in size and aligned with the PKA path, while the FPs were more scattered away from the PKA path rather than concentrated as shown in Fig. 4(b) and Fig. 4(c), respectively.
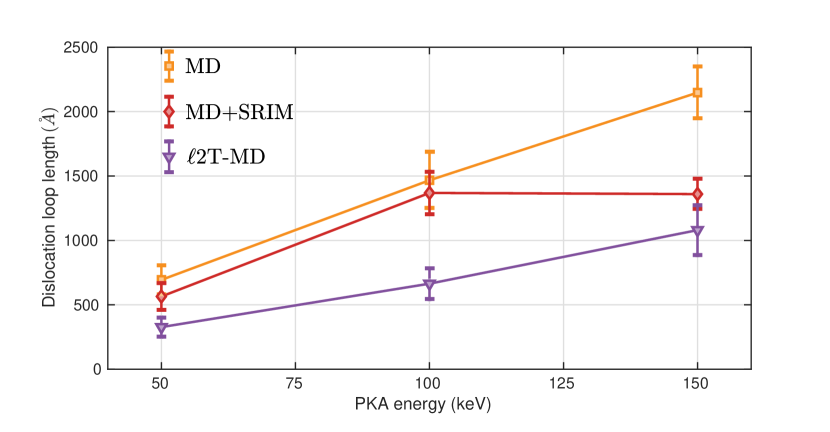
Figure 5 shows the dislocation loop length for different PKA energies and methods. The dislocation loop length correlates well with the evolution of the FP shown in Fig. 3. MD overestimates the 2T-MD for all PKA energies, while MD+SRIM behaviour depended on the PKA energy. Generally, MD simulations showed more defects clusters than the 2T-MD simulations. For instance, at a recoil energy of keV, MD predicted a dislocation length of Å, while 2T-MD predicted Å. Besides, the clusters generated in the 2T-MD simulations were smaller in size, indicating that the classical MD overestimates the size and shape of the defect clusters formed and their number. Moreover, the distribution of defects clusters is different in 2T-MD compared to classical MD, similar to [72, 73].
3.2 Primary radiation damage in nanocrystalline Ni
After studying the effects of radiation in single Ni crystals using classical MD, MD+SRIM and 2T-MD and showing that electronic effects are important when the PKA energy is high, we now endeavour to investigate the effect of radiation in the damage of NC materials. To do that, we systematically compared the results between a Ni-single crystal and a Ni-NC with 2T-MD at keV. NC cells were produced using the procedure described in Section 2.3.
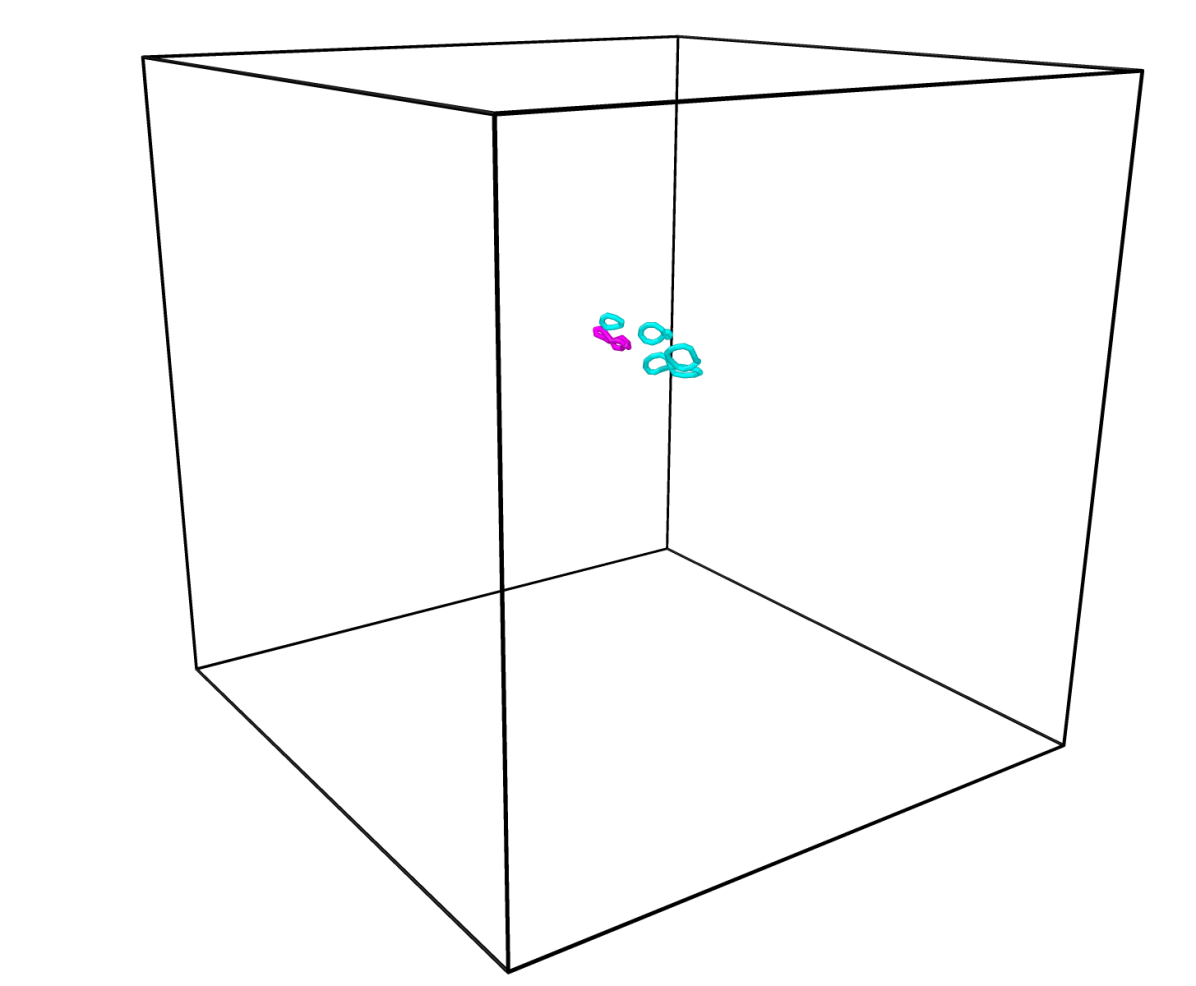
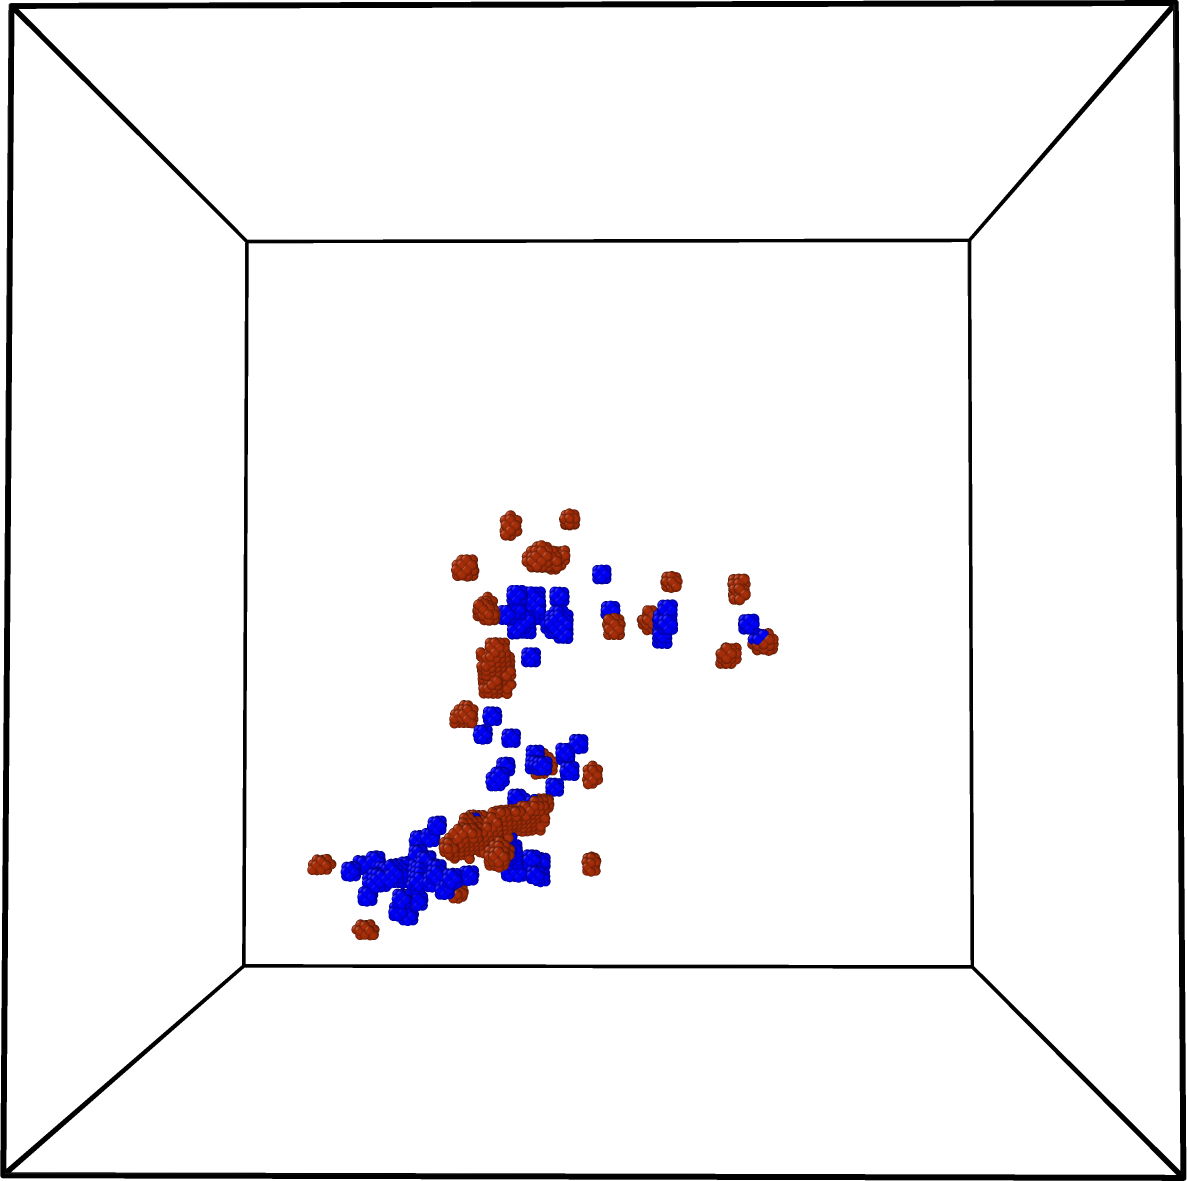
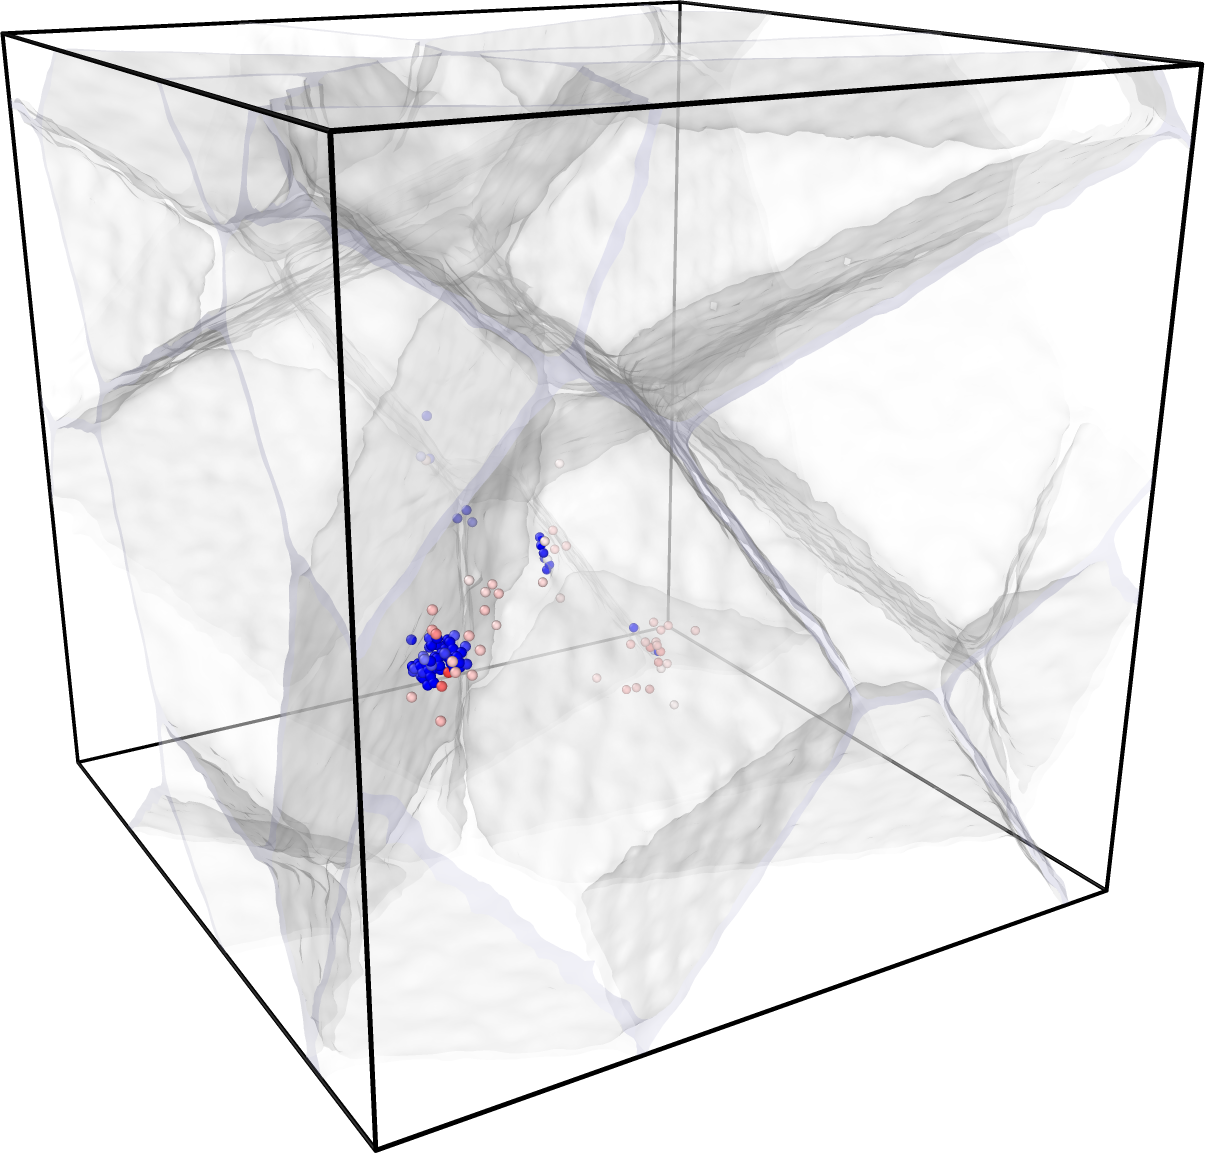
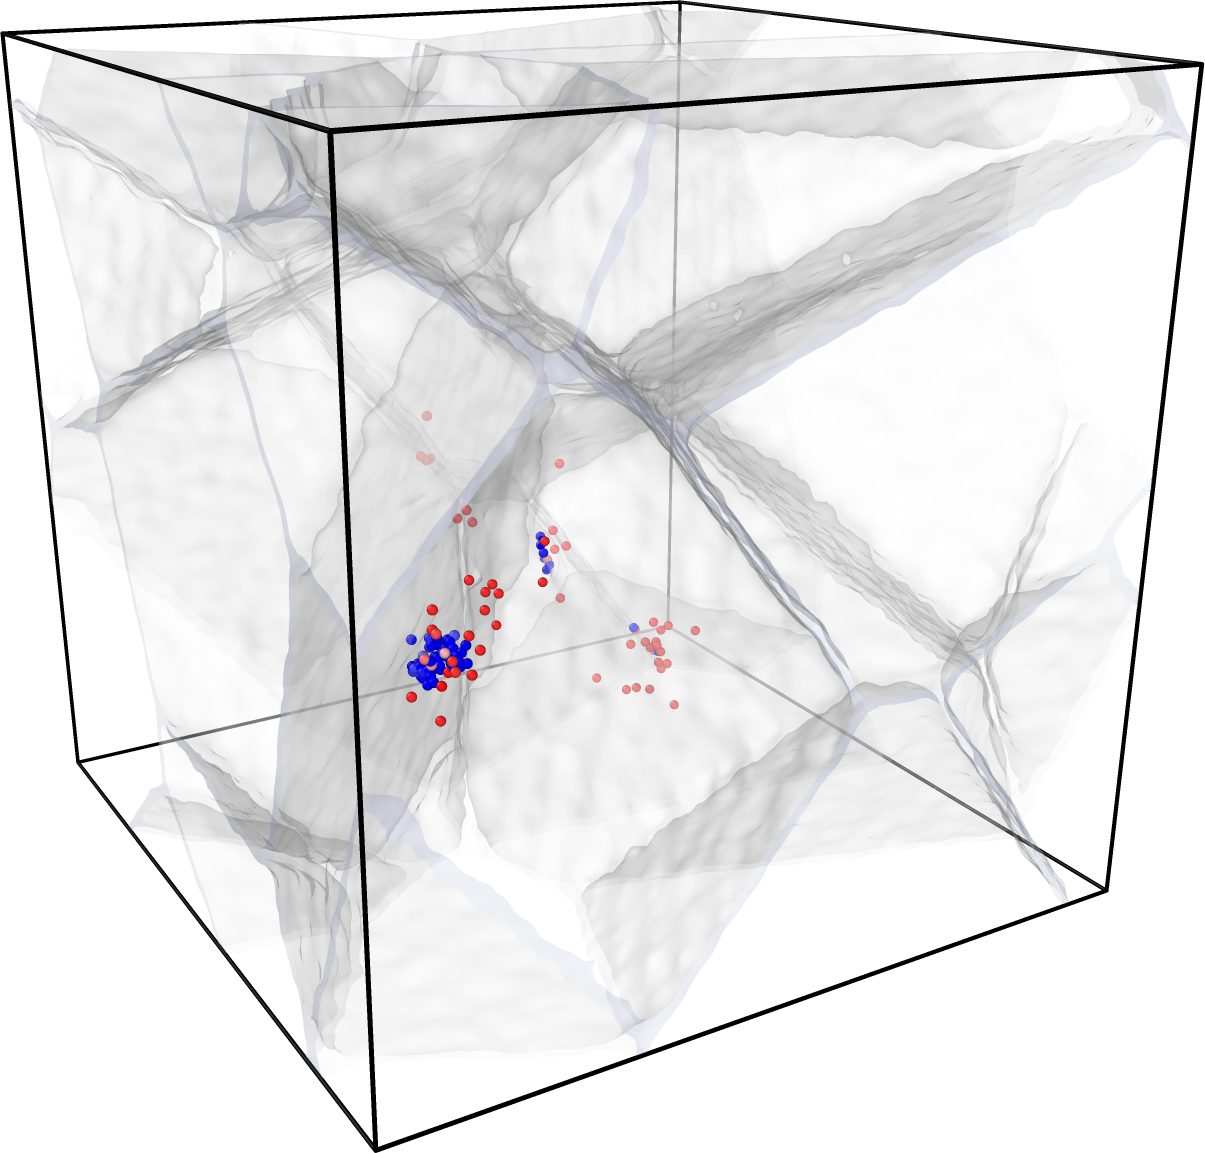
Figure 6 shows the computational cells for a single crystal (Fig. 6(a)) and a NC containing 7 grains (Fig. 6(b)) that have been damaged with a PKA with a recoil energy of keV. In the figure, all atoms have been removed except the ones in defect clusters generated after the PKA coloured according to its type, blue for vacancy and red for SIA, and the GBs in Fig. 6b were plotted using a transparent mesh. The GBs result in a complex network in the computational cell. Next, the PKA produced FPs, which in turn can coalesce and generate larger defect clusters of defective atoms. It is worth mentioning that the generated FPs cause the distortion of the lattice around them leading to the formation of non-FCC atoms around them, referred here as defective atoms. Even though the cell size and PKA energy were the same for both cases, the number, shape, and size of the SIA defect clusters changed drastically in the simulations as portrayed in Fig. 6 (cf. (Fig. 6(a) and Fig. 6(b)). A visual inspection of the SIA defects after the PKA revealed that the defect clusters had smaller sizes for the NC case. The largest defect cluster for SC was formed of atoms, while for NC was , indicating a significant effect of the GB presence on the size of the SIA defect clusters. Furthermore, the total number of defective atoms around SIAs for the NC is while it is for NC. Looking at the number of the defect clusters, it was for SC and 13 for NC as shown in table 2. On the other hand, the vacancy defect clusters showed the similar behaviour for SC and NC. For instance, the number of defective atoms is and respectively with overlapping standard error values as shown in table 2. Similar trend is observed for the largest defect cluster with for SC and for NC. For the number of defect vacancy clusters, there was a slight decrease in NC compared to SC from to .
This suggests that the GBs acts as a quick sink for the SIAs in just after the cascade event, while it doesn’t offer much improvement during the same period of time for the vacancy defects. This behaviour suggests that SIAs can be quickly reabsorbed in the GBs during the PKA event, while vacancies have a long-living time. Since SIAs are absorbed in the GBs, there are fewer interstitial atoms in the bulk of the grains, ultimately impacting the size of large SIA clusters. As a result, the number and size of the dislocation loops observed in NC samples are much smaller than SC. Interestingly, the size and number of clusters are always smaller in NC samples. The collective behavior of SIAs illustrates the beneficial effect of the GBs compared to SC cells during the PKA simulations. However, it does not explain the reduction in vacancy defects. Supplementary Video 2 shows the time evolution of the electronic temperature for a slice of a nano-crytalline cell with the defect clusters superimposed in the video.

3.3 Long-term diffusion using MXE method
After simulating the primary radiation damage using 2T-MD, the long-term behavior of defects was analyzed with the MXE method for the NC damaged with keV. The role of the GBs in interacting with the radiation-induced defects is presented next.
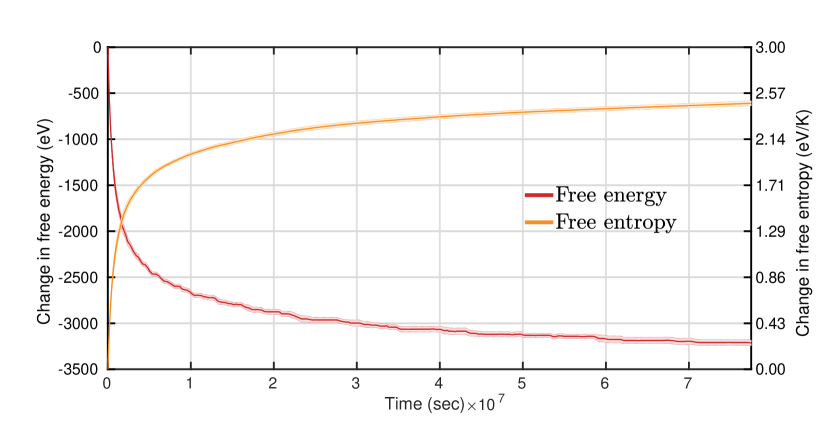
The time evolution of the free entropy and free energy calculated within the MXE framework using Eq. 18 is shown in Fig. 8. MXE minimizes the system’s free energy (or, equivalently, increases the entropy). We observed that initially the rate of change of the free-energy was much higher, to quickly decline. This demeanor indicates that most of the diffusive events happened during that initial interval.
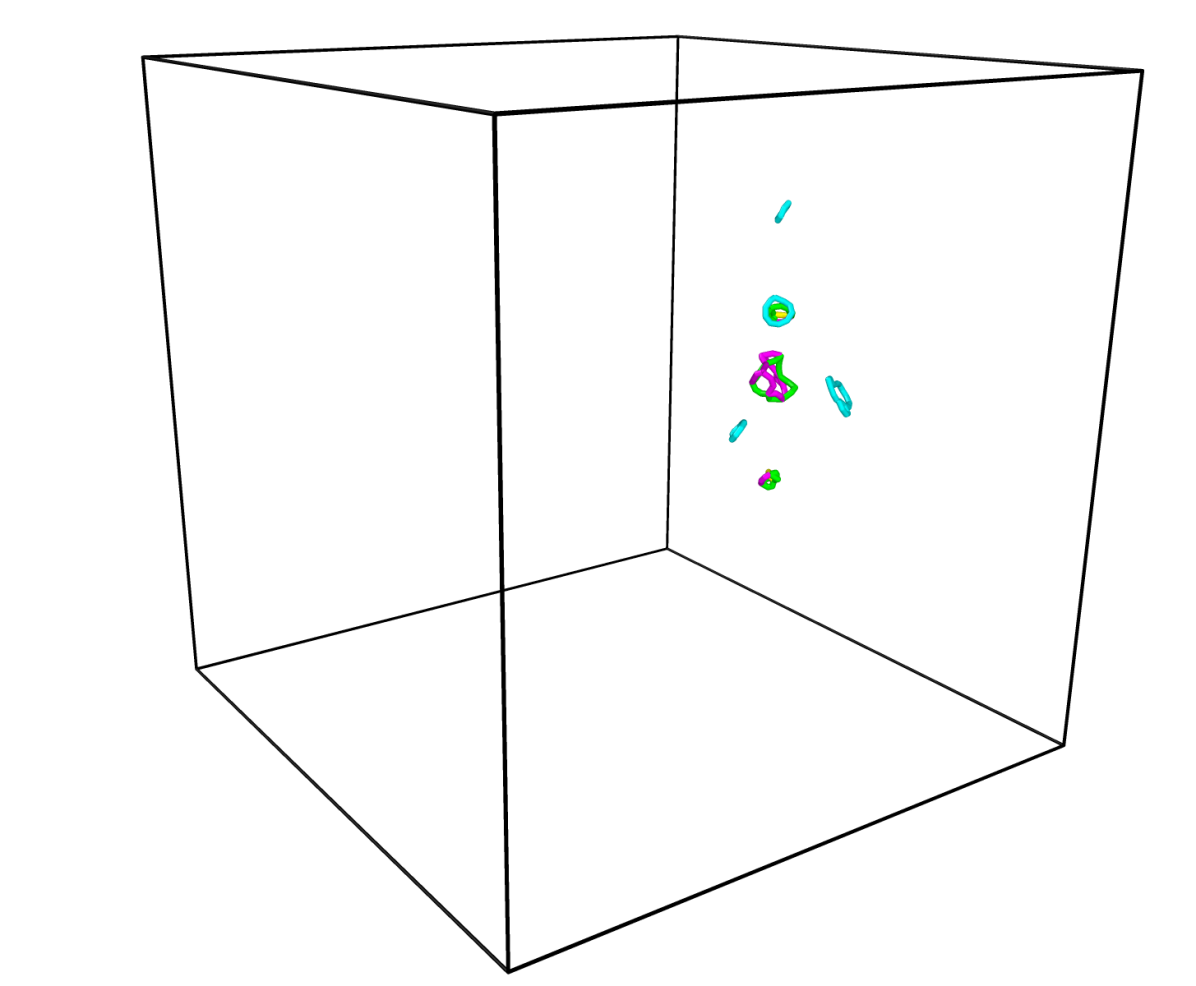
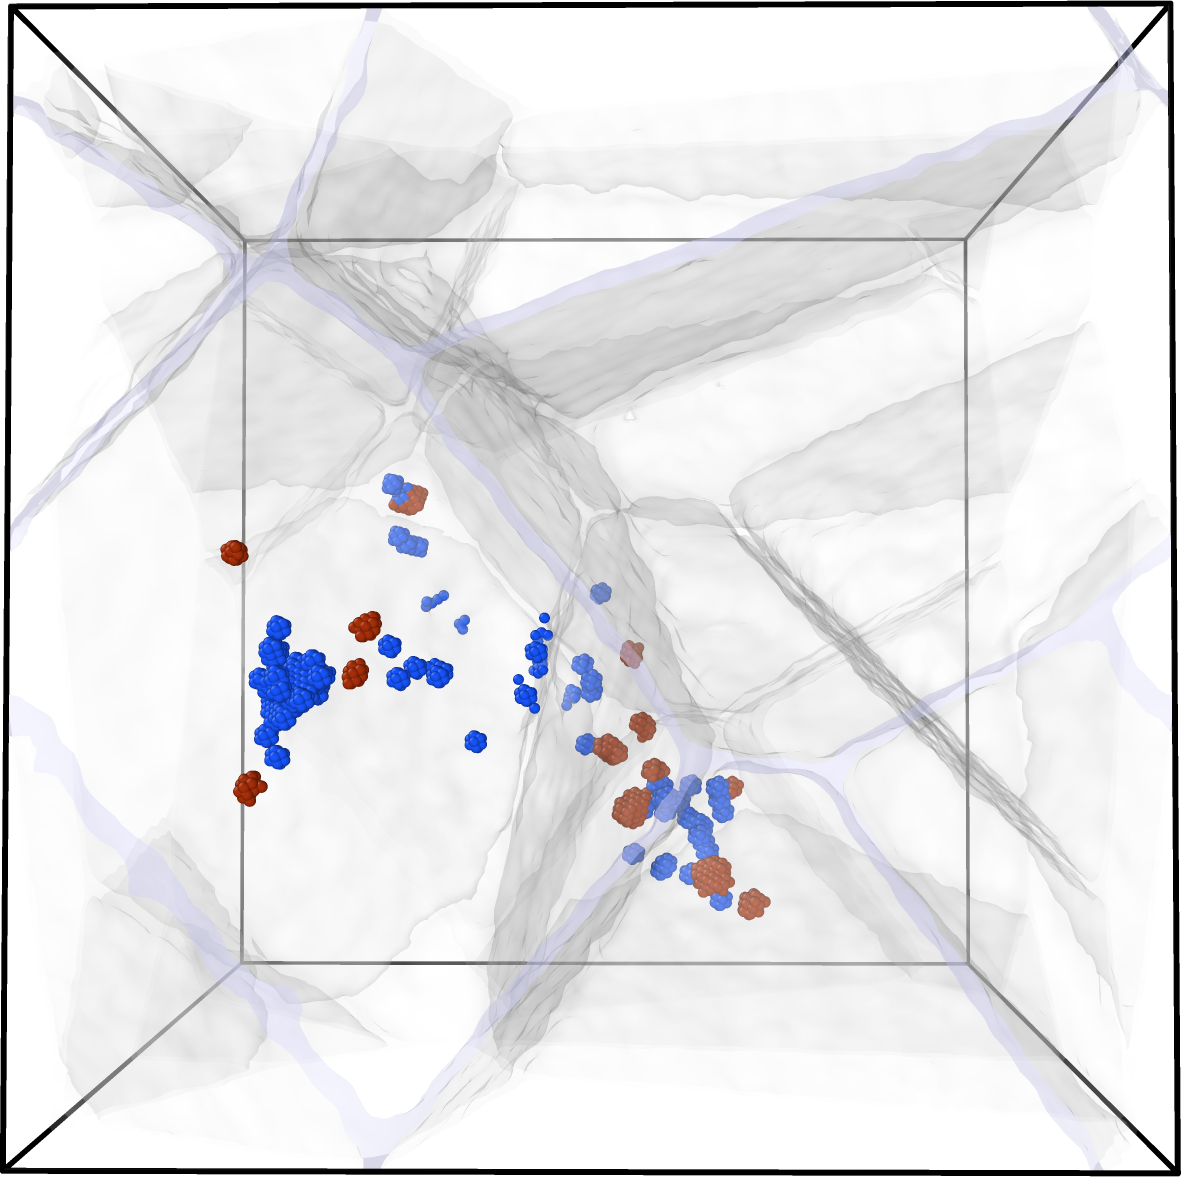
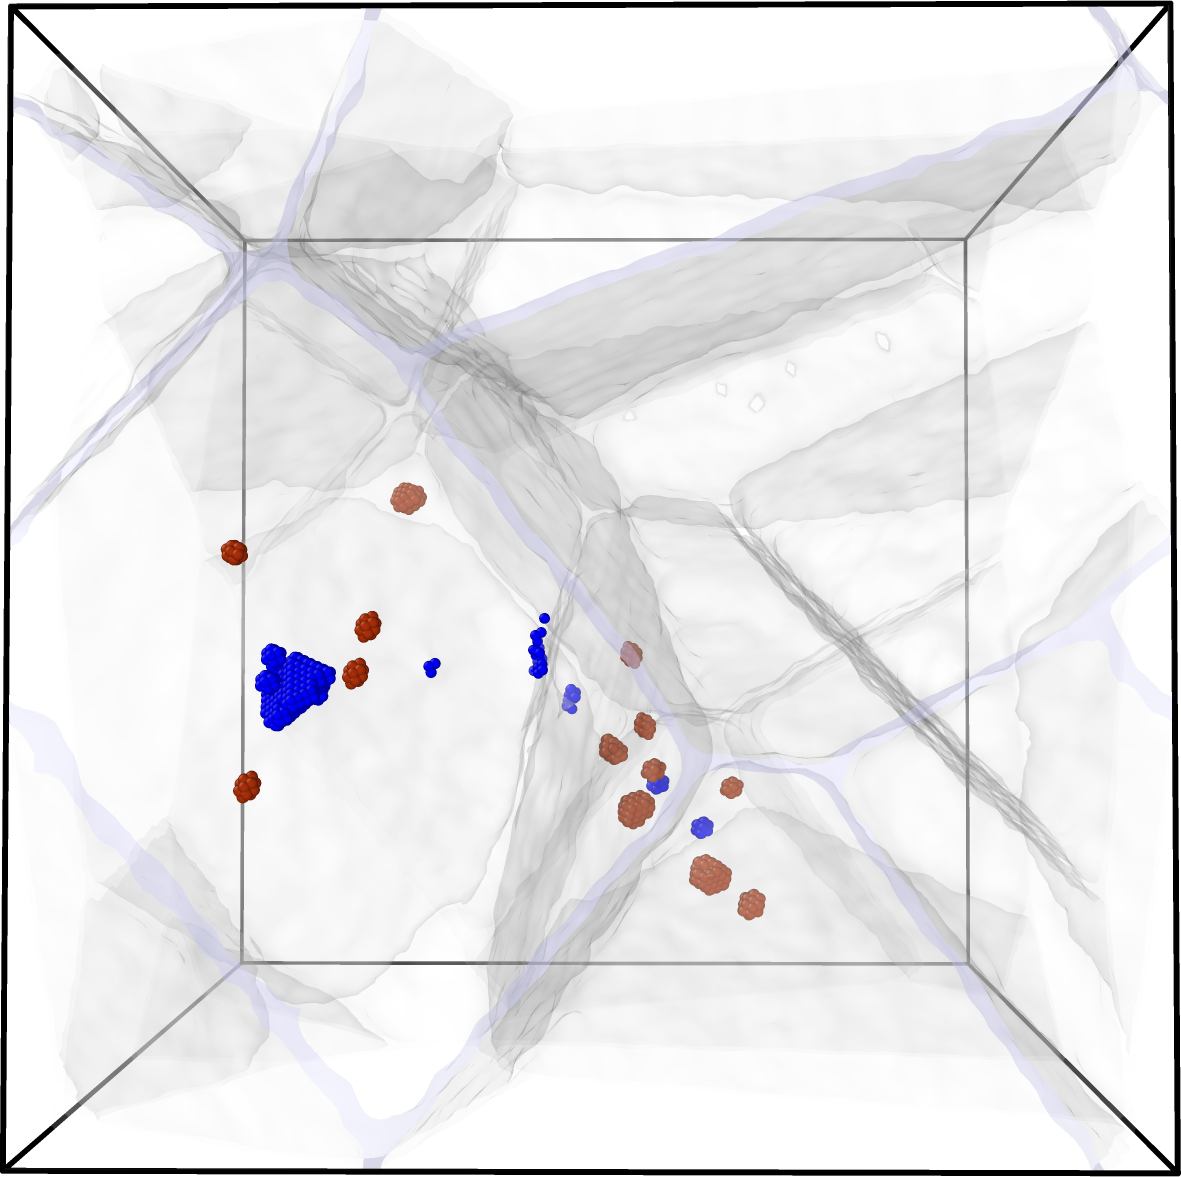
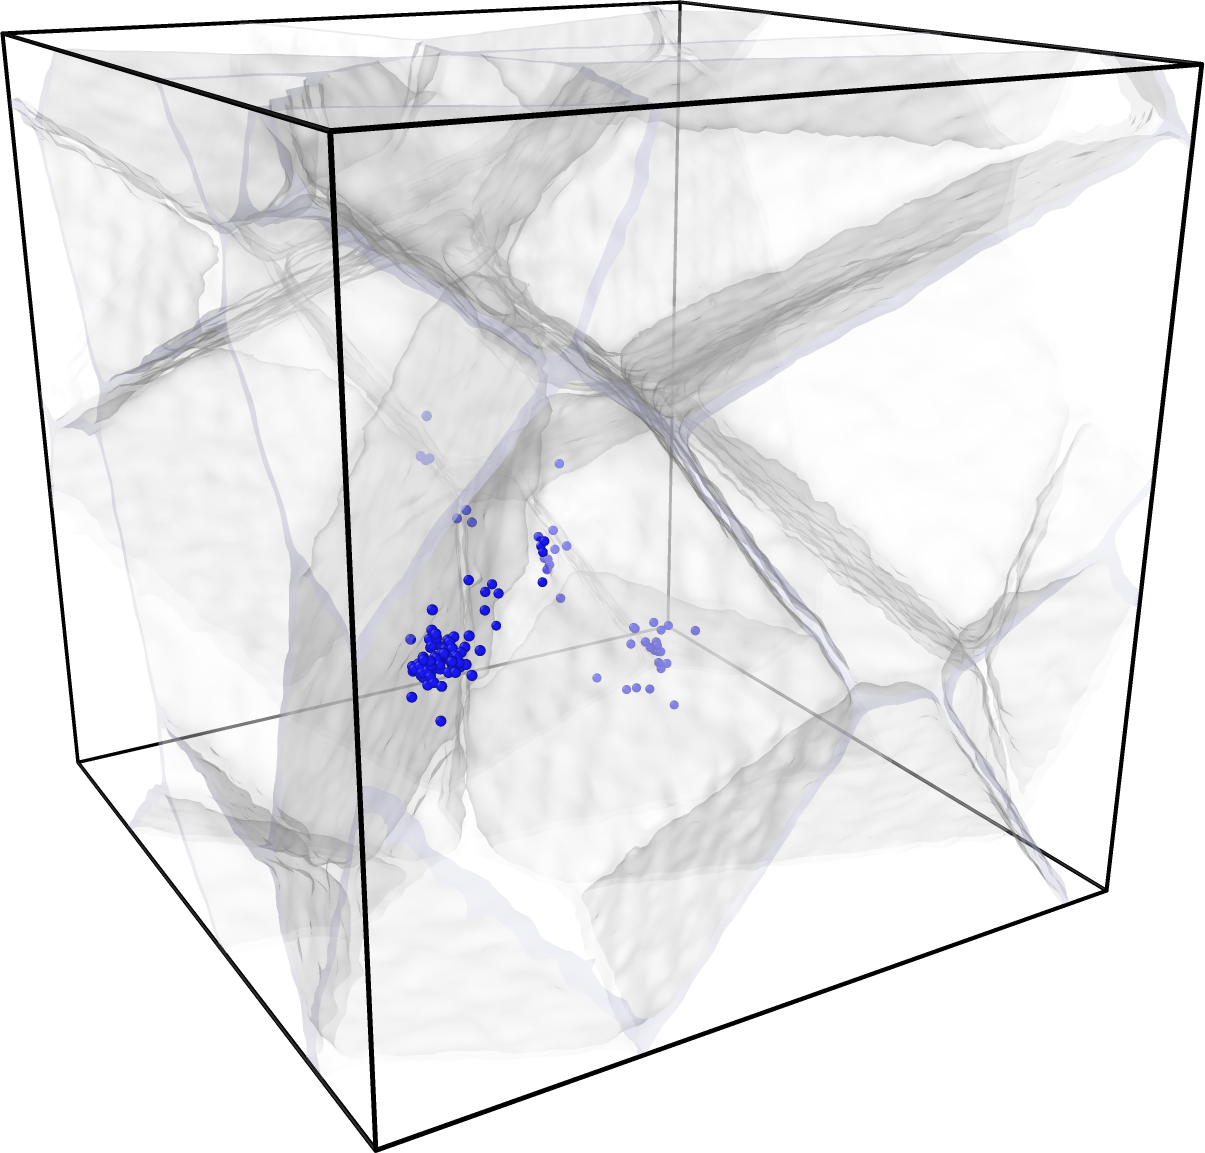
The defected clusters spatial configuration inside the material before and after the MXE simulation is shown Fig. 9. A qualitative comparison indicated a significant decrease in the number of vacancies in the bulk material during the long-term diffusion phase compared to the initial radiation damage stage (cf. Fig. 9(a) and Fig. 9(b)). It is evident from the graphical representation that the number of vacancies was reduced significantly while the SIA clusters showed a much slight reduction as shown in table 2.
| Largest defect cluster | Number of defective atoms | Number of defect clusters | ||
|---|---|---|---|---|
| Vacancy | single | 402 (106) | 1162 (112) | 33 (1.3) |
| nano | 382 (55) | 1069 (63) | 29 (1.1) | |
| mxe | 284 (37) | 474 (41) | 8 (0.5) | |
| SIA | single | 272 (46) | 1062 (60) | 23 (1.8) |
| nano | 84 (15) | 406 (47) | 13 (1.4) | |
| mxe | 73 (14) | 337 (39) | 12 (1.1) |
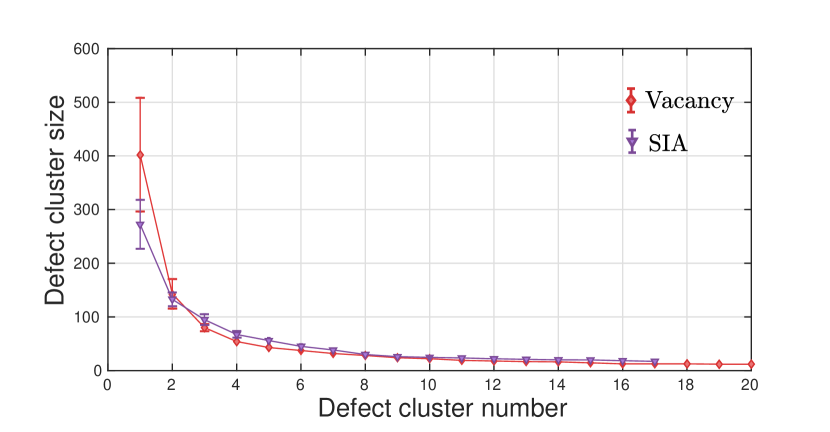
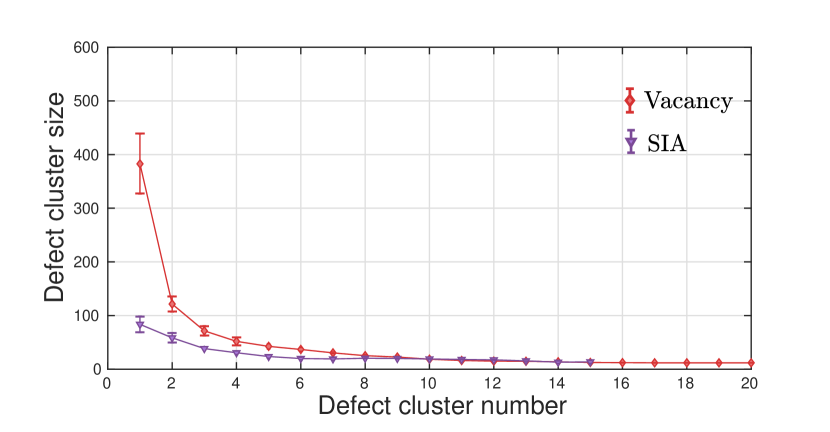
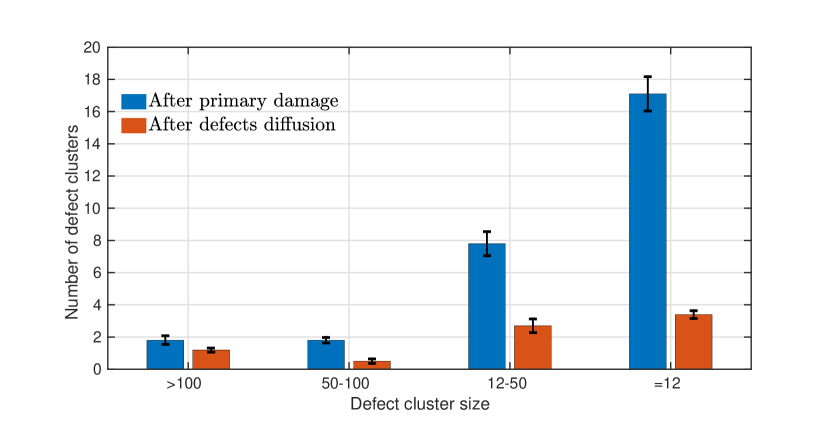
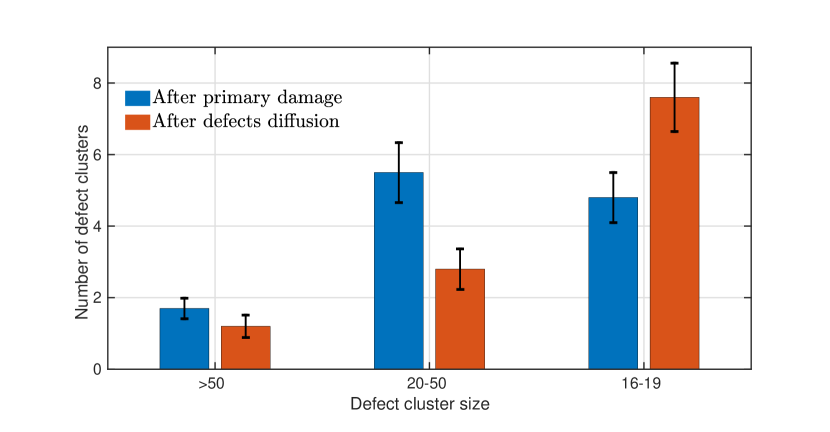
Let us now focus on quantifying the variation of the defects before and after the MXE simulation. Figure 10 shows the evolution of the clusters before and after the MXE simulation for vacancy and SIA defect clusters. Focusing on Fig. 10(a), where the number of defect clusters vs. cluster size () is shown before, and after the MXE simulation, we observed that the number of vacancy clusters had been reduced for all the sizes after the MXE simulation. For instance, individual vacancies () were reduced from to less than after the MXE simulation, representing a reduction of of all vacancies. Similar behaviour was found for other clusters with sizes between atoms, i.e., from about to for clusters with atoms (about reduction). For the SIA clusters, a similar behaviour was observed except for the individual SIA clusters with , which their number increased in expense of the larger clusters.
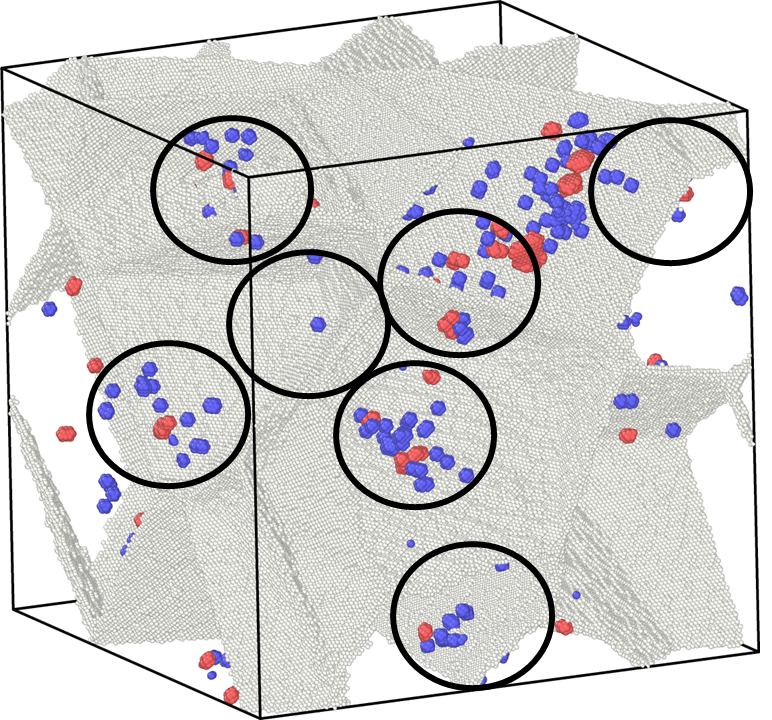
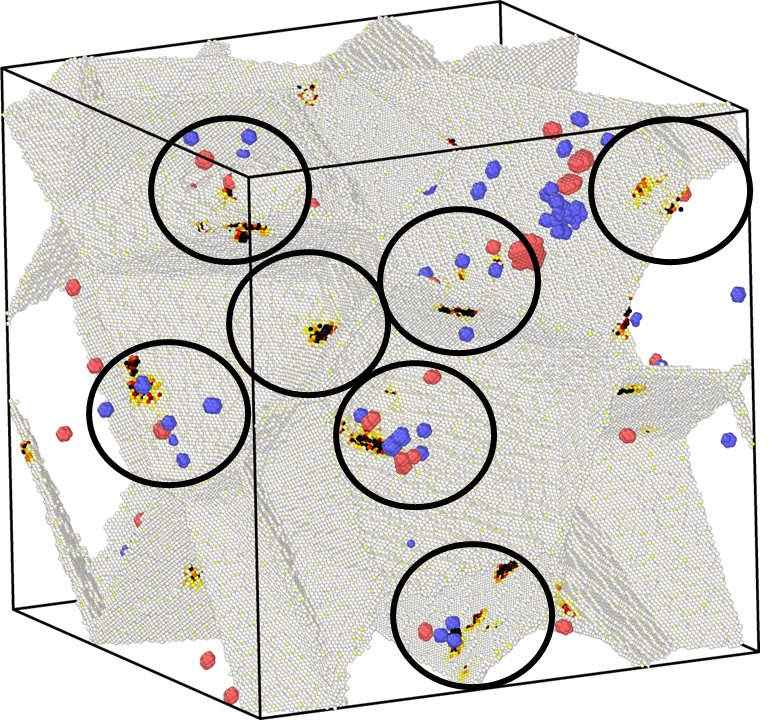
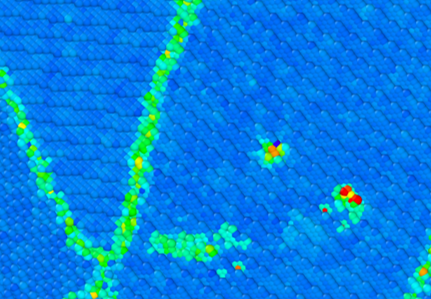
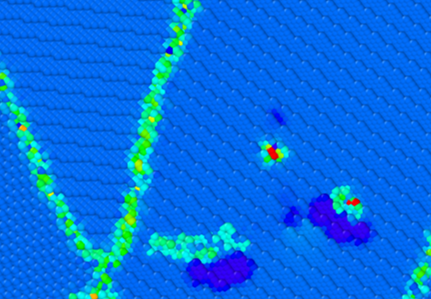
Let us now present the spatial and temporal evolution of the defects in the NC sample. The evolution of defects from the bulk of the nano-grains to the GBs can be seen in Fig. 11, where the GB network and defect clusters were plotted before (see Fig. 11(a)) and after the MXE simulation (see Fig. 11(b)). An animated evolution of these defects is shown in the Supplementary Video 3 for reference. As time went by, the defect clusters tended to diffuse to the GB network. By tracking the change in the site’s atomic molar fraction () in the GB network, we can identify those sites that are more likely to annihilate the vacancies from the bulk. Remarkably, only certain regions are responsible for annihilating the vacancies in the GB network (circled in Fig. 11). These regions are determined by several factors, including the distance between the GB and defect, chemical potential, and the geometrical arrangement of the sites.
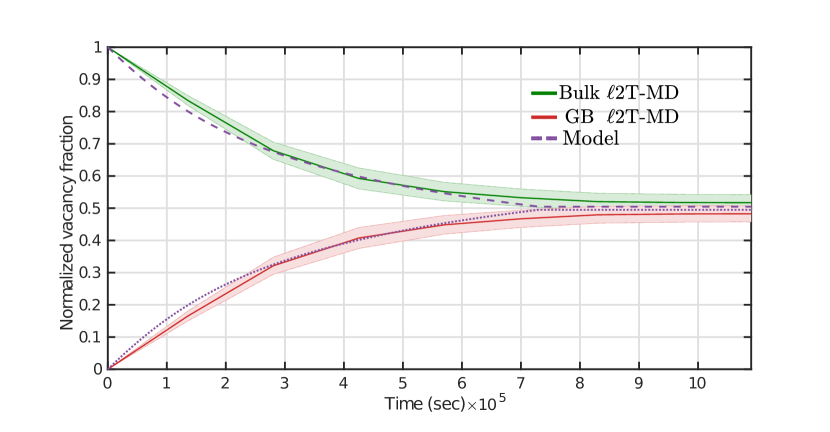
To better understand the mass exchange between the bulk of the nano-grains and the GB network, we plotted in Fig. 12 the time evolution of the vacancies during the MXE simulation for the bulk and GB of the cell. Initially, all vacancies were located inside the nano-grains, and the vacancies in the GB were zero. However, as diffusion was allowed in the sample, vacancies migrated from the bulk to the GB network. Only about 50% of the total vacancies in the nano-grains survived after the MXE simulation since vacancies were annihilated in the GB network. Of tremendous interest, the time evolution of the vacancies indicated a minimum of vacancies in the cell, and diffusion of mass stopped at around s. This effect is attributed to the collective behaviour of vacancy (or cluster of vacancies). Since the GB are amorphous, vacancies can migrate to the GBs and remove residual stresses, reducing the chemical potential gradient and the system’s free energy. However, this effect saturates when the chemical potential is in equilibrium. Hence, diffusion of vacancies reached a steady-state, as shown in Fig. 12 at the end of the simulation. A visual inspection of Fig. 11 indicates that the remaining vacancies were more or less clustered in the sample, indicating much larger defects than individual vacancy sites, which, ultimately, slows down the diffusion of these surviving clusters.
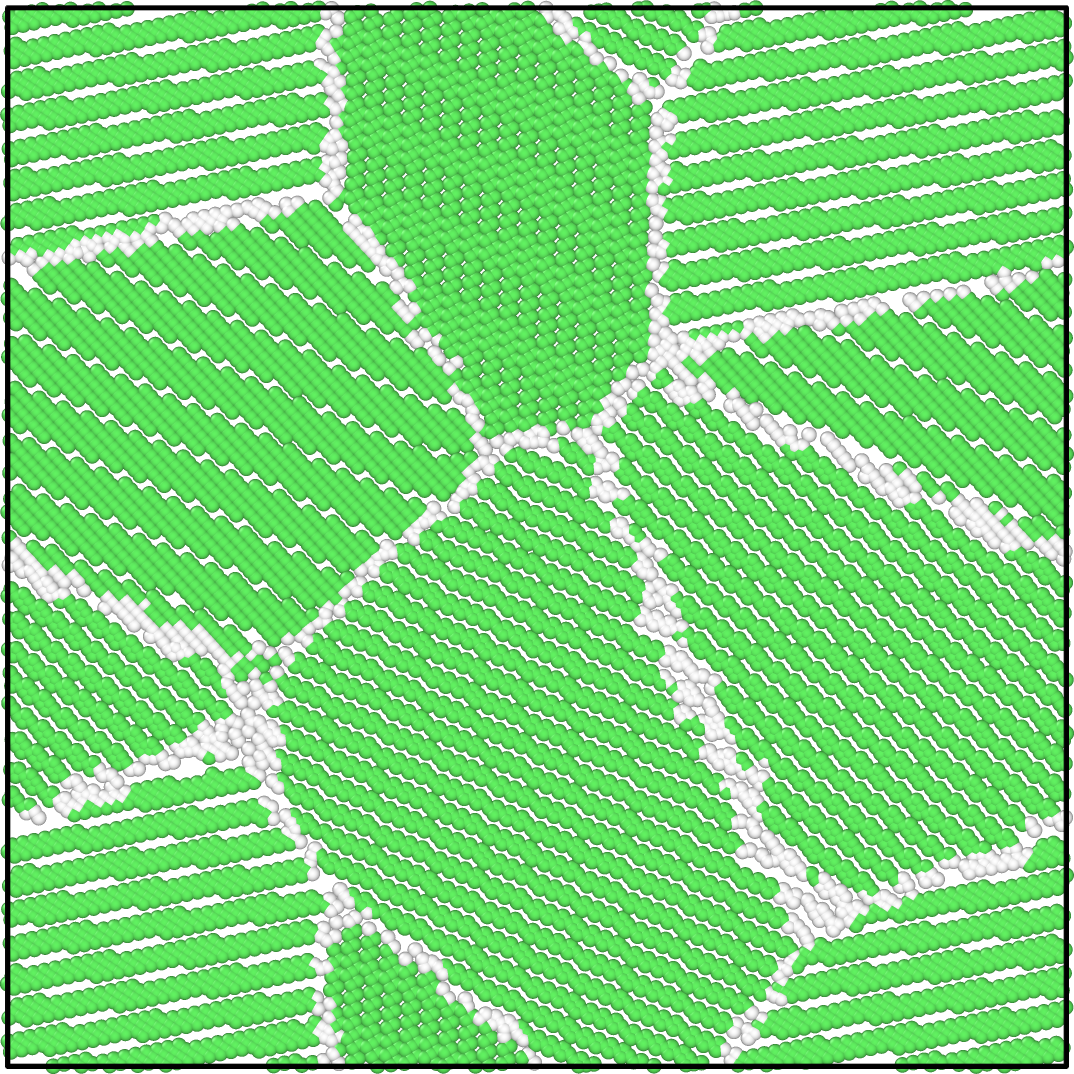
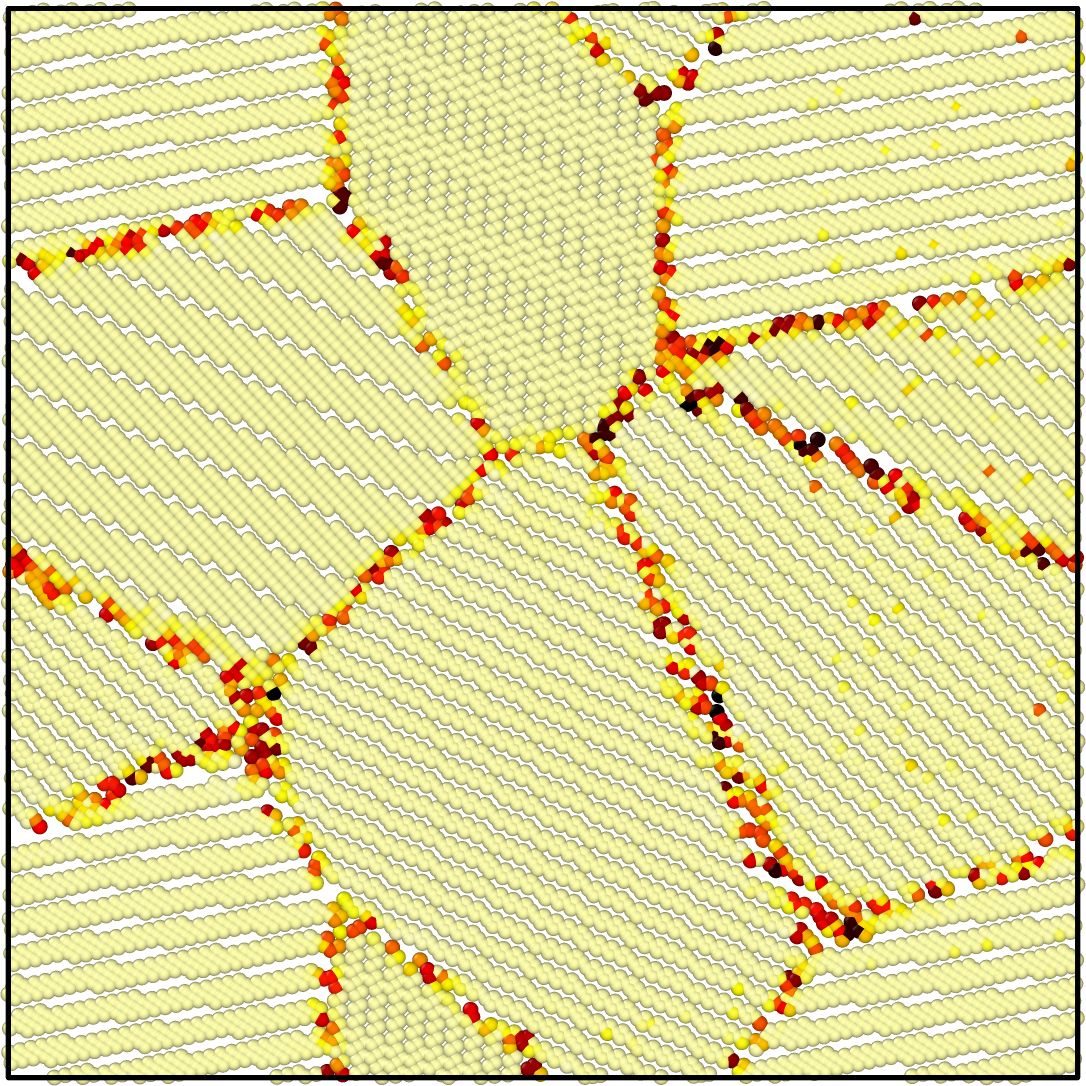
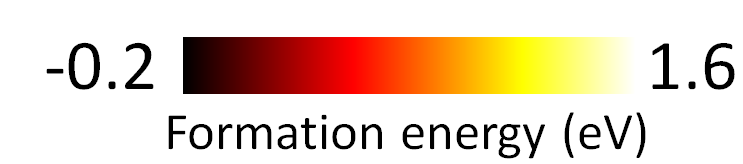
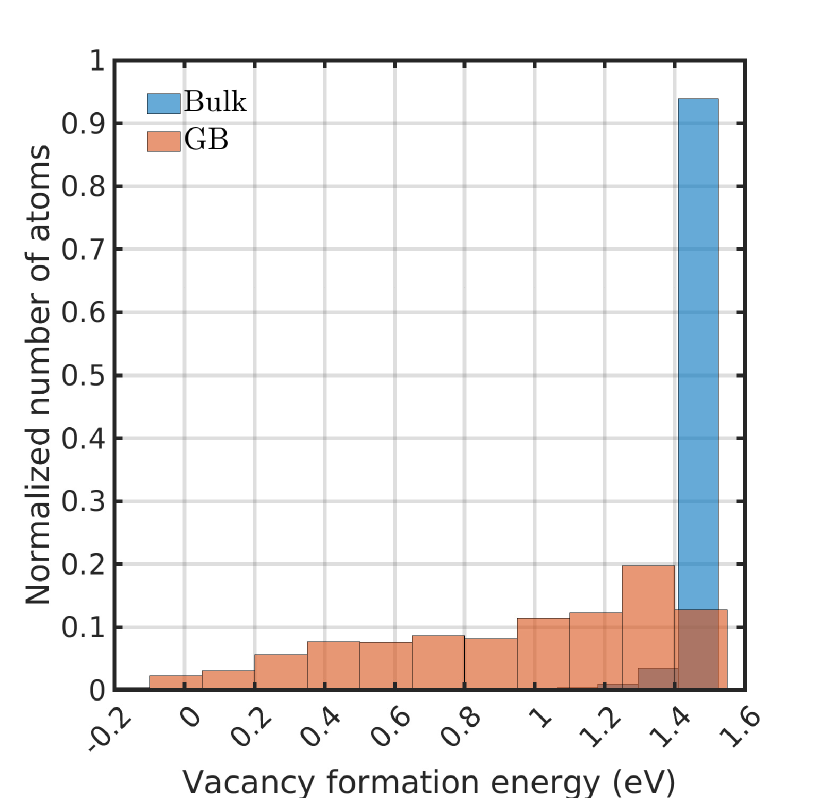
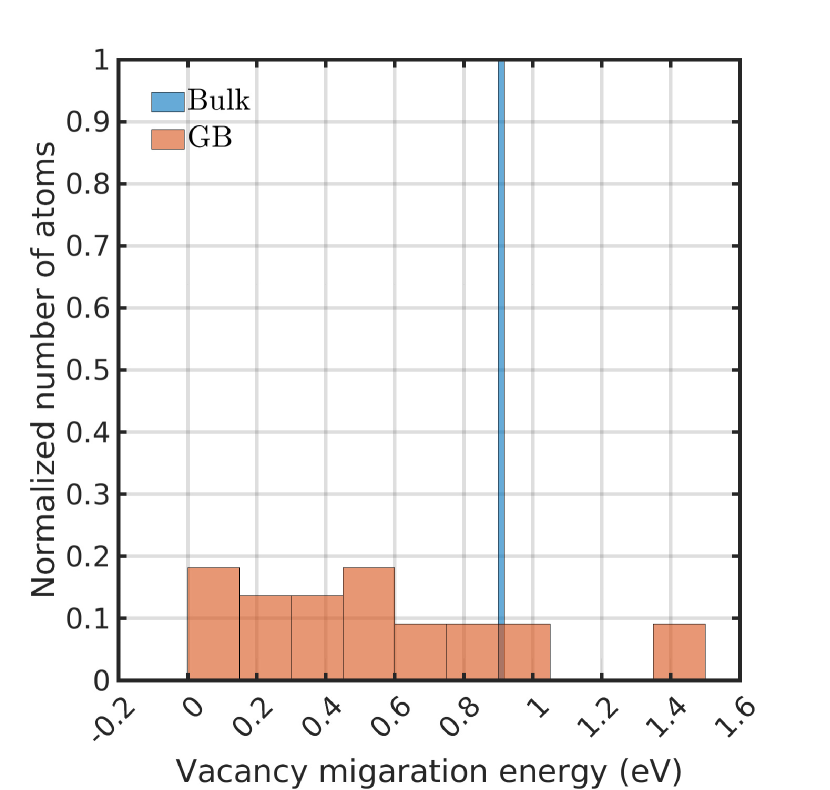
To elucidate the effect of the GB and their interaction with vacancies, we investigated the formation and migration energy of a slab with thickness of the NC sample, shown in Fig. 13. Figure 13(a) shows the arrangement of the atoms in the sample with atoms in the bulk (green) and the GBs (white), while Fig. 13(b) shows the same slab but with atoms colored according to their formation energy. Besides some local fluctuations, the formation energy in the bulk is pretty homogeneous. The vacancy formation energy in the bulk was around eV (see Fig. 13(c)), with minor fluctuations in the sample due to the internal stresses that appeared due to the GBs. These values are in close agreement to previously published results [57]. At the GBs, however, the formation energy had a large spread, from eV, with the spatial distribution shown in Fig. 13(b) and the probability distribution function shown in Fig. 13(c). The analysis revealed that most of the sites in the GBs are energetically more favorable to create vacancies than the bulk. However, for some isolated sites, the formation energy was slightly higher than the bulk, suggesting that they are not favorable to annihilated vacancies.
To complete this picture, we also investigated the migration energy for the sites in the slab, as shown in Fig. 13(d). In the bulk, the migration energy was pretty stable and close to eV. On the other hand, for sites located in the GBs, the migration energy had a much more significant fluctuation. Most sites had migration energy oscillating between eV with a flat distribution, as shown in Fig. 13(d). Only a small percentage of atoms had much higher migration energy, i.e., eV, representing about 10% of all sites. Thus, the analysis indicated two effects that combine to explain the superior healing properties of NC materials. First, vacancies are prone to be annihilated in the GBs due to reduced formation energies in these sites, and this process reduces the energy in the NC cell. Secondly, a much smaller barrier for the migration of those vacancies in the GB network allows vacancies to diffuse to the most energetically favorable sites quickly. However, not all sites were more favorable for the annihilation of vacancies, and some sites also showed much higher migration energy. These effects combined with the slower diffusion of the cluster of vacancies generate a saturation effect for the annihilation of vacancies in the GBs, explaining the long-term behavior of vacancies presented in Fig. 12.
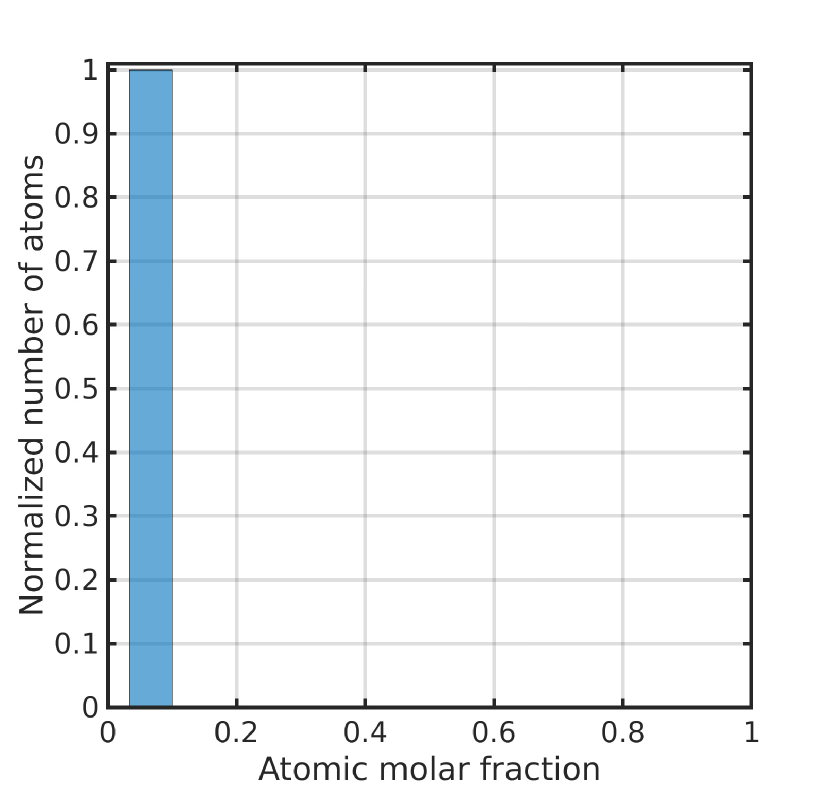
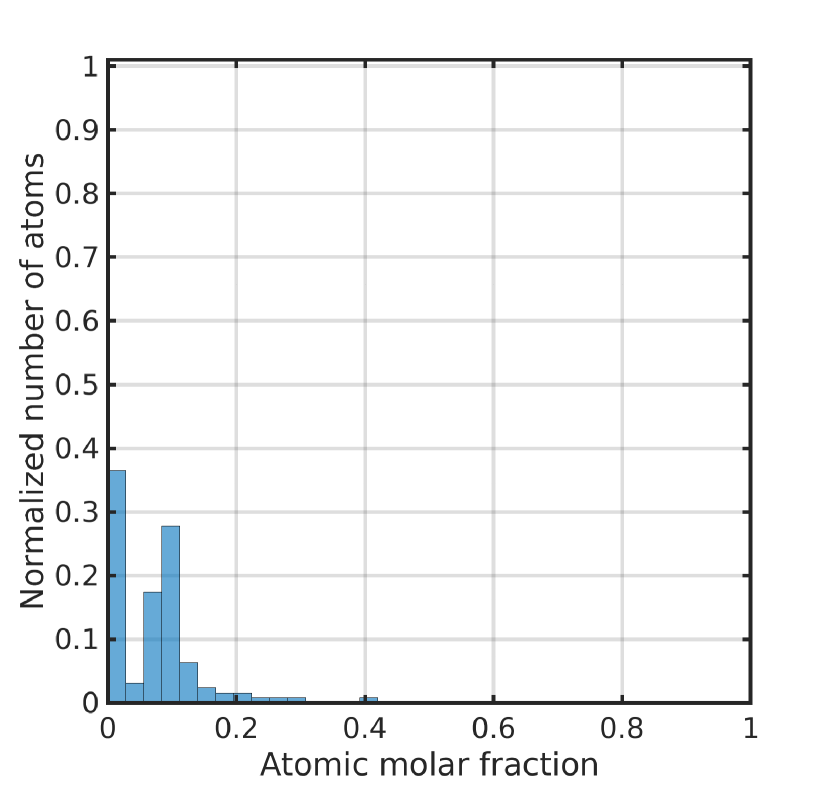
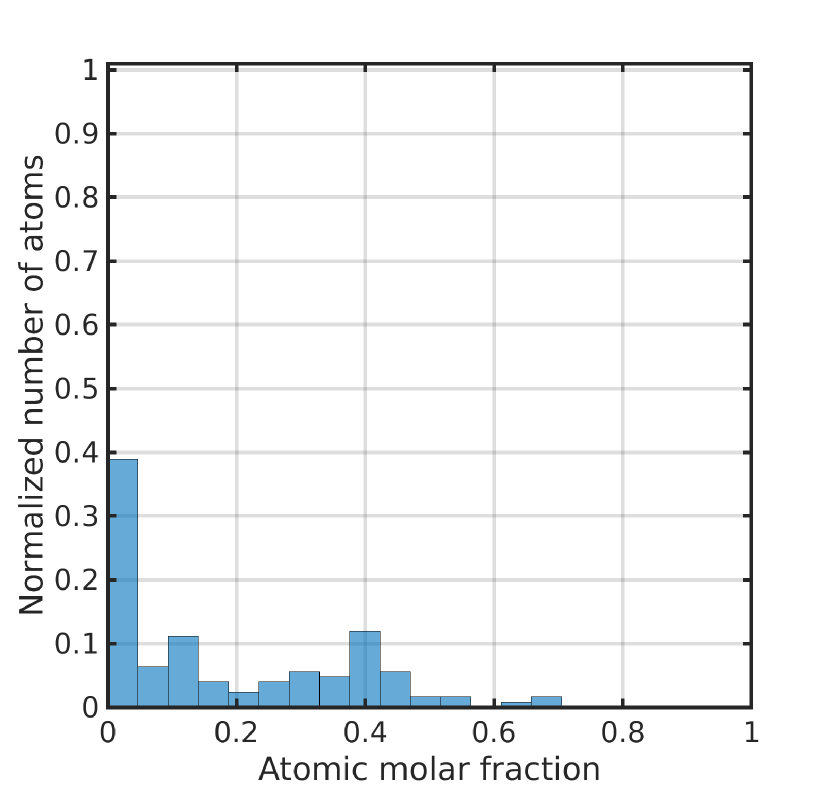
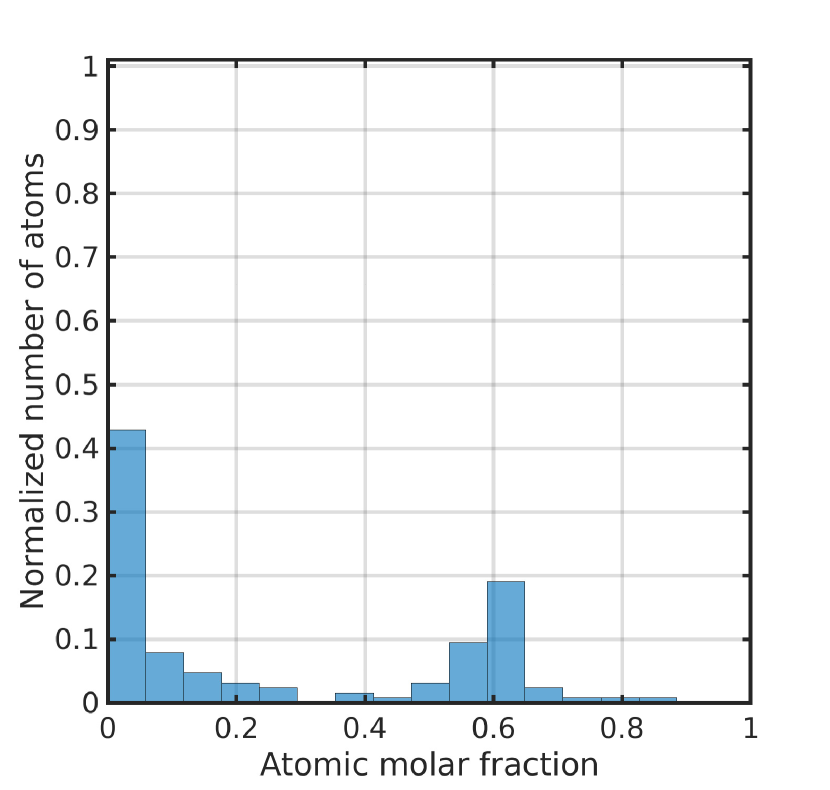
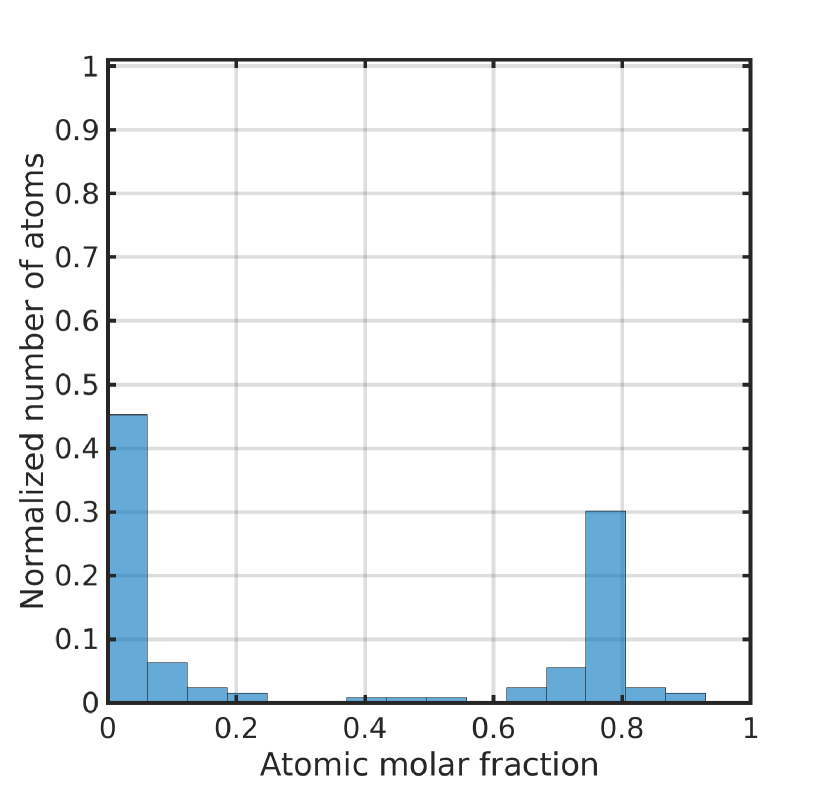
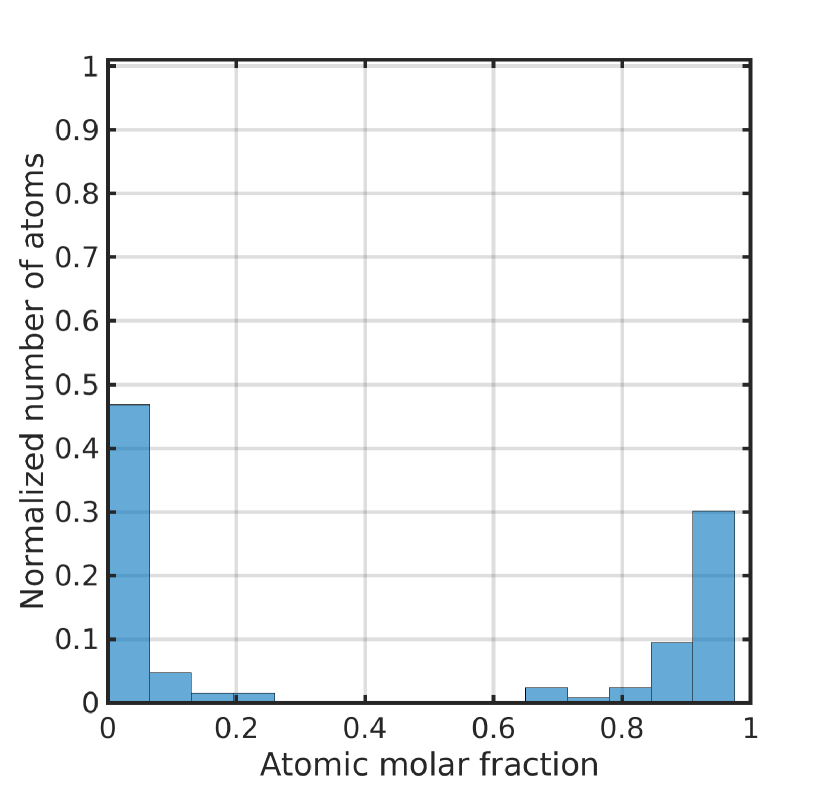
After studying the evolution of individual defects in detail with the MXE simulation, we describe the macroscopic evolution of the vacancies. We tracked down the spatial and temporal evolution of all vacancies after the PKA primary damage. This evolution is important to understand the collective behavior of vacancies in NC samples and help understand their behavior and develop coarse-grained models for continuum scale methods. Figure 14 shows the time evolution of the normalized number of vacancy atoms vs. the atomic molar fraction. Initially, all vacancy sites were placed in the bulk of the NC at different locations from the GBs network, and their distribution was similar to a delta Dirac function, as shown in Fig. 14(a). As diffusion was allowed during the MXE simulation, the atomic molar fraction for those atoms changed, as shown in the subsequent subfigures. Remarkably, after only 10% of the total simulated time, a subset of the sites representing about of the initial vacancies remained stable with very low atomic molar fractions (), as shown in Figs. 14(b) and (c). This group of sites represents the surviving vacancies in the simulation with very stable configurations. As a result, they showed very little change over time after that. The remaining portion of initial vacancy sites increased their concentration, as shown by the plots in Figs. 14(b)-(d). The atomic molar fraction’s increment for the sites containing single vacancies indicated that they were not energetically favorable, and their position changed with time. Thus, the vacant sites () originally located in the bulk of the NC transformed into occupied lattice sites (), and the vacancies were then homogeneously distributed across the GB network. This transition was not instantaneous, and a long time pass to obtain sites fully occupied. This behaviour is illustrated in Figs. 14(e)-(f) where most of the sites had either low () or high () atomic molar fractions. We also observed that the velocity at which these sites increased their atomic molar fraction was not constant, and there was a distribution that depended on multiple factors, including the local chemical potential, the internal stresses, and the geometrical features of the GB network.
A spatial representation of this process is illustrated in Fig. 15 where all FCC atoms were removed from the sample, GB atoms were colored in green, and vacancies with blue for better visualization. For completeness, an animated evolution of the defects analogous to Fig. 15 is presented in the Supplementary Video 4. As time went by, the atomic molar fraction of the vacancies changed with time indicated by the different colors of the original vacancy sites (cf. Fig 15(a) with Fig 15(b)). Most of the initial vacancies were removed at the end of the simulation, while another set of atoms remained with low atomic molar fractions, as shown in Fig 15(c). Remarkably, most of the surviving vacancies were clustered at several locations of the computational cell.
4 Discussions
Having presented the results obtained with the 2T-MD model and the MXE framework, we discuss the main results next. First, let us focus on the results obtained during the PKA simulations with traditional MD and 2T-MD. From the results presented in Section 3.1 it was evident that traditional MD simulations are not suitable to predict the number, shape, and size of defects induced from the PKA simulations even at low recoil energies, i.e., keV. This finding is consistent with several other studies where radiation-induced damage has been investigated in SC and NC materials [32, 36, 37, 26, 38]. The difference between MD and MD with electronic effects (including SRIM and 2T-MD) was noticeable in many aspects, including the transient and surviving number of FPs, in the number of defected atoms found in the simulations, and in the dislocation density. The differences in these values increase with the recoil energy and could reach differences of 50% or more in several metrics (such as dislocation density and number of FPs). The differences between MD and 2T-MD are due to two effects included in the 2T-MD model. First, the electronic subsystem can quickly exchange energy with the lattice and possesses heat capacity (), allowing it to absorb energy from the PKA very quickly. Second, the electronic subsystem is allowed to dissipate energy by heat conduction, and the thermal conductivity of the electronic subsystem is much faster than the lattice. Thus, the combination of a strong coupling between electrons and phonons (through the electron-phonon constant, in Eq. 1), heat capacity (), and heat conduction (via in Eq. 1) results in a much faster energy dissipation than in MD.
Once the electronic effects were assessed in the PKA simulations using single crystals, we investigated the effect of NC samples in the effects of primary radiation damage in Section 3.2. We found that, independently of the PKA energy, the number of defective atoms around SIAs and the size of these clusters is always smaller in NC compared to single crystals. While for vacancy clusters, there is no significant difference in terms of number and size of the defects between SC and NC. Since interstitial atoms have much smaller migration energy than vacancies in bulk, they can quickly move through the NC [21, 23] to reach the GBs network since the boundaries are only a few nanometers apart. As a result, there are fewer interstitial atoms to recombine than in SC, resulting in smaller SIAs clusters and dislocation loops. An important outcome of the PKA simulations in NC samples was that the number of vacancies was not significantly reduced. Since vacancies have high migration energy ( eV, see Fig. 13(d)), they cannot quickly migrate to the GB network to be annihilated. Thus, only minor differences in the number of vacancies were observed between SC and NC during the PKA simulations.
The use of the MXE simulations allowed us to clarify this point further. In particular, we observed that after long-term behavior, vacancies were able to diffuse in the sample as detailed in Section 3.3. This long-term diffusion resulted in a drastic reduction of the vacancies (cf. Fig. 9(a) and Fig. 9(b)). An interesting finding was that clusters containing less than defected atoms annihilated to the GBs with higher percentage compared to the larger clusters. This finding points out that there is a critical cluster size for thermal stability in the long-term behavior of NC samples. While smaller clusters can reduce their size and disappear due to thermal effects, larger ones are stable independently of the simulation time. This behavior agrees with the previous findings that the stability of vacancy clusters strongly varies depending on their size [74, 75]. Vacancies diffused to the GB network where they were annihilated as shown in Fig.11.
The diffusion of the defects (vacancies and interstitials) depends on the local chemical potential environment (), as indicated by the evolution of the Grand canonical free entropy given in Eq. 18 and via Eq. 20 for the time evolution of the atomic molar fractions. One of the advantages of the MXE framework is its ability to compute the local chemical potential at each site. To illustrate this feature, Fig. 16 shows the chemical potential for a slice of the NC sample before and after the MXE simulation. The GB network and the defects originated by the PKA have higher chemical potential relative to the atomic sites in bulk. These variations arise from the local atomic distortion of the NC and long-range elastic effects of point defects (see Fig. 16(a)). The chemical potential’s gradient is responsible for the diffusion dynamics modeled by Eq. 20. After the primary PKA damage, we also observed that the chemical potential for atoms in the bulk of the nano-crystals is relatively homogeneous but with some minor fluctuations.
Figure 16(b) shows the chemical potential map for the same slice as in Fig. 16(a) after the MXE simulation. We first noticed that the chemical potential for all atoms in bulk was homogenous, except near the GBs and surviving defects. However, a few subtle differences appeared after the MXE simulation. For instance, since most defects disappeared or reduced their sizes, the chemical potential showed much sharper gradients and contour. For surviving defects, the shape of the clusters changed to more energetically favorable shaped (more isotropic rather than anisotropic).
Once vacancies reached the GB network, they can quickly diffuse to the most energetically favorable sites since their migration energy is much smaller than the bulk, as shown in Fig. 13(c) and Fig. 13(d). In the analysis of the vacancy formation and migration energy, we observed that most of the sites in the GB network are more favorable to generate vacancies than the bulk of the NC. At the same time, the vast majority of the sites possess smaller migration energy than the bulk, which ultimately facilitates a much faster diffusion. During the MXE simulation, most of the vacancies in NC are quickly annihilated in the GB network. However, this process reached a saturation point, where several stable vacancies remained in the NC sample. This behavior is attributed to the collective behavior of vacancies and their formation and migration energy. First, most of the surviving defects were clustered of vacancies, as shown in Fig. 15(c). These clusters of vacancies have much slower diffusivity than individual vacancies, which ultimately slowed down the annihilation of vacancies in the GB network [57]. At the same time, while most sites have favorable formation and migration energy, a small percentage of these sites have shown much higher formation and migration energy than the bulk. These unfavorable sites block the diffusion of defects and, in turn, reduce the chemical potential. Since the GB network has many alternative paths, the saturation point is reached slowly, as shown in Fig. 12.
The collective diffusive behavior of vacancies can be modeled using the information obtained from MXE. First, let denote the dimensionless concentration of vacancies in the bulk after the PKA simulation, where are the number of vacancies at time and are the number of vacancies at s, and by definition, . The evolution of vacancies can be described by
| (24) |
where is a characteristic time for vacancy diffusion to the GB. In the determination of the characteristic time, it was assumed that the shape of the grains is spherical, and therefore, is the grain size radius. is a diffusive velocity of vacancies. The radius of the grains can be estimated as , where is the number of grain in the cell. The diffusion velocity can be approximate with the use of the vacancy diffusivity, . To account for the saturation point of the vacancies, here we recur to the information obtained from MXE. A small portion of these defects remains stable due to their clustering. Thus, the diffusivity of such cluster shall be smaller than of a single vacancy (this could be either due to a reduced migration frequency or higher migration energy of the cluster), since the diffusion of these clusters involves collective motion of atoms, not individual ones.
To account for this effect, in Eq. 24 has to be modified to account for increasing migration energy as the vacancies are annihilated. Thus, the migration energy is changed as a function of the concentration. A trial and error procedure suggested , where , where is specified in Table 1. The quadratic term penalizes large changes in , allowing individual vacancies to migrate easily at the beginning of the diffusion. As decreases, increases rapidly, and so the characteristic time , which, in turn, reduces the rate of vacancy annihilation in the bulk. While the model predicts a continuous increment of the migration energy, we expect this increment to be discrete and much sharper than the modeled one. For instance, the migration energy of a double jump increases to 1.5 eV, while the migration energy of a triple jump is around 2.1 eV [57]. The comparison between this phenomenological model and the results obtained with MXE are shown in Fig. 12 with the dashed and dotted lines. In our simulation, was increased by about 5%, and we can already see that the system reaches a quasi-steady state. While the model does not exactly match the MXE results, it has all features of the results and the right trends. We also point out that other power laws can modify the migration energy to better match the MXE results.
The collective spatial and temporal evolution of vacancies have also been investigated, as shown in Fig. 14. We found that a delta Dirac function can represent the initial distribution of vacancies. However, as diffusion was allowed in the MXE simulation, we found two fascinating behavior of vacancies. First, some sites showed remarkable stability and quickly remained stable during the MXE simulation. These sites represented about of all vacancies generated by the PKA. However, the remaining vacancies sites increased their atomic molar fraction at different rates, and the time evolution of their probability density function was shown in Fig. 14. Remarkably, when the MXE simulation was stopped, these sites were fully occupied (), and a delta Dirac function represented their probability distribution function. This behavior resembles similarities with the evolution of probability density functions, mathematically described with the Fokker-Planck equation, similar to the one used to simulate heat and mass transport in this work.
5 Conclusions
We have presented a multiscale and multiphysics framework to simulate radiation-induced damage in nano-crystalline materials. The proposed framework includes electronic effects to simulate the fast interactions between the PKA, electrons, and phonons during radiation events, and the ability to simulate the post-PKA long-term diffusion of defects. These events span from a few fs to hours or days, and they can only be tackle with temporal multiscale frameworks. We found that electronic effects are essential during the PKA events, especially at moderate to high recoil energies. MD simulations that did not incorporate electronic effects overestimated the number and size of defected clusters and dislocation density. SC and NC materials have also been compared. Overall, we found that NC materials can absorb interstitials and vacancies in the GB network, showing a self-healing capability compared with materials with coarser grains. While both interstitials and vacancies are absorbed in the GB network, the time scale for these events is highly dissimilar. Most interstitial atoms were reabsorbed during the primary radiation damage due to the smaller formation and migration energies. Overall, the simulations performed with the MXE allowed us to elucidate the self-healing behavior of NC samples. We also found that this effect is, however, limited in the long term. Since a small percentage of vacancies were clustered after the PKA, the migration energy of these clusters is much higher than individual vacancies. In addition, a small percentage of atoms in the GB possessed higher vacancy formation and migration energies, slowing down diffusion until a saturation point was reached. About of all vacancies generated during the PKA remained stable in the NC sample.
The proposed multiscale framework can be used to investigate the effects of the grain size, geometry, and chemical composition in the radiation-induced damage in other nano-crystalline materials. For instance, multi-compositional element alloys, including medium and high-entropy alloys, could be investigated with the proposed framework. The authors actively pursue this research line.
6 Acknowledgements
We gratefully acknowledge the support from the Natural Sciences and Engineering Research Council of Canada (NSERC) through the Discovery Grant under Award Application Number 2016-06114, the New Frontiers in Research Fund (NFRFE-2019-01095), and the computational resources provided by Compute Canada and the Advanced Research Computing (ARC) at the University of British Columbia. M. H. gratefully acknowledges the Four Year Fellowship program granted by the Department of Mechanical Engineering at the University of British Columbia.
References
- [1] R. W. Grimes, R. J. M. Konings, and L. Edwards. Greater tolerance for nuclear materials. Nature materials, 7(9):683–685, 2008.
- [2] R. W. Grimes and W. J. Nuttall. Generating the option of a two-stage nuclear renaissance. Science, 329(5993):799–803, 2010.
- [3] A. E. Sand, J. Byggmästar, A. Zitting, and K. Nordlund. Defect structures and statistics in overlapping cascade damage in fusion-relevant bcc metals. Journal of Nuclear Materials, 511:64–74, 2018.
- [4] J. Marian, C. S. Becquart, C. Domain, S. L Dudarev, M. R. Gilbert, R. J Kurtz, D. R. Mason, K. Nordlund, A. E. Sand, L. Snead, et al. Recent advances in modeling and simulation of the exposure and response of tungsten to fusion energy conditions. Nuclear Fusion, 57(9):092008, 2017.
- [5] J. Dever, B. Banks, K. de Groh, and S. Miller. Degradation of spacecraft materials. In Handbook of environmental degradation of materials, pages 465–501. Elsevier, 2005.
- [6] B. D. Wirth, G. R. Odette, J. Marian, L. Ventelon, J. A. Young-Vandersall, and L. A. Zepeda-Ruiz. Multiscale modeling of radiation damage in fe-based alloys in the fusion environment. Journal of Nuclear Materials, 329-333:103–111, 2004. Proceedings of the 11th International Conference on Fusion Reactor Materials (ICFRM-11).
- [7] G. Ackland. Controlling radiation damage. Science, 327(5973):1587–1588, 2010.
- [8] Y. Zhang, K. Jin, H. Xue, C. Lu, R. J. Olsen, L. K. Beland, M. W. Ullah, S. Zhao, H. Bei, D. S. Aidhy, and et al. Influence of chemical disorder on energy dissipation and defect evolution in advanced alloys. Journal of Materials Research, 31(16):2363–2375, 2016.
- [9] F. Granberg, K. Nordlund, Mohammad W. Ullah, K. Jin, C. Lu, H. Bei, L. M. Wang, F. Djurabekova, W. J. Weber, and Y. Zhang. Mechanism of radiation damage reduction in equiatomic multicomponent single phase alloys. Phys. Rev. Lett., 116:135504, Apr 2016.
- [10] M. W. Ullah, A. Kuronen, K. Nordlund, F. Djurabekova, P. A. Karaseov, and A. I. Titov. Atomistic simulation of damage production by atomic and molecular ion irradiation in GaN. Journal of Applied Physics, 112(4):043517, 2012.
- [11] E. Zarkadoula, G. Samolyuk, Y. Zhang, and W. J. Weber. Electronic stopping in molecular dynamics simulations of cascades in 3C-SiC. Journal of Nuclear Materials, 540:152371, 2020.
- [12] T. D. Shen, S. Feng, M. Tang, J. A. Valdez, Y. Wang, and K. E. Sickafus. Enhanced radiation tolerance in nanocrystalline MgGa2O4. Applied physics letters, 90(26):263115, 2007.
- [13] S. Dey, J. W. Drazin, Y. Wang, J. A. Valdez, T. G. Holesinger, B. P. Uberuaga, and R. H. R. Castro. Radiation tolerance of nanocrystalline ceramics: insights from Yttria Stabilized Zirconia. Scientific reports, 5(1):1–9, 2015.
- [14] X. Zhang, K. Hattar, Y. Chen, and L. et al. Shao. Radiation damage in nanostructured materials. Progress in Materials Science, 96:217–321, 2018.
- [15] N. Nita, R. Schaeublin, and M. Victoria. Impact of irradiation on the microstructure of nanocrystalline materials. Journal of Nuclear Materials, 329:953–957, 2004.
- [16] G.M. Cheng, W.Z. Xu, Y.Q. Wang, A. Misra, and Y.T. Zhu. Grain size effect on radiation tolerance of nanocrystalline mo. Scripta Materialia, 123:90–94, 2016.
- [17] C. M. Barr, N. Li, B. L Boyce, and K. Hattar. Examining the influence of grain size on radiation tolerance in the nanocrystalline regime. Applied Physics Letters, 112(18):181903, 2018.
- [18] N. Nita, R. Schaeublin, M. Victoria, and R.Z. Valiev. Effects of irradiation on the microstructure and mechanical properties of nanostructured materials. Philosophical Magazine, 85(4-7):723–735, 2005.
- [19] Y. Chimi, A. Iwase, N. Ishikawa, M. Kobiyama, T. Inami, and S. Okuda. Accumulation and recovery of defects in ion-irradiated nanocrystalline gold. Journal of Nuclear Materials, 297(3):355–357, 2001.
- [20] M. Rose, A.G. Balogh, and H. Hahn. Instability of irradiation induced defects in nanostructured materials. Nuclear Instruments and Methods in Physics Research Section B: Beam Interactions with Materials and Atoms, 127-128:119–122, 1997. Ion Beam Modification of Materials.
- [21] X.-M. Bai, A. F. Voter, R. G. Hoagland, M. Nastasi, and B. P. Uberuaga. Efficient annealing of radiation damage near grain boundaries via interstitial emission. Science, 327(5973):1631–1634, 2010.
- [22] Miaomiao Jin, Penghui Cao, Sidney Yip, and Michael P Short. Radiation damage reduction by grain-boundary biased defect migration in nanocrystalline cu. Acta Materialia, 155:410–417, 2018.
- [23] D. Chen, J. Wang, T. Chen, and L. Shao. Defect annihilation at grain boundaries in -Fe. Scientific reports, 3(1):1–5, 2013.
- [24] J. Silcox and P. B. Hirsch. Direct observations of defects in quenched gold. Philosophical Magazine, 4(37):72–89, 1959.
- [25] B. D. Wirth, V. Bulatov, and T. Diaz De La Rubia. Atomistic simulation of stacking fault tetrahedra formation in Cu. Journal of nuclear materials, 283:773–777, 2000.
- [26] E. Zarkadoula, G. Samolyuk, and W. J. Weber. Effects of electron-phonon coupling and electronic thermal conductivity in high energy molecular dynamics simulations of irradiation cascades in nickel. Computational Materials Science, 162:156–161, 2019.
- [27] J. M. Ziman. Principles of the Theory of Solids. Cambridge University Press, 2 edition, 1972.
- [28] R. E. B. Makinson. The thermal conductivity of metals. In Mathematical Proceedings of the Cambridge Philosophical Society, volume 34 (3), pages 474–497. Cambridge University Press, 1938.
- [29] K. Nordlund, L. Wei, Y. Zhong, and R. S. Averback. Role of electron-phonon coupling on collision cascade development in Ni, Pd, and Pt. Physical Review B, 57(22):R13965, 1998.
- [30] Z. Lin, L. V. Zhigilei, and V. Celli. Electron-phonon coupling and electron heat capacity of metals under conditions of strong electron-phonon nonequilibrium. Physical Review B, 77(7):075133, 2008.
- [31] S. I. Anisimov, B. L. Kapeliovich, T. L. Perelman, et al. Electron emission from metal surfaces exposed to ultrashort laser pulses. Zh. Eksp. Teor. Fiz, 66(2):375–377, 1974.
- [32] D.M. Duffy and A.M. Rutherford. Including the effects of electronic stopping and electron–ion interactions in radiation damage simulations. Journal of Physics: Condensed Matter, 19(1):016207, 2006.
- [33] A. Tamm, G. Samolyuk, A. A. Correa, M. Klintenberg, A. Aabloo, and A. Caro. Electron-phonon interaction within classical molecular dynamics. Phys. Rev. B, 94:024305, Jul 2016.
- [34] A. Tamm, M. Caro, A. Caro, G. Samolyuk, M. Klintenberg, and A. A. Correa. Langevin dynamics with spatial correlations as a model for electron-phonon coupling. Phys. Rev. Lett., 120:185501, May 2018.
- [35] A. Tamm, M. Caro, A. Caro, and A. A. Correa. Role of electrons in collision cascades in solids. ii. molecular dynamics. Phys. Rev. B, 99:174302, May 2019.
- [36] E. Zarkadoula, G. Samolyuk, and W. J. Weber. Effects of electron–phonon coupling on damage accumulation in molecular dynamics simulations of irradiated nickel. Materials Research Letters, 7(12):490–495, 2019.
- [37] M. W. Ullah and M. Ponga. A new approach for electronic heat conduction in molecular dynamics simulations. Modelling and Simulation in Materials Science and Engineering, 27(7):075008, 2019.
- [38] M. W. Ullah, N. Sellami, A. Leino, H. Bei, Y. Zhang, and W. J. Weber. Electron-phonon coupling induced defect recovery and strain relaxation in ni and equiatomic nife alloy. Computational Materials Science, 173:109394, 2020.
- [39] J. Grossi, J. Kohanoff, and E. M. Bringa. MeV irradiation of tungsten nanowires: structural modifications. Materials Research Express, 7(5):055015, may 2020.
- [40] M. Ponga and D. Sun. A unified framework for heat and mass transport at the atomic scale. Modelling and Simulation in Materials Science and Engineering, 26(3):035014, 2018.
- [41] K. Nordlund. Historical review of computer simulation of radiation effects in materials. Journal of Nuclear Materials, 520:273–295, 2019.
- [42] J. A. Brinkman. On the nature of radiation damage in metals. Journal of Applied Physics, 25(8):961–970, 1954.
- [43] A. F. Voter. Hyperdynamics: Accelerated molecular dynamics of infrequent events. Physical Review Letters, 78(20):3908, 1997.
- [44] M. R. Sørensen and A. F. Voter. Temperature-accelerated dynamics for simulation of infrequent events. The Journal of Chemical Physics, 112(21):9599–9606, 2000.
- [45] A. F. Voter. Parallel replica method for dynamics of infrequent events. Physical Review B, 57(22):R13985, 1998.
- [46] A. F. Voter. Introduction to the kinetic monte carlo method. In Radiation effects in solids, pages 1–23. Springer, 2007.
- [47] C. C. Battaile. The kinetic monte carlo method: Foundation, implementation, and application. Computer Methods in Applied Mechanics and Engineering, 197(41-42):3386–3398, 2008.
- [48] C-H. Huang, L. Gharaee, Y. Zhao, P. Erhart, and J. Marian. Mechanism of nucleation and incipient growth of re clusters in irradiated w-re alloys from kinetic monte carlo simulations. Phys. Rev. B, 96:094108, Sep 2017.
- [49] N. Moelans, B. Blanpain, and P. Wollants. An introduction to phase-field modeling of microstructure evolution. Calphad, 32(2):268–294, 2008.
- [50] J. R. Mianroodi, P. Shanthraj, P. Kontis, J. Cormier, B. Gault, B. Svendsen, and D. Raabe. Atomistic phase field chemomechanical modeling of dislocation-solute-precipitate interaction in NiAlCo. Acta Materialia, 175:250–261, 2019.
- [51] J. Li, S. Sarkar, W. T. Cox, T. J. Lenosky, E. Bitzek, and Y. Wang. Diffusive molecular dynamics and its application to nanoindentation and sintering. Physical Review B, 84(5):054103, 2011.
- [52] G. Venturini, K. Wang, I. Romero, M.P. Ariza, and M. Ortiz. Atomistic long-term simulation of heat and mass transport. Journal of the Mechanics and Physics of Solids, 73:242–268, 2014.
- [53] E. Dontsova, J. Rottler, and C.W. Sinclair. Solute-defect interactions in al-mg alloys from diffusive variational gaussian calculations. Physical Review B, 90(17):174102, 2014.
- [54] J.P. Mendez, M. Ponga, and M. Ortiz. Diffusive molecular dynamics simulations of lithiation of Silicon nanopillars. Journal of the Mechanics and Physics of Solids, 115:123–141, 2018.
- [55] J. P. Mendez and M. Ponga. MXE: A package for simulating long-term diffusive mass transport phenomena in nanoscale systems. Computer Physics Communications, 260:107315, 2021.
- [56] J. Hohlfeld, S-S. Wellershoff, J. Güdde, U. Conrad, V. Jähnke, and E. Matthias. Electron and lattice dynamics following optical excitation of metals. Chemical Physics, 251(1-3):237–258, 2000.
- [57] M García Ortega, SB Ramos de Debiaggi, and AM Monti. Self-diffusion in FCC metals: static and dynamic simulations in aluminium and nickel. Physica Status Solidi (b), 234(2):506–521, 2002.
- [58] SB Debiaggi, PM Decorte, and AM Monti. Diffusion by vacancy mechanism in Ni, Al, and Ni3Al: Calculation based on many-body potentials. Physica Status Solidi (b), 195(1):37–54, 1996.
- [59] L.D. Landau and E.M. Lifshitz. Statistical Physics, volume Volume 5. Elsevier Science, 2013.
- [60] S. Plimpton. Fast parallel algorithms for short-range molecular dynamics. Journal of Computational Physics, 117(1):1–19, 1995.
- [61] G. Bonny, N. Castin, and D. Terentyev. Interatomic potential for studying ageing under irradiation in stainless steels: the FeNiCr model alloy. Modelling and Simulation in Materials Science and Engineering, 21(8):085004, 2013.
- [62] M. Chamani, G.H. Farrahi, and M.R. Movahhedy. Molecular dynamics simulation of nanoindentation of nanocrystalline Al/Ni multilayers. Computational Materials Science, 112:175–184, 2016.
- [63] A. Hasnaoui, P.M. Derlet, and H. Van Swygenhoven. Interaction between dislocations and grain boundaries under an indenter–a molecular dynamics simulation. Acta Materialia, 52(8):2251–2258, 2004.
- [64] James A Stewart, G Brookman, P Price, Manual Franco, Wei Ji, K Hattar, and R Dingreville. Characterizing single isolated radiation-damage events from molecular dynamics via virtual diffraction methods. Journal of Applied Physics, 123(16):165902, 2018.
- [65] Cheng-Wei Lee, James A. Stewart, Rémi Dingreville, Stephen M. Foiles, and André Schleife. Multiscale simulations of electron and ion dynamics in self-irradiated silicon. Phys. Rev. B, 102:024107, Jul 2020.
- [66] James F. Ziegler, M.D. Ziegler, and J.P. Biersack. Srim – the stopping and range of ions in matter (2010). Nuclear Instruments and Methods in Physics Research Section B: Beam Interactions with Materials and Atoms, 268(11):1818–1823, 2010. 19th International Conference on Ion Beam Analysis.
- [67] James F Ziegler. Srim-2003. Nuclear instruments and methods in physics research section B: Beam interactions with materials and atoms, 219:1027–1036, 2004.
- [68] Alexander Stukowski. Visualization and analysis of atomistic simulation data with OVITO-the Open Visualization Tool. Modelling and simulation in materials science and engineering, 18(1), JAN 2010.
- [69] Alexander Stukowski, Vasily V Bulatov, and Athanasios Arsenlis. Automated identification and indexing of dislocations in crystal interfaces. Modelling and Simulation in Materials Science and Engineering, 20(8):085007, 2012.
- [70] E. Zarkadoula, S.L. Daraszewicz, D. M Duffy, M.A. Seaton, I. T Todorov, K. Nordlund, M. T. Dove, and K. Trachenko. Electronic effects in high-energy radiation damage in iron. Journal of Physics: Condensed Matter, 26(8):085401, 2014.
- [71] Eva Zarkadoula, Dorothy M Duffy, Kai Nordlund, Michael A Seaton, Ilian T Todorov, William J Weber, and Kostya Trachenko. Electronic effects in high-energy radiation damage in tungsten. Journal of Physics: Condensed Matter, 27(13):135401, 2015.
- [72] Eva Zarkadoula, German Samolyuk, and William J Weber. Two-temperature model in molecular dynamics simulations of cascades in ni-based alloys. Journal of Alloys and Compounds, 700:106–112, 2017.
- [73] Eva Zarkadoula, German Samolyuk, Haizhou Xue, Hongbin Bei, and William J Weber. Effects of two-temperature model on cascade evolution in ni and nife. Scr. Mater, 124(6), 2016.
- [74] MR Gilbert, Z Yao, MA Kirk, ML Jenkins, and SL Dudarev. Vacancy defects in Fe: Comparison between simulation and experiment. Journal of nuclear materials, 386:36–40, 2009.
- [75] Stephen Taller and Gary S Was. Understanding bubble and void nucleation in dual ion irradiated T91 steel using single parameter experiments. Acta Materialia, 198:47–60, 2020.