Vol.0 (20xx) No.0, 000–000
22institutetext: Department of Physics, Visva-Bharati University, Santiniketan, Birbhum, 731235, India biswap@visva-bharati.ac.in
33institutetext: Department of Physics, Indian Institute of Science Education and Research Tirupati, Tirupati - 517507, Andhra Pradesh, India suman2reach@gmail.com
Received 20xx month day; accepted 20xx month day
Galaxy interactions in filaments and sheets: effects of the large-scale structures versus the local density
Abstract
The major interactions are known to trigger star formation in galaxies and alter their colour. We study the major interactions in filaments and sheets using the SDSS data to understand the influence of large-scale environments on the galaxy interactions. We identify the galaxies in filaments and sheets using the local dimension and also find the major pairs residing in these environments. The star formation rate and colour of the interacting galaxies as a function of pair separation are separately analyzed in filaments and sheets. The analysis is repeated for three volume limited samples covering different magnitude ranges. The major pairs residing in the filaments show a significantly higher star formation rate (SFR) and bluer colour than those residing in the sheets up to the projected pair separation of kpc. We observe a complete reversal of this behaviour for both the SFR and colour of the galaxy pairs having a projected separation larger than 50 kpc. Some earlier studies report that the galaxy pairs align with the filament axis. Such alignment inside filaments indicates anisotropic accretion that may cause these differences. We do not observe these trends in the brighter galaxy samples. The pairs in filaments and sheets from the brighter galaxy samples trace relatively denser regions in these environments. The absence of these trends in the brighter samples may be explained by the dominant effect of the local density over the effects of the large-scale environment.
keywords:
methods: data analysis — statistical — galaxies: interactions — evolution — cosmology: large scale structure of the universe1 Introduction
The present-day Universe is populated with myriad galaxies that are vast collections of star, gas, dust and dark matter. The galaxies are the fundamental units of the large-scale structures in the Universe. The early redshift surveys during the late seventies and early eighties demonstrate that the galaxies are distributed in a complex interconnected network surrounded by large empty regions (Gregory & Thompson 1978; Joeveer & Einasto 1978; Einasto, Joeveer, & Saar 1980; Zeldovich & Shandarin 1982; Einasto et al. 1984). The existence of this network of filaments, sheets and clusters encircled by numerous voids become more evident with the advent of modern galaxy redshift surveys (Stoughton et al. 2002; Colless et al. 2001). The role of the different geometric environments of the cosmic web (Bond, Kofman & Pogosyan 1996) on galaxy formation and evolution remains an active area of research since then.
The galaxies are believed to have formed via the cooling and condensation of the accreted neutral hydrogen gas at the centre of the dark matter halos (Rees & Ostriker 1977; Silk 1977; White & Rees 1978; Fall & Efstathiou 1980). The dark matter halos reside in different morphological environments of the cosmic web. Studies with the hydrodynamical simulations suggest that the filaments are dominated by gas in WHIM that accounts for more than of the baryonic budget in the Universe (Tuominen 2021; Galarraga-Espinosa et al. 2021). It has been suggested by a number of works that the filaments play a significant role in governing the gas accretion efficiency in the galaxies (Cornuault et al. 2016; Zhu, Zhang, & Feng 2022). The dark matter halos residing in filaments and sheets may have different gas accretion efficiency. An earlier analysis shows that the star forming blue galaxies have a more filamentary distribution than their red counterparts (Pandey & Bharadwaj 2008). The large-scale coherent patterns like sheets and filaments may play significant roles in the formation and evolution of galaxies.
The roles of environment on the formation and evolution of galaxies have been extensively studied in the literature (Oemler 1974; Davis & Geller 1976; Dressler 1980; Guzzo et al. 1997; Zehavi et al. 2002; Hogg et al. 2003; Blanton et al. 2003; Einasto et al. 2003; Goto et al. 2003; Kauffmann et al. 2004; Pandey & Bharadwaj 2006; Park et al. 2007; Mouhcine, Baldry & Bamford 2007; Pandey & Bharadwaj 2008; Porter et al. 2008; Bamford, Nichol & Baldry 2009; Cooper, Gallazzi, Newman & Yan 2010; Koyama et al. 2013; Pandey & Sarkar 2017; Sarkar & Pandey 2020; Bhattacharjee, Pandey & Sarkar 2020; Pandey & Sarkar 2020). The galaxies interact with their environment and other galaxies in their neighbourhood. It is well known that the galaxies in the high density regions have a lower star formation activity (Lewis et al. 2002; Gómez et al. 2003; Kauffmann et al. 2004). The quenching of star formation in high density regions can be induced by a host of mechanisms such as ram pressure stripping (Gunn & Gott 1972), galaxy harassment (Moore et al. 1996; Moore, Lake & Katz 1998), strangulation (Gunn & Gott 1972; Balogh, Navarro & Morris 2000), starvation (Larson, Tinsley & Caldwell 1980; Somerville & Primack 1999; Kawata & Mulchaey 2008) and gas loss through starburst, AGN or shock-driven winds (Cox et al. 2004; Murray, Quataert & Thompson 2005; Springel, Matteo & Hernquist 2005). A galaxy can also quench its star formation through different physical processes such as mass quenching (Birnboim & Dekel 2003; Dekel & Birnboim 2006; Kereš et al. 2005; Gabor et al. 2010), morphological quenching (Martig et al. 2009), bar quenching (Masters et al. 2010) and angular momentum quenching (Peng & Renzini 2020). The galaxy interactions on the other hand can trigger star formation activity in galaxies and alter their colour (Barton, Geller & Kenyon 2000; Lambas et al. 2008; Alonso et al. 2004; Nikolic, Cullen & Alexander 2004; Alonso et al. 2006; Woods, Geller & Barton 2006; Woods & Geller 2007; Barton et al. 2007; Ellison et al. 2008; Heiderman et al. 2009; Knapen & James 2009; Robaina et al. 2009; Ellison et al. 2010; Woods et al. 2010; Patton et al. 2011).
The density of the local environment is known to play a crucial role in deciding the galaxy properties and their evolution. However, the roles of the different morphological environments of the cosmic web on the formation and evolution of galaxies are less clearly understood. The sheets and filaments provide unique environments for galaxy formation and evolution. The different physical mechanisms triggering or quenching star formation in galaxies may be impacted differently in such environments. In this work, we consider the major interaction between galaxies in sheets and filaments. The major interaction between galaxies are known to trigger new star formation. The galaxy pairs are frequently observed in the denser regions. Both filaments and sheets represent overdense regions of the cosmic web and are expected to host a significant number of major galaxy pairs. The SFR of a galaxy is largely set by the available gas mass, which itself is modulated by inflows and outflows of gas (Dekel, Sari, & Coverino 2009; Davé, Finlator, & Oppenheimer 2011; Davé, Finlator, & Oppenheimer) 2012; Lilly et al. 2013). The interaction and mergers are transient events that can push galaxies out of equilibrium. The differences in the availability of gas and the accretion efficiency of the interacting galaxies in filaments and sheets may influence their physical properties.
This work aims to study the differences in the major galaxy interaction observed in sheets and filaments. Currently, SDSS (Stoughton et al. 2002) is the largest redshift survey with the reliable photometric and spectroscopic information of millions of galaxies in the nearby Universe. It provides us the unique opportunity to address such questions in a statistical manner. We construct a set of volume limited sample of galaxies in different luminosity range. We use the local dimension (Sarkar & Bharadwaj 2009) to identify the galaxies residing in sheets and filaments in the cosmic web. We then find the galaxy pairs residing in these environments and study their SFR and colour as a function of the projected pair separation.
We use both SFR and colour of the galaxies in major pairs for the present analysis. The enhancement or quenching of star formation in a galaxy can alter its colour. However, such changes require a much longer time scale. The effects of the tidal interactions in different environments can be captured more reliably if we use both SFR and colour for such studies.
The filaments are known to be somewhat denser region than the sheets. We also study the SFR and colour of the major pairs in environments with different local density and compare these finding to that observed for the different geometric environments.
We organize the paper as follows: we describe the data and the method of analysis in Section 2 and present the results and conclusions in Section 3.
2 Data and Method of Analysis
2.1 SDSS Data
The Sloan Digital Sky Survey (SDSS) (Stoughton et al. 2002) is currently the largest redshift survey. It uses a dedicated 2.5 m telescope at Apache Point Observatory in New Mexico to measure the spectra and images of millions of galaxies in five different bands over roughly one third of the sky. We download the SDSS data from the sixteenth data release of Sloan Digital Sky Survey (SDSS) (Ahumada et. al 2020) that are publicly available at SDSS Skyserver 111https://skyserver.sdss.org/casjobs/. We obtain the spectroscopic and photometric information of all the galaxies present within the region and . The spectroscopic and photometric information of the galaxies are obtained from the table. We use (Conroy et. al 2009) table to extract stellar mass and the star formation rate of the galaxies. These estimates are based on the Flexible Stellar Population Synthesis Models. The information of internal reddening for each galaxy is taken from table. The internal reddening are derived using the publicly available Gas and Absorption Line Fitting (GANDALF) (Sarzi et. al 2006) and Penalised PIXEL Fitting (pPXF) (Cappellari & Emsellem 2004). We set the while downloading our data to ensure that only the galaxies with best spectroscopic information are included in our analysis.
We find that the above mentioned properties are available for a total 350536 galaxies within the specified region. We restrict the band apparent magnitude to and construct three volume limited samples with r-band absolute magnitude range , , that correspond to redshift limits , and respectively. The total number of galaxies present in the three volume limited samples corresponding to , , are 21984, 69456 and 85745 respectively.
We separately identify all the galaxy pairs in our data by employing simultaneous cuts on the projected separation and the rest frame velocity difference. Any two galaxies with 150 kpc and 300 km/s are identified as a galaxy pair. A galaxy may appear in multiple pairs provided these conditions are satisfied. We allow this following Scudder et al. (2012) who showed that excluding the galaxies with multiple companion does not make any difference to their results. These cuts yield a total 24756 galaxy pairs present within the specific region of the sky chosen in our analysis.
We cross match the of the galaxies in the volume limited samples to that with the sample of identified galaxy pairs. The cross-matching respectively provides us with 2581, 5441 and 3039 galaxy pairs in the three volume limited samples corresponding to , and . We employ a further cut in the stellar mass ratio of the galaxy pairs. This reduces the number of available galaxy pairs to 2024, 5014 and 3002 in the three volume limited samples.
A significant number of close galaxy pairs can not be observed simply due to the finite aperture of the SDSS fibres. The spectra of two galaxies within cannot be acquired simultaneously (Strauss et. al 2002) which leads to under selection of galaxy pairs with angular separation closer than . We compensate this incompleteness effect by randomly culling of galaxies in pairs having angular separation (Patton & Atfield 2008; Ellison et al. 2008; Patton et al. 2011; Scudder et al. 2012).
After the culling, we are left with 737, 2203 and 1600 galaxy pairs in the three volume limited samples. We then identify only the major pairs in our samples by restricting the stellar mass ratio to . Finally, in the three volume limited samples, we have 387, 1409 and 1255 major galaxy pairs that are formed by 739, 2672 and 2432 galaxies respectively.
We use a CDM cosmological model with , and (Planck Collaboration et al 2018) for our analysis.
| Local dimension | Geometric environment |
|---|---|
2.2 Morphology of the local environment
The galaxies reside in various types of geometric environment of the cosmic web. We calculate the local dimension (Sarkar & Bharadwaj 2009) of each galaxy to quantify the morphology of its local environment. The local dimension of a galaxy is estimated from the number counts of galaxies within a sphere of radius centered on it. The number counts of galaxies within a given radius can be written as,
| (1) |
where is a proportionality constant and is the local dimension. For each galaxy, the radius of the sphere is varied over length scales . We consider only those galaxies for which there are at least 10 galaxies available within the two concentric spheres of radius and . The measured number counts within and are fitted to Equation 1 and the best fit values of A and are determined using a least-square fitting. We further estimate the goodness of each fit by measuring the associated per degrees of freedom. Only the fits with chi-square per degree of freedom are considered for our analysis (Sarkar & Pandey 2019). We set and for the present analysis. The local dimension characterizes the geometric environment around a galaxy. A finite range of local dimension is assigned to each type of morphological environment (Table 1). We classify the morphology of the surrounding environment of a galaxy based on these definition. The -type galaxies reside in one dimensional straight filament. A -type galaxy is embedded in a two-dimensional sheet-like environment and -type galaxies are expected to be surrounded by a homogeneous distribution in three-dimension. Besides, there can be intermediate local dimension values that may arise when the measuring sphere includes galaxies from multiple morphological environments. For instance, -type represents an intermediate environment between filaments and sheets.
2.3 Local density of environment
We estimate the local density of the environment of each galaxy using the distance to the nearest neighbour in three-dimension. The local density (Casertano & Hut 1985) around a galaxy is defined as,
| (2) |
where is the distance to the nearest neighbour and is the volume of the sphere associated with radius . We set and consider the nearest neighbour from each galaxy to compute the local density around it. The local density would be underestimated near the boundary of the survey volume. We also estimate the closest distance to the survey boundary from each galaxy and compare it with . We consider only those galaxies in our analysis for which . This discards all the galaxies near the survey boundary.
We determine the median local density of each samples of major pairs. Each sample is then divided into two subsamples based on its median density. We consider the pairs to be hosted in the high density regions if their local density lies above the median. Similarly the pairs in the low density regions are defined as those having a local density below the median value.
3 Results and Conclusions
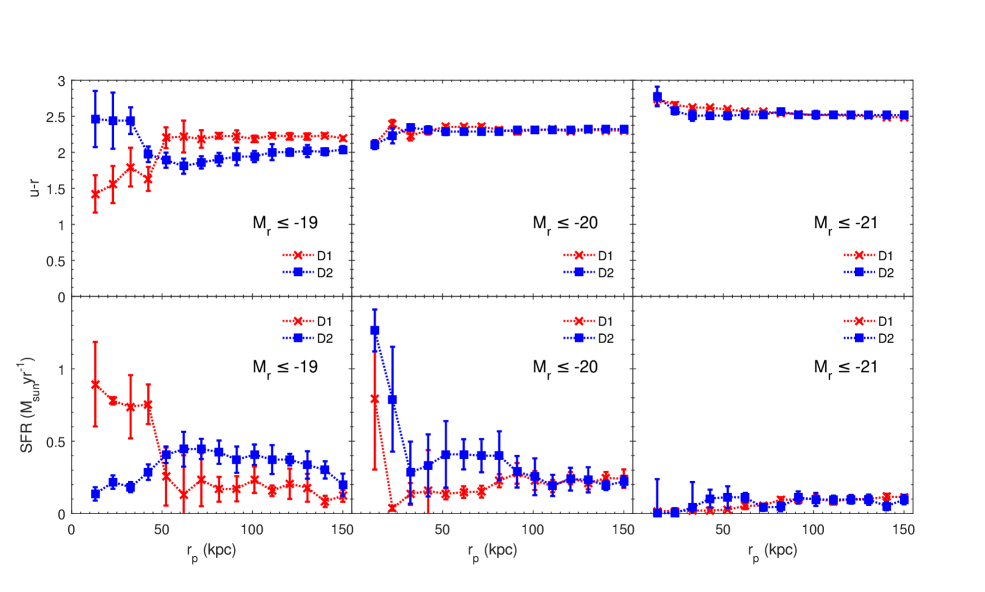
We show the cumulative median of the dust corrected colour for the major pairs as a function of the projected separation in sheets and filaments in the top left panel of Figure 1. The results in this panel shows that at smaller pair separation, the major galaxy pairs in the sheet-like structures are significantly redder compared to those residing in the filamentary environments. We find a crossover between the two curves at kpc beyond which the major pairs in filaments are redder than those embedded in the sheet-like structures. We repeat our calculations for the SFR in the major pairs in similar manner. The results are shown in the bottom left panel of Figure 1. We find that the major pairs with a projected separation kpc are more star forming in filaments compared to those hosted in the sheet-like environments. Interestingly, we also notice a reversal of this behaviour at kpc for SFR similar to that observed for the dust corrected colour. Again, the major pairs with a projected separation greater than 50 kpc are more star forming in sheets compared to those in filaments. The colour and star formation rate are strongly correlated due to the observed bimodality (Strateva et al. 2001; Baldry et al. 2004; Pandey 2020). A similarity in the results for colour and SFR are not surprising. However, the presence of the crossover at nearly the same length scale for both the properties is certainly interesting.
A number of earlier works find a statistically significant alignment of the galaxy pairs with their host filaments. Using the SDSS data, Tempel & Tamm (2015) find extra aligned pairs in filaments compared to a random distribution. A similar analysis of SDSS galaxy pairs in filaments by Mesa et al. (2018) confirms the alignment signal and suggests a stronger alignment closer to the filament spine. Such preferred alignment indicates an anisotropic accretion within the filaments. The interactions between the galaxies in the aligned pairs could be more effective in triggering new star formation. We propose that the trends observed in the top left and bottom left panels of Figure 1 may arise due to the preferred alignment of galaxy pairs inside filaments.
We repeat our analysis for volume limited samples constructed in two other magnitude bins. This would reveal any luminosity dependence of these results. The results for the magnitude bins and are respectively shown in the top/bottom middle and top/bottom right panels of Figure 1. Interestingly, the trends observed in the magnitude bin are not present in the brighter samples. The galaxy pairs in the filaments and sheets from the brighter galaxy samples trace the higher density regions in these structures. The star formation of galaxies are known to be suppressed in the high-density regions. The red galaxies usually have (Strateva et al. 2001). It is interesting to note that the cumulative median colour of the major pairs in the brighter samples are greater than at nearly all pair separation. This clearly indicates that the major pairs in the high density regions of the filaments and sheets are not effective in forming new stars. Both the local density and the large-scale environment are important in the formation and evolution of galaxies. But the local density is known to play a more dominant role. The absence of these trends in the brighter samples possibly indicates the dominance of the local density over the large-scale environment.
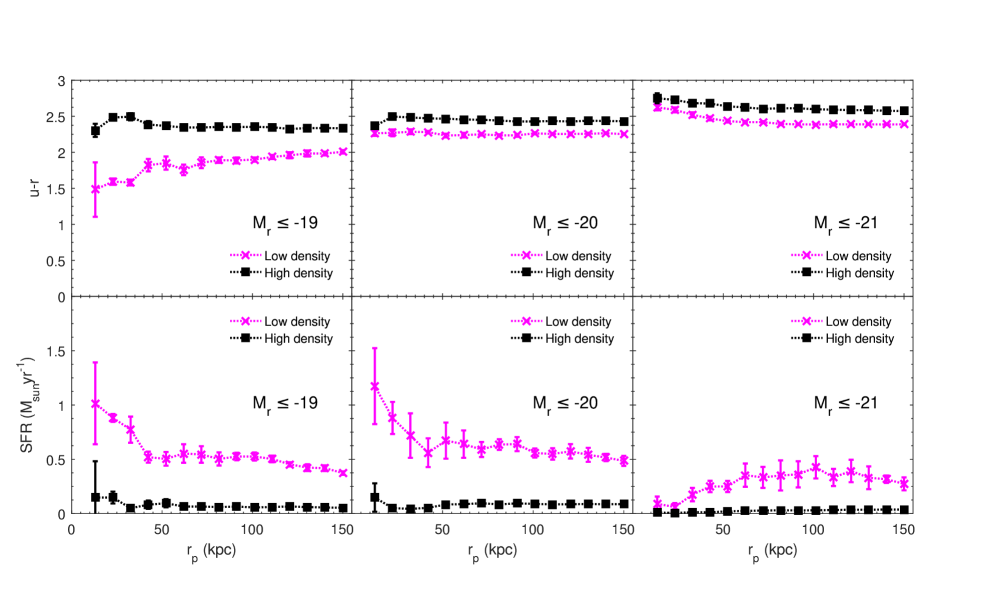
We separately study the effects of the local density in deciding the colour and SFR of the interacting major pairs. We split each samples of major pairs into two based on their median density. This provides us two sets of major pairs corresponding to low and high density regions. The results of this analysis are shown in Figure 2. The top/bottom left, top/bottom middle and top/bottom right panels of Figure 2 respectively show the results corresponding to magnitude bins , and . The results are qualitatively similar in the three magnitude bins. We note that at each pair separation, the cumulative median of the dust corrected colour and SFR of the major pairs are different in the low-density and high-density regions. The major pairs in the low density regions are more star forming and bluer as compared to their high-density counterparts. The differences in colour and SFR decrease with the increasing pair separation but no crossover is observed between the curves in any of the volume limited samples. The differences in colour and SFR persist at each projected pair separation upto 150 kpc for all three volume limited samples. This indicates that the local density and large-scale environments affect the galaxy interactions in noticeably different manner. We also note that the differences between the colour and SFR at each pair separation are significantly smaller for the brighter samples. The pairs in the brighter samples preferentially inhabit the denser regions. Consequently, the pairs in these samples have smaller differences in their local density.
| Magnitude bin | Major pairs in | ||||||
| 99% | 90% | 80% | 70% | 60% | |||
| D1, D2 type | 0.1323 | 0.1992 | 0.1498 | 0.1313 | 0.1192 | 0.1098 | |
| Low density, High density | 0.0743 | 0.1211 | 0.0910 | 0.0798 | 0.0724 | 0.0667 | |
| D1, D2 type | 0.0735 | 0.1031 | 0.0776 | 0.0680 | 0.0617 | 0.0568 | |
| Low density, High density | 0.0688 | 0.0646 | 0.0486 | 0.0426 | 0.0386 | 0.0356 | |
| D1, D2 type | 0.0747 | 0.1213 | 0.0912 | 0.0799 | 0.0726 | 0.0668 | |
| Low density, High density | 0.0899 | 0.0678 | 0.0510 | 0.0477 | 0.0406 | 0.0374 | |
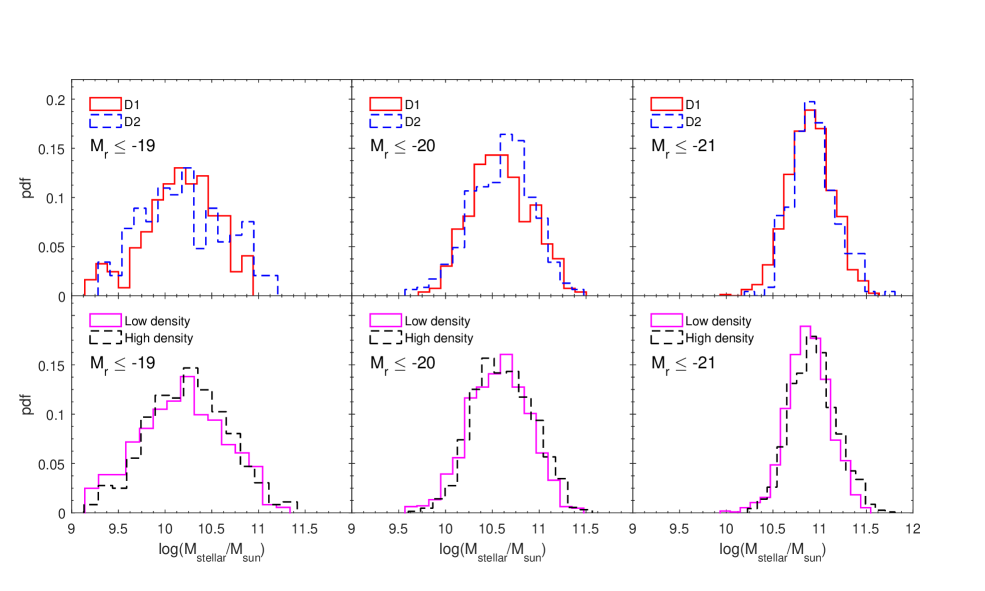
It is well known that the colour and SFR of galaxies are strongly correlated with the stellar mass. So the observed differences in the properties of interacting galaxies in different environments may also arise due to a difference in their stellar mass. We investigate this possibility by performing Kolmogorov-Smirnov (KS) test on the stellar mass distributions of the galaxy pairs in different environments. We compare the probability distribution function of the stellar mass for the major pairs residing in and -type environment in the top three panels of Figure 3. We carry out a similar comparison for the pairs in low and high-density regions in the three bottom panels of Figure 3. The results of the KS tests are summarized in Table 2. We find that the stellar mass distributions of the interacting galaxy pairs in and -type environments are not significantly different. The null-hypothesis can not be rejected at very high confidence level for all the three volume limited samples. So the observed differences in the colour and SFR of interacting galaxies in filaments and sheets do not originate from the differences in their stellar mass. However, the results of the KS test suggest that the stellar mass distributions of the galaxy pairs in the low-density and high-density regions are significantly different for the last two magnitude bins. So the stellar mass may have a role in causing the differences in the properties of the interacting galaxies in the low-density and high-density regions.
Generally, filaments are denser than sheets. So one would expect that the interacting galaxy pairs in filaments to be less star forming and redder than those residing in sheets. However we observe an exactly opposite trend in our analysis for the galaxy pairs with projected separation less than 50 kpc. This indicates that the local density and large-scale environments affect the galaxy interactions in noticeably different manner. The local density is known to play a more dominant role. The absence of the effects of large-scale environments in the brightest sample in our analysis possibly indicates the dominance of the local density over the large-scale environment. It is worth mentioning here that the effects of local-density and large-scale environment are coupled with each other. One may study the impact of the large-scale environment by conditioning the local environment and vice versa. However this drastically reduces the number of pairs available for this study. Another limitation of this study is that the three magnitude bins used here are not completely independent. This introduces some ambiguity in the interpretation of our results. We find that the use of the independent magnitude bins also drastically reduces the number of available pairs.
Our study clearly shows that the colour and SFR in the interacting galaxies are not only affected by the local density but also by their large-scale morphological environment. We note that the effects of the local density and the morphological environment are quite distinct from each other. We conclude that the large-scale structures such as filaments and sheets play a fundamental role on the outcomes of galaxy interactions. The present analysis only classifies the pairs based on their local density and local dimension. It would be interesting to carry out a similar analysis with a set of individual sheets and filaments. We plan to carry out such an analysis in a future work. This would help us to understand better the effects of alignment on galaxy interactions in filaments and sheets.
Acknowledgements.
The authors thank the SDSS team for making the data publicly available. BP would like to acknowledge financial support from the SERB, DST, Government of India through the project CRG/2019/001110. BP would also like to acknowledge IUCAA, Pune for providing support through associateship programme. SS acknowledges IISER Tirupati for support through a postdoctoral fellowship. Funding for the SDSS and SDSS-II has been provided by the Alfred P. Sloan Foundation, the Participating Institutions, the National Science Foundation, the U.S. Department of Energy, the National Aeronautics and Space Administration, the Japanese Monbukagakusho, the Max Planck Society, and the Higher Education Funding Council for England. The SDSS website is http://www.sdss.org/. The SDSS is managed by the Astrophysical Research Consortium for the Participating Institutions. The Participating Institutions are the American Museum of Natural History, Astrophysical Institute Potsdam, University of Basel, University of Cambridge, Case Western Reserve University, University of Chicago, Drexel University, Fermilab, the Institute for Advanced Study, the Japan Participation Group, Johns Hopkins University, the Joint Institute for Nuclear Astrophysics, the Kavli Institute for Particle Astrophysics and Cosmology, the Korean Scientist Group, the Chinese Academy of Sciences (LAMOST), Los Alamos National Laboratory, the Max-Planck-Institute for Astronomy (MPIA), the Max-Planck-Institute for Astrophysics (MPA), New Mexico State University, Ohio State University, University of Pittsburgh, University of Portsmouth, Princeton University, the United States Naval Observatory, and the University of Washington.References
- Ahumada et. al (2020) Ahumada, R., Allende Prieto, C., Almeida, A., Anders, F., Anderson, S. F., Andrews, B. H., Anguiano, B., et al., 2020, ApJS, 249, 3
- Alonso et al. (2004) Alonso, M. S., Tissera, P. B., Coldwell, G., Lambas, D. G., 2004, MNRAS, 352, 1081
- Alonso et al. (2006) Alonso, M. S., Lambas, D. G., Tissera, P., Coldwell, G., 2006, MNRAS, 367, 1029
- Alpaslan et. al (2014) Alpaslan, M. et al., 2014, MNRAS, 438, 177
- Baldry et al. (2004) Baldry, I. K., Glazebrook, K., Brinkmann, J., Ivezić, Ž., Lupton, R. H., Nichol, R. C. & Szalay, A. S., ApJ, 600, 681
- Balogh, Navarro & Morris (2000) Balogh, M. L., Navarro, J. F., & Morris, S. L., 2000, ApJ, 540, 113
- Bamford, Nichol & Baldry (2009) Bamford, S. P., Nichol, R. C., Baldry, I. K., et al., 2009, MNRAS, 393, 1324
- Barton et al. (2007) Barton, E. J., Arnold, J. A., Zentner, A. R., Bullock, J. S., Wechsler, R. H., 2007, ApJ, 671, 1538
- Barton, Geller & Kenyon (2000) Barton, E. J., Geller, M. J., Kenyon, S. J., 2000, ApJ, 530, 660
- Bhattacharjee, Pandey & Sarkar (2020) Bhattacharjee, S., Pandey, B., & Sarkar, S., 2020, JCAP, 2020, 039
- Birnboim & Dekel (2003) Birnboim Y., Dekel A., 2003, MNRAS, 345, 349
- Blanton et al. (2003) Blanton, M. R., et al., 2003, ApJ, 594, 186
- Bond, Kofman & Pogosyan (1996) Bond, J. R., Kofman, L., & Pogosyan, D., 1996, Nature, 380, 603
- Brinchmann et. al (2004) Brinchmann, J., Charlot, S., White, S. D. M., Tremonti, C., Kauffmann, G., Heckman, T., & Brinkmann, J., 2004, MNRAS,351, 1151
- Cappellari & Emsellem (2004) Cappellari, M., & Emsellem, E., 2004, PASP, 116, 138
- Casertano & Hut (1985) Casertano, S., & Hut, P., 1985, ApJ, 298, 80
- Colless et al. (2001) Colless M., Dalton G., Maddox S., Sutherland W., Norberg P., Cole S., Bland-Hawthorn J., et al., 2001, MNRAS, 328, 1039
- Conroy et. al (2009) Conroy, C., Gunn, J. E., & White, M., 2009, ApJ, 699, 486
- Cooper, Gallazzi, Newman & Yan (2010) Cooper, M. C., Gallazzi, A., Newman, J. A., Yan, R., 2010, MNRAS, 402, 1942
- Cornuault et al. (2016) Cornuault N., Lehnert M., Boulanger F., Guillard P., 2018, A&A, 610, A75
- Cox et al. (2004) Cox, T. J., Primack, J., Jonsson, P., & Somerville, R. S., 2004, ApJL, 607, L87
- Davé, Finlator, & Oppenheimer (2011) Davé R., Finlator K., Oppenheimer B. D., 2011, MNRAS, 416, 1354
- Galarraga-Espinosa et al. (2021) Galarraga-Espinosa, D., Aghanim, N., Langer, M., Tanimura, H., 2021, A&A, 649, A117
- Davé, Finlator, & Oppenheimer) (2012) Davé R., Finlator K., Oppenheimer B. D., 2012, MNRAS, 421, 98
- Davis & Geller (1976) Davis, M., & Geller, M.J., 1976, ApJ, 208, 13
- Dekel & Birnboim (2006) Dekel A., Birnboim Y., 2006, MNRAS, 368, 2
- Dekel, Sari, & Coverino (2009) Dekel, A., Sari, R., Coverino, D., 2009, ApJ, 703, 785
- Dressler (1980) Dressler, A., 1980, ApJ, 236, 351
- Einasto et al. (1984) Einasto J., Klypin A. A., Saar E., Shandarin S. F., 1984, MNRAS, 206, 529
- Einasto et al. (2003) Einasto, J., Hütsi, G., Einasto, M., Saar, E., Tucker, D. L., Müller, V., Heinämäki, P., & Allam, S. S. , 2003, A&A, 405, 425
- Einasto, Joeveer, & Saar (1980) Einasto J., Joeveer M., Saar E., 1980, MNRAS, 193, 353
- Ellison et al. (2008) Ellison, S. L., Patton, D. R., Simard, L., McConnachie, A. W., 2008, AJ, 135, 1877
- Ellison et al. (2010) Ellison, S. L., Patton, D. R., Simard, L., McConnachie, A. W.,Baldry, I. K., Mendel, J. T., 2010, MNRAS, 407, 1514
- Fall & Efstathiou (1980) Fall, S. M., & Efstathiou, G., 1980, MNRAS, 193, 189
- Gabor et al. (2010) Gabor J. M., Davé R., Finlator K., Oppenheimer B. D., 2010, MNRAS, 407, 749
- Gómez et al. (2003) Gómez, P. L., Nichol, R. C., Miller, C. J., Balogh, M. L., Goto, T., Zabludoff, A. I., Romer, A. K., et al., 2003, ApJ, 584, 210
- Goto et al. (2003) Goto, T., Yamauchi, C., Fujita, Y., Okamura, S., Seikiguchi, M., Smail, I., Bernardi, M.,& Gomez, P.L., 2003, MNRAS, 346, 601
- Gregory & Thompson (1978) Gregory S. A., Thompson L. A., 1978, ApJ, 222, 784
- Gunn et. al (1998) Gunn, J. E., Carr, M., Rockosi, C., Sekiguchi, M., Berry, K., Elms, B., de Haas, E., et al., 1998, AJ, 116, 3040
- Gunn et. al (2006) Gunn, J. E., Siegmund, W. A., Mannery, E. J., Owen, R. E., Hull, C. L., Leger, R. F., Carey, L. N., et al., 2006, AJ, 131, 2332
- Gunn & Gott (1972) Gunn, J. E., & Gott, J. R., 1972, ApJ, 176, 1
- Guzzo et al. (1997) Guzzo, L., Strauss, M.A., Fisher,K.B., Giovanelli, R., & Haynes, M.P., 1997, ApJ, 489, 37
- Heiderman et al. (2009) Heiderman, A., Jogee, S., Marinova, I., van Kampen, E., Barden, M., Peng, C. Y., Heymans, C. et al., 2009, ApJ, 705, 1433
- Hogg et al. (2003) Hogg D. W., Blanton M. R., Eisenstein D. J., Gunn J. E., Schlegel D. J., Zehavi I., Bahcall N. A., et al., 2003, ApJL, 585, L5
- Joeveer & Einasto (1978) Joeveer M., Einasto J., 1978, IAUS, 79, 241
- Jones, van de Weygaert, & Aragón-Calvo (2010) Jones B. J. T., van de Weygaert R., Aragón-Calvo M. A., 2010, MNRAS, 408, 897
- Kauffmann et al. (2004) Kauffmann, G., White, S. D. M., Heckman, T. M., et al., 2004, MNRAS, 353, 713
- Kawata & Mulchaey (2008) Kawata, D., & Mulchaey, J. S., 2008, ApJL, 672, L103
- Kereš et al. (2005) Kereš D., Katz N., Weinberg D. H., Davé R., 2005, MNRAS, 363, 2
- Knapen & James (2009) Knapen, J. H., James, P. A., 2009, ApJ, 698, 1437
- Koyama et al. (2013) Koyama, Y., Smail, I., Kurk, J., et al., 2013, MNRAS, 434, 423
- Lambas et al. (2008) Lambas D. G., Tissera, P. B., Alonso, M. S., Coldwell, G., 2008, MNRAS, 346, 1189
- Larson, Tinsley & Caldwell (1980) Larson, R. B., Tinsley, B. M., & Caldwell, C. N., 1980, ApJ, 237, 692
- Lee & Erdogdu (2007) Lee J., Erdogdu P., 2007, ApJ, 671, 1248
- Lee & Pen (2002) Lee J., Pen U.-L., 2002, ApJL, 567, L111
- Lewis et al. (2002) Lewis, I., Balogh, M., Propris, R. De., Couch, W., Bower, R., Offer, A., Bland-Hawthorn, J., et al., 2002, MNRAS, 334, 673
- Lilly et al. (2013) Lilly S. J., Carollo C. M., Pipino A., Renzini A., Peng Y., 2013, ApJ, 772, 119L
- Martig et al. (2009) Martig M., Bournaud F., Teyssier R., Dekel A., 2009, ApJ, 707, 250
- Masters et al. (2010) Masters K. L., Mosleh M., Romer A. K., Nichol R. C., Bamford S. P., Schawinski K., Lintott C. J., et al., 2010, MNRAS, 405, 783
- Mesa et al. (2018) Mesa V., Duplancic F., Alonso S., Muñoz Jofré M. R., Coldwell G., Lambas D. G., 2018, A&A, 619, A24
- Moore et al. (1996) Moore, B., Katz, N., Lake, G., Dressler, A., & Oemler, A., 1996, Nature, 379, 613
- Moore, Lake & Katz (1998) Moore, B., Lake, G., & Katz, N., 1998, ApJ, 495, 139
- Mouhcine, Baldry & Bamford (2007) Mouhcine, M., Baldry, I. K., & Bamford, S. P., 2007, MNRAS, 382, 801
- Murray, Quataert & Thompson (2005) Murray, N., Quataert, E., & Thompson, T. A., 2005, ApJ, 618, 569
- Nikolic, Cullen & Alexander (2004) Nikolic, B., Cullen, H., Alexander, P., 2004, MNRAS, 355, 874
- Oemler (1974) Oemler, A., 1974, ApJ, 194, 1
- Pandey & Bharadwaj (2006) Pandey, B.,& Bharadwaj, S., 2006, MNRAS, 372, 827
- Pandey & Bharadwaj (2008) Pandey, B., & Bharadwaj, S., 2008, MNRAS, 387, 767
- Pandey & Sarkar (2017) Pandey, B., & Sarkar, S., 2017, MNRAS, 467, L6
- Pandey & Sarkar (2020) Pandey, B., & Sarkar, S., 2020, MNRAS, 498, 6069
- Pandey (2020) Pandey B., 2020, MNRAS, 499, L31
- Park et al. (2007) Park C., Choi Y.-Y., Vogeley M. S., Gott J. R., Blanton M. R., SDSS Collaboration, 2007, ApJ, 658, 898
- Patton et al. (2000) Patton, D. R., Carlberg, R. G., Marzke, R. O., Pritchet, C. J., da Costa, L. N., Pellegrini, P. S., 2000, ApJ, 536, 153
- Patton et al. (2011) Patton, D. R., Ellison, S. L., Simard, L., McConnachie, A. W., Mendel, J. T., 2011, MNRAS, 412, 591
- Patton & Atfield (2008) Patton, D. R. & Atfield, J. E., 2008, ApJ, 685, 235
- Peng & Renzini (2020) Peng Y.-. jie ., Renzini A., 2020, MNRAS, 491, L51
- Planck Collaboration et al (2018) Planck Collaboration, Aghanim, N., Akrami, Y., Ashdown, M., Aumont, J., Baccigalupi, C., Ballardini, M., et al., 2018, A&A, 641, A6
- Porter et al. (2008) Porter, S. C., Raychaudhury, S., Pimbblet, K. A., Drinkwater, M. J., 2008, MNRAS, 388, 1152
- Propris et al. (2007) Propris, R. De, Conselice, C. J., Liske, J., Driver, S. P., Patton, D. R., Graham, A. W., Allen, P. D., et al., 2007, ApJ, 666, 212
- Rees & Ostriker (1977) Rees, M. J. & Ostriker, J. P., 1977, MNRAS,179, 541
- Robaina et al. (2009) Robaina, A. R., Bell, E. F., Skelton, R. E., Mcintosh, D. H., Somerville, R. S., Zheng, X., Rix, H.-W. et al., 2009, ApJ, 704, 324
- Sarkar & Bharadwaj (2009) Sarkar, P, & Bharadwaj, S., 2009, MNRAS, 394, L66
- Sarkar & Pandey (2019) Sarkar, S., & Pandey, B., 2019, MNRAS, 485, 4743
- Sarkar & Pandey (2020) Sarkar, S., & Pandey, B., 2020, MNRAS, 497, 4077
- Sarzi et. al (2006) Sarzi, M., Falcón-Barroso, J., Davies, R. L., Bacon, R., Bureau, M., Cappellari, M., de Zeeuw, P. T. et al., 2006, MNRAS, 366, 1151
- Scudder et al. (2012) Scudder, J. M., Ellison, S. L., Torrey, P., Patton, D. R., Mendel, J. T., 2012, MNRAS, 426, 549
- Silk (1977) Silk, J., 1977 ApJ, 211, 638
- Somerville & Primack (1999) Somerville, R. S. , & Primack, J. R., 1999, MNRAS, 310, 1087
- Springel, Matteo & Hernquist (2005) Springel, V., Di Matteo, T., & Hernquist, L., 2005, MNRAS,361, 776
- Stoughton et al. (2002) Stoughton C., Lupton R. H., Bernardi M., Blanton M. R., Burles S., Castander F. J., Connolly A. J., et al., 2002, AJ, 123, 485
- Strauss et. al (2002) Strauss, M. A., Weinberg, D. H., Lupton, R. H., Narayanan, V. K., Annis, J., Bernardi, M., Blanton, M., et al., 2002, AJ, 124, 1810
- Strateva et al. (2001) Strateva I., Ivezić Ž., Knapp G. R., Narayanan V. K., Strauss M. A., Gunn J. E., Lupton R. H., et al., 2001, AJ, 122, 1861
- Tempel & Tamm (2015) Tempel E., Tamm A., 2015, A&A, 576, L5
- Tuominen (2021) Tuominen T., Nevalainen J., Tempel E., Kuutma T., Wijers N., Schaye J., Heinämäki P., et al., 2021, A&A, 646, A156
- White & Rees (1978) White, S. D. M., & Rees,M. J., 1978 MNRAS, 183, 341
- Woods & Geller (2007) Woods, D. F., Geller, M. J., 2007, AJ, 134, 527
- Woods, Geller & Barton (2006) Woods, D. F., Geller, M. J., Barton, E. J., 2006, AJ, 132, 197
- Woods et al. (2010) Woods, D. F., Geller, M. J., Kurtz, M. J., Westra, E., Fabricant, D. G., Dell’Antonio, I., 2010, AJ, 139, 1857
- York et. al (2000) York, D. G. et al., 2000, AJ, 120, 1579
- Zehavi et al. (2002) Zehavi, I., et al. 2002, ApJ, 571, 172
- Zeldovich & Shandarin (1982) Zeldovich I. B., Shandarin S. F., 1982, PAZh, 8, 131
- Zhu, Zhang, & Feng (2022) Zhu W., Zhang F., Feng L.-L., 2022, ApJ, 924, 132