2021
1]\orgdivDepartment of Economics, \orgnameUniversity of St.Gallen, \orgaddress\streetBodanstrasse 8, \citySt.Gallen, \postcode9000, \stateSG, \countrySwitzerland
2]\orgdivDepartment of Economics, \orgnameLondon School of Economics and Political Science, \orgaddress\streetWC2A 2AE, \cityLondon, \countryUnited Kingdom
Personalization of Web Search During the 2020 US Elections
Abstract
Search engines play a central role in routing political information to citizens. The algorithmic personalization of search results by large search engines like Google implies that different users may be offered systematically different information. However, measuring the causal effect of user characteristics and behavior on search results in a politically relevant context is challenging. We set up a population of 150 synthetic internet users (“bots”) who are randomly located across 25 US cities and are active for several months during the 2020 US Elections and their aftermath. These users differ in their browsing preferences and political ideology, and they build up realistic browsing and search histories. We run daily experiments in which all users enter the same election-related queries. Search results to these queries differ substantially across users. Google prioritizes previously visited websites and local news sites. Yet, it does not generally prioritize websites featuring the user’s ideology.
keywords:
Search engines, algorithmic personalization, political news, informational segregation, US elections1 Introduction
Many large web platforms, in particular search engines, personalize the information they provide to users based on the users’ characteristics and preferences hannak_2013 ; Hannak_et_al_2017 ; Robertson_et_al_2018 ; Krafft_2019 ; le_etal2019 . Personalized search results on consumption goods and entertainment choices may well be in the users’ best interest. Yet, personalized search results on political news and events may be less desirable. There are concerns that users might unintentionally end up consuming only political information conforming to their point of view Pariser_2011 , while democracies tend to work better if all citizens are exposed to political information from diverse viewpoints Sunstein_2001 . However, so far, little is known about the causal effect of the search engine’s algorithmic personalization on systematic differences in political search results. Filling this gap is a prerequisite for understanding whether personalization of web search could eventually lead to segregation in political information.
To fill this gap, we study the search results provided by Google Search in response to election-related queries during the 2020 US Elections and their aftermath. For this purpose, we set up a population of 150 synthetic internet users (“bots”) with different partisan preferences who are randomly located across 25 US cities and active from October 22, 2020, to February 8, 2021. Our study design rests on two cornerstones: First, our users build up realistic, but potentially partisan browsing and search histories. Second, to test for personalization of search results, we run daily experiments in which all users enter the same election-related search terms.
The importance of location or browsing histories for the personalization of results from search engines and news aggregators has been studied before. Important previous contributions rely on short-run experiments in a controlled setting hannak_2013 ; Hannak_et_al_2017 ; le_etal2019 or search results received by self-selected internet users whose browsing and search histories are unknown to the researchers Robertson_et_al_2018 ; Krafft_2019 . Our approach combines the advantages of controlled experiments with the advantage of having users who display a human-like browsing and search behavior and who are entirely transparent as well as traceable over several months. Our study also differs from previous research by focusing on a politically turbulent and contested period, in which political news was abundant. The intense coverage of election-related events by websites across the political spectrum combined with the large share of the population searching for this information on Google Search are one potential reason for why we find stronger evidence for personalization than some recent studies Robertson_et_al_2018 ; Krafft_2019 (see Supplementary Material, Sections A and B, for details on how the context of our study helps to address common challenges in measuring the effects of personalization).
Our study design rests on 150 user profiles that emulate different hardware/software combinations (unique device fingerprints), which allow tracking via cookies and fingerprint detection even though the users are not logged into any account. We randomly split these profiles into three equally sized groups of synthetic users and assign a political ideology to each group: either Democrat/liberal, Republican/conservative, or non-partisan. We use residential proxy servers to randomly assign two Democrat, two Republican and two non-partisan users to each of 25 US cities with different partisan compositions (see Methods).
Users are active 1–3 times per day between 9am and 4pm local time. Their browsing and search behavior includes different common and partisan activities (see Methods). Each user directly visits a small random selection of popular US websites on a daily basis. Moreover, each Democrat (Republican) user gets assigned ten out of 100 liberal (conservative) websites and visits 3–5 of these websites per day. This assignment is consistent with partisans’ preferences for partisan information sources iyengar_hahn2009 ; Flaxman_et_al_2016 ; peterson2018echo ; peterson_goel_iyengar_2021 and implies that the personal sets of partisan websites do not only differ between Democrat and Republican users but also within Democrat users and within Republican users. As such, each non-partisan user has a fixed set of non-partisan websites (and the corresponding domains, i.e., the websites’ addresses), while each partisan user has fixed sets of both non-partisan and partisan websites (and the corresponding domains). Below, we refer to these websites (domains) as a user’s “favorite” websites and state that the user is “familiar” with a website if it is in their set of favorite websites. In addition to directly visiting favorite websites, we configure the synthetic users to also use Google Search in order to find and consume both non-partisan and partisan content. Each user issues 1–2 non-partisan Google searches per day. Moreover, each Democrat (Republican) user gets assigned 60 common liberal (conservative) search terms, and launches 3–9 partisan searches per day – consistent with partisan information seeking peterson_shanto2021 . Users always select the first entry of the organic search results on the search engine result page presented to them.
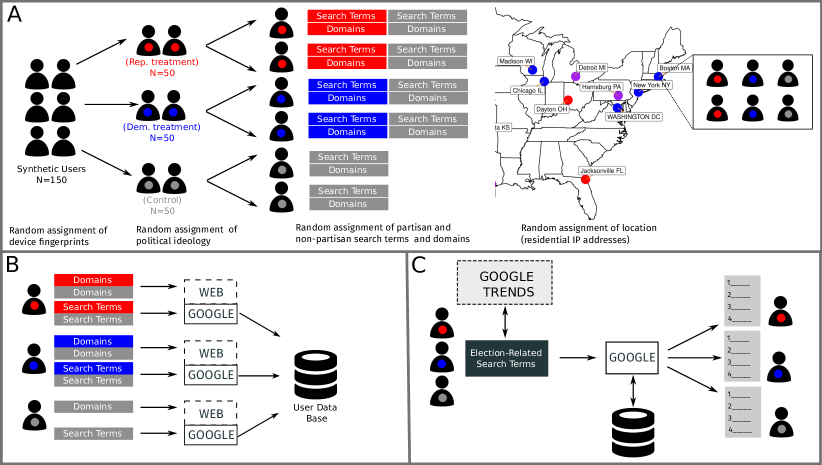
We run daily experiments in which all users use the same election-related search terms. The pool of election-related search terms is updated throughout our study from topic pages provided by Google Trends. On these pages, Google Trends maintained lists of the most highly trending search terms related to the elections and their aftermath. For example, from mid-October to mid-November 2020, Google Trends had a topic page on the elections; later it had topic pages on the Capitol riots, Trump’s second impeachment trial, and Joe Biden’s cabinet and his first actions in office. The search terms used in our daily experiments are thus representative of what people in the US frequently googled during and after the elections, e.g., “Donald Trump” and “Polling station” right before election day, “illegal ballots” and “electoral vote” after the election, as well as “national guard in capitol” and “capitol police officer dies” after the Capitol riots. In these daily experiments, the users also always select the first entry of the organic search results. Figure 1 illustrates our study design and Figure S1 in the Supplementary Material the timeline and the geographical distribution of our users.
Our analyses build primarily on the organic search results on the first result page in response to the election-related queries. In additional analyses, we also look at the “top stories” section on the first result pages (see Supplementary Material, Figure S6).
2 Results
2.1 Finding I: Search results differ substantially across users
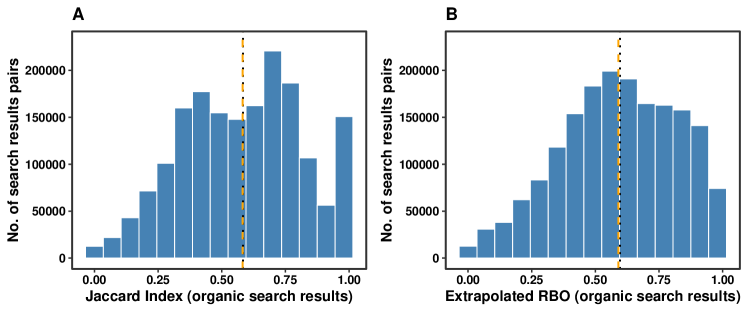
We assess the similarity of the search results across users who enter the same election-related search term on the same day. For each such search and user pair, we compute the Jaccard Index jaccard_1901 and the extrapolated rank-biased overlap (RBO) webber_etal2010 based on the search results’ main domains (e.g., nytimes.com rather than https://international.nytimes.com/…). The Jaccard Index ignores the order of the items, while we take it into account with the extrapolated RBO and rank weights consistent with empirical click-through-rates (CRT; see Materials and Methods).
Figure 2 reports the distributions of these two similarity measures in panels A and B. The mean of the Jaccard Index is 0.58, implying that an average user pair shares roughly 6 out of 8 results. The extrapolated RBO further reveals a remarkably low share of identical result pages (i.e., pages with the same organic search results in the same order). These findings are very similar for the top stories section on the first search results page and are robust to more or less narrow time windows between the two users’ election-related queries (see Supplementary Material, Figures S7 and S8).
Finding II: Search results prioritize previously visited websites
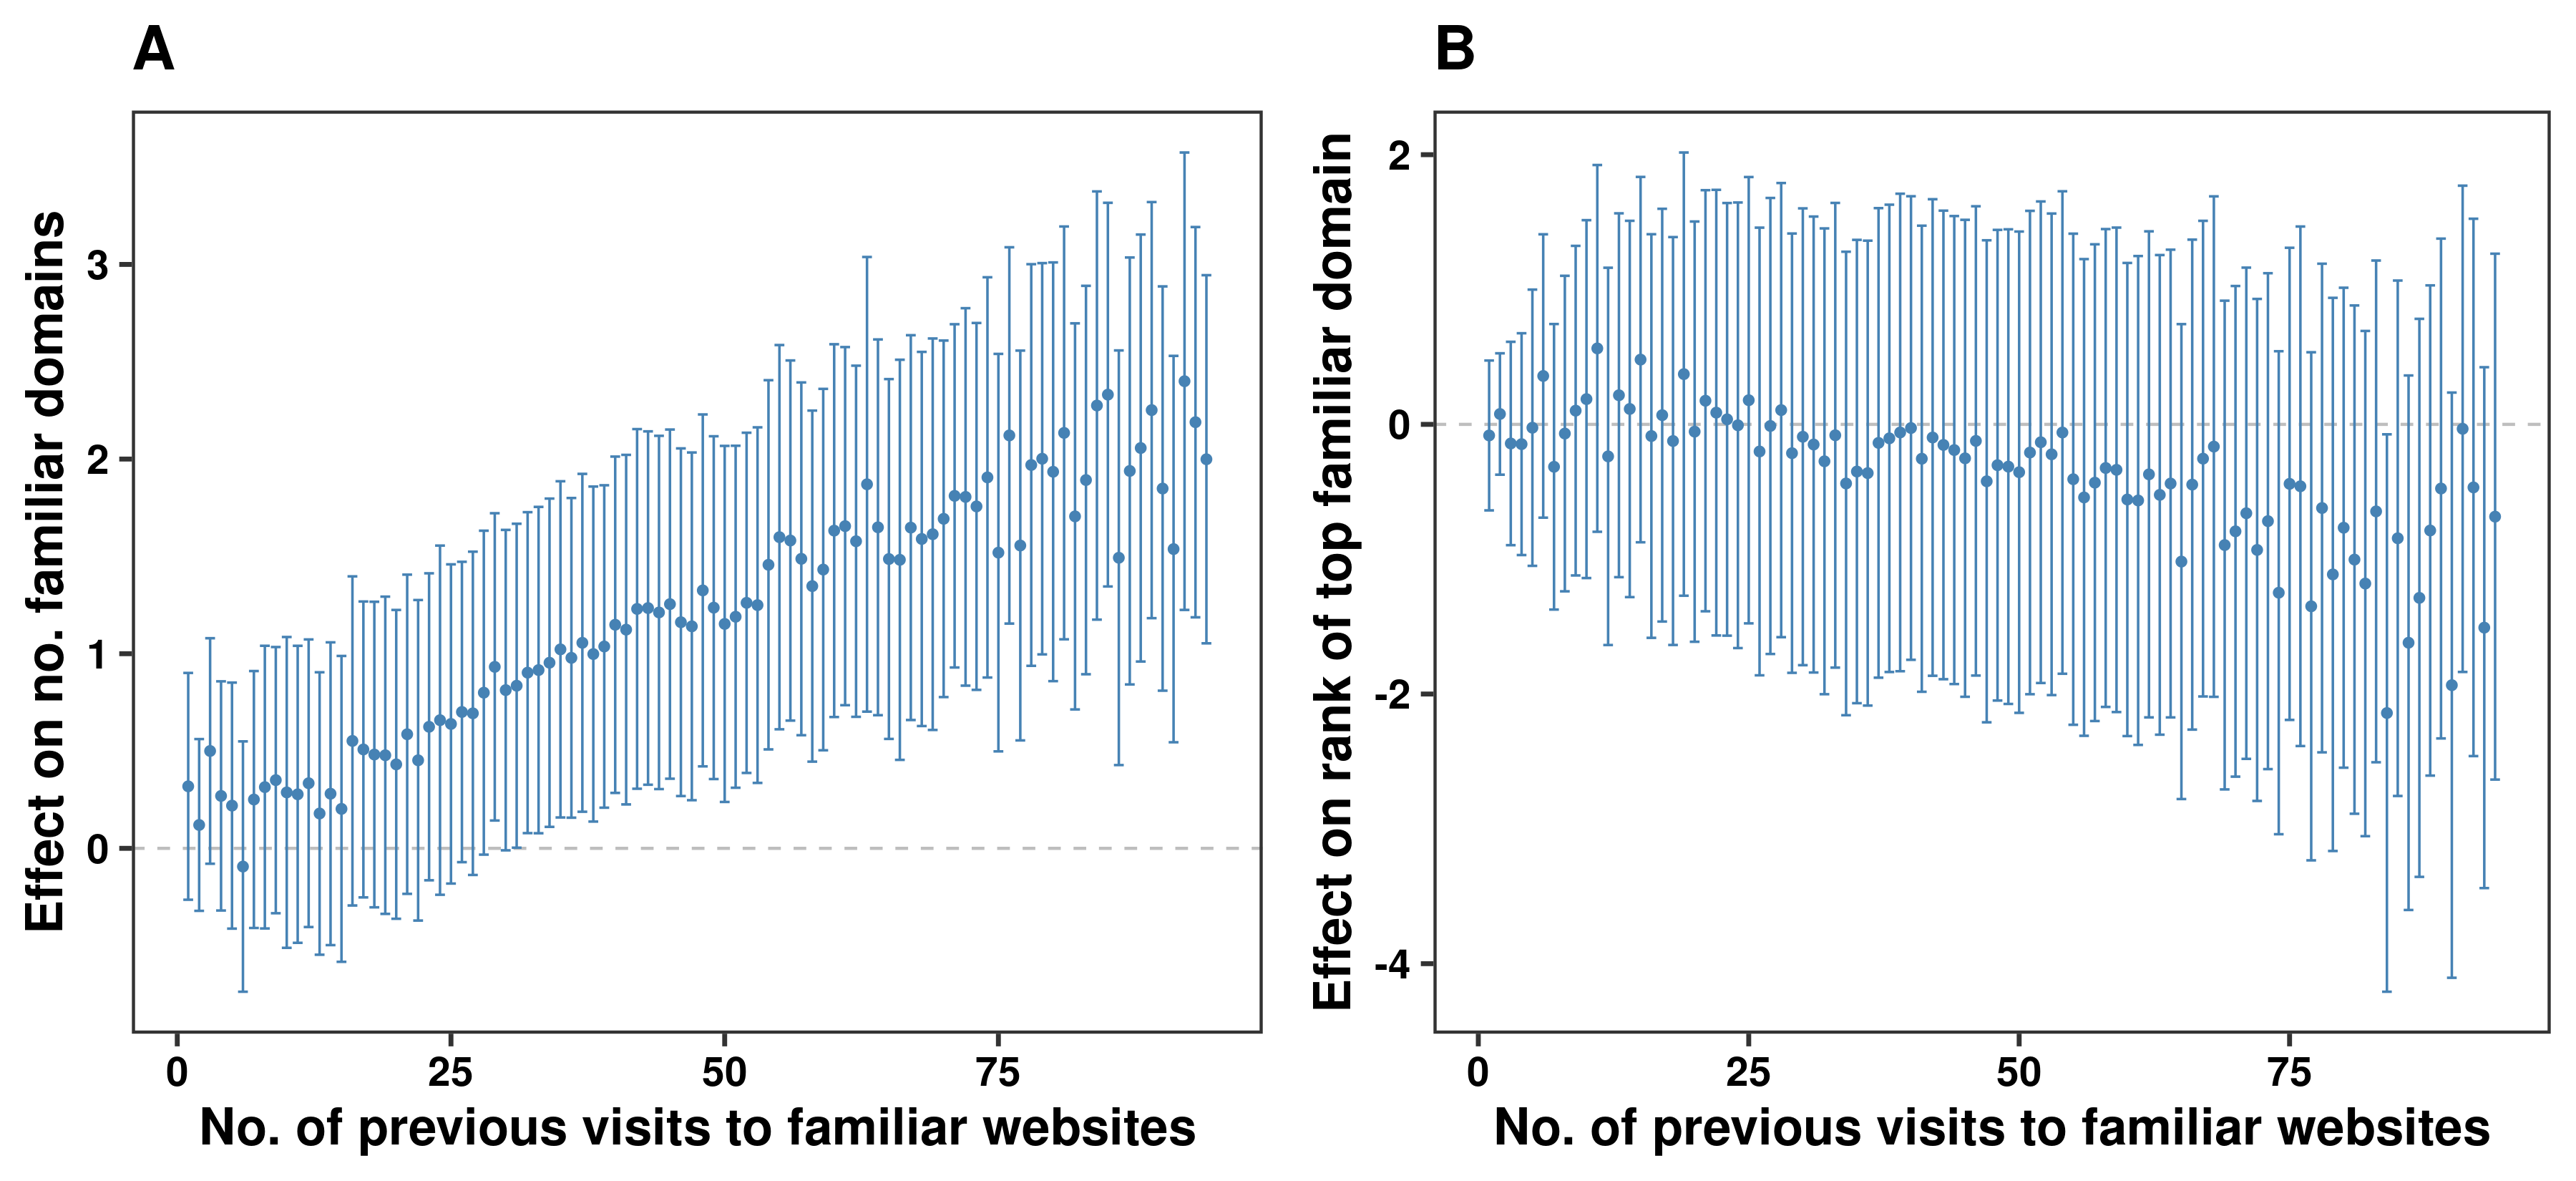
To better understand Google Search’s algorithmic personalization of search results, we test whether search results pages are more likely to contain the domains of websites that the user visited in the past. For each user and each election-related Google search, we thus count (i) how often a user has already visited websites from her personal set of (partisan or non-partisan) domains and (ii) the number as well as the rank of such familiar domains on the first results page. Figure 3 shows in panel A that more previous visits to their favorite domains increases the number of these domains on the first result page – even though the users are not logged into any account. This effect is even more pronounced for the top stories section (see Supplementary Material, Figure S9). Hence, taking non-personalized search results pages as the benchmark, we conclude that Google Search’s algorithmic personalization prioritizes previously visited websites.
Panel B of Figure 3 shows that more previous visits to familiar domains also lowers the rank of these domains, conditional on them appearing on the first result page. This effect, however, is comparatively weaker.
While personalization based on past visits exists, and users are set to visit partisan websites, we do not observe differences in the ideology of search results between left and right bots. This apparent inconsistency is due to popular and relatively centrist domains driving the observed increase in the number of familiar domains seen by users. Since domains on the fringes are extremely unlikely to occur on a search results page, we do not observe significant changes for these domains. Even if past visits increase the ranking of a highly partisan domain, the effect is not strong enough to be relevant when viewing the top search results. Since the domains used to set users’ partisan identity, particularly on the right, are not nearly as popular as CNN, Fox News, or NY Times, we do not observe differences in search result ideology between partisan users.
The fact that ideological differences exist for Democratic and Republican cities implies that location is weighted more heavily than past browsing behavior when personalizing search results. The finding that differences between cities are driven by local domains being shown to users despite having limited national appeal corroborates the focus on location for personalization.
Finding III: Search results do not generally prioritize websites featuring the user’s ideology
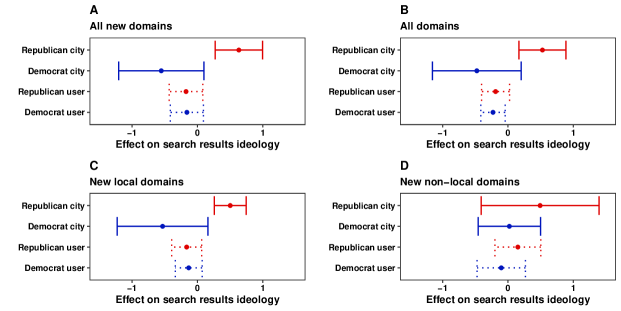
Finally, we study whether Google Search prioritizes partisan websites beyond showing a user’s favorite websites. In doing so, we focus primarily on “new domains” (defined as domains outside of the respective user’s set of favorite domains). We first build a Search Result Ideology Score (SRIS) that measures the ideological leaning of organic search results to election-related queries based on five website ideology indices bakshy_etal2015 ; Robertson_et_al_2018 ; mitchell_etal_2014 ; budak_etal2016 (see Materials and Methods for details). This score ranges from -100 (most liberal) to 100 (most conservative). We then regress the SRIS on indicator variables for the users’ partisan preferences and the prevalent partisanship in the city (with non-partisan users and purple cities as reference categories).
The results reported in panel A of Figure 4 indicate that the users’ partisanship does not play an important role, which suggests that Google Search does not show new partisan content based on partisan browsing and search histories. However, users in Democrat cities get more liberal/less conservative new content in their organic search results than users in Republican cities. In panel B, we redo the analysis using the SRIS based on all (rather than just new) domains. We again find that differences in the users’ partisanship play no role, while differences in their locations’ partisanship matter. These results are robust to alternative specifications and the use of individual website ideology indices, and it is similar for Democrat and Republican users (see Materials and Methods). Hence, taking non-personalized search results as the benchmark, we conclude that Google Search’s algorithmic personalization prioritizes search results representing the locally prevalent ideology.
In panels C and D, we disentangle the results reported in panel A by differentiating between new local domains and new non-local domains (see Materials and Methods for the coding of local domains). The results suggest that the prioritization of the locally prevalent ideology is driven primarily by local websites.
3 Discussion
To summarize, we find considerable diversity across Google Search results in response to the same election-related queries (even though users are not logged into any account). More importantly, Google Search’s algorithmic personalization prioritizes the users’ favorite websites and (local) news sites. According to various independent measures, these sites are ideologically close to the locally dominant political party. Hence, compared to the benchmark of non-personalized search results, Google Search’s algorithmic personalization users located in rather liberal cities tend to see systematically more liberal search results in comparison to users located in rather conservative cities (independent of their own political ideology). This, in turn, may imply that users are exposed to relatively few websites that contradict their own viewpoints. Given the well-documented preferences of individuals for reading and listening news that confirm their own beliefs, this feature of web search personalization may well be in the individuals’ own narrow self-interest. However, it may not be in society’s best interest if democracies work better when all citizens are exposed to political information from diverse viewpoints Sunstein_2001 ; finkel_etal2020 .
Many scholars argue that political polarization has recently intensified in the United States poole_rosenthal1984 ; abramowitz_saunders1998 ; Dimock_etal2014 ; iyengar_westwood_2015 ; iyengar_2019 and elsewhere mccoy_etal2018 ; hobolt_leeper_tilley_2020 . It is further argued that these developments have at least in part been the result of “echo chambers” and “filter bubbles” caused in one way or the other by the increasing importance of the world wide web dimaggio_etal2001 ; Sunstein_2001 ; Gentzkow_Shapiro_2011_QJE ; bakshy_etal2015 ; Flaxman_et_al_2016 ; lelkes_etal2017 ; bail_etal2018 ; vosoughi_etal2018 ; Levy_2020 ; allcott_etal2020 ; finkel_etal2020 ; hosseinmardi_etal2021 ; waldrop_2021 ; watts_2021 ; cinelli_2021 . Moreover, it is argued that such a development could have far-reaching negative political and social consequences mccoy_etal2018 ; chen_rohla2018 ; finkel_etal2020 ; waldrop_2021 . Importantly, our results cannot speak to the question about whether or not search engines – as one key part of the world wide web – have contributed to these undesirable social and political phenomena. We study the causal effects of algorithmic personalization on what users see in election-related search results and compare them to the benchmark of no search result personalization. Therefore, by design, our study cannot assess the overall effect of having search engines in contrast to having no search engines. However, it is remarkable that Google Search’s algorithmic personalization may induce patterns of news consumption that are not too dissimilar from the patterns common prior to the ascent of the world wide web. In these times, people may have had a print subscription to a particular (likely local) newspaper or they may have gone to a news stand to buy newspapers they knew and that were locally well read. Nowadays, Google Search is proposing them websites they know and that feature the locally prevalent ideology in response to their political queries. Future research should study the interaction of informational segregation in online and offline news consumption and how conducive these two types of news consumption are to political polarization.
At a more general level, we believe that our approach, which combines synthetic users that build up browsing and search histories over several months with regular experiments in which all users use the same search term, is promising for future research. A similar approach could be successfully applied to investigate the effects and consequences of recommender systems on other web platforms, ranging from Amazon to Yahoo News or YouTube.
4 Methods
4.1 Technical implementation
Our study’s technical realization is based on a custom-made software designed to set up, configure, and control synthetic web users (‘web bots’) who emulate human user characteristics and device fingerprints (various technical characteristics of the hardware and software used to visit a website), and human-like browsing and search behavior. Figure S2 in the Supplementary Material illustrates the key components of the application’s architecture.
At the lower level of the application, the “runner instance” handles and runs the users’ browsing sessions, relying on a specialized remote web driver. The web browsing of our synthetic users is not recognizable as run by browser automation (unlike browsers automated by a standard web driver such as Selenium). Automated browser instances are then linked to two components that help us emulate unique human user characteristics: a fingerprint manager (allowing the user to appear as if it uses a specific operating system and hardware setting), and a residential proxy service (allowing the user to access the web through a residential IP address in a specific US city). Residential proxies use IP addresses provided by common Internet service providers and are thus not distinguishable from an IP address of a typical web user (unlike common proxy servers and VPN services, which are run in data centers and are easily identifiable as such based on their data center IP addresses). All web traffic issued and received by the users is recorded in HAR files (commonly used for web archiving). This allows us to see what a given user did at any point in time and what the user was exposed to on Google Search and other websites.
4.2 The population of synthetic users
Our 150 unique user profiles are designed to reflect extended browser/device-fingerprint characteristics. This serves two purposes in our study design. First, from the perspective of websites visited by our synthetic users, these users look perfectly realistic as they appear to have common web browsers, screen resolutions, sound devices, and so on. Second, we can assure that each of the synthetic users has a unique fingerprint, such that it could be uniquely identified and tracked on that basis (in addition to or instead of relying on tracking cookies).
We verify the synthetic users’ appearance from the visited websites’ perspective in two ways. First, we use security testing tools to verify that the synthetic users’ device and network connection correspond to the intended configuration and that their fingerprints are unique (such that each user can be successfully tracked and uniquely identified). Second, we use an independent real-time geolocation service to verify the location of the residential proxy servers for each user’s browsing sessions. Both verification tests confirm the validity of our approach (see Supplementary Material, Section C, for details).
4.3 Synthetic users’ browsing behavior
The users’ favorite non-partisan websites are randomly selected from the 100 most popular US websites according to ahrefs_2020 . Their favorite partisan websites are randomly chosen from the top 100 partisan websites used by Democrat (Republican) supporters. We determine the top 100 Democrat (Republican) partisan websites based on a collection of over 140M partisan tweets issued during the 2018 mid-term elections wrubel_etal2019 . We first extract and parse all URLs appearing in pro-Democrats tweets and in pro-Republican tweets (additionally filtering out URLs containing the domain twitter.com, abbreviated URLs, and domains no longer in use by October 2020). Following the idea of detecting partisan phrases in text Gentzkow_Shapiro_2010 , we then compute the “partisanship” of each domain/website as
| (1) |
where () denote the total number of times domain is referred to in a tweet by Democrat (Republican) supporters, and () denote the total number of times a domain other than is referred to in a tweet by Democrat (Republican) supporters. A higher value indicates that is predominantly referred to by supporters of one of the two parties. Given and we can therefore select the 100 most partisan domains used by Democrat supporters and the 100 most partisan domains used by Republican supporters. Table S2 in the Supplementary Material shows the top 20 most partisan domains predominantly used by Democrat or Republican supporters, respectively.
4.4 Synthetic users’ search behavior
Each user issues 1–2 non-partisan Google searches per day, such as unit conversions or very common search terms (e.g., “ups tracker”). In addition, each Democrat (Republican) user gets assigned 60 liberal (conservative) search terms, randomly chosen from a list of liberal (conservative) search terms, and their set of partisan domains.
The lists of liberal (conservative) search terms consist of a large set of phrases used in national US politics that are most indicative of a certain ideology and relatively frequently used as search terms on Google Search. We build these lists in four steps: First, we collect data on all phrases used by Members of Congress (MoC) in tweets and congressional speeches during the 116th US Congress (see Supplementary Material, Section D for details). Following the procedure suggested in Gentzkow_Shapiro_2010 , we compute the “partisan loading” of all the (stemmed) bigrams in these data and select the 500 most partisan bigrams. These 500 partisan bigrams map to roughly 1,400 complete phrases. Second, we use data on each MoC’s ideological position from Voteview (https://voteview.com/data) to map our 500 bigrams to an ideology scale from -1 (clearly liberal) to 1 (clearly conservative), again closely following Gentzkow_Shapiro_2010 . Third, for each of the partisan phrases, we use Google Trends to verify whether, when, and where it was used as a search term on Google Search. We only keep the (unstemmed) partisan bigrams used as search terms on at least 50 days and in at least 10 US states since 2016. Lastly, we extend the compiled set of partisan search terms with search queries that, according to Google Trends, are related to (or substitute for) our partisan search terms.
As an example, consider the (stemmed) bigram “clean energi”, which we identify as one of the most partisan bigrams and a clearly liberal term. From all the unstemmed bigrams mapping to “clean energi”, “clean energy” is the one most frequently used as search term. Finally, based on the queries related to “clean energy”, we can map “clean energi” to the “synonymous” search terms “solar energy”, “clean renewable energy”, “renewable energy”, and “clean energy”. Out of the roughly 1,200 partisan search terms identified in this way, we select the 400 most clearly partisan search terms, label the conservative (liberal) ones as Republican (Democrat), and use them as the basis for the users’ search vocabulary.
To validate our final selection of partisan search terms, we compute the relative frequency of the use of Republican as opposed to Democrat search terms for each US state. We document that these relative frequencies are positively correlated with the Republican vote shares across US states. The raw correlation coefficient is 0.49 (see Supplementary Material, Section E and Figure S5, for details).
4.5 Quantifying the similarity of search results pages
For each first search results page of each pair of synthetic users who issued an identical election-related Google search, we compute the well-known Jaccard Index jaccard_1901 and the extrapolated Rank-Biased Overlap (RBO) webber_etal2010 . Formally, the extrapolated RBO of search result lists and is defined as
| (2) |
where is the number of (observed) domains in the lists, is the depth or rank of the domains compared, and is the comparison “persistence” indicating how much weight is given to lower-ranked domains as opposed to higher-ranked domains. In order to weight search results in a similar manner to human users, we compute the average click through rate of results by their rank on the result page CTR . For simplicity, we compute the weighting for a representative result page with eight visible items (as eight is the most common number of organic search results on the first search results page) in the categories “Law, Government & Politics” and “Weather, News & Information.” We find an average click through rate of 70.6% across these categories, which implies a value for of around 0.9.
4.6 Quantifying search result familiarity
To quantify how “familiar” the content of search results pages is to synthetic users, we count the number as well as the rank of domains from the users’ personal set of favorite websites on the first results page. In addition, for each day of the observation period, we count how often a user has already visited a website from her set of favorite domains that ever occur in the election-related search results of any user.
4.7 Quantifying search result ideology
To test whether user characteristics have an effect on the aggregate partisan leaning of a search results page beyond the re-occurrence of domains pointing to familiar websites, we employ a set of measures that index websites on a liberal-conservative scale. Specifically, we compute the Search Result Ideology Score (SRIS) from the domains listed on the first search results page as
| (3) |
where is the rank of the domain, a proxy for the ideological leaning of the website behind this domain , and
| (4) |
its weight given its rank. As above, we set to make the weighting consistent with the empirical CTR.
We rely on five existing website ideology indices to compute bakshy_etal2015 ; Robertson_et_al_2018 ; mitchell_etal_2014 ; budak_etal2016 . These indices are based on very different methodologies, ranging from surveys and expert reviews mitchell_etal_2014 and the ratings of websites by human raters on MTurk Robertson_et_al_2018 to text analysis of (online) news outlets budak_etal2016 and the analysis of sharing behavior on Facebook and Twitter by liberal or conservative users bakshy_etal2015 ; Robertson_et_al_2018 (see Supplementary Material, Section G for more details on these indices). To make these indices comparable, we re-scale them all to a liberal-conservative scale in . For each website domain listed in the first search results page, we then compute by averaging all available website ideology indices (setting non-available index values to 0). We then use this average ideology index to compute SRIS from the domains listed on the first search results page. Consequently, a search results page is only assigned a clearly liberal or clearly conservative value if several website ideology indices assign a similar ideology score to some of the websites.
4.8 Coding of local websites
The coding of local websites underlying panels C and D of Figure 4 is based on two components (see Supplementary Material, Section H, for details). First, for each domain, we verify whether a website is listed in a Media Cloud Roberts_etal2021 US “States & Local” collection (largely about a particular state or a particular locality/city), but not in a US “national” collection (largely about the US as a whole). Second, as the data by Roberts_etal2021 was generated at different points in time for different websites, we independently validate this categorization. For this purpose, we visit all websites initially coded as local and gather text describing the website and its purpose from the underlying source code. If a website’s description also indicates a national scope (or neither a local nor a broader scope), we check the website for such information manually. Finally, we also manually check all discrepancies (coded as local according to Media Cloud, but not according to our validation) by visiting the corresponding website.
4.9 Robustness of main findings
We check the robustness of the main finding on search result familiarity reported in Fig. 3 in several ways. For simplicity, we regress the number of familiar websites occurring in the search results (and related measures) on the number of previous visits to familiar websites. Table S4 in the Supplementary Material shows that the results are robust to varying fixed-effects specifications, varying cluster-robust standard error estimations, the inclusion of a linear time trend, the inclusion of the number of previous searches of familiar domains (e.g., a user typing nytimes in the Google search bar instead of directly visiting www.nytimes.com), as well as to alternative codings of the dependent variable. Table S5 in the Supplementary Material shows that the results are even somewhat more pronounced for the search results’ top stories section.
We also check the robustness of our main findings on search results ideology reported in Figure 4. Table S6 in the Supplementary Material shows the regression output behind Figure 4 (see columns 1-4) as well as additional specifications in which we replace our average SRIS with the scores based on the individual website ideology indices (see columns 5-9). While, not surprisingly, the results vary from index to index, the overall picture is qualitatively consistent with the baseline specification based on the average SRIS. This reaffirms that the results of the baseline specification are not driven by one particular website ideology index. In addition, Table S7 in the Supplementary Material shows linear hypothesis tests of whether the effects are the same for Democrat vs. Republican users and for users from Democrat vs. Republican cities. Table S8 in the Supplementary Material shows alternative specifications where we regress the average SRIS on the average ideology score of the users’ previously visited favorite websites (rather than indicator variables for the user’s partisanship) and the city-level share of Republican votes (rather than indicator variables for Democrat and Republican cities). The results are consistent with those reported in Figure 4. Finally, Figure S10 in the Supplementary Material shows that both Democrat and Republican users experience a similar prioritization of the locally dominant ideology.
References
- \bibcommenthead
- (1) Hannak, A. et al. Measuring personalization of web search, 527–538 (2013).
- (2) Hannak, A. et al. Measuring personalization of web search. arXiv preprint arXiv:1706.05011 (2017) .
- (3) Robertson, R. E. et al. Auditing partisan audience bias within Google Search. Proceedings of the ACM on Human-Computer Interaction 2 (CSCW), 148 (2018) .
- (4) Krafft, T. D., Gamer, M. & Zweig, K. A. What did you see? A study to measure personalization in Google’s search engine. EPJ Data Science 8 (1), 38 (2019) .
- (5) Le, H. et al. Measuring political personalization of google news search, WWW ’19, 2957–2963 (2019).
- (6) Pariser, E. The Filter Bubble: What the Internet is Hiding from You (Penguin Press, 2011).
- (7) Sunstein, C. R. Republic.com (Princeton University Press, 2001).
- (8) Iyengar, S. & Hahn, K. S. Red media, blue media: Evidence of ideological selectivity in media use. Journal of Communication 59 (1), 19–39 (2009). URL https://onlinelibrary.wiley.com/doi/abs/10.1111/j.1460-2466.2008.01402.x. https://doi.org/10.1111/j.1460-2466.2008.01402.x, https://onlinelibrary.wiley.com/doi/pdf/10.1111/j.1460-2466.2008.01402.x .
- (9) Flaxman, S., Goel, S. & Rao, J. M. Filter Bubbles, Echo Chambers, and Online News Consumption. Public Opinion Quarterly 80 (S1), 298–320 (2016) .
- (10) Peterson, E., Goel, S. & Iyengar, S. Echo chambers and partisan polarization: Evidence from the 2016 presidential campaign. Unpublished manuscript. https://5harad. com/papers/selecfive-exposure. pdf (2018) .
- (11) Peterson, E., Goel, S. & Iyengar, S. Partisan selective exposure in online news consumption: evidence from the 2016 presidential campaign. Political Science Research and Methods 9 (2), 242–258 (2021). 10.1017/psrm.2019.55 .
- (12) Peterson, E. & Iyengar, S. Partisan gaps in political information and information-seeking behavior: Motivated reasoning or cheerleading? American Journal of Political Science 65 (1), 133–147 (2021). URL https://onlinelibrary.wiley.com/doi/abs/10.1111/ajps.12535. https://doi.org/10.1111/ajps.12535, https://onlinelibrary.wiley.com/doi/pdf/10.1111/ajps.12535 .
- (13) Jaccard, P. Distribution de la flore alpine dans le bassin des dranses et dans quelques régions voisines. Bulletin de la Société Vaudoise des Sciences Naturelles (37), 241–272 (1901) .
- (14) Webber, W., Moffat, A. & Zobel, J. A similarity measure for indefinite rankings. ACM Trans. Inf. Syst. 28 (4) (2010). URL https://doi.org/10.1145/1852102.1852106. 10.1145/1852102.1852106 .
- (15) Bakshy, E., Messing, S. & Adamic, L. A. Exposure to ideologically diverse news and opinion on Facebook. Science 348 (6239), 1130–1132 (2015). URL https://science.sciencemag.org/content/348/6239/1130. 10.1126/science.aaa1160, https://science.sciencemag.org/content/348/6239/1130.full.pdf .
- (16) Mitchell, A., Gottfried, J., Kiley, J. & Matsa, K. E. Political polarization & media habits. Tech. Rep., Pew Research Center (2014). URL https://www.journalism.org/2014/10/21/political-polarization-media-habits/.
- (17) Budak, C., Goel, S. & Rao, J. M. Fair and balanced? Quantifying media bias through crowdsourced content analysis. Public Opinion Quarterly 80 (S1), 250–271 (2016). URL https://doi.org/10.1093/poq/nfw007. 10.1093/poq/nfw007 .
- (18) Finkel, E. J. et al. Political sectarianism in America. Science 370 (6516), 533–536 (2020). URL https://science.sciencemag.org/content/370/6516/533. 10.1126/science.abe1715, https://science.sciencemag.org/content/370/6516/533.full.pdf .
- (19) Poole, K. T. & Rosenthal, H. The polarization of American politics. Journal of Politics 46 (4), 1061–1079 (1984). URL http://www.jstor.org/stable/2131242 .
- (20) Abramowitz, A. I. & Saunders, K. L. Ideological realignment in the U.S. electorate. Journal of Politics 60 (3), 634–652 (1998). URL https://doi.org/10.2307/2647642. 10.2307/2647642, https://doi.org/10.2307/2647642 .
- (21) Dimock, M., Kiley, J., Keeter, S. & Doherty, C. Political polarization in the American public. Tech. Rep., Pew Research Center (2014). URL https://www.pewresearch.org/politics/2014/06/12/political-polarization-in-the-american-public/.
- (22) Iyengar, S. & Westwood, S. J. Fear and loathing across party lines: New evidence on group polarization. American Journal of Political Science 59 (3), 690–707 (2015). URL https://onlinelibrary.wiley.com/doi/abs/10.1111/ajps.12152. https://doi.org/10.1111/ajps.12152, https://onlinelibrary.wiley.com/doi/pdf/10.1111/ajps.12152 .
- (23) Iyengar, S., Lelkes, Y., Levendusky, M., Malhotra, N. & Westwood, S. J. The origins and consequences of affective polarization in the United States. Annual Review of Political Science 22 (1), 129–146 (2019). URL https://doi.org/10.1146/annurev-polisci-051117-073034. 10.1146/annurev-polisci-051117-073034, https://doi.org/10.1146/annurev-polisci-051117-073034 .
- (24) McCoy, J., Rahman, T. & Somer, M. Polarization and the Global Crisis of Democracy: Common patterns, dynamics, and pernicious consequences for democratic polities. American Behavioral Scientist 62 (1), 16–42 (2018). URL https://doi.org/10.1177/0002764218759576. 10.1177/0002764218759576, https://doi.org/10.1177/0002764218759576 .
- (25) Hobolt, S. B., Leeper, T. J. & Tilley, J. Divided by the vote: affective polarization in the wake of the Brexit Referendum. British Journal of Political Science 1–18 (2020). 10.1017/S0007123420000125 .
- (26) DiMaggio, P., Hargittai, E., Neuman, W. R. & Robinson, J. P. Social implications of the Internet. Annual Review of Sociology 27, 307–336 (2001). URL http://www.jstor.org/stable/2678624 .
- (27) Gentzkow, M. & Shapiro, J. M. Ideological segregation online and offline. Quarterly Journal of Economics 126 (4), 1799–1839 (2011) .
- (28) Lelkes, Y., Sood, G. & Iyengar, S. The hostile audience: The effect of access to broadband internet on partisan affect. American Journal of Political Science 61 (1), 5–20 (2017). URL http://www.jstor.org/stable/26379489 .
- (29) Bail, C. A. et al. Exposure to opposing views on social media can increase political polarization. Proceedings of the National Academy of Sciences 115 (37), 9216–9221 (2018). URL https://www.pnas.org/content/115/37/9216. 10.1073/pnas.1804840115, https://www.pnas.org/content/115/37/9216.full.pdf .
- (30) Vosoughi, S., Roy, D. & Aral, S. The spread of true and false news online. Science 359 (6380), 1146–1151 (2018). 10.1126/science.aap9559 .
- (31) Levy, R. Social media, news consumption, and polarization: evidence from a field experiment. American Economic Review 111 (3), 831–70 (2021). URL https://www.aeaweb.org/articles?id=10.1257/aer.20191777. 10.1257/aer.20191777 .
- (32) Allcott, H., Braghieri, L., Eichmeyer, S. & Gentzkow, M. The welfare effects of social media. American Economic Review 110 (3), 629–76 (2020). URL https://www.aeaweb.org/articles?id=10.1257/aer.20190658. 10.1257/aer.20190658 .
- (33) Hosseinmardi, H. et al. Examining the consumption of radical content on YouTube. Proceedings of the National Academy of Sciences 118 (32) (2021). URL https://www.pnas.org/content/118/32/e2101967118. 10.1073/pnas.2101967118, https://www.pnas.org/content/118/32/e2101967118.full.pdf .
- (34) Waldrop, M. M. News feature: Modeling the power of polarization. Proceedings of the National Academy of Sciences 118 (37) (2021). URL https://www.pnas.org/content/118/37/e2114484118. 10.1073/pnas.2114484118, https://www.pnas.org/content/118/37/e2114484118.full.pdf .
- (35) Watts, D. J., Rothschild, D. M. & Mobius, M. Measuring the news and its impact on democracy. Proceedings of the National Academy of Sciences 118 (15) (2021). URL https://www.pnas.org/content/118/15/e1912443118. 10.1073/pnas.1912443118, https://www.pnas.org/content/118/15/e1912443118.full.pdf .
- (36) Cinelli, M., De Francisci Morales, G., Galeazzi, A., Quattrociocchi, W. & Starnini, M. The echo chamber effect on social media. Proceedings of the National Academy of Sciences 118 (9) (2021). URL https://www.pnas.org/content/118/9/e2023301118. 10.1073/pnas.2023301118, https://www.pnas.org/content/118/9/e2023301118.full.pdf .
- (37) Chen, M. K. & Rohla, R. The effect of partisanship and political advertising on close family ties. Science 360 (6392), 1020–1024 (2018). URL https://science.sciencemag.org/content/360/6392/1020. 10.1126/science.aaq1433, https://science.sciencemag.org/content/360/6392/1020.full.pdf .
- (38) ahrefs. Top 100 most visited websites in the US (2020). https://ahrefs.com/blog/most-visited-websites.
- (39) Wrubel, L., Littman, J. & Kerchner, D. 2018 U.S. Congressional Election Tweet Ids (2019). URL https://doi.org/10.7910/DVN/AEZPLU.
- (40) Gentzkow, M. & Shapiro, J. M. What drives media slant? Evidence from U.S. daily newspapers. Econometrica 78 (1), 35–71 (2010) .
- (41) Advanced Web Ranking. Google organic CTR history (2021). URL https://www.advancedwebranking.com/ctrstudy/. https://www.advancedwebranking.com/ctrstudy/.
- (42) Roberts, H. et al. Media cloud: Massive open source collection of global news on the open web. Proceedings of the International AAAI Conference on Web and Social Media 15 (1), 1034–1045 (2021). URL https://ojs.aaai.org/index.php/ICWSM/article/view/18127 .