Faster and safer evacuations induced by closed vestibules
Abstract
Improving emergency evacuations is a top priority in human safety and in pedestrian dynamics. In this paper, we use the social force model, in order to optimize high-anxiety pedestrian evacuations. We explore two architectural layouts, the 1-door vestibule, and the 2-doors vestibule. The “vestibule” is defined as the room next to the exit door and it is characterized by two structural parameters: the vestibule width () and the vestibule door width (). We found that, specific values of and , can almost double the evacuation flow compared to the no-vestibule scenario. The key to this achievement is that the density (close to the exit door) can be controlled by and . Therefore, it is possible to tune these parameters to a density that maximizes the available space while preventing the formation of blocking clusters at the exit door (p/m2). As opposed to the optimal condition, low-density values (p/m2) lead to suboptimal flow since there is unused space left; while higher density values (p/m2) also lead to suboptimal flow due to the presence of blocking clusters at the exit. Moreover, we take into account the usually foreseen fact that high pressures can actually be reached at the exit, threatening the health of pedestrians. Therefore, we studied the crowd pressure using the agents’ overlap as an indicative. We found that the explored vestibules reduce the crowd pressure compared to the no-vestibule situation. In particular, we show that the 2-doors vestibule scenario performs better than the 1-door vestibule, because it reduces the overall local density (by enforcing the crowd to spread out more).
keywords:
Pedestrian evacuation, obstacle, vestibule, social force model.1 Introduction
Improving emergency evacuations is an issue of fundamental importance for human
safety. Despite the efforts being done by crowd management legislations
worldwide, catastrophic events such as human stampedes and fatal emergency
evacuations are still common [1, 2]. In the last
years, the scientific community has arrived at a growing number of ideas to
address this problem [3, 4]. The
proposed solutions can be classified into three
categories [5]: planning-based solutions,
behavioral-based solutions and architectural-based solutions.
In the first place, planning-based solutions consist of optimizing the
departure schedule and
planning the right path to escape a
building [6, 7]. Sometimes these
solutions require a central authority to control the crowd. Secondly,
behavioral-based solutions consist of proposing modifications in the attitude of
the pedestrians [8, 9].
These solutions require training and proper instructions to be acquired by
potential evacuating individuals.
Finally, architectural-based solutions consist of proposing design and
infrastructure
adjustments that reduce the evacuation time and increase safety during the
evacuation process. Unlike the aforementioned approaches, the
architectural-based solutions do not focus on the guidance of pedestrians nor
their specific training.
Among the three approaches, the most popular one is the architectural-based. In
particular, positioning an exit in the corner of a room [10]
and placing an obstacle in front of the exit door [11] appear
to reduce the evacuation time in both numerical
simulations [12, 13], and controlled
experiments [14].
In the seminal work of Helbing et al., it was proposed for the first time the
use of a column-like obstacle to improve the evacuation
performance [3]. Since then,
many efforts have been made to understand this phenomenon. Although some results
favor the initial hypothesis [11], some others challenge the
statement that the column-like obstacle can enhance the evacuation
performance [15].
Placing panel-like obstacles instead of pillar-like obstacles, although it is a
simpler proposal, it appears as a more promising solution in terms of increasing
the evacuation flow. There are
numerical results [12] as well as experimental
evidence [14] that support this idea.
The authors in Ref. [13] postulate the idea that placing two
panel-like obstacles in front of the exit door improves the evacuation performance.
They introduce the concept of “vestibule” (say, the space near the exit door)
as a more relevant one than the obstacle itself. The authors found that the
evacuation flow is determined by the density at the vestibule. Moreover, the
density can be controlled by architectural features such as the number of
vestibule doors, the vestibule width and the wall friction coefficient.
In addition to improving the evacuation flow, it is important to reduce the
physical pressure exerted on individuals. Many different
approaches appeared in the literature regarding the pressure in
crowd dynamics [16]. The pressure used in some
empirical and
experimental studies is defined as the product of the local density and the
velocity variance [17]. This
magnitude has proved to correlate with the probability
of tripping and the anxiety level [18].
Other approach worth mentioning is the numerical study done by Cornes et
al. which define pressure as a function of the normal
forces acting on the
individuals [19]. In line with this, it is worth remarking the
experimental
efforts done by different authors who craft “pressure vests” in order to
measure the contact forces applied to the human thorax [20].
This paper is a numerical study that is framed in the architectural-based
approach. We investigate emergency evacuations in the presence of a closed
vestibule. The closed vestibule is defined as the room next to the exit door
which is enclosed by panel-like obstacles. We show that this
layout is capable of improving emergency evacuations for two reasons. On
one hand, it substantially increases the evacuation flow of pedestrians. On the
other hand, it reduces the pressure exerted on them.
2 Background
2.1 The Social Force Model
The social force model [3] provides the necessary framework for simulating the collective dynamics of pedestrians (i.e. self-driven agents). The pedestrians are represented as moving particles that evolve according to the presence of either “socio-psychological” forces and physical forces. The equation of motion for any agent of mass reads
| (1) |
where the subscript corresponds to any neighboring agent or
the walls. The three forces , and
are different in nature. The desire force represents the
acceleration of a pedestrian due to his/her own will. The
social force , instead, describes the tendency of the pedestrians
to stay away from each other. The physical force
stands for both the sliding friction and the repulsive body
force.
The pedestrians’ own will is modeled by the desire force . This force stands for the acceleration required to move at the desired walking speed . For a fixed parameter reflecting the reaction time, the desire force is modeled as follows
| (2) |
where represents the unit vector pointing to the
target position and stands for the agent velocity at time .
The tendency of any individual to preserve his/her personal space is accomplished by the social force . This force is expected to prevent the agents from getting too close to each other (or to the walls) in any usual environment. The model for this kind of “socio-psychological” behavior is as follows
| (3) |
where is the distance between the centers of mass of
particles and ,
and is the sum of the pedestrians
radius. The unit vector points from pedestrian to
pedestrian , meaning a repulsive interaction. The parameter is a
characteristic scale that plays the role of a fall-off length within the social
repulsion. At the same time, the parameter represents the intensity of the
social repulsion.
The expression for the physical force (the friction force plus the body force) has been inspired from the granular matter field [21]. The mathematical expression reads as follows
| (4) |
where equals if and
vanishes otherwise.
represents the relative tangential velocities of the sliding bodies (or between
the pedestrian and the walls).
The sliding friction occurs in the tangential direction while the body force
occurs in the normal direction. Both are assumed to be linear with respect to
the net distance between contacting agents. The sliding friction is also
linearly related to the difference between the tangential velocities.
The coefficients (for the sliding friction) and (for the body
force) are related to the contacting surface materials and the
body stiffness, respectively. The friction force between an agent and a
wall/panel has the same mathematical expression as the friction between two
agents.
The model parameter values were chosen to be the same as the
best-fitting parameters reported in the recent study from
[22]. These values were obtained by fitting
the model to a real-life event that resembles an emergency
evacuation. The parameter values are: N, m,
kg/(m.s), N/m, s.
2.2 Blocking clusters
A characteristic feature of pedestrian dynamics is the formation of clusters. Clusters of pedestrians can be defined as the set of individuals that for any member of the group (say, ) there exists at least another member belonging to the same group () in contact with the former. Thus, we define a “granular cluster” () following the mathematical formula given in [23]
| (5) |
where () indicate the ith pedestrian and is his/her radius (half of the shoulder-to-shoulder width). That means, is a set of pedestrians that interact not only with the social force, but also with physical forces (i.e. friction force and body force). A “blocking cluster” is defined as the minimal granular cluster which is closest to the door whose first and last agents are in contact with the walls at both sides of the door (i.e. the first and last agents are the closest ones to each doorjamb) [24]. Previous studies demonstrated that the blocking clusters play a crucial role in preventing pedestrians from getting through a door [24, 25, 26].
3 Numerical simulations
We performed numerical simulations of
pedestrians evacuating a room in the presence of a 1-door vestibule and
a 2-doors vestibule (see Fig. 1 and Fig. 2,
respectively). We simulated
crowds of N=200 agents whose trajectories followed the equation
of motion (1). We used the circular specification of the social
force model for the interaction
forces acting on the agents (see Section 2.1 for the corresponding
mathematical expressions). The model parameter values were chosen to be the same
as the best-fitting parameters reported in the
recent study [22], and the ones cited in Section
2.1.
The mass of the agents was fixed at kg, and the radius was set to
m according to data reported in [27]. The
desired
velocity (which is the parameter that controls the anxiety level) was varied in
the interval m/s m/s. Although the upper limit
(m/s) may seem rather extreme, recent empirical measurements at San
Fermín bull-running festival in Pamplona shows that non-professional runners
can achieve velocities m/s [28].
Initially, the agents are placed in a m m area with random positions and velocities. The direction of the desired
velocity was such that the agents located outside the vestibule point to the
nearest vestibule door. Once they are inside the vestibule, the updated
target becomes the exit door.
The exit door’s size was m, which is equivalent to four agents’
diameter in accordance to [22]. The 1-door vestibule
(Fig. 1) is composed of 2 panel-like obstacles (i.e.
walls). The walls that define the vestibule extend to the side of the
room. The door of the vestibule is placed symmetrically with respect to the
exit door. The width of the vestibule door is . See Section 3.1
for more details.
The 2-doors vestibule layout (Fig. 2) is composed of 3 panel-like
obstacles. At this instance, we chose a commonly expected configuration: the
middle panel shares the same length as the exit door , and it is
placed right in front of it. The left and right panels are as long as the room.
Both vestibule doors have the same width (therefore, the total
vestibule entry width is ). The middle panel is fixed (in length and
location) regardless of . This means that increasing widens each door
outwards.
In this research, we analyzed the effect of varying 3 parameters: the desired
velocity , the vestibule width , and the total vestibule door width .
For each parameter configuration, we performed 30 evacuation processes that
finished when 90% of agents left the room. No re-entry of agents was
allowed.
We recorded the positions and velocities every 0.5 s from the
beginning of the simulation until the end (i.e. when 90% of the
individuals have left the room). Then, we computed the mean density,
the evacuation flow, and the probability of blocking clusters formation.
The density was measured in the inner vestibule region and it was defined
as the number of pedestrians divided by the inner vestibule area (see
Fig.1 and Fig.2). The area of the inner vestibule is
(where stands for the size of the exit door and
is the vestibule width). The density was calculated every 0.5 s.
Afterward, the mean and standard deviation were computed from
the recorded values.
The evacuation flow is defined as follows,
| (6) |
where is the number of evacuated pedestrians and is the time it
takes for those pedestrians to evacuate the room. The evacuation finished when
90% of the initial number of pedestrians abandoned the room.
The blocking clusters are the set of pedestrians that block a
door (see Section 2.2 for a formal definition). We measured the probability
of blocking clusters formation in three different regions: the exit door, the
doors of the vestibule, and also the blocking clusters inside the vestibule. The
probability is defined as the fraction of time that the blocking clusters are
formed over the total evacuation time.
The numerical simulations were carried out using LAMMPS, which is a molecular
dynamics open-access software [29]. The implementation also
required customized modules developed in C++. The
integration of the agents’ trajectory was computed using the Velocity Verlet
algorithm with a time-step s.
3.1 The explored layouts
In architecture, a vestibule is defined as a small room that leads to a larger
space [30]. In this paper, we consider vestibules placed
next to the exit door. Two different layouts were explored: the 1-door
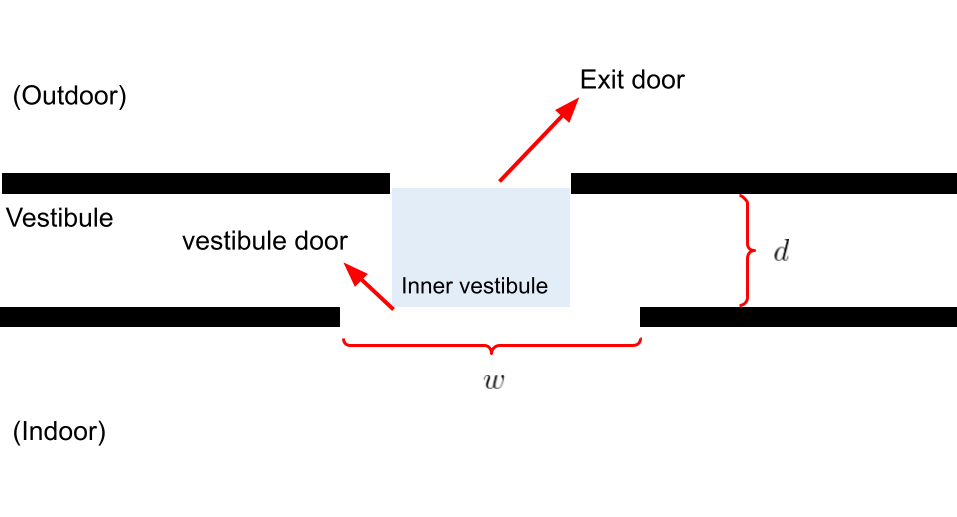
vestibule and the 2-doors vestibule. Fig. 1 illustrates the 1-door
vestibule layout. It consists of 4 walls in total. Two walls delimit the exit
door and, the other two delimit the vestibule door.
The vestibule is a corridor as long as the room and width .
It has a single door of width in front of the exit door. The shady area in
Fig. 1 represents the “inner vestibule”, which we define
as the rectangular area enclosed by the exit door and the vestibule door (this
area will be relevant in our analysis).
1-door vestibule
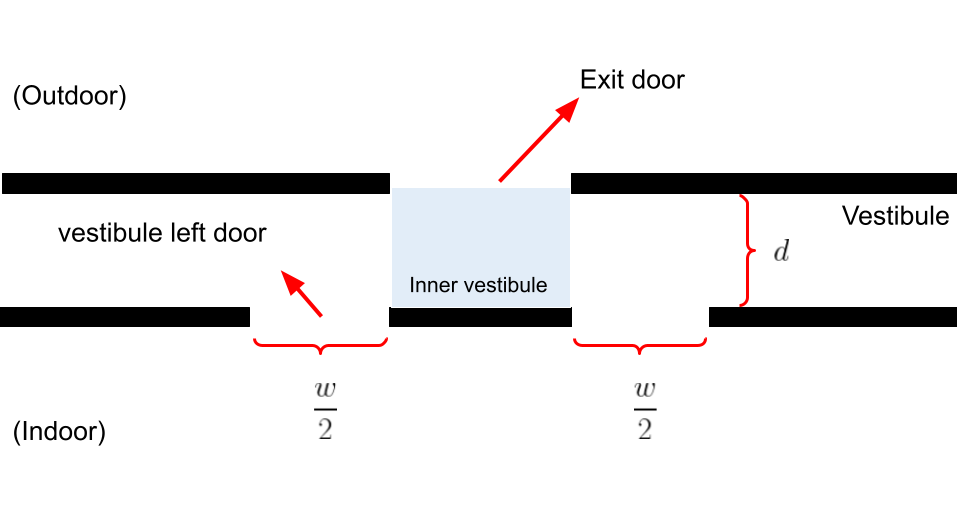
The 2-doors vestibule layout is exhibited in Fig. 2. In this
case, each vestibule door has a width ( is the total vestibule door
size).
The two doors are separated by a wall similar in size to the exit door. This
wall
is located in front of the exit door.
The 2 vestibule doors are symmetrically located with respect to the exit. The
shady area in Fig. 2 represents the inner vestibule. In this case,
it is
defined as the rectangular area enclosed by the exit door and the opposing wall.
2-doors vestibule
Notice that, we are dealing only with “closed vestibules”
rather than “open vestibules”. These are closed vestibules since the
enclosing walls are as wide as the room. On the other hand, the open vestibules
are characterized by one (or multiple) panel-like obstacles in front of the exit
door. Previous research dealt with open vestibules where
pedestrians were able to dodge the obstacles [13] or even
step over them [31] in order to access the vestibule.
Instead, in the closed vestibule scenario, pedestrians have to go through the
vestibule doors to access it.
3.2 Clarifications
We will refer to (the vestibule width) and (the
vestibule door width) as the “structural parameters”. In order to keep a
clear notation, we will express the structural parameters ( and ) in units
of the agent’s diameter. For example, if , we actually mean
that m m. Where 0.46 m is the average
pedestrian’s shoulder-to-shoulder distance reported
in [27].
Regarding the panel-like obstacles that define the vestibule, these panels
reach the sides of the room. Therefore, individuals can’t dodge them.
Moreover, in this research, panel-like obstacles are treated as walls (meaning
that individual-panel interactions are the same as the individual-wall
interaction).
In this research, we use the agents’ overlap as a reasonable indicator for the
pressure exerted
on them. We are aware that the overlap does not have units of pressure.
Nevertheless, we argue that any reasonable measure of pressure should be
correlated with the overlap since all the forces acting in the normal direction
are monotonically non-decreasing functions of the overlap. In Section
4.3, we will use the term “overlap” as a synonym of
“pressure”.
Throughout this paper, we use the symbol to denote the
density in the inner vestibule region. In the same way, we use the
symbol to refer to the evacuation flow.
4 Results and discussions
This Section is divided into three parts. In the first part
(Section 4.1), we show the
results corresponding to the 1-door vestibule layout for N=200. The second part
corresponds to the 2-doors vestibule layout (Section 4.2). These two
sub-sections focus on the
evacuation flow improvement that is possible to achieve with the aforementioned
layouts. The explanation for this improvement is based on the
fundamental diagram and the blocking cluster probability (also discussed in the
aforementioned Sections).
Finally, in Section 4.3 we further examine the effects of both vestibule layouts on the crowd pressure. We compare one layout against the other and also against the no-vestibule condition.
4.1 The 1-door vestibule
We present in this Section the main results corresponding to the 1-door
vestibule layout that was previously introduced in Fig. 1. We
explore a wide range of values for the structural parameters and and its
consequences on the evacuation flow. Under some structural conditions, the presence
of a 1-door vestibule improves the evacuation. At the end of the
Section, we provide an explanation of the flow improvement given by
the relation between the density inside the vestibule and the blocking clusters.
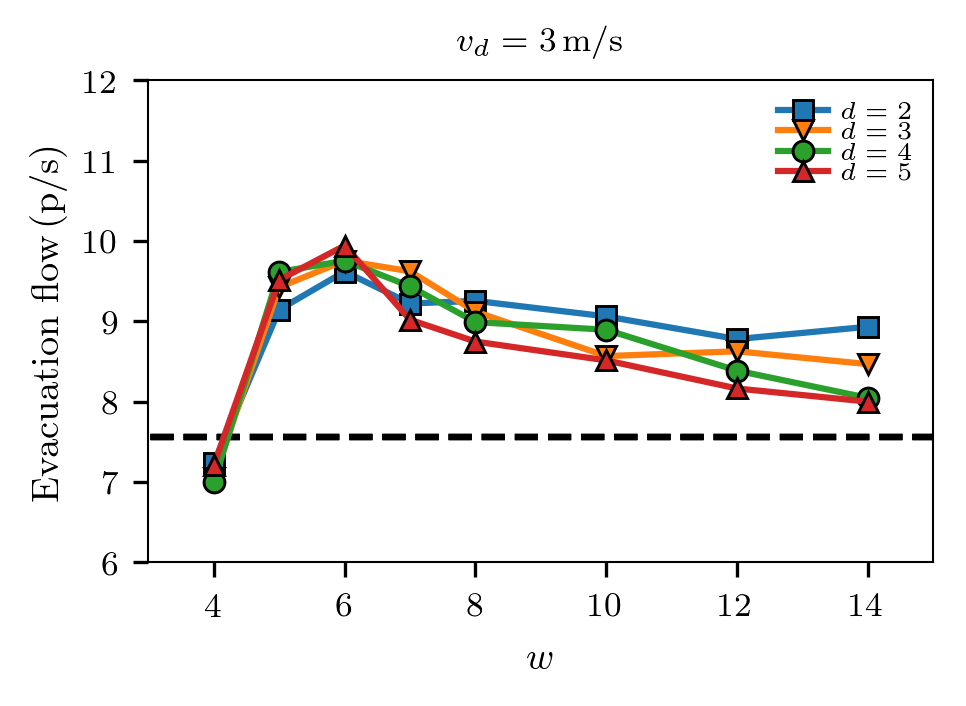
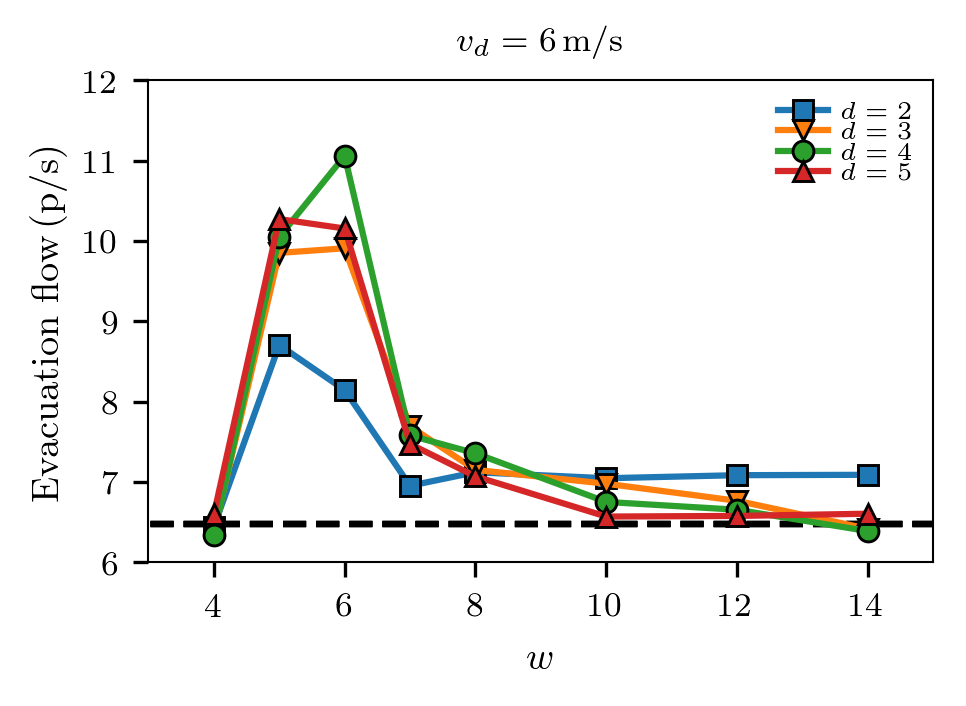
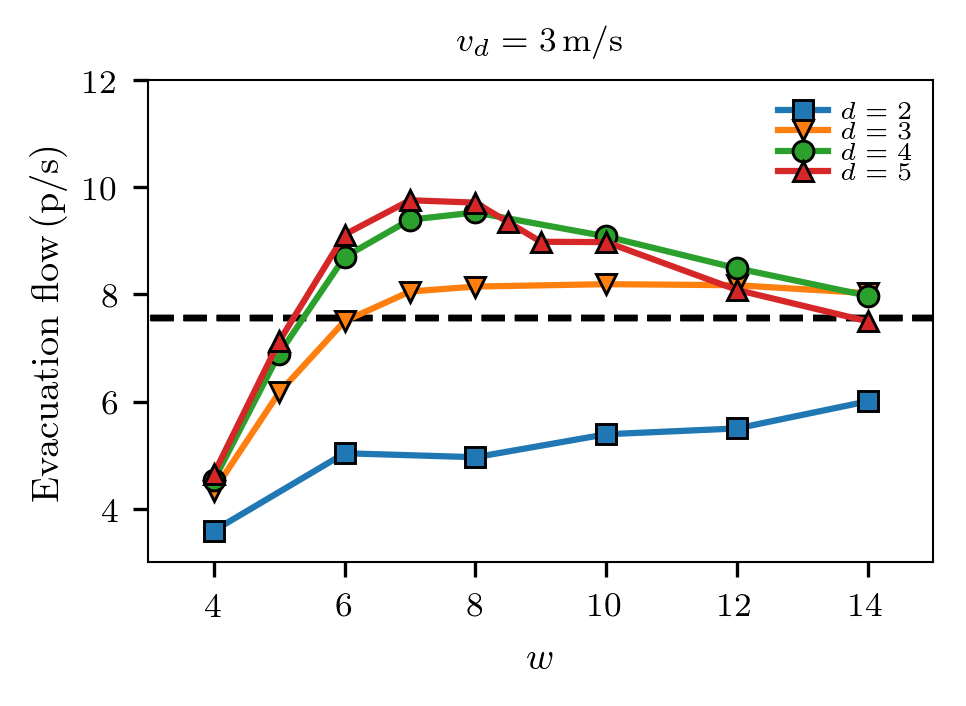
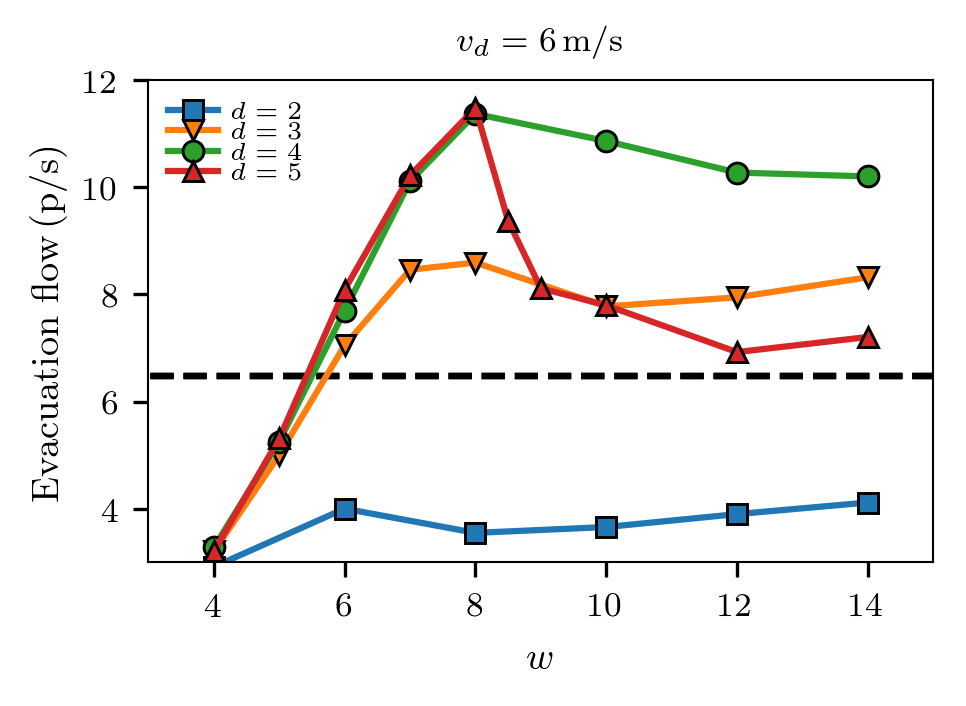
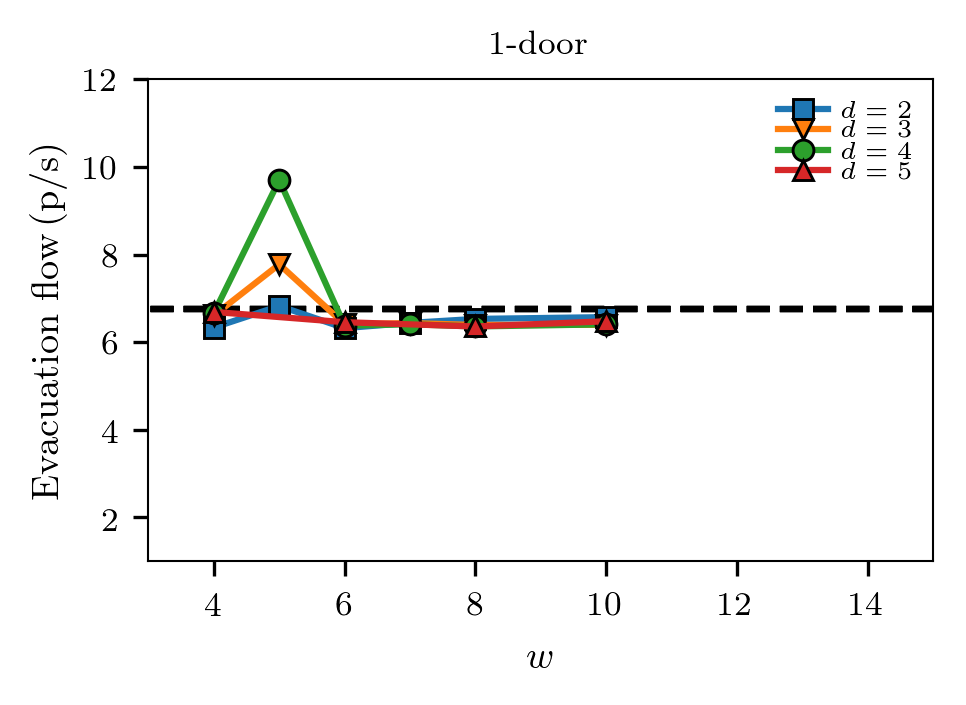
Fig. 3 shows the evacuation flow as a function of the
vestibule door size () for different vestibule widths (). The
evacuation flow is defined in Eq. (6). The horizontal dashed line in
Fig. 3 stands for the “no-vestibule” situation. If a curve
surpasses the horizontal dashed line, it means that the
vestibule yields an enhanced evacuation flow with respect to the no-vestibule
situation. Each plot corresponds to a different desired velocity as
indicated in the plot’s titles.
If is small (), the evacuation flow of the vestibule situation
is equal to
(or less than) the no-vestibule situation. On the opposite limit (),
the evacuation flow also converges to the no-vestibule situation.
Notably, intermediate values yield an evacuation flow that is much higher
than the no-vestibule situation. This behavior holds for any in the
range 2.5 m/sm/s. Fig. 3a and
Fig. 3b show the results corresponding to
m/s and m/s, respectively.
Notice that, regardless of , varying does not
affect the qualitative behavior of the flow curves. However, the evacuation
flow strongly depends on . Therefore, in the 1-door vestibule, we can assure
that the evacuation flow is dominated by the structural parameter rather
than .
The largest difference between the 1-door vestibule situation and the
no-vestibule scenario is given in , and m/s. In this case,
the flow increment is more than 4 p/s (which represents a 70 % increment).
In a real-life environment, such a big contrast might be the difference
between a regular evacuation and a disastrous event.
At a first inspection, the flow increment provided by the vestibule can
be explained by the density in the “inner vestibule”.
Recall that, the fundamental diagram (flow-density plot) is a meaningful chart
for the “free-flow” regime (where the flow increases as the density
increases) and the “congested” regime (where the flow diminishes as the
density increases). The former is associated with a low-density scenario,
whereas the latter is associated with a high-density scenario.
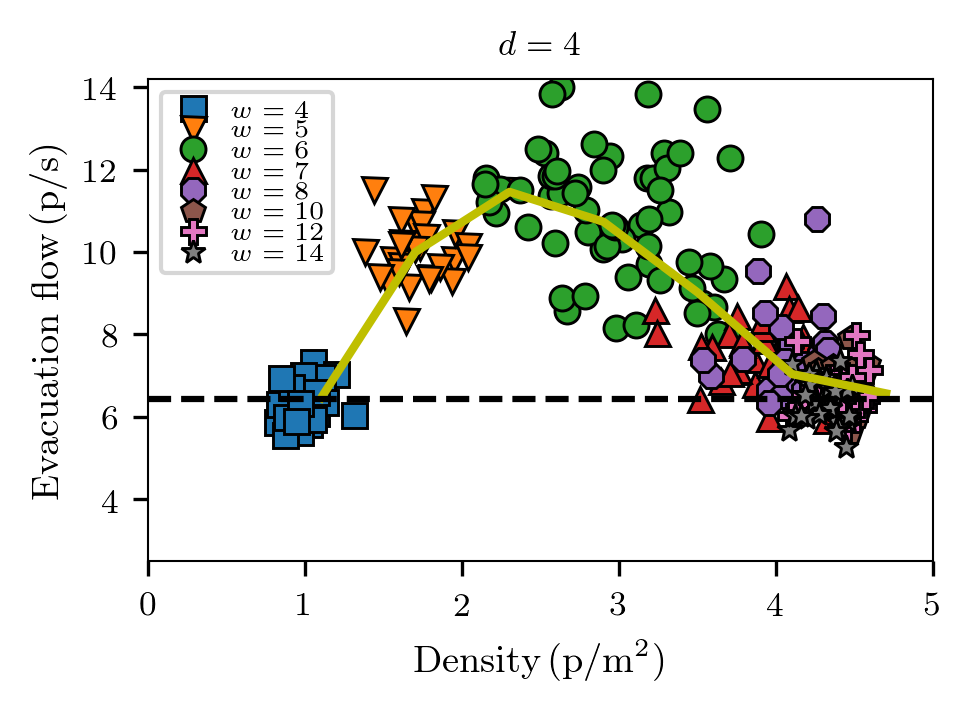
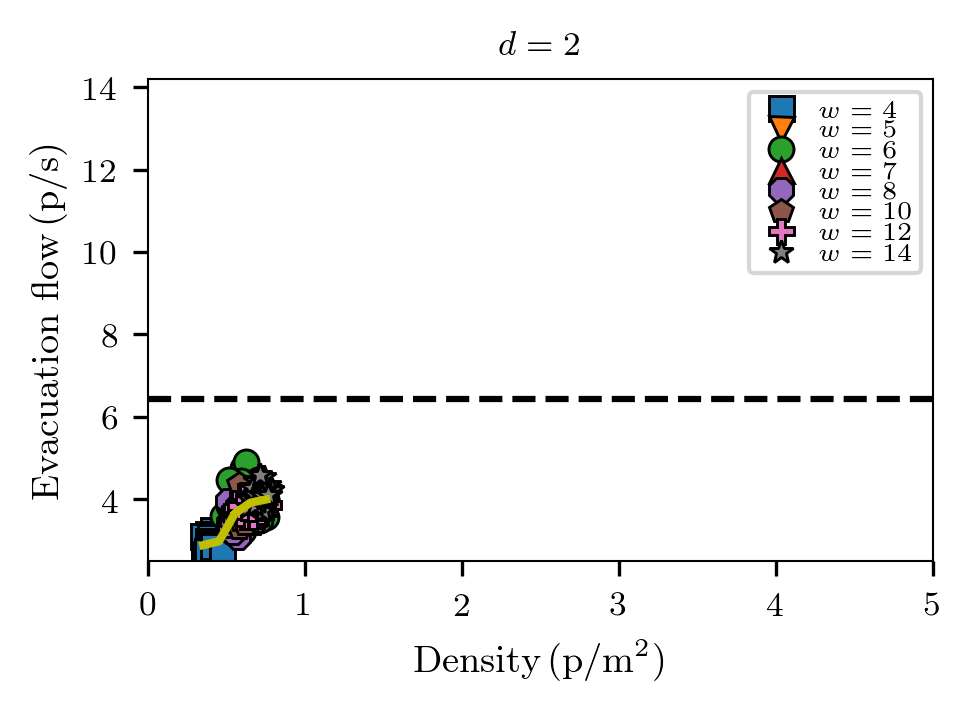
Fig. 4a
exhibits the fundamental diagram for the 1-door vestibule at and
m/s.
The horizontal dashed line corresponds to the no-vestibule situation. The
markers stand for the values and the solid curve is the
average over the data points. The data points correspond to different initial
conditions.
The lowest values yield a free-flow regime, while the largest
produce a congested regime. Notice that is the door width for
intermediate densities (p/m2) and the maximum evacuation flow.
We will explain the details of this phenomenon at the end of this Section.
If the density on the inner vestibule is low (say, p/m2), the
evacuation flow is below the optimal condition because there is unused
space left close to the exit door. This phenomenon makes the crowd to evacuate
“in dribs and drabs”.
If the density is high (p/m2), the evacuation flow is also
suboptimal because the area close to the exit door gets congested and produces
blocking clusters that hinder the flow.
However, the intermediate density values (p/m2) trade-off
the two above mentioned phenomenons and therefore maximize the evacuation
flow.
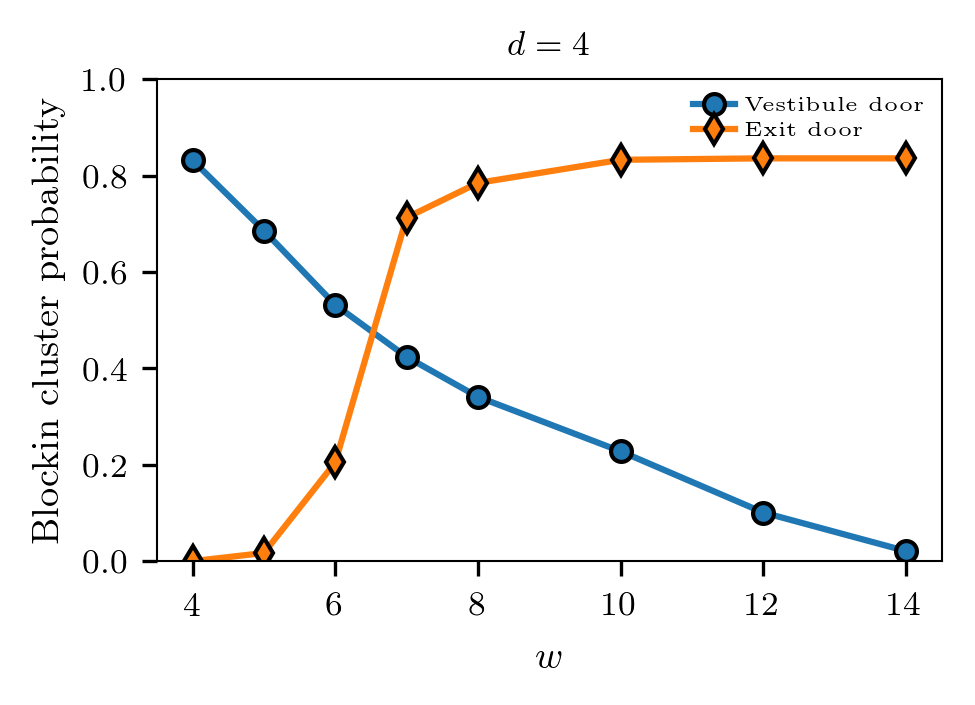
To complete the picture, we calculated the blocking cluster probability at the
exit door and also at the vestibule door. A blocking cluster is defined as the
set of pedestrians in physical contact that clog a door. Previous studies have
shown that blocking clusters play a critical role in high-anxiety evacuation
processes [24, 26].
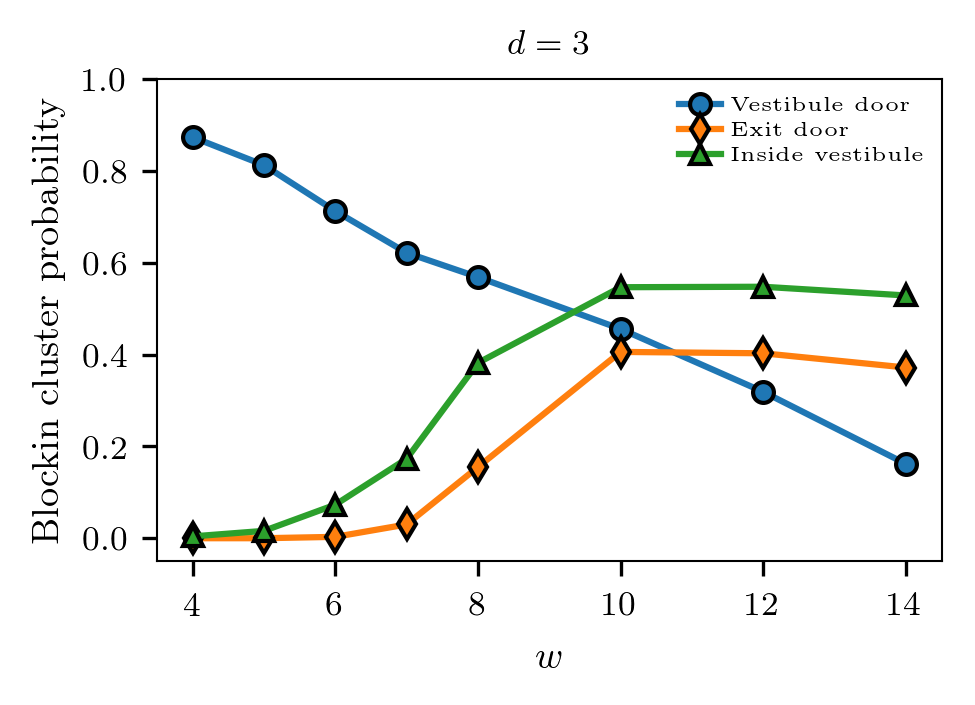
Fig. 4b shows the blocking cluster probability as a
function of the
vestibule door size . Recall that, the blocking cluster probability is
defined as the fraction of time that a blocking cluster is present over the
total evacuation time.
The vestibule door curve and the exit door curve display an
anti-correlation pattern (see Fig. 4b). If the vestibule
door is small (), there is a high blocking cluster probability at the
vestibule door. The blocking clusters at the vestibule door prevent
the inner vestibule from having high densities. This is why, for small , the
presence of blocking clusters at the exit door is almost negligible ().
Increasing reduces the blocking clusters at the vestibule door, letting a
larger number of pedestrians access the inner vestibule at the same time. As a
consequence, the exit door blocking cluster probability exhibits a sharp
increase at . Notice that, this increment is in agreement with the flow
reduction of the congested regime exhibited at the fundamental diagram
(see Fig. 4a).
It is worth clarifying that, although we only show the fundamental diagram
and the blocking clusters corresponding to , the qualitative behavior at
different values is similar. In the same way, despite we only exhibit
results for m/s and m/s, the qualitative behavior of the
results for any desired velocity in the interval m/s is similar to
the ones presented here.
To conclude the Section, we remark that the evacuation flow is sensible
to the inner vestibule density. At the same time, this density
can be controlled mainly by the structural parameter . Our most important
result is that the evacuation flow gets maximized when the inner vestibule
achieves a maximum density value such that almost no blocking clusters are
produced at the exit door but not as low as to evacuate “in dribs and
drabs”.
4.2 The 2-doors vestibule
In this Section, we present the results corresponding to the 2-doors
vestibule layout (illustrated in Fig. 2). This Section is
organized in a similar fashion to the previous
one. First, we explore the structural parameters ( and ) that improve the
evacuation flow and its relation to the fundamental diagram. Then, we
discuss about the blocking
clusters’ role in relation to the fundamental diagram and the evacuation
performance.
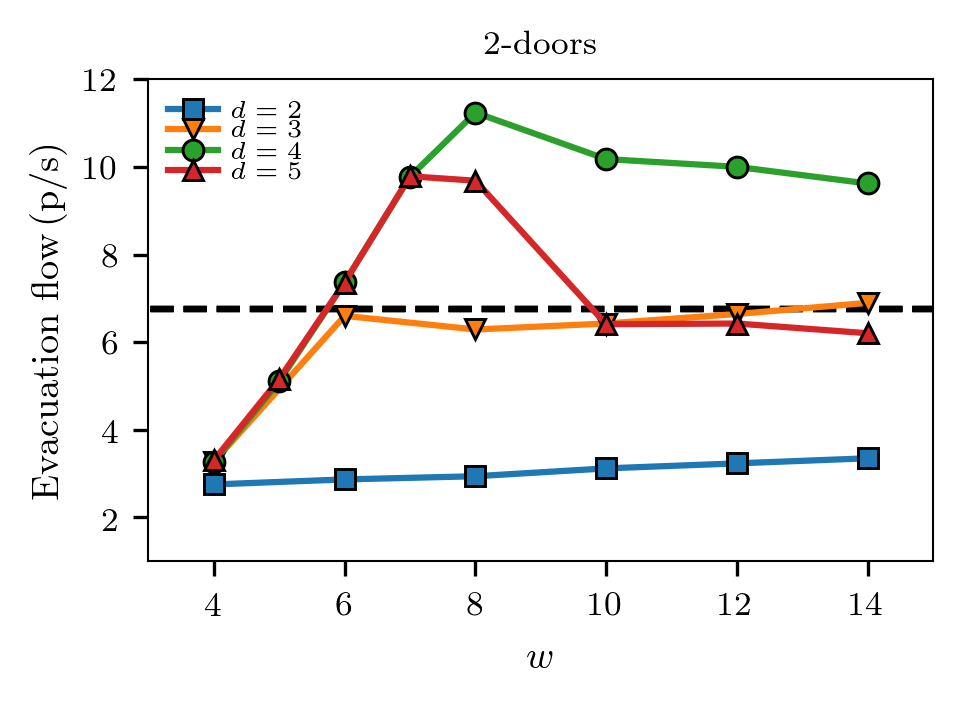
The evacuation flow as a function of the vestibule’s total door size () is
shown in Fig. 5. Since we are dealing with 2-doors
vestibules, now stands for
the sum of both vestibule door sizes. Recall that in this paper we only explore
symmetrical vestibules. That is, the size of each door is .
Fig. 5a corresponds to m/s, while
Fig. 5b corresponds to m/s. Each curve
stands for a different value (see legends for details). The
no-vestibule evacuation flow is shown by
the horizontal dashed line. As a first inspection, we can notice that
worsens the evacuation performance, but increases the evacuation flow
until reaching a plateau above the no-vestibule situation.
In the case of m/s (Fig. 5a), the widest
vestibules ( and ) exhibit
similar patterns. Small values worsen the evacuation performance but, the
evacuation flow improves for . In both cases, the curves reach a maximum
at and then reduce the flow as increases.
In the case of m/s (Fig. 5b), the
vestibule of size produces the maximum
flow at (the reader may watch the video in the supplementary material).
After this “peak”, the flow slowly diminishes for increasing
values of . It is worth noting that, for , the evacuation flow is
substantially higher than the no-vestibule situation.
If the vestibule is wider () and m/s (see
Fig. 5b), the curve also exhibits an
interval in which the evacuation flow is much higher than the no-vestibule
situation. The “peak” of flow is around and the flow converges to the
no-vestibule scenario as increases.
It is important to remark that the 2-doors vestibule is capable of improving the
evacuation flow under a wide range of values of the structural parameters
( and ).
Interestingly, the maximum flow value for 2-doors vestibule is around ,
whereas the maximum flow for the 1-door vestibule is around . It means
that a single door of size yields more flow than 2 doors of size .
Similar results were reported for two-doors pedestrian evacuation
simulations [25] and also for experiments performed with
granular media accelerated by the force
of gravity [32]. In B we provide a brief
discussion regarding this
topic.
The vestibule improves the evacuation flow if certain structural conditions are
met (specific values of and ). At a first inspection, the flow increment
can be explained with the help of the fundamental diagram (i.e. the
flow vs. density plot). As we did for the 1-door vestibule, we measured the
evacuation flow as a function of the density. The density was measured in the
“inner vestibule” (the area between the exit door and the vestibule wall;
see Section 3.1 for details).
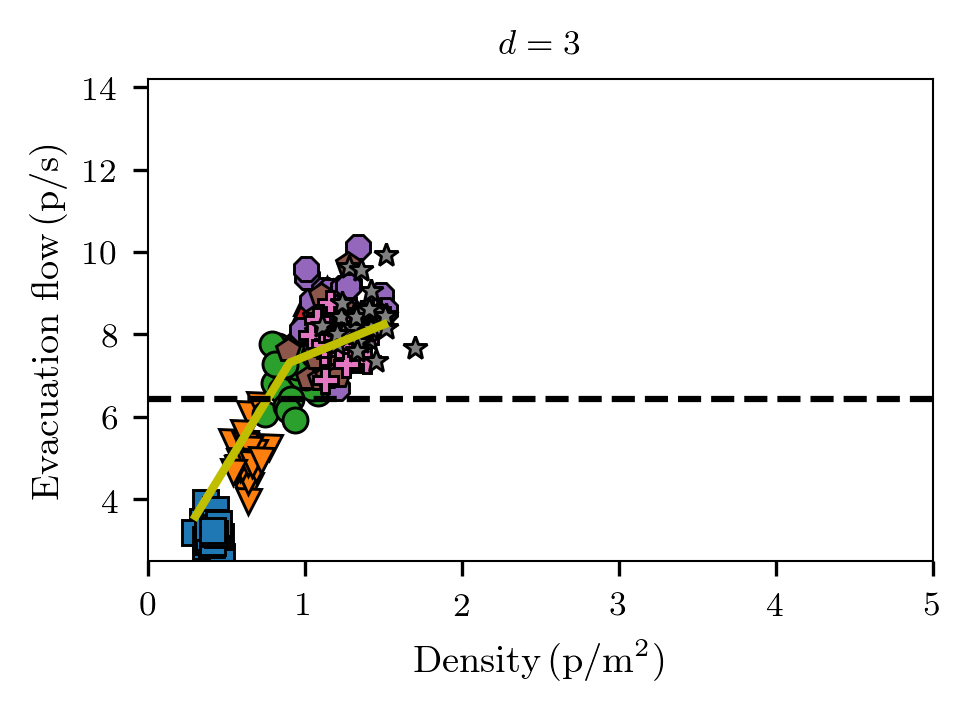
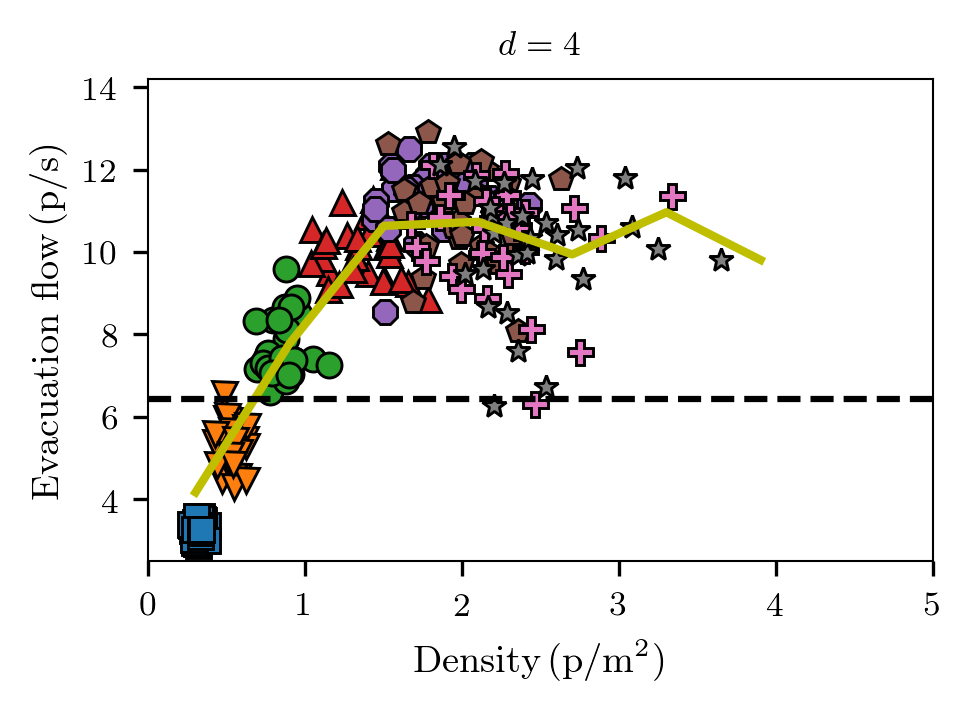
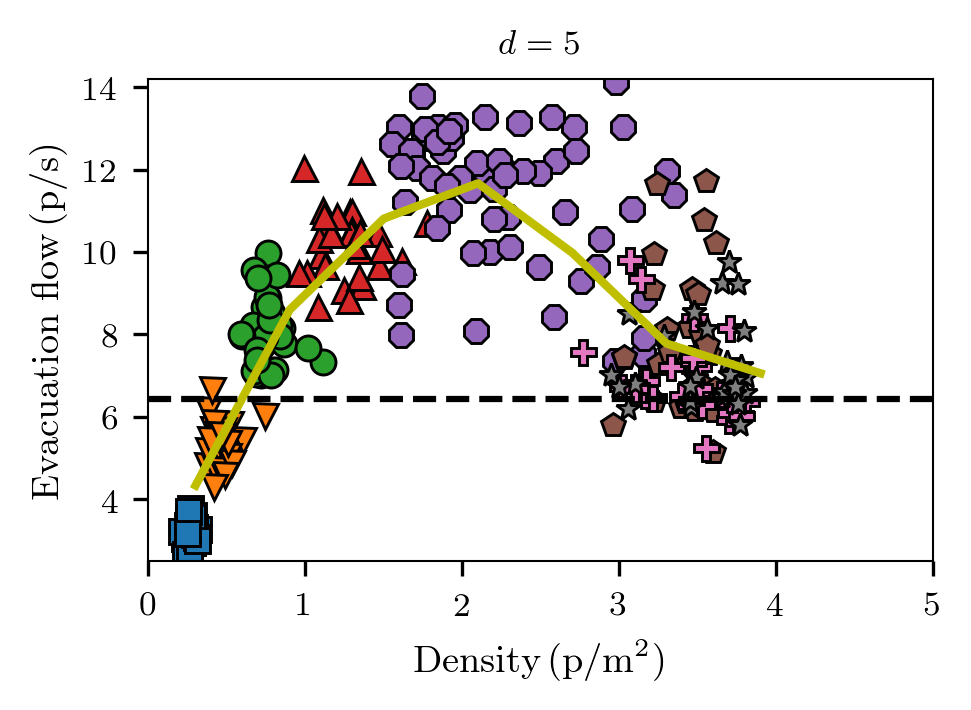
Fig. 6 shows the fundamental diagram for different
structural parameters
(see the titles and the labels). The horizontal line stands for the
no-vestibule situation. The markers represent different vestibule door size
and each data point correspond to a different initial condition.
The narrowest vestibule explored is . Under this condition, the density in
the inner vestibule remains very low () regardless of the size of
the vestibule door (Fig. 6a). The cause of
this phenomenon is that pedestrians get stuck
at the entrance of the inner vestibule preventing this zone to have a larger
number of pedestrians. The direct consequence of this phenomenon is a lower
evacuation flow than that of the situation without a vestibule.
Fig. 6b corresponds to 2-doors vestibule and
. Although this structural
condition allows a wider range of density and flow, only the free-flow regime is
observed. This means that the inner vestibule does not get overcrowded
(regardless of ). This phenomenon is related to the blocking clusters produced
inside the vestibule, as will be discussed at the end of this
Section.
For 2-doors vestibules of size
(Fig. 6c), the free-flow and the
“peak” of the fundamental diagram are observed. This means that increasing
increases the density while also increasing the evacuation flow.
As in the case of , the inner vestibule does not get overcrowded because the
agents get stuck (temporarily) before the inner vestibule region.
If the vestibule is wider (), it is possible to observe the free-flow and
the congested regime (Fig. 6d). The former
holds for , while the latter appears at . The congested regime is
characterized by decreasing flow as the density increases. For such a wide
vestibule (), and such a large vestibule door size (), a large number
of agents are allowed to enter the vestibule at the same time. This is the limit
that resembles the no-vestibule scenario.
To complete the picture of why the inner vestibule gets crowded depending on
and , we measured the blocking clusters. Unlike the 1-door vestibule,
for the 2-doors vestibule, it is necessary to define a new type of blocking cluster:
the “inside vestibule blocking cluster”. These are blocking clusters that are
formed inside the vestibule but just before the inner vestibule.
In summary, three types of blocking clusters play a relevant role. The ones that are
formed at the exit door, the ones that are formed before the vestibule (at the
vestibule door), and the ones that are formed inside the vestibule (just before
the inner vestibule). See C for an illustration of
the blocking cluster types. In any case, the blocking cluster probability is
defined as the fraction of time that blocking clusters are present over the
total evacuation time.
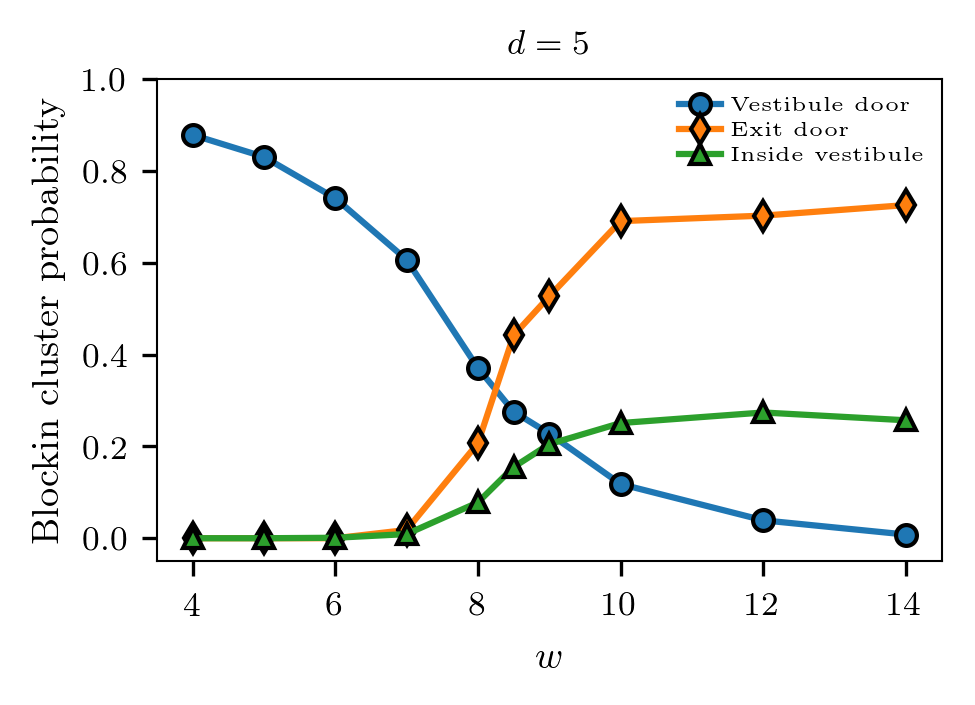
Fig. 7a and Fig. 7b
show the three types of blocking cluster probabilities for
and , respectively. As expected, increasing reduces the
vestibule door blocking clusters. The main difference between the case for
and is that, in the former, the “inside vestibule curve” is above the
“exit door curve”. On the other hand, for , the “exit door curve” is
well above the “inside vestibule curve”.
The blocking cluster curves explain the differences in the fundamental diagram.
increases the blocking cluster probability before the inner vestibule.
These blocking clusters prevent the inner vestibule
from getting overcrowded. This is why the fundamental diagram at only
exhibits free-flow (and low density). The direct consequence of the low density
is the lack of blocking clusters at the exit door. Therefore, the evacuation
flow is higher than the no-vestibule condition.
The scenario of produces fewer blocking clusters before the inner
vestibule. Thus, the inner vestibule gets crowded more easily. This is why
the fundamental diagram at exhibits a congested regime (for large enough
). The consequence is an increase in the exit door blocking cluster
probability, which reduces the evacuation flow.
To conclude this Section, we stress that the evacuation flow in the 2-doors
vestibule is strongly dependent on the density. However, it is possible to
control the inner vestibule density with the structural parameters and .
In the same way as the 1-door vestibule, the flow is maximized for intermediate
density values (p/m2). Under this condition, the density is
low enough to minimize the formation of exit door blocking clusters, but not as
low as to leave unused space left in the vestibule.
4.3 The pressure
In the previous Section, we showed that under certain structural conditions
the inclusion of a vestibule at the exit increases the evacuation flow. One
concern now is whether the improvement in flow is at the expense of an increase
in the pressure suffered by the escaping individuals.
This possibility arises because the vestibule is achieved by placing
panel-like obstacles and, these obstacles may cause an increase in pressure due
to the individual-obstacle interaction. Another arguable matter is whether the
vestibule may create higher local density regions where the pressure is
maximized.
In this Section, we report the “overlap” between agents as an indicative of the
pressure. The overlap on the th particle is defined as where is the sum of radius of particles and .
is the distance between mass centers. stands for any particle (or
wall) that is in physical contact with particle . Thus, the overlap reflects
the degree of closeness between pedestrians. We stress that in this Section, we
use the terms overlap and pressure interchangeably.
Although the overlap is not the unique way of quantifying the pressure in a
crowd [16, 17, 18], we argue that any reasonable measure of
pressure should correlate with this magnitude. We support this argument
because the forces acting in the normal direction are monotonically
non-decreasing functions of the overlap.
Our results show that the presence of a vestibule significantly reduces the
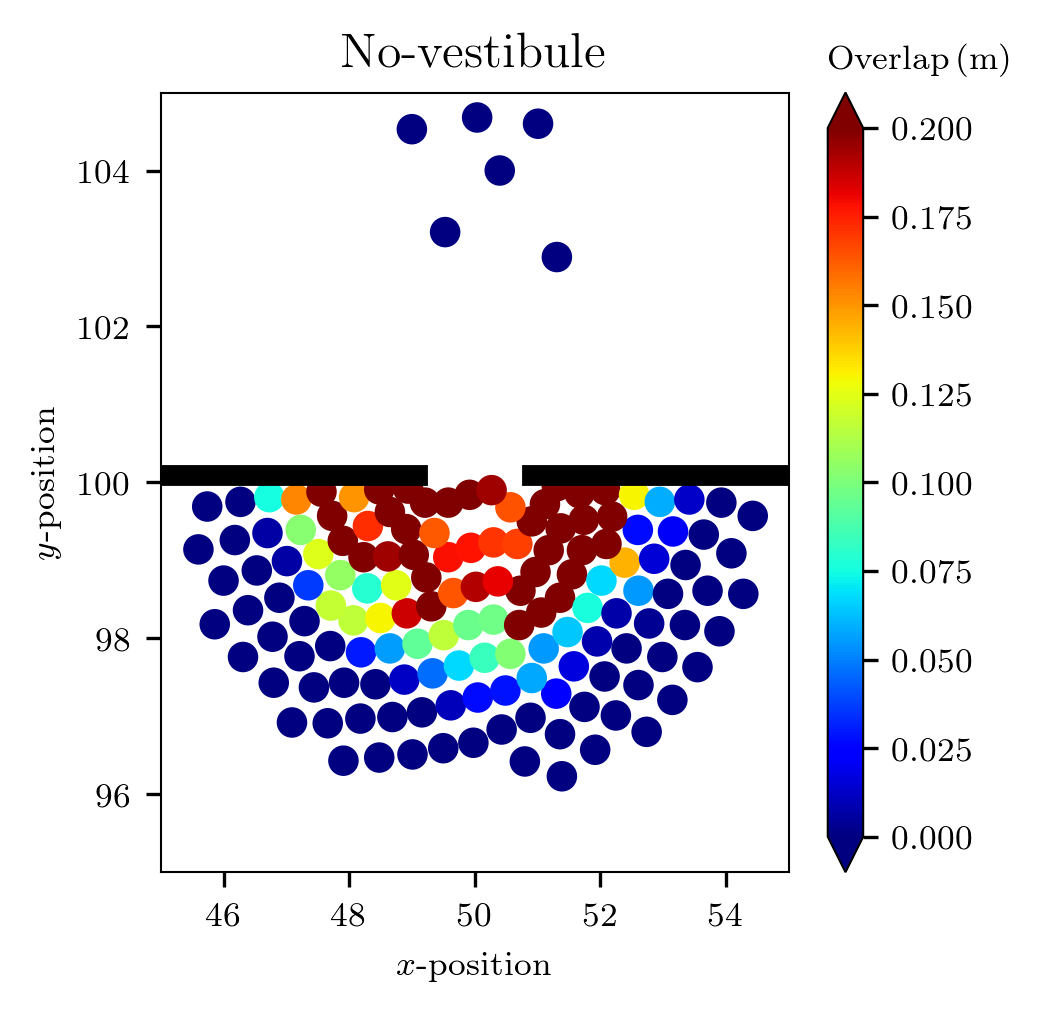
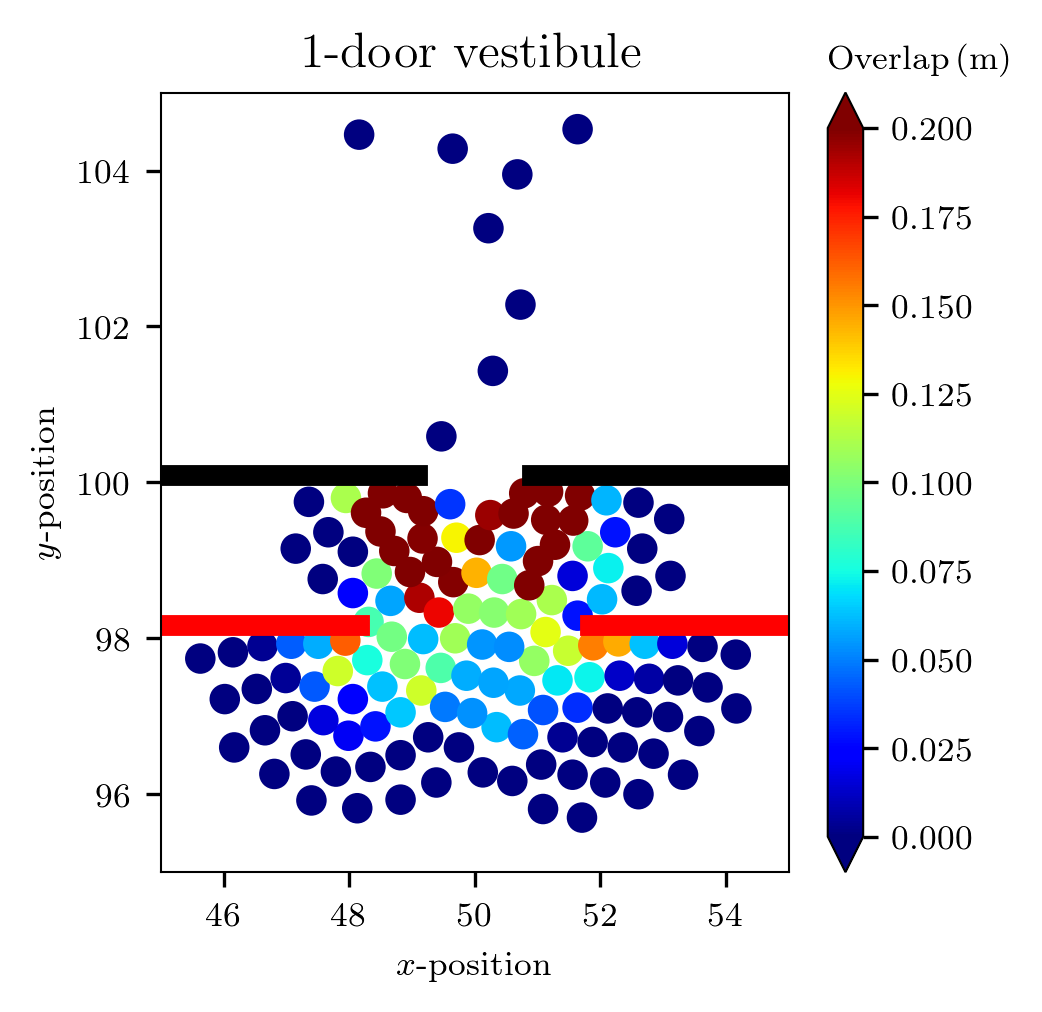
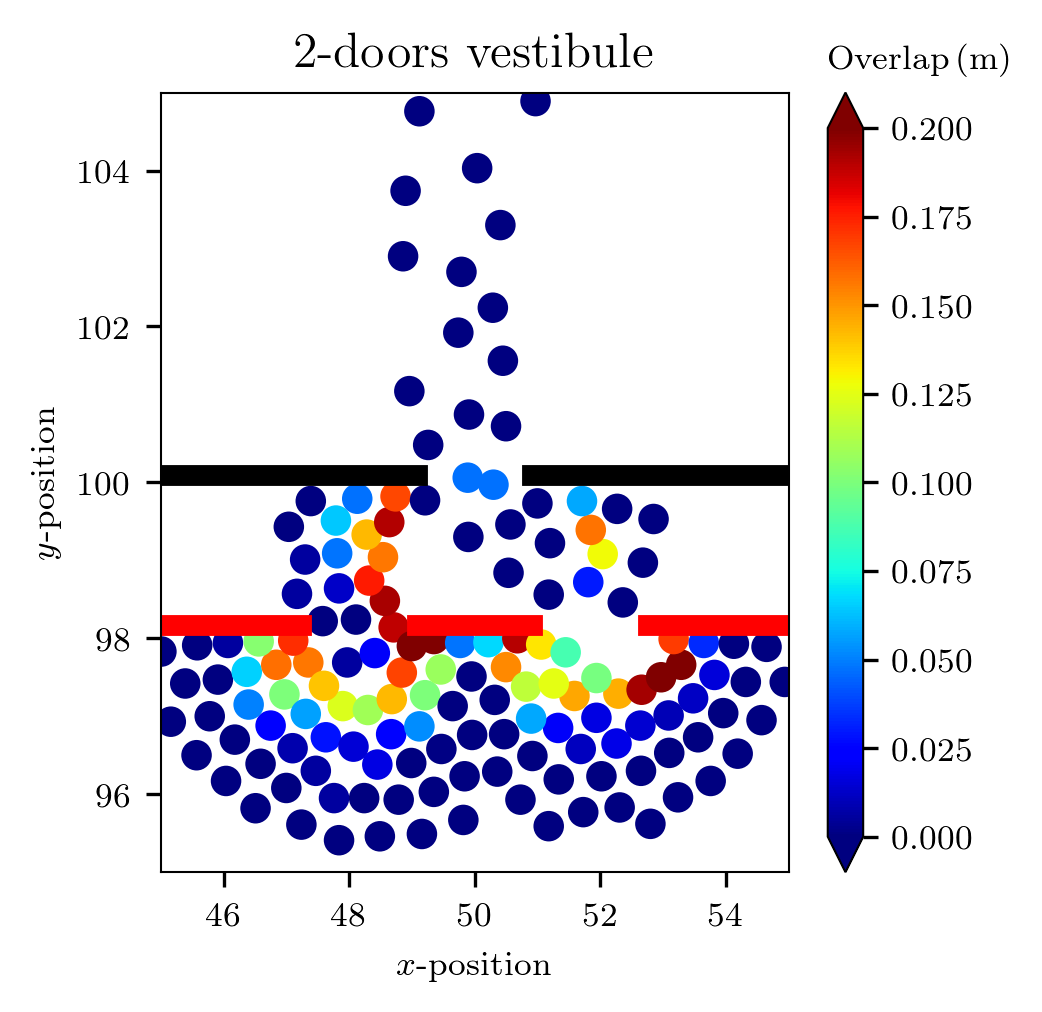
pressure on pedestrians. As a first approach, we display 3 snapshots of
evacuations for three different layouts: no-vestibule
(Fig. 8a), 1-door vestibule
(Fig. 8b), and 2-doors vestibule
(Fig. 8c). Each circle represents a simulated
pedestrian. The color of each agent reflects the level of overlap
(see caption for details).
It is easy to observe that the no-vestibule situation exhibits the highest
pressure among the three situations explored. The 1-door vestibule produces
lower pressure than the no-vestibule situation and, the 2-door vestibule
scenario produces even less pressure than the 1-door vestibule
(see Fig.8). Two reasons explain the pressure reduction
produced by the vestibule, as follows.
The first reason is that the interaction at the vestibule doors reduces the
velocity of pedestrians inside the vestibule region (which reduces the pressure).
In other words, the vestibule doors alleviate the strain on the escaping pedestrians at
the exit. This phenomenon, explains the difference between the no-vestibule
scenario and the vestibule condition.
The second reason that explains the pressure reduction concerns crowd
dispersion. The more dispersed the crowd is, the lower the pressure. The 2-doors
scenario shows a more dispersed crowd in the zone before the vestibule. In other
words, the 2-door vestibule “forces the crowd” to split into two halves (one
for each door) which produces an overall density reduction (hence a pressure
reduction). The parameter is the key factor to control the crowd
dispersion.
We computed the mean overlap to quantify the crowd pressure for
different structural conditions ( and ). This metric is the mean crowd
overlap averaged over time at different initial conditions.
Fig. 9 shows the
mean overlap as a function of for different vestibule widths .
Fig. 9a corresponds to the 1-door vestibule and
Fig. 9b corresponds to
the 2-doors vestibule. The horizontal dashed line represents the mean overlap
for the no-vestibule situation.
For all the explored conditions, the vestibule produces a lower mean overlap
than the no-vestibule situation (all curves lies below the horizontal dashed
line in Fig. 9). The 2-door vestibule scenario
(Fig. 9b) exhibits less pressure than the 1-door
vestibule scenario (Fig. 9a) for any of the structural
condition explored. Roughly, the 2-door vestibule shows a decreasing mean
overlap as increases, whereas the 1-door vestibule presents a
quasi-constant pattern for any value.
The decreasing trend in the 2-doors vestibule is a consequence of the crowd
dispersion. Recall that, increasing means increasing the distance between
the edges of the 2 doors (see Fig.2). Therefore, in the 2-doors
scenario, the higher , the more spread the crowd is. This phenomenon has a
direct consequence on the pressure reduction.
On the other hand, the 1-door vestibule does not significantly spread out
the crowd as increases because the crowd is not split into two halves
(unlike in the 2-doors scenario). This is why the overlap exhibits a
quasi-constant pattern in Fig. 9a.
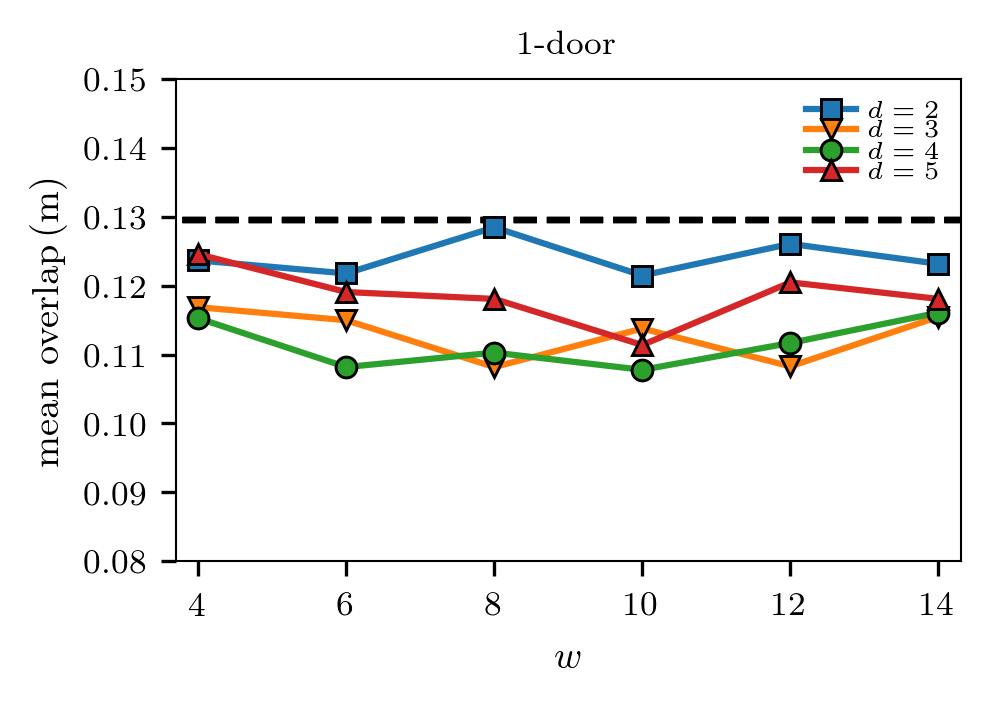
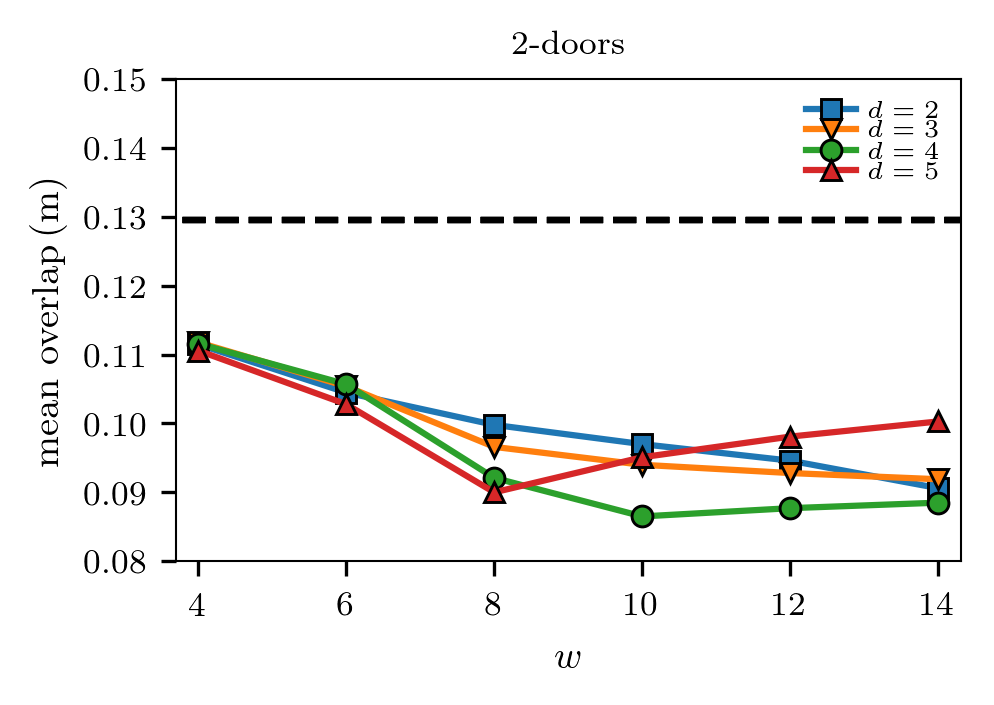
Although the results presented in Fig. 9 correspond to
m/s, we obtained similar patterns for desired velocities in the
interval m/s. We remark that, in addition to the
pedestrian-pedestrian interaction, the pedestrian-wall interaction is taken into
account in this analysis.
The above results can be summarized as follows. Our numerical simulations
indicate that the presence of a vestibule reduces the
overall pressure in the crowd. This result holds for any of the structural
condition (varying and ). We highlight that the 2-door vestibule appears
as the
most effective way of reducing the crowd pressure. The key to this pressure
reduction has two components. On one hand, the presence of the vestibule
reduces the velocity inside the vestibule region which reduces the pressure.
On the other hand, the increase in the parameter allows the crowd to
spread out, thus, reducing the density in the area next to the vestibule.
5 Conclusions
We propose architectural improvements to enhance the evacuation performance in
emergency situations. We performed numerical simulations, in the context of the
social force model, in order to recreate a crowd of N=200 pedestrians
evacuating a room under a highly stressing situation (m/s).
We explored 3 layout conditions: the no vestibule scenario, the 1-door
vestibule, and the 2-doors vestibule. The structural parameters that
characterize the vestibule conditions are (the vestibule width) and (the
vestibule door width). We found that an adequate selection of these parameters
can substantially increase the evacuation flow.
The optimal evacuation flow (p/s) is achieved at , for
the 1-door vestibule and, at , for the 2-doors vestibule. This is a
remarkable improvement considering that the no-vestibule scenario yields
p/s (for m/s in all cases).
The key to understanding this phenomenon is that and control the density
in the inner vestibule region. Low density values (p/m2) produce a suboptimal evacuation flow because there is unused
space left close to the exit door. This state makes the crowd to evacuate “in
dribs and drabs”.
Intermediate density values (p/m2) maximize the evacuation
flow because the inner vestibule receives the maximum possible amount of
pedestrians without producing many blocking clusters at the exit door. In the
opposite case, high density values (p/m2), yield a suboptimal
evacuation flow because it increases the probability of producing blocking
clusters at the exit.
Another important achievement is the pressure reduction attained by the
vestibule layouts (in comparison with the no-vestibule scenario). Although both
of the explored vestibules (i.e. the 1-door and the 2-doors vestibule)
reduce the crowd pressure, it is the 2-doors vestibule the one that lowers the
pressure the most. This phenomenon occurs because increasing in this layout
forces the crowd to spread out more, thus reducing the local density in the
area before the vestibule.
It is also quite relevant that this kind of architectural improvement do not
require the pedestrians to be trained to adopt the expected behavior for
a successful evacuation.
Although this is a numerical study, we believe that the principles elaborated
here are strong enough to be tested empirically in future investigations. As a
final word, we would like this paper to be a valuable source of inspiration for
future research that truly seeks to improve the human condition.
Appendix A Evacuation flow for a larger crowd
In order to make a brief assessment of the robustness of the results presented
in this paper, we performed numerical simulations for a larger crowd. In this
appendix, we show the flow vs. for different values for an initial crowd
of size N=600 (remember that we have already shown results for N=200).
Fig. 10a displays the results
corresponding to the 1-door vestibule and Fig. 10b shows
the results corresponding to the 2-doors vestibule. The horizontal dashed line
stands for the evacuation flow in the “no-vestibule” scenario at N=600. The
most remarkable characteristic is that the vestibule still proves to achieve a
considerable flow increment for a crowd as large as N=600.
Both vestibule layouts seem to improve the evacuation performance. However, the
2-doors vestibule yields higher flow values than the 1-door vestibule. Moreover,
in the 2-door vestibule scenario, there is a wider range of structural
parameters and that surpass the flow of the no-vestibule condition.
The result presented in this appendix suggest that the vestibule improvement
can be extrapolated to larger crowds. Nevertheless, we strongly advice
exploring the scope and robustness of the vestibule in order to avoid unwanted
consequences for the safety of evacuating pedestrians.
Appendix B Flow vs. door size in the no-vestibule condition
In Section 4 we show the flow vs. relationships for the 1-door
vestibule (Fig. 3) and the 2-doors vestibule
(Fig. 5). We noticed that the maximum flow value for the
1-door vestibule is at , whereas the maximum flow value for 2-doors is
at . In this appendix, we provide an explanation for this “shifting”
behavior.
First, we calculated the flow vs. in a regular bottleneck (no-vestibule
scenario) to have a more fundamental understanding of the problem.
Fig. 11a show the flow vs. the door width for
different desired velocities. It is possible to observe 2 distinctive
regimes.
The interval is characterized by the faster-is-slower. This regime is
dominated by the blocking clusters and the friction force. On the other hand,
the interval is characterized by the faster-is-faster phenomena (the
higher the higher the evacuation flow). In this regime, the door is so
large that the blocking clusters become unstable.
We focus on the faster-is-slower regime () and the desired velocities
associated with high anxiety (m/s). Therefore, in
Fig. 11b we “zoom in” and show the evacuation flow as a
function of only for m/s. It is worth mentioning that any exhibits a similar behavior.
At a first sight, it is possible to observe that the flow does not hold a linear
relation in . This result is in agreement with the laboratory and empirical
results reported in Refs. [33, 34].
However, we acknowledge that there is an ongoing discussion on this
topic since other experiments seem to yield a linear relation instead of a
non-linear one [35, 36].
Nevertheless, the non-linear behavior exhibited in Fig. 11b is
a sufficient justification for the “shifting” behavior in the flow vs.
curves (Fig. 3 and Fig. 5). In other
words, the non-linearity in implies that a layout with only one exit
of width yields more evacuation flow than a layout composed of 2 separated
exits of each. If the was linear, then we would expect no shifting
behavior, since in this hypothetical case, the inflow to the vestibule
provided by the 1-door scenario would be the same as the 2-doors scenario (at
constant ).
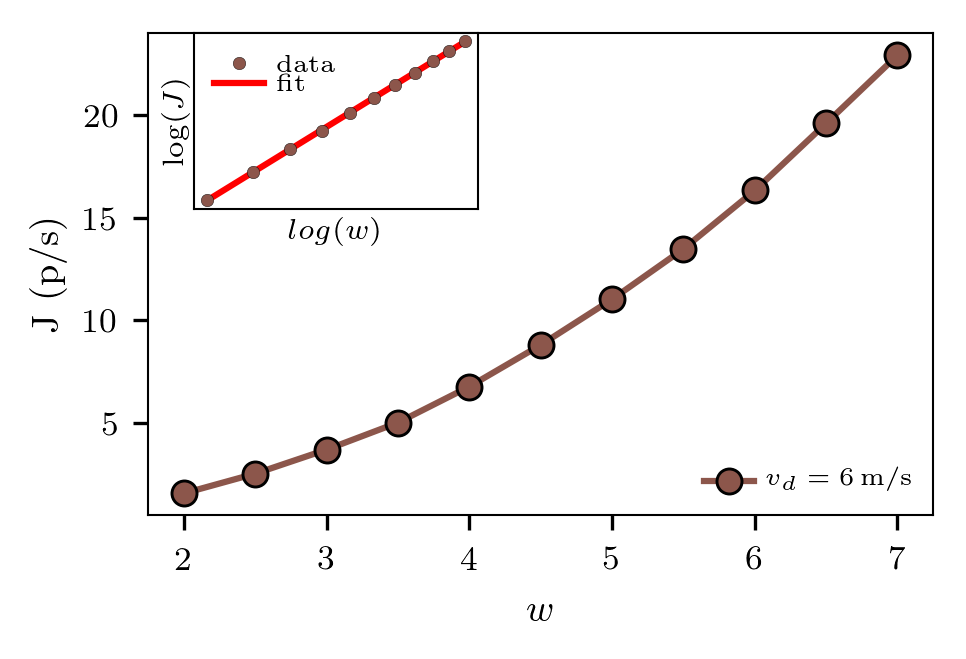
In order to have a deeper understanding of the phenomena. We calculated a linear
regression to the log data from Fig. 11b (see the inset plot).
The slope obtained by this regression is . This means that the flow
vs.
relation holds a quasi-quadratic behavior.
Although the analogy with granular media accelerated by gravity is not
straightforward, we cannot fail to mention that there is an apparent
similarity between the behavior described above and the Hagen-Beverloo’s
equation for the flow discharge of particles in a
silo [37].
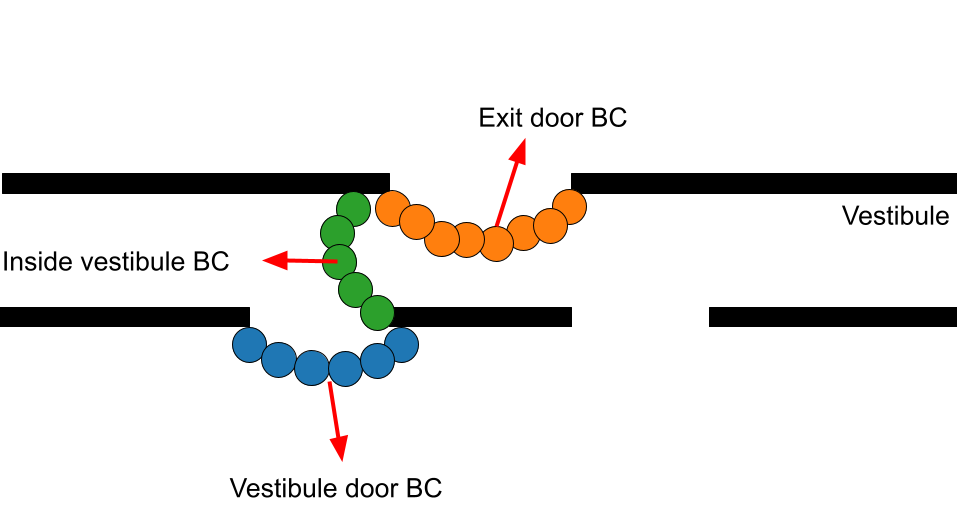
Appendix C Types of Blocking clusters
In this appendix, we illustrate the blocking clusters that can be formed in the
2-doors vestibule layout. Three types of blocking clusters (BC) can be
distinguished. The “exit door blocking cluster”, the “inside vestibule
blocking cluster” (which is formed formed perpendicular to the vestibule
length), and the “vestibule door blocking cluster”. This latter type of BC is
formed in the zone prior to the vestibule door.
Acknowledgments
This work wassupported by the Fondo para la investigación científica y
tecnológica(FONCYT) grant Proyecto de investigación científica y
tecnológica Number PICT-2019-2019-01994. G.A. Frank thanks Universidad
Tecnológica Nacional (UTN) for partial support through Grant PID Number
SIUTNBA0006595.
References
References
- [1] D. T. G. Daniel, E. A. Alpert, E. Jaffe, The crowd crush at mount meron: Emergency medical services response to a silent mass casualty incident, Disaster Medicine and Public Health Preparedness (2022) 1–3.
- [2] M. M. de Almeida, J. von Schreeb, Human stampedes: An updated review of current literature, Prehospital and disaster medicine 34 (1) (2019) 82–88.
- [3] D. Helbing, I. Farkas, T. Vicsek, Simulating dynamical features of escape panic, Nature 407 (6803) (2000) 487–490.
- [4] A. Kirchner, K. Nishinari, A. Schadschneider, Friction effects and clogging in a cellular automaton model for pedestrian dynamics, Physical review E 67 (5) (2003) 056122.
- [5] M. Haghani, Optimising crowd evacuations: Mathematical, architectural and behavioural approaches, Safety science 128 (2020) 104745.
- [6] A. Abdelghany, K. Abdelghany, H. Mahmassani, W. Alhalabi, Modeling framework for optimal evacuation of large-scale crowded pedestrian facilities, European Journal of Operational Research 237 (3) (2014) 1105–1118.
- [7] S. C. Pursals, F. G. Garzón, Optimal building evacuation time considering evacuation routes, European Journal of Operational Research 192 (2) (2009) 692–699.
- [8] X. Song, L. Ma, Y. Ma, C. Yang, H. Ji, Selfishness-and selflessness-based models of pedestrian room evacuation, Physica A: Statistical Mechanics and its Applications 447 (2016) 455–466.
- [9] Y. Cheng, X. Zheng, Emergence of cooperation during an emergency evacuation, Applied Mathematics and Computation 320 (2018) 485–494.
- [10] X. Shi, Z. Ye, N. Shiwakoti, D. Tang, J. Lin, Examining effect of architectural adjustment on pedestrian crowd flow at bottleneck, Physica A: Statistical Mechanics and its Applications 522 (2019) 350–364.
- [11] D. Helbing, L. Buzna, A. Johansson, T. Werner, Self-organized pedestrian crowd dynamics: Experiments, simulations, and design solutions, Transportation science 39 (1) (2005) 1–24.
- [12] G. A. Frank, C. O. Dorso, Room evacuation in the presence of an obstacle, Physica A: Statistical Mechanics and its Applications 390 (11) (2011) 2135–2145.
- [13] I. Sticco, G. Frank, C. Dorso, Improving competitive evacuations with a vestibule structure designed from panel-like obstacles in the framework of the social force model, Safety science 146 (2022) 105544.
- [14] Y. Zhao, T. Lu, L. Fu, P. Wu, M. Li, Experimental verification of escape efficiency enhancement by the presence of obstacles, Safety science 122 (2020) 104517.
- [15] Á. Garcimartín, D. Maza, J. M. Pastor, D. R. Parisi, C. Martín-Gómez, I. Zuriguel, Redefining the role of obstacles in pedestrian evacuation, New Journal of Physics 20 (12) (2018) 123025.
- [16] C. Feliciani, I. Zuriguel, A. Garcimartín, D. Maza, K. Nishinari, Systematic experimental investigation of the obstacle effect during non-competitive and extremely competitive evacuations, Scientific reports 10 (1) (2020) 1–20.
- [17] D. Helbing, A. Johansson, H. Z. Al-Abideen, Dynamics of crowd disasters: An empirical study, Physical review E 75 (4) (2007) 046109.
- [18] A. Garcimartín, J. M. Pastor, C. Martín-Gómez, D. Parisi, I. Zuriguel, Pedestrian collective motion in competitive room evacuation, Scientific reports 7 (1) (2017) 1–9.
- [19] F. E. Cornes, G. A. Frank, C. O. Dorso, High pressures in room evacuation processes and a first approach to the dynamics around unconscious pedestrians, Physica A: Statistical Mechanics and its Applications 484 (2017) 282–298.
- [20] C. Wang, W. Weng, Study on the collision dynamics and the transmission pattern between pedestrians along the queue, Journal of Statistical Mechanics: Theory and Experiment 2018 (7) (2018) 073406.
- [21] G. H. Risto, H. J. Herrmann, et al., Density patterns in two-dimensional hoppers, Physical Review E 50 (1) (1994) R5.
- [22] I. Sticco, G. Frank, C. Dorso, Social force model parameter testing and optimization using a high stress real-life situation, Physica A: Statistical Mechanics and its Applications 561 (2021) 125299.
- [23] A. Strachan, C. Dorso, Fragment recognition in molecular dynamics, Physical Review C 56 (2) (1997) 995.
- [24] D. R. Parisi, C. O. Dorso, Microscopic dynamics of pedestrian evacuation, Physica A: Statistical Mechanics and its Applications 354 (2005) 606–618.
- [25] I. M. Sticco, G. A. Frank, S. Cerrotta, C. O. Dorso, Room evacuation through two contiguous exits, Physica A: Statistical Mechanics and its Applications 474 (2017) 172–185.
- [26] F. Cornes, G. Frank, C. Dorso, Microscopic dynamics of the evacuation phenomena in the context of the social force model, Physica A: Statistical Mechanics and its Applications 125744.
- [27] D. Littlefield, Metric handbook, Routledge, 2008.
- [28] D. R. Parisi, A. G. Sartorio, J. R. Colonnello, A. Garcimartín, L. A. Pugnaloni, I. Zuriguel, Pedestrian dynamics at the running of the bulls evidence an inaccessible region in the fundamental diagram, Proceedings of the National Academy of Sciences 118 (50) (2021) e2107827118.
- [29] S. Plimpton, Fast parallel algorithms for short-range molecular dynamics, Journal of computational physics 117 (1) (1995) 1–19.
- [30] C. M. Harris, Dictionary of Architecture and Construction., McGraw-Hill, 2006.
- [31] Z. Ding, Z. Shen, N. Guo, K. Zhu, J. Long, Evacuation through area with obstacle that can be stepped over: experimental study, Journal of Statistical Mechanics: Theory and Experiment 2020 (2) (2020) 023404.
- [32] L. Fullard, E. Breard, C. Davies, A. Godfrey, M. Fukuoka, A. Wade, J. Dufek, G. Lube, The dynamics of granular flow from a silo with two symmetric openings, Proceedings of the Royal Society A 475 (2221) (2019) 20180462.
- [33] M. Haghani, M. Sarvi, Z. Shahhoseini, When ‘push’does not come to ‘shove’: Revisiting ‘faster is slower’in collective egress of human crowds, Transportation research part A: policy and practice 122 (2019) 51–69.
- [34] S. Gwynne, E. Kuligowski, J. Kratchman, J. A. Milke, Questioning the linear relationship between doorway width and achievable flow rate, Fire Safety Journal 44 (1) (2009) 80–87.
- [35] A. Seyfried, O. Passon, B. Steffen, M. Boltes, T. Rupprecht, W. Klingsch, New insights into pedestrian flow through bottlenecks, Transportation Science 43 (3) (2009) 395–406.
- [36] W. Tian, W. Song, J. Ma, Z. Fang, A. Seyfried, J. Liddle, Experimental study of pedestrian behaviors in a corridor based on digital image processing, Fire Safety Journal 47 (2012) 8–15.
- [37] W. A. Beverloo, H. A. Leniger, J. Van de Velde, The flow of granular solids through orifices, Chemical engineering science 15 (3-4) (1961) 260–269.