33email: gmvincen@ncsu.edu 33email: alice.r.yepremyan@jpl.nasa.gov 33email: chenjingdao@cse.msstate.edu 33email: edwin.y.goh@jpl.nasa.gov
Mixed-domain Training Improves Multi-Mission Terrain Segmentation
Abstract
Planetary rover missions must utilize machine learning-based perception to continue extra-terrestrial exploration with little to no human presence. Martian terrain segmentation has been critical for rover navigation and hazard avoidance to perform further exploratory tasks, e.g. soil sample collection and searching for organic compounds. Current Martian terrain segmentation models require a large amount of labeled data to achieve acceptable performance, and also require retraining for deployment across different domains, i.e. different rover missions, or different tasks, i.e. geological identification and navigation. This research proposes a semi-supervised learning approach that leverages unsupervised contrastive pretraining of a backbone for a multi-mission semantic segmentation for Martian surfaces. This model will expand upon the current Martian segmentation capabilities by being able to deploy across different Martian rover missions for terrain navigation, by utilizing a mixed-domain training set that ensures feature diversity. Evaluation results of using average pixel accuracy show that a semi-supervised mixed-domain approach improves accuracy compared to single domain training and supervised training by reaching an accuracy of 97% for the Mars Science Laboratory’s Curiosity Rover and 79.6% for the Mars 2020 Perseverance Rover. Further, providing different weighting methods to loss functions improved the models correct predictions for minority or rare classes by over 30% using the recall metric compared to standard cross-entropy loss. These results can inform future multi-mission and multi-task semantic segmentation for rover missions in a data-efficient manner.
Keywords:
semantic segmentation, semi-supervised learning, planetary rover missions1 Introduction
Planetary rover missions such as Mars 2020 (M2020) [25] and the Mars Science Laboratory (MSL) [10] have been critical for the exploration of the Martian surfaces without a human presence. Terrain segmentation has been necessary for a rovers ability to navigate and maneuver autonomously, and it involves identifying features across the surface’s terrain e.g., soil, sand, rocks, etc. Automated pipelines that utilize deep learning (DL) can enable the efficient (pixel-wise) classification of large volumes of extra-terrestrial images [23] for use in downstream tasks and analyses. DL is notoriously sample inefficient [13], often requiring on the order of 10,000 examples to achieve good performance or retraining when moving across different domains (e.g., different missions, planets, seasons lighting conditions, etc.) [21]. As such, significant annotation campaigns are required to generate a large number of labeled images for model training. Furthermore, specialized annotations in the planetary science domain require the knowledge of experts such as geologists and rover drivers, which incurs additional cost. Inconsistencies with the taxonomy and lighting further complicate this issue.
To address this circular problem of requiring annotated examples to develop an automated annotation pipeline, this research aims to leverage semi-supervised learning for semantic segmentation (i.e., pixel-wise classification), with limited annotated examples across multiple missions. This framework will utilize a large number of unlabeled images through contrastive pretraining [3, 4] for a data-efficient way to extract general features and has been shown to outperform supervised learning [8]. This backbone model is then finetuned using a mixed-domain dataset that captures the diverse feature information across the different planetary missions. The ability to achieve state-of-the-art semantic segmentation performance with minimal labels will be integral for conducting downstream science (geological identification) and engineering (navigation) tasks across the M2020 and MSL missions, as well as future Lunar and Ocean Worlds missions.
In summary, the contributions of this work are 1) analyzing a mixed-domain training set for multi-mission segmentation that isolates the change in domain and the change in number of samples to understand the effects of different training set compositions, 2) introducing a contrastive self-supervised pretraining network to improve performance on limited-label multi-mission terrain segmentation, and 3) addressing the class imbalance through reweighting loss functions.
The rest of the paper is organized as follows. Section 2 describes current computer vision applications in planetary science as well as the transfer learning methods, while Section 3 details the data collection of the AI4Mars datasets and summarizes the technical approach. Section 4 presents in detail the results of the contributions listed above.
2 Related Work
2.1 Planetary Computer Vision
Planetary computer vision applications have increased in the recent decades to increase capability and automation of planetary exploration and data analysis. The Planetary Data System (PDS) allows for the archival of image data collected from different NASA missions, e.g. MER [5], MSL [10], HiRISE [16], etc. These datasets have been used to train classifiers to detect classes of interest [18, 24]. Development of annotated datasets allowed for deployment of multi-label Convolutional Neural Networks (CNNs) for classification of both science and engineering tasks for individual missions [15, 23] which showed performance improvements over Support Vector Machine (SVM) classifiers. Additional planetary applications include the Science Captioning of Terrain Images (SCOTI) [19] which generates text captions for terrain images.
2.1.1 Terrain Segmentation
Semantic segmentation for planetary rover missions on Mars has primarily focused on engineering-based tasks such as terrain classification for downstream navigation [6, 12, 17]. The development of the annotated AI4Mars dataset [21] has enabled the segmentation of Martian surfaces. SPOC (Soil Property and Object Classification) [20] leverages the AI4Mars dataset to segment the Martian terrain by utilizing a fully-convolutional neural network.
2.1.2 Self-supervised Learning
Self-supervised and semi-supervised learning can potentially alleviate the significant effort used to annotate rover images in the AI4Mars dataset. Self-supervised networks have aided in the process of annotating images by developing clusters of relevant terrain classes utilizing unlabeled images [18]. Contrastive learning has emerged as an important self-supervised learning technique where a network is trained on unlabeled data to maximize agreement between randomly augmented views of the same image and minimize agreement between those of different images [3, 4]. By using these contrastive-pretrained weights (as opposed to supervised pretrained weights) as a starting point for supervised finetuning, it has been shown that contrastive pretraining improves performance on Mars terrain segmentation when only limited annotated images are available [8]. This work extends prior work by finetuning the generalized representations obtained through contrastive pretraining on mixed-domain datasets to improve performance across multiple missions.
3 Methodology
3.1 Dataset Composition
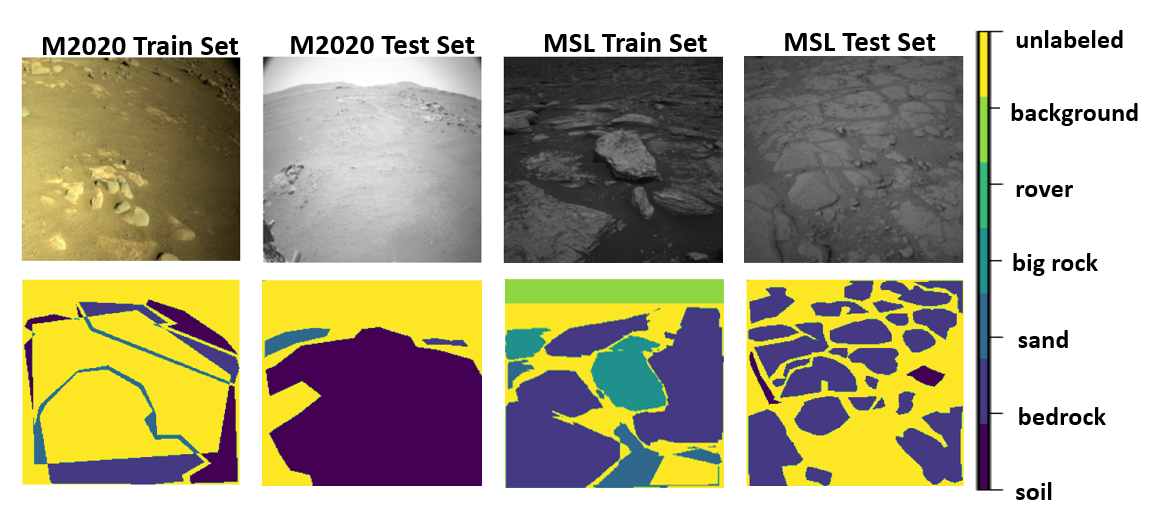
This section presents the two primary datasets used in this work, as well as the mixed-domain dataset resulting from their combination. Note that the expert-labeled test sets for MSL and M2020 (322 and 49 images, respectively) are held constant throughout this paper for evaluation. We only manipulate and vary the training set size (number of images) and composition.
3.1.1 MSL AI4Mars Dataset
The AI4Mars dataset [21] is comprised of more than 50k images from the PDS captured by the MSL’s grey-scale navigation camera (NAVCAM) and color mast camera (Mastcam) as well as MER. Citizen scientists around the world annotated MSL images at the pixel-level with one of four class labels, i.e., soil, bedrock, sand, and big rock, resulting in more than 16,000 annotated training images. A testing set of 322 images was composed by three experts with unanimous pixel-level agreement.
Additionally, the MSL dataset provides two additional masks — one for rover portions present in the image and another for pixels beyond 30m from the rover. While [21] treats pixels that fall under these two masks as null or unlabeled, this paper investigates the feasibility and utility of treating them as additional classes, namely “rover” and “background”, respectively. Unlabeled pixels, or pixels with insufficient consensus in the citizen scientist annotations, are removed from the metrics calculations in training and evaluation.
3.1.2 M2020 AI4Mars Dataset
To evaluate multi-mission segmentation on the M2020 mission, this paper leverages images from M2020’s color NAVCAM that were annotated using the same citizen scientist workflow for the MSL AI4Mars dataset. The M2020 dataset consists of a training set of 1,321 color images that span Sols 0-157 with four classes, i.e., soil, bedrock, sand, big rock. The testing set was comprised of 49 grey-scale images from Sols 200-203 manually annotated by an expert. The M2020 and MSL datasets differ primarily in the lack of rover and range masks for M2020 in addition to the image dimensions (1280 x 960 on M2020 compared to 1024 x 1024 on MSL). In addition, M2020 training images are full color whereas MSL is grey-scale. The test sets on both MSL and M2020 are grey-scale.
3.1.3 Deployment for MSL and M2020
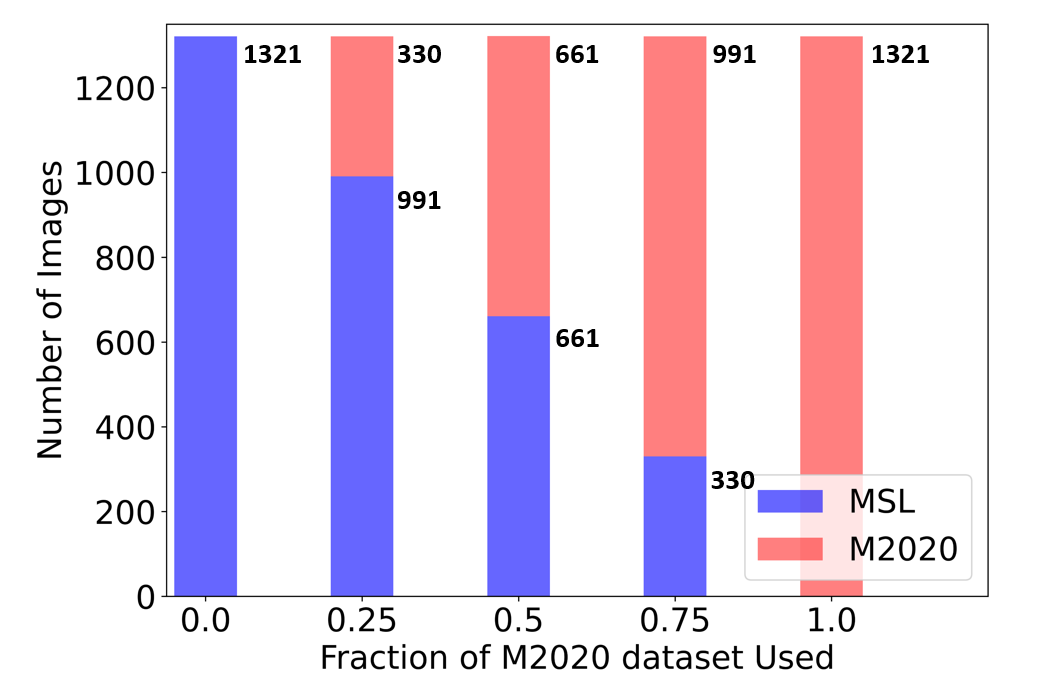
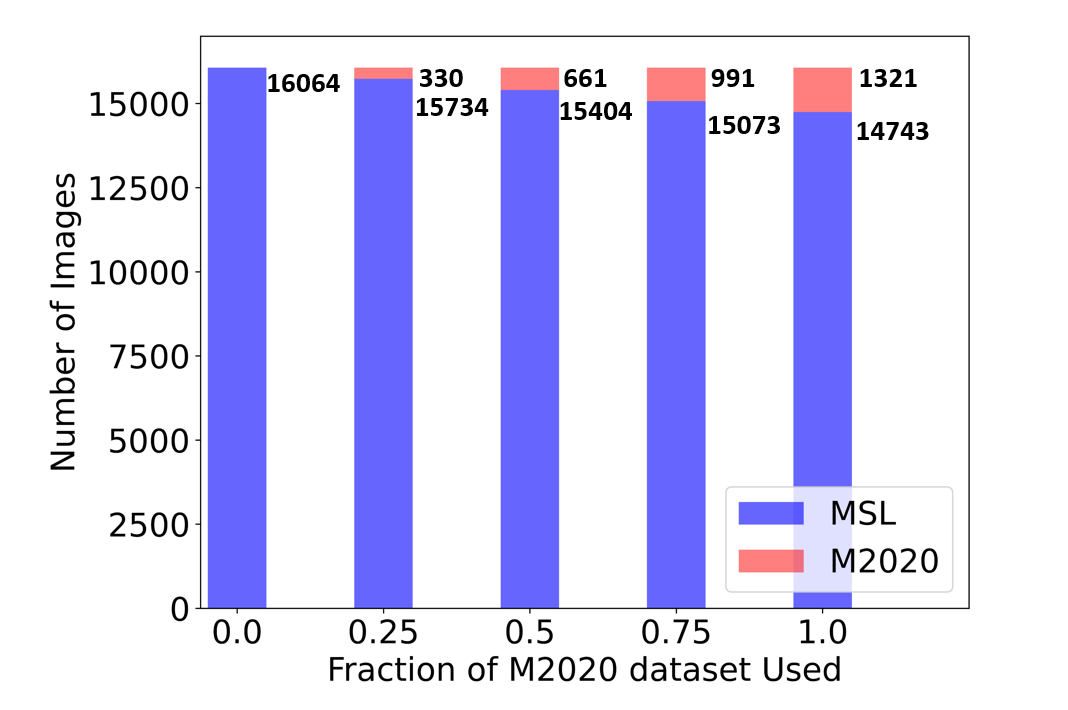
To deploy a single trained model across different missions, we merge the two datasets together, creating a mixed-domain dataset. In doing so, we ensure feature diversity across the domains such that the model does not overfit to one mission. To investigate the dependence of our mixed-domain approach on the composition the combined dataset, we performed two different experiments with a different maximum number of images set to match the total number of images in the M2020 training set, 1,321 images (Fig. 2(a)), and the total number of images in the MSL training set, 16,064 images (Fig. 2(b)). This maximum number of images allows for the number of images from both the MSL AI4Mars and M2020 datasets to be varied to see the importance of one dataset over the other, since the M2020 dataset is roughly 1/10th the size of the MSL dataset.
3.2 Semi-Supervised Finetuning
In this work, we train a segmentation network based on the DeepLab architecture [2] to perform semantic segmentation on Mars terrain images. We finetune pretrained backbones on a combined MSL and M2020 dataset for 50 iterations with a batch size of 16 and a learning rate of . To investigate model performance under limited labels, we also vary the number of labeled training images provided from 1%-100% of the available 17,385 training images.
The DeepLab architecture combines a ResNet encoder [11] with a segmentation module based on Atrous Spatial Pyramid Pooling (ASPP) [2]. Due to the relatively small number of labeled images, on the order of 10k, we leverage transfer learning rather than training the segmentation model from scratch. In other words, we initialize the encoder with pretrained weights and randomly initialize the decoder weights before finetuning for 50 additional epochs on the labeled Mars images.
The choice of pretrained weights used to initialize the encoder has been shown to play an important role in downstream segmentation performance. In particular, transferring ResNet weights that were pretrained using the SimCLR framework on unlabeled ImageNet images [4] enables better Mars terrain segmentation performance under limited labels compared to ResNet weights that were pretrained in a supervised fashion (i.e., with labels) on ImageNet [8]. In this work, we investigate whether the contrastive pretraining framework is advantageous and generalizes weights for different missions (M2020 vs. MSL) on a mixed domain dataset.
4 Results
4.1 Analysis of Dataset Composition
4.1.1 Mixed-Domain Training Improves Multi-Mission Segmentation Accuracy
Table 1 compares segmentation results between supervised and contrastive pretraining methods for the MSL and M2020 evaluation sets. The supervised pretraining tests are referred to as SPOC because they follow [1, 20, 21] in initializing the encoder using weights that were pretrained in a supervised manner to perform classification on the ImageNet dataset. The contrastive pretraining results are referred to as SimCLR as they leverage the weights [3, 4] that were pretrained in an unsupervised manner on unlabeled ImageNet images. The MSL, M2020, and MSL combined with M2020 were the training sets used to evaluate performance across MSL and M2020 test sets for both pretraining methods.
| Evaluated On: | MSL | M2020 | ||||||||||||||
|---|---|---|---|---|---|---|---|---|---|---|---|---|---|---|---|---|
| Trained On: |
|
|
|
|
||||||||||||
| Acc | F1 | Acc | F1 | Acc | F1 | Acc | F1 | |||||||||
| SPOC | 0.959 | 0.840 | 0.965 | 0.860 | 0.662 | 0.495 | 0.745 | 0.544 | ||||||||
| SimCLR | 0.965 | 0.900 | 0.970 | 0.885 | 0.732 | 0.539 | 0.796 | 0.610 | ||||||||
When finetuned and evaluated on MSL, a model using either SPOC or SimCLR achieves an average pixel accuracy of 96%. However, we see a large performance decrease when the model is finetuned and evaluated on M2020, with an average pixel accuracy 66.2% and 73.2% for SPOC and SimCLR, respectively. This decrease in performance could be attributed to the large discrepancy in dataset sizes. As mentioned in Sec. 1, the number of images in the M2020 dataset is only 8.2% of MSL (i.e., 1,321 vs. 16,064 images). Furthermore, M2020 only has 49 expert labeled images in the test set, compared to 322 test images in the MSL dataset.
However, finetuning with a combined dataset of MSL and M2020 images (MSL + M2020 in Table 1) improves performance on both MSL and M2020 test sets across both pretraining methods. With SimCLR pretraining, finetuning on the combined dataset provides a 6% accuracy and 7% F-1 improvement on M2020 compared to finetuning only on M2020 data. On the other hand, SPOC experiences a higher accuracy improvement (8.3%) and a smaller F-1 improvement (4.9%) on the M2020 test set when using the combined dataset. The improvement on MSL with a combined dataset is marginal, with a 0.5% increase in accuracy across SPOC and SimCLR when comparing combined dataset finetuning to MSL-only finetuning. For M2020, this performance improvement is driven mainly by the increased number of training examples, which prevents the model from overfitting to only a few M2020 images.
Despite the limited M2020 examples, SimCLR demonstrates higher sample efficiency compared to SPOC, enabling a higher overall pixel accuracy. Yet, SPOC’s larger accuracy improvement could indicate a tendency for the task-specific supervised pretrained weights to overfit to classes that are more frequent or more closely related to the ImageNet pretraining task. In contrast, SimCLR’s larger F-1 improvement at the cost of accuracy could indicate that the task-agnostic contrastive pretrained weights tend to be updated in a more uniform fashion across all classes. In other words, contrastive pretraining acts as a form of implicit regularization in limited-labels regimes such as that encountered by M2020 and enables the model to favor variance in the bias-variance trade-off.
4.1.2 Model Performance is Sensitive to Images used in Dataset Composition
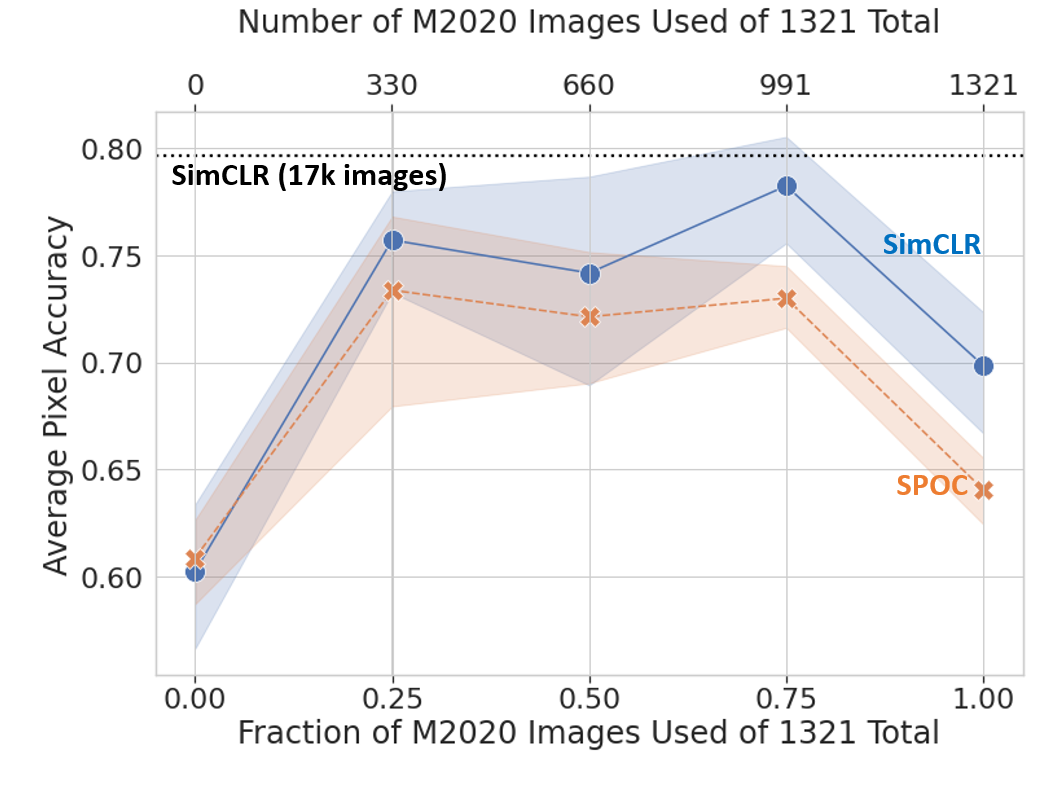
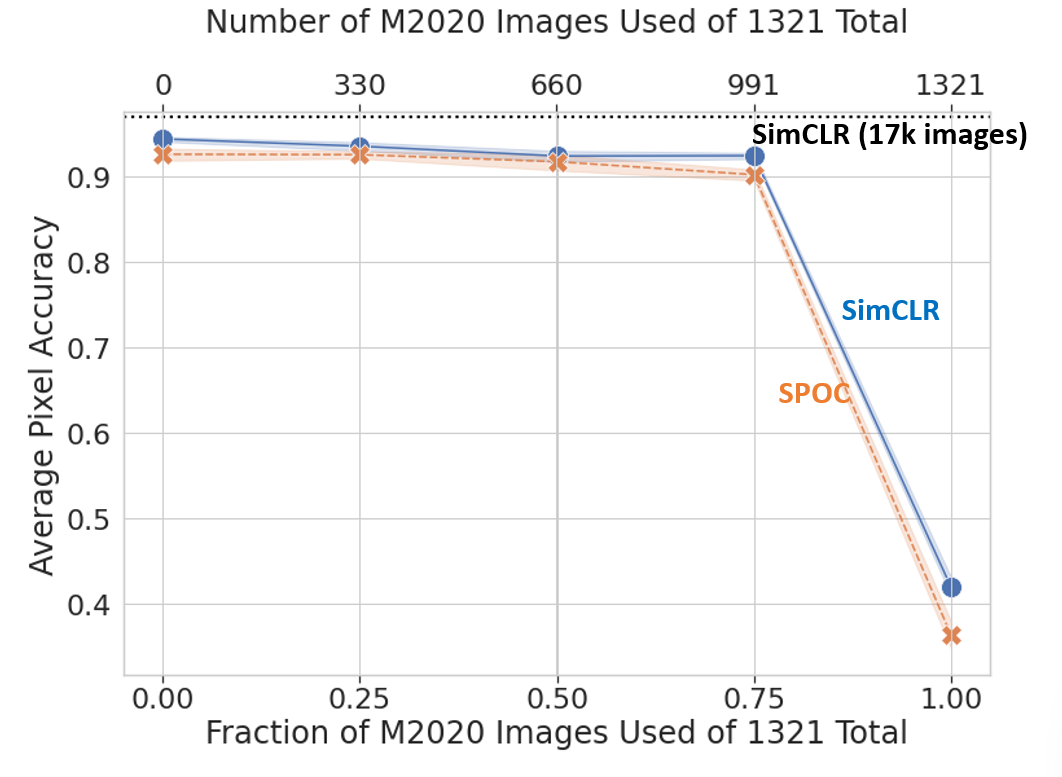
The initial results (Table 1) establish that using a combined, mixed-domain, dataset for finetuning improves performance on M2020 and MSL across SPOC (ImageNet supervised) and SimCLR (ImageNet contrastive) pretraining. This improvement can be attributed to the increased number of training examples (using the combined 17k training set vs. the 16k MSL or the 1.3k M2020 training sets) and the increased variety or variance in the domain of training images. To decouple these potentially-synergistic factors and isolate the mixed-domain effect, we performed two experiments where we fixed the total number of examples at 1,321 (i.e., the original number of M2020-only labeled images) and 16,064 (i.e., the original number of MSL-only labeled images), then experimented with the number of M2020 images used to replace MSL images in our mixed-domain dataset as illustrated in Fig. 2. For each dataset split, we ran multiple tests across different seeds to investigate how specific combinations of M2020 images present in the dataset (and conversely, specific combinations of MSL images not present) affect model performance.
Figure 3 shows the average pixel accuracy across the different sensitivity tests for each fraction of M2020 images used in a total dataset size of 1,321 images. Unsurprisingly, finetuning the SimCLR-pretrained weights with the full 17,385-image MSL+M2020 dataset (79.6%; black dotted line in Fig. 3(a)) outperforms the average runs across all fractions of M2020 images present. However, the performance is improved when there is more variety in the training set when compared to an in-domain or complete domain shift training set. This variety from the MSL images could be attributed to the increased number of sites, 77, that MSL explored compared to the 5 sites M2020 explored, thus contributing to performance improvements over the in-domain training.
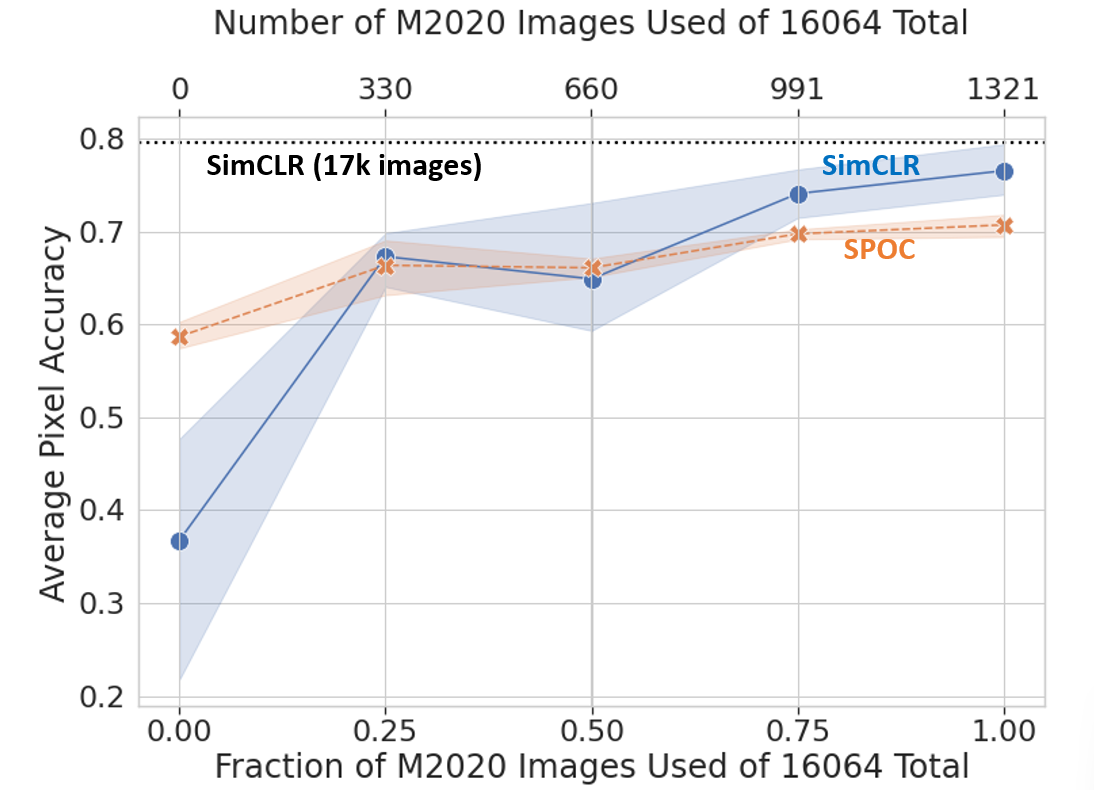
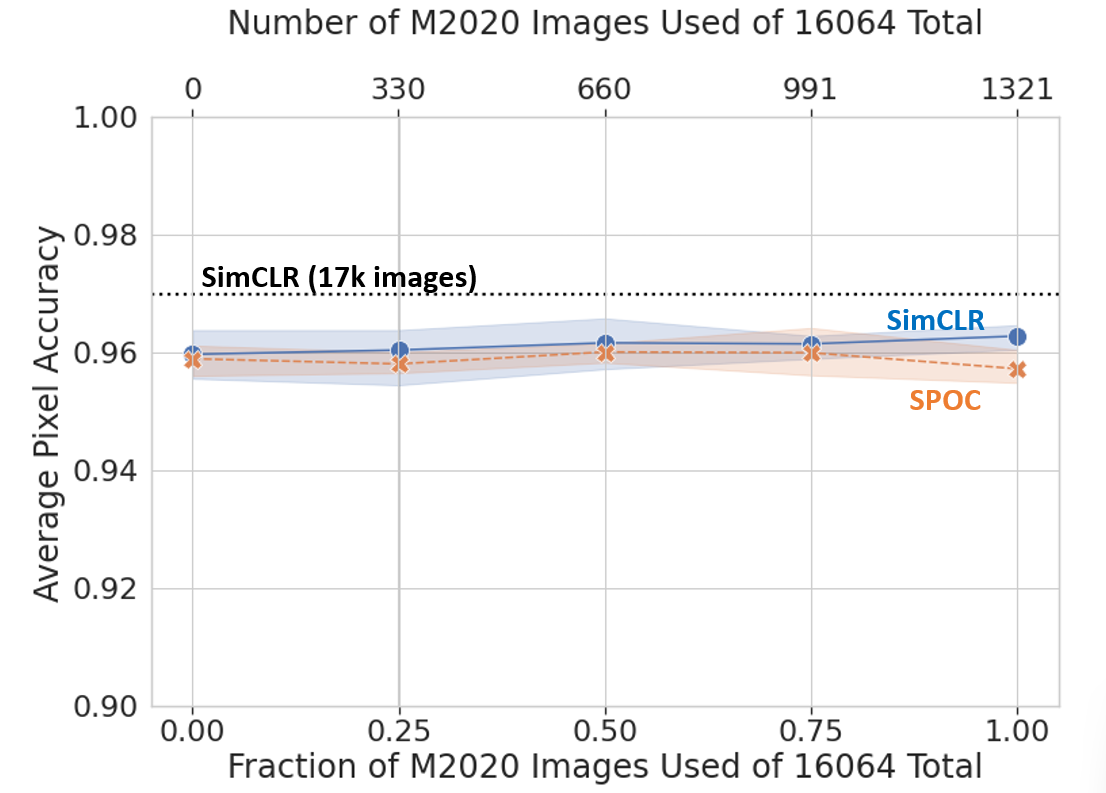
We see the same improvement when the number of training images is increased to 16k (Fig. 4(a)) since the increased fraction of M2020 images corresponds to a more diverse training set. This indicates that, independent of the total number of images, the fortuitous replacement of a specific combination of MSL images with M2020 images increases the dataset diversity and is important to the mixed-domain multi-mission terrain segmentation task. A larger dataset simply increases the probability that these important images will be seen by the model during training.
The sensitivity analysis of different pretraining methods and image samples had a marginal affect on the performance of the MSL test set, so long as there was MSL data present in training. Figure 3(b) shows that when a model is trained solely on M2020 images then evaluated on MSL, overall performance is decreased by more than 50% from the 17,385-image baseline. This significant decrease in performance results from the lack of MSL data present in training as well as the inherent decreased variety from the M2020 dataset that only explored 5 sites. Therefore when MSL images are present in training, there is minimal behavior shift is expected as the MSL image provide more variety in images and make up the bulk of the training set when the data is capped at 16,064 images. Still, Figures 3(b) and 4(b) shows across the sampling methods SimCLR outperforms SPOC’s supervised pretraining.
4.2 Segmentation with Fewer Labels
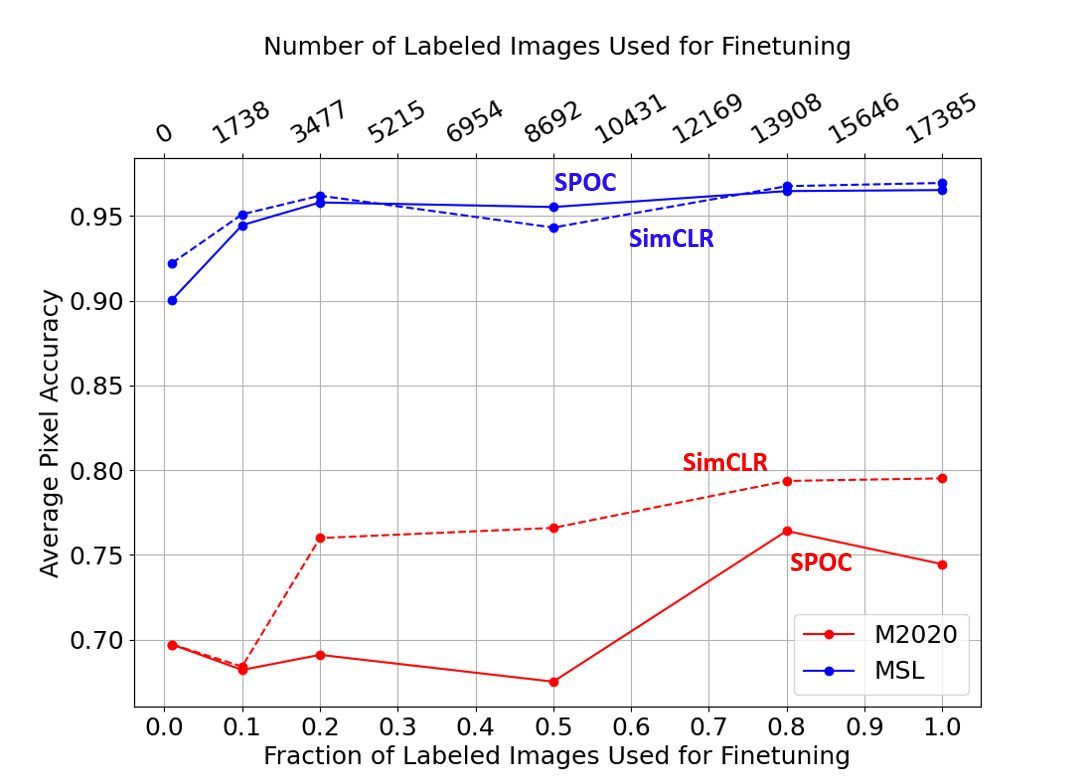
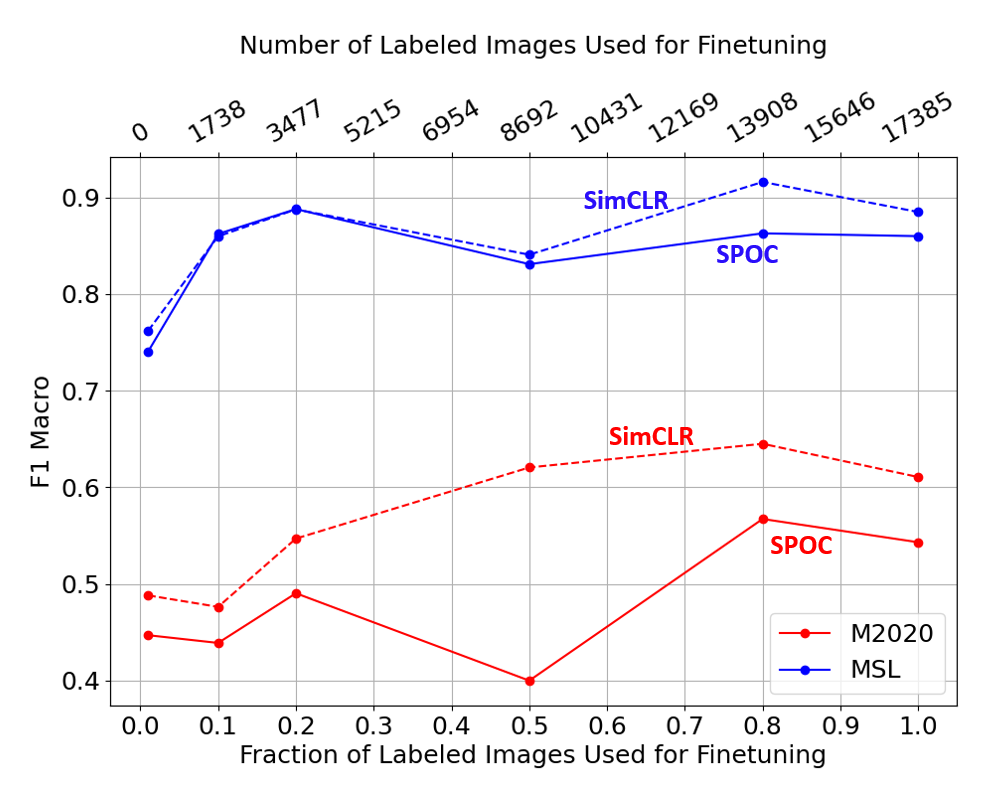
The generation of annotated datasets for the purpose of training deep learning models, specifically from such specific domains as planetary missions, requires significant analysis by experts such as planetary scientists, rover operators, and mission planners. This incurs additional time and cost, which can prohibit the application of computer vision-based algorithms on shorter or smaller (i.e., lower-budget) missions. Thus, utilizing fewer labeled images decreases the need for such efforts. Using the combined training sets from Sec. 1, we vary the number of labeled images used to finetune our network. The training datasets will vary in size from 173 (1% of the available labeled data) to 17,385 (100% of the available labeled data), note that the expert-labeled test sets are not varied. We stratify the sampled images across the two datasets; the ratio of M2020 to MSL images stays constant across all dataset sizes. For example, a label fraction of 0.1 would contain 1,739 images, of which 8.2% (143) would be M2020 images while the remaining 91.2% (1,586) would be MSL images.
Figure 5 compares the average pixel accuracy and F1 Macro score achieved by the contrastive (SimCLR) and supervised (SPOC) pretraining methods on both MSL and M2020 test sets when finetuned on varying numbers of labels. SimCLR and SPOC perform similarly on the MSL evaluation set, achieving 90% accuracy across the range of label fractions tested. However, SimCLR exhibits a slight accuracy advantage over SPOC below 20% labels as well as a slight F1 score advantage above 50% labels.
SimCLR exhibits a larger performance advantage over SPOC on the M2020 test set. At 20% labels, SimCLR is able to maintain 92.5% of its full accuracy at 100% labels (i.e., 3.5% performance degradation), whereas SPOC experiences a 5.4% performance decrease.
4.3 Ablation Studies
4.3.1 Addressing Class Imbalance with Weighted Loss Functions
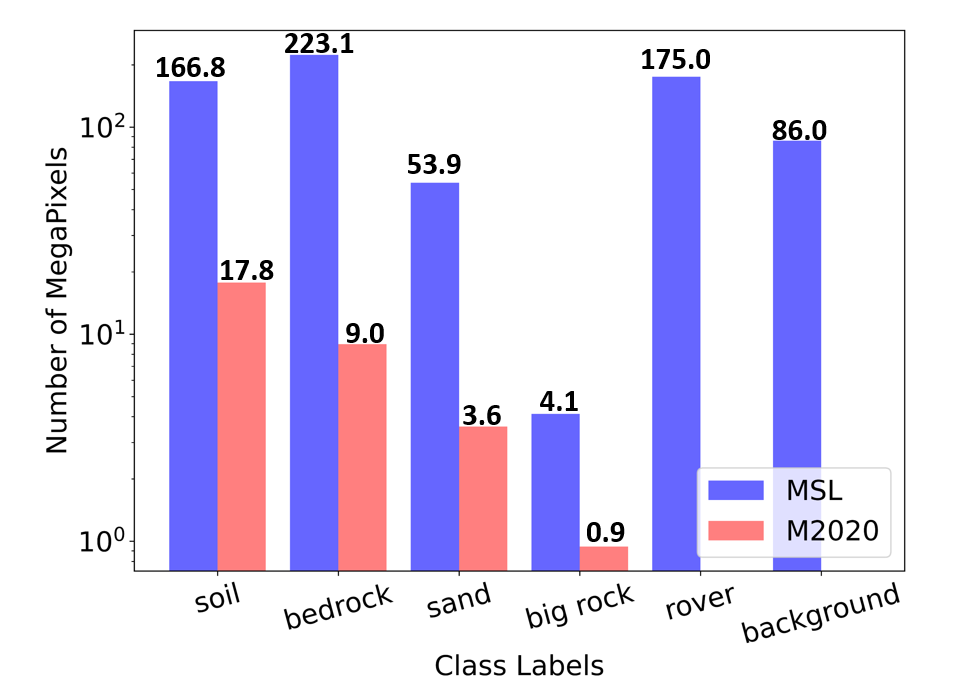
Class imbalance is an important problem in computer vision tasks such as semantic segmentation because the minority classes are often relevant, e.g., identifying big rocks when navigating rovers. Given that the Martian landscape is relatively monotonous and not as label diverse as other standard computer vision datasets [7, 14], we expect to encounter class imbalance in most planetary datasets.
Figure 6 highlights the class imbalance on the MSL and M2020 datasets. Both datasets exhibit different class distributions — bedrock is the most frequent terrain element encountered by MSL, whereas soil is the most frequent class encountered by M2020 — but have the same minority classes of sand and big rock. This section presents investigations into different loss functions aimed at improving performance on minority classes such as big rock and sand.
Cross-entropy Loss
Most of the existing work in semantic segmentation utilize the cross-entropy loss function. This loss function is widely used in classification tasks not only because it encourages the model to output class probability distributions that match the ground truth, but also because of its mathematical properties that enable efficient backpropagation during the training of neural networks. Following the derivation in [22], the cross-entropy loss can be written in the form given in Eq. 1,
| (1) |
where is the class among a set of classes, is the number of examples that belong to class , and represents the model’s geometric mean confidence across all examples belonging to class . Equation 1 highlights that a “vanilla” cross-entropy loss implementation biases towards classes with larger for imbalanced datasets, and could reduce model performance as it does not consider the probability mass distribution across all classes [9]. Thus, we experimented with several loss functions to improve overall model performance as well as performance on individual classes.
| (2) | ||||
| (3) |
Inverse Frequency Loss
A common method of handling class imbalance is to weight the loss function so as to prioritize specific classes. The most common weighting method is to use inverse frequency, which assigns more importance to minority/rare classes (i.e., classes with few examples) [22]. The frequency of a class is found by dividing the number of pixels in a class c, , by the total number of pixels, N. Inverse frequency weighting can over-weight the minority classes, so to reduce this effect and the addition of false positives, we normalize the weights.
Recall Loss
The recall metric measures a model’s predictive accuracy — it is given by , which is the number of true positives (i.e., pixels that the model correctly predicted as belonging to the positive class) divided by the sum of true positives and false negatives (i.e., the total number of pixels that actually belong to the positive class). Recall loss [22] is a novel method that weights a class based on the training recall metric performance as seen in Eq. 4 and even extends the concept of inverse frequency weighting. The true positive and false negative predictions are used with respect to class and the time dependent optimization step, , to optimize the geometric mean overall classes at , .
| (4) |
Recall loss is weighted by the class-wise false negative rate. We expect the model to produce more false negatives (i.e., exhibit low recall) on rare classes that are more challenging to classify, whereas more prevalent classes will produce fewer false negatives. This allows the recall loss to dynamically favor classes with lower per-class recall performance during training. Recall loss has been shown to improve accuracy while maintaining a competitive mean Intersection-over-Union (IoU).
| Loss Function | Accuracy | F1 Macro | mIoU | Big Rock Recall | ||
|---|---|---|---|---|---|---|
| Cross Entropy | 0.795 | 0.610 | 0.480 | 0.120 | ||
| Inverse Frequency | 0.757 | 0.582 | 0.449 | 0.350 | ||
| Recall CE | 0.781 | 0.607 | 0.474 | 0.164 | ||
|
0.772 | 0.591 | 0.458 | 0.480 |
When evaluating model performance on an imbalanced dataset, overall pixel accuracy does not provide adequate insight into the model’s performance on individual classes. As such, we use the F1 score, which is the harmonic mean of precision and recall. The F1 score takes into account both the false positives and false negatives, whereas recall only accounts for the false positives along with the true positives. Furthermore, we show the mean intersection over union (mIoU), which is the percent of overlap in the prediction and ground truth.
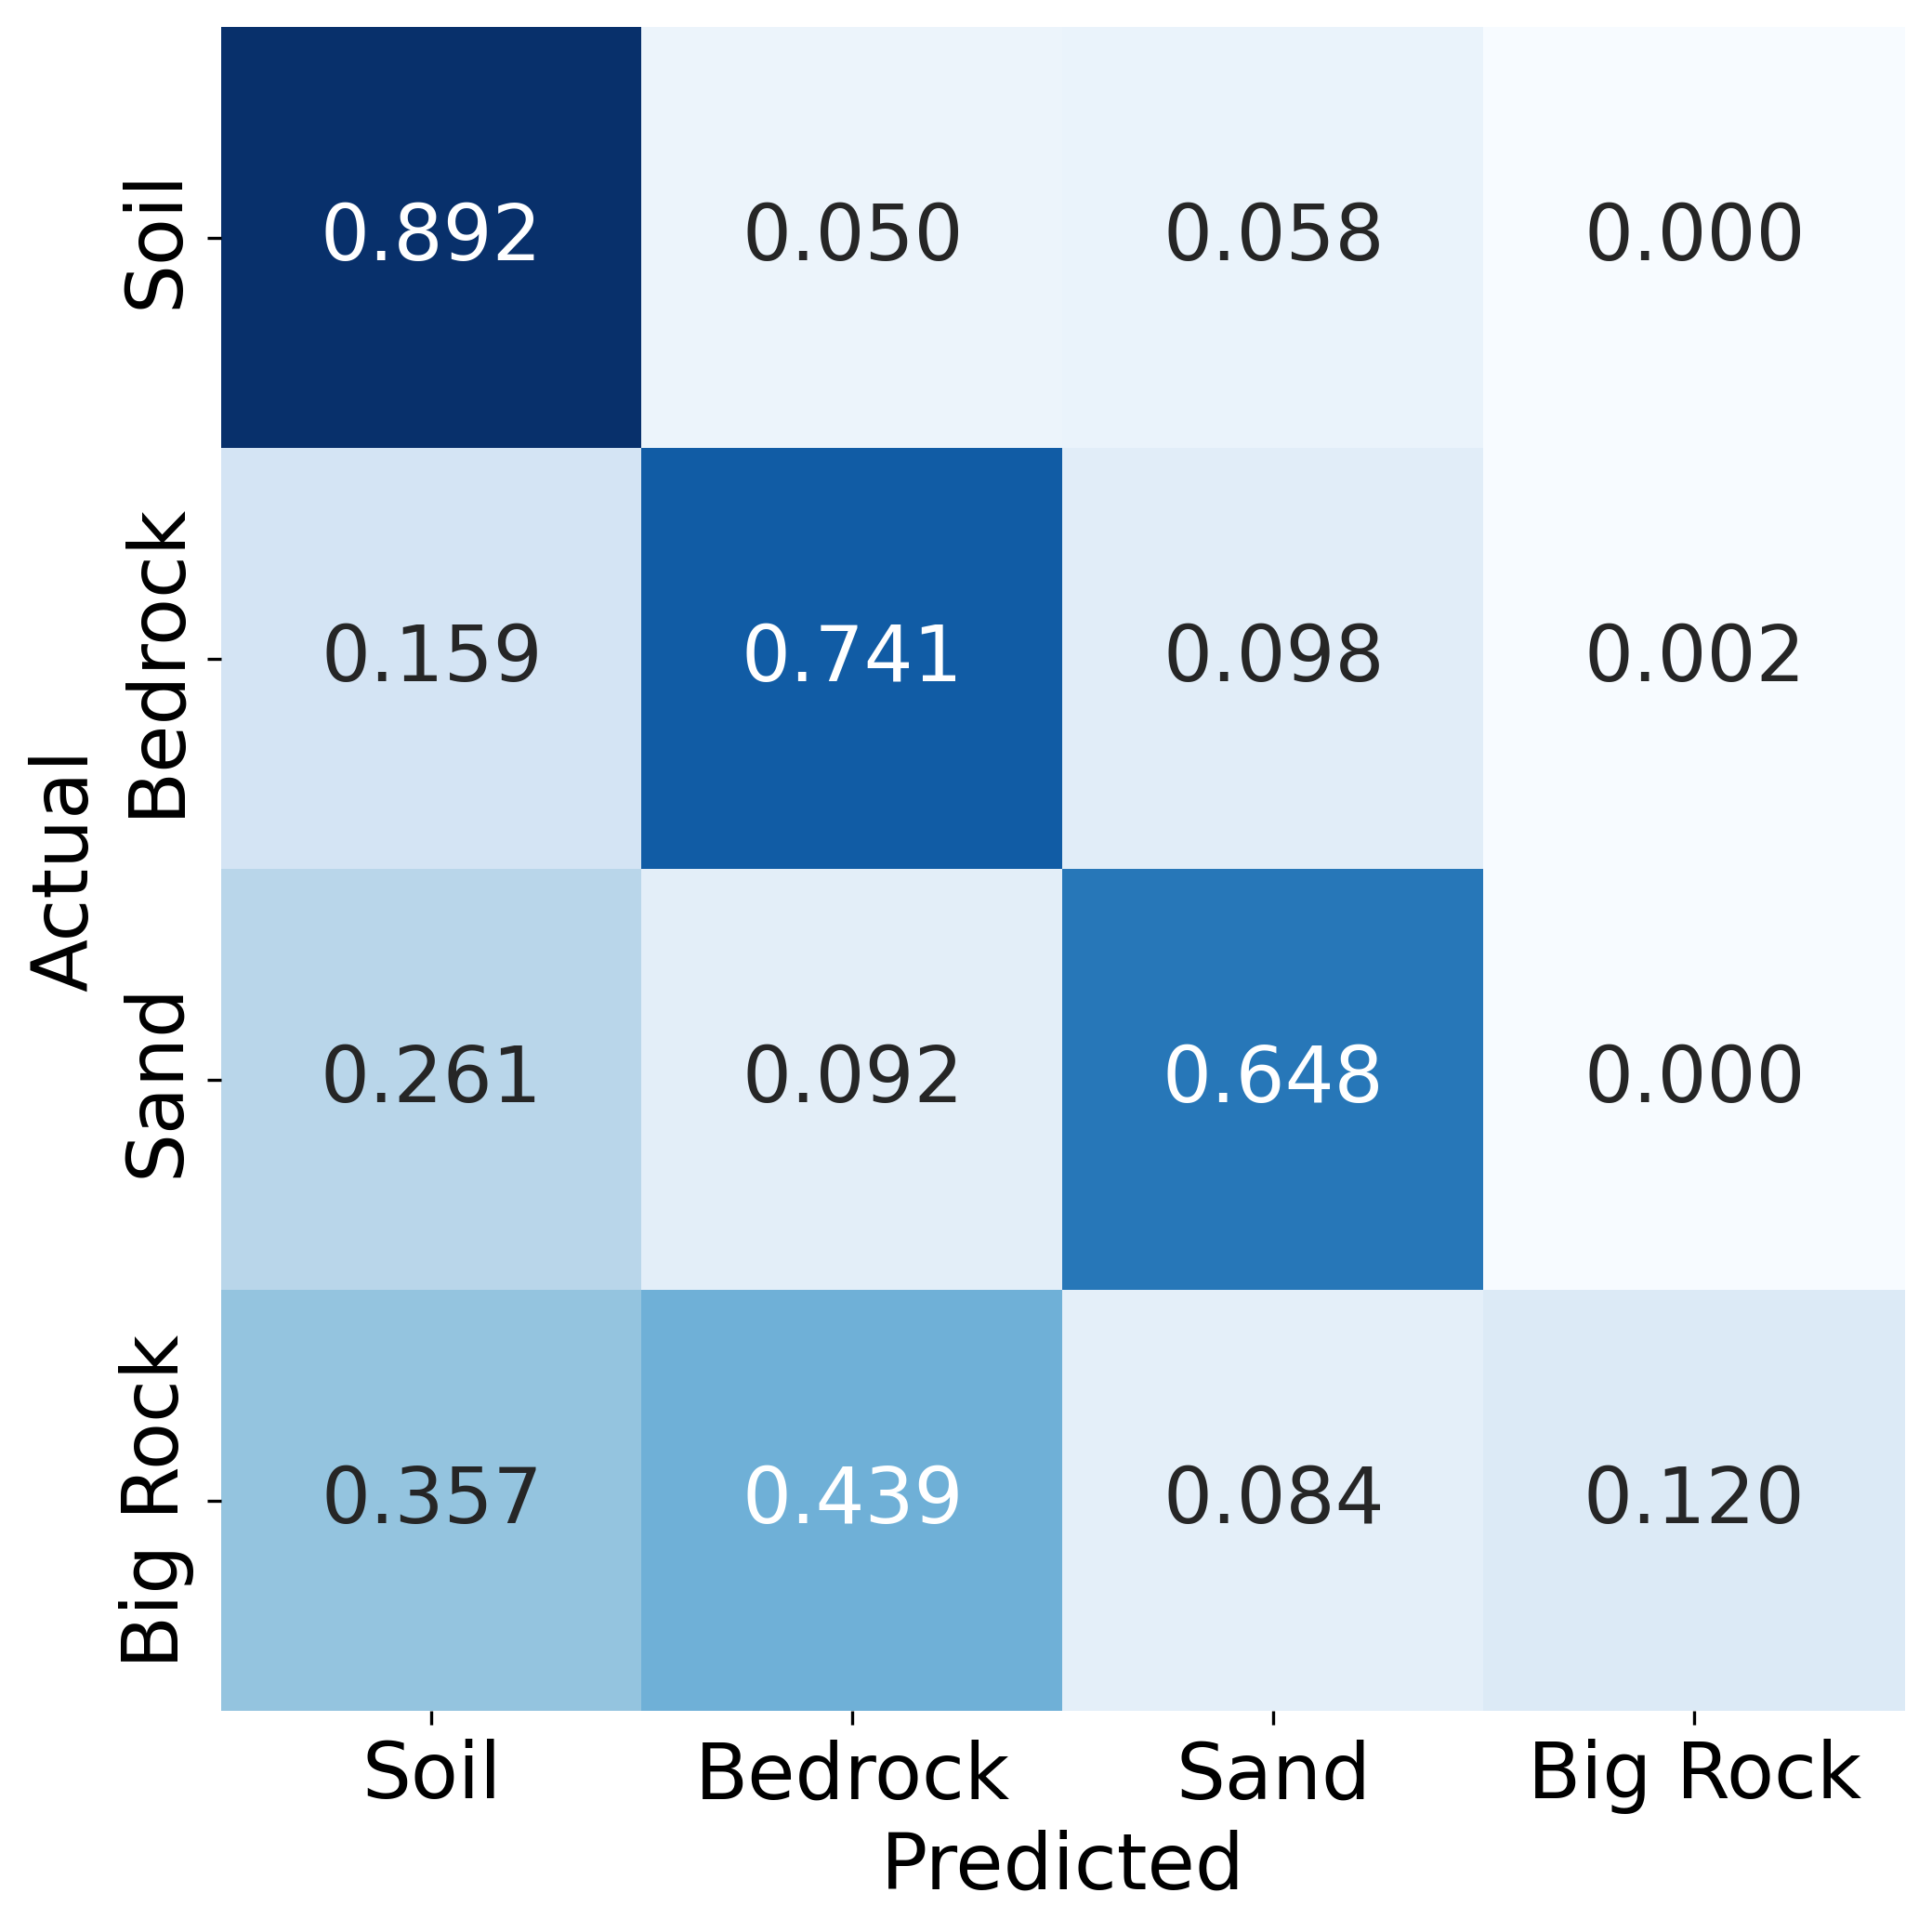
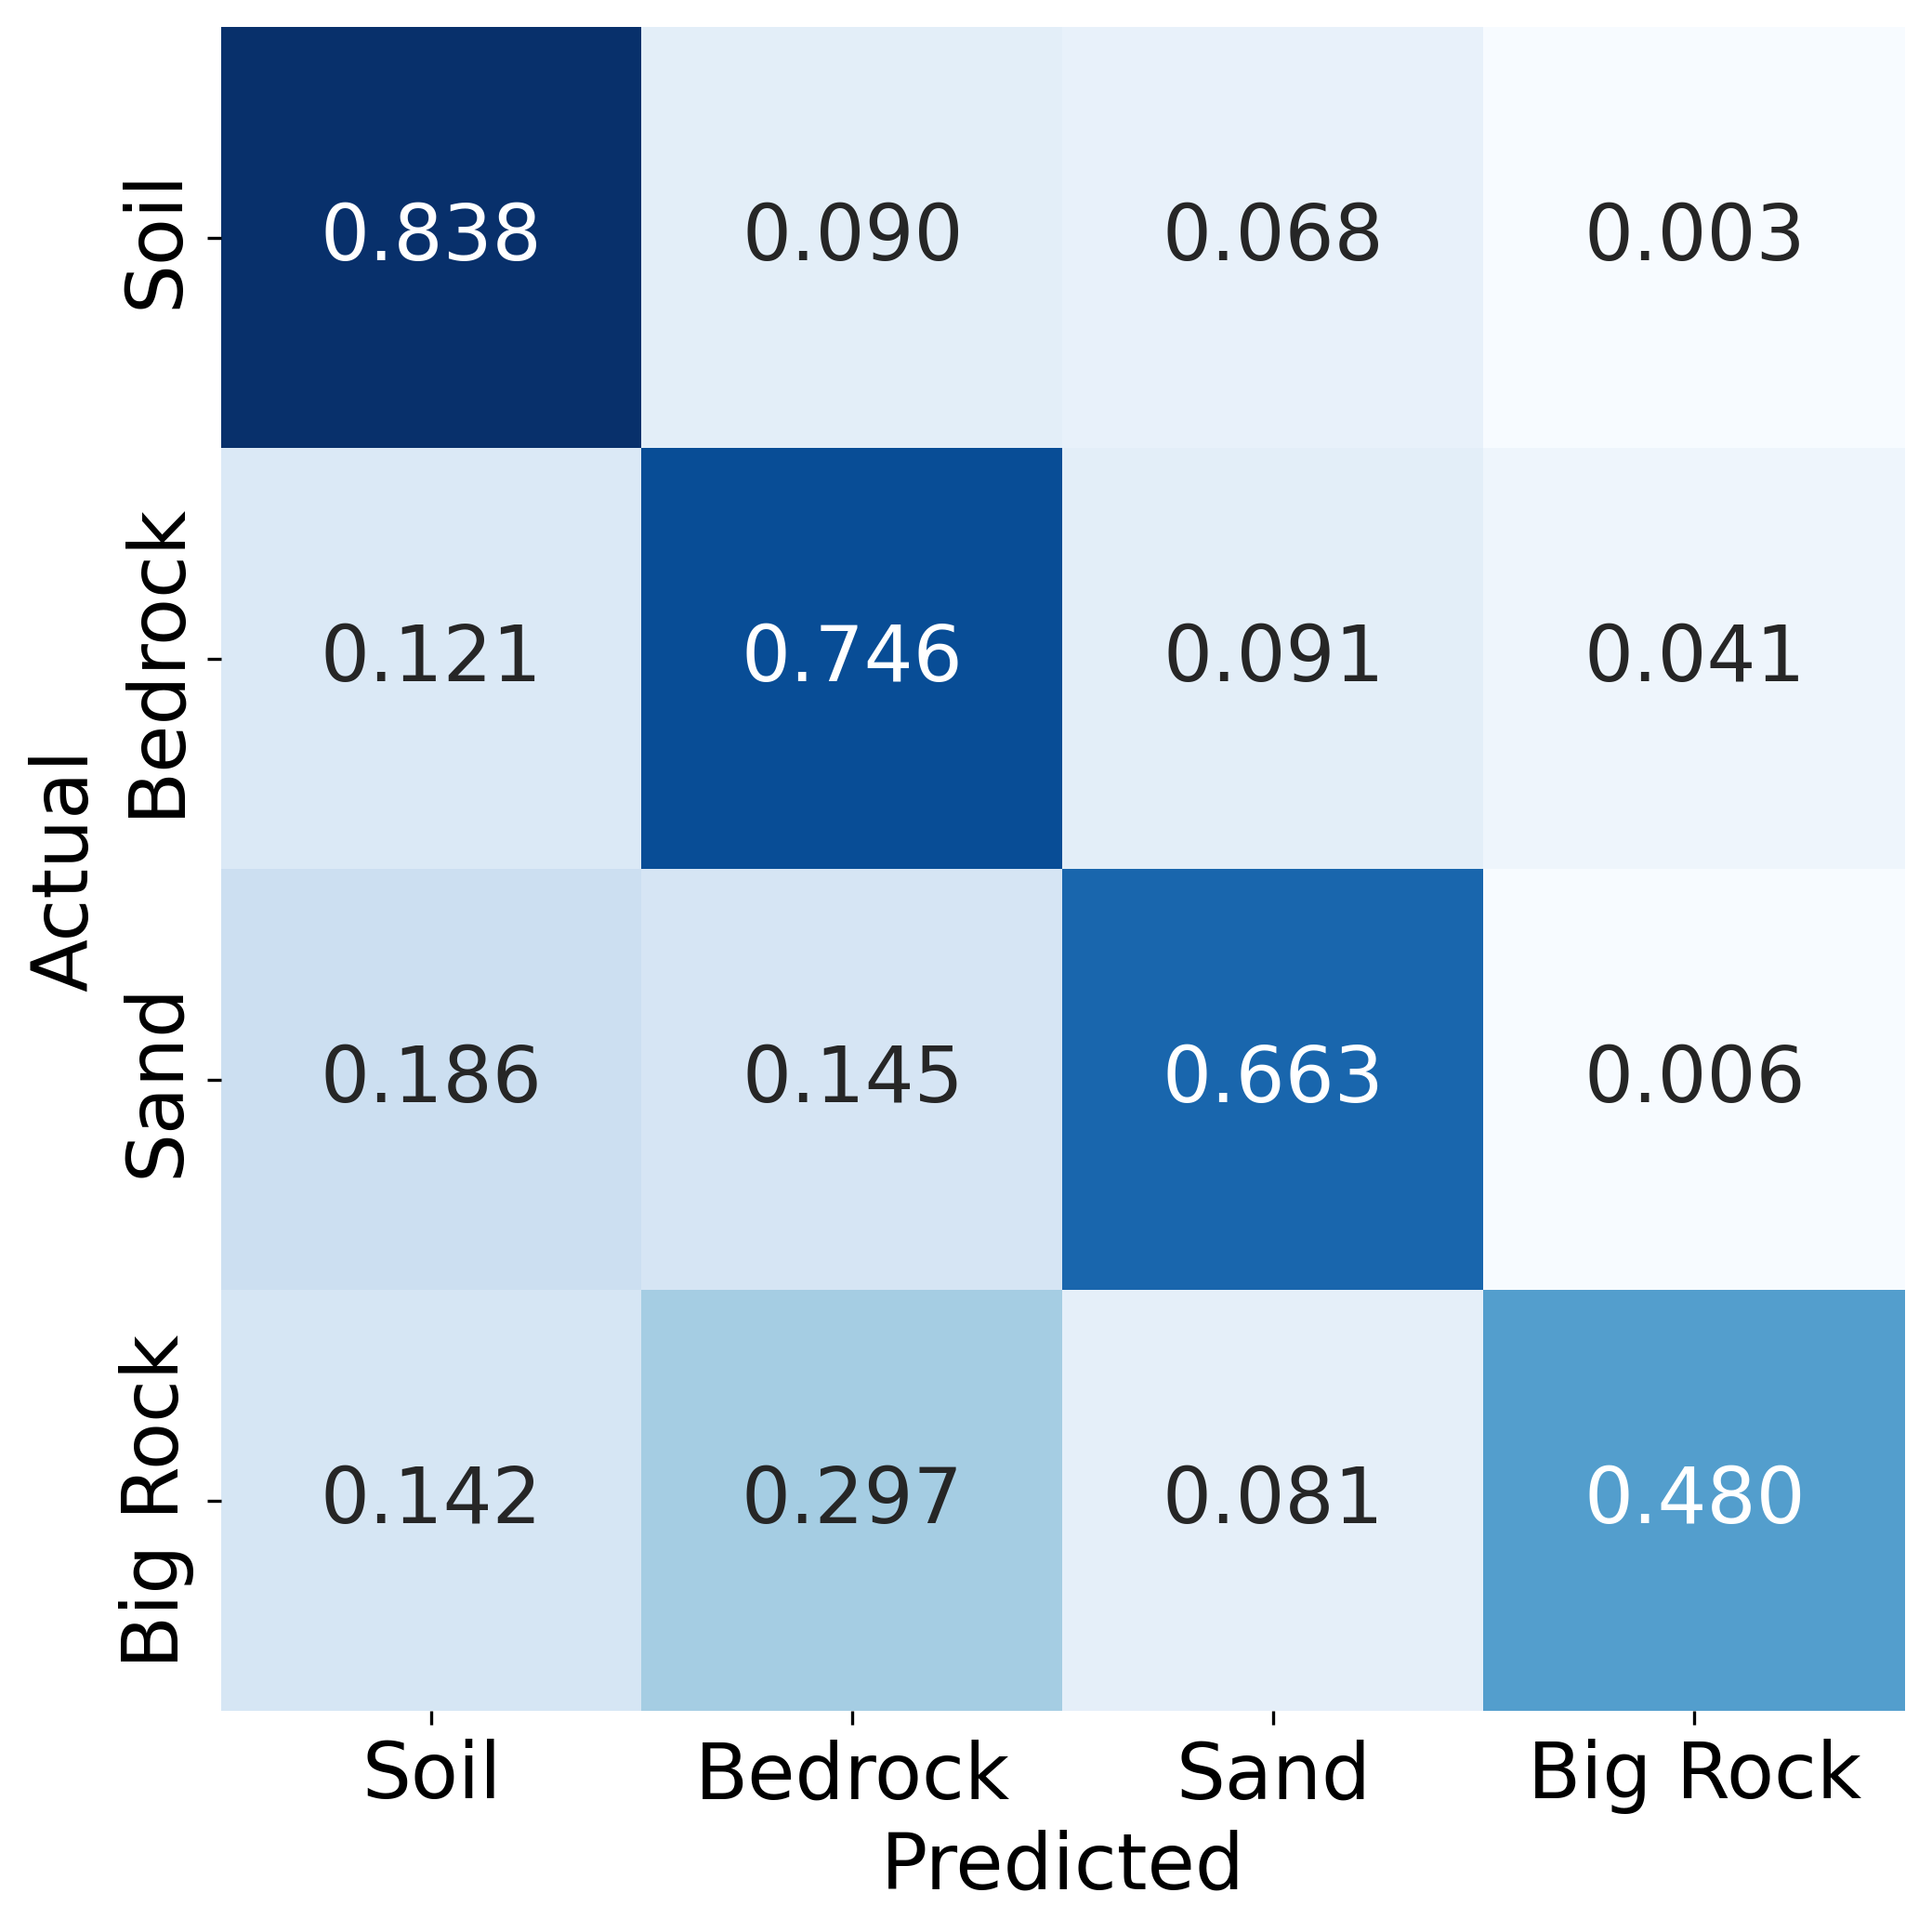
Table 2 compares the performance utilizing different loss functions when finetuning a contrastive-pretrained ResNet-101 model on the 17,385-image mixed-domain training set.Results show that weighting the loss function improves the minority class positive predictions, pixel accuracy, and the F1 Macro score. In particular, Recall Cross Entropy (CE) alone improves Big Rock recall but decreases mIoU value when compared to the baseline CE loss. The combined Recall CE and Inverse Frequency loss have the highest recall on the Big Rock class with a value of 0.48. The confusion matrices in Fig. 7 better visualize the “rebalancing” of classes when using the combined loss functions over the CE loss. Figure 7(b) shows that the combined weighted loss function was able to improve correct predictions of big rock over the cross-entropy loss. Additionally, Cross-entropy loss model tends to over predict soil since it is the most frequent class (Fig. 7(a)), but Inv. Freq and Recall is able to address all classes more uniformly at a small expense of lower Soil recall.
4.3.2 Bigger Models Increase Performance
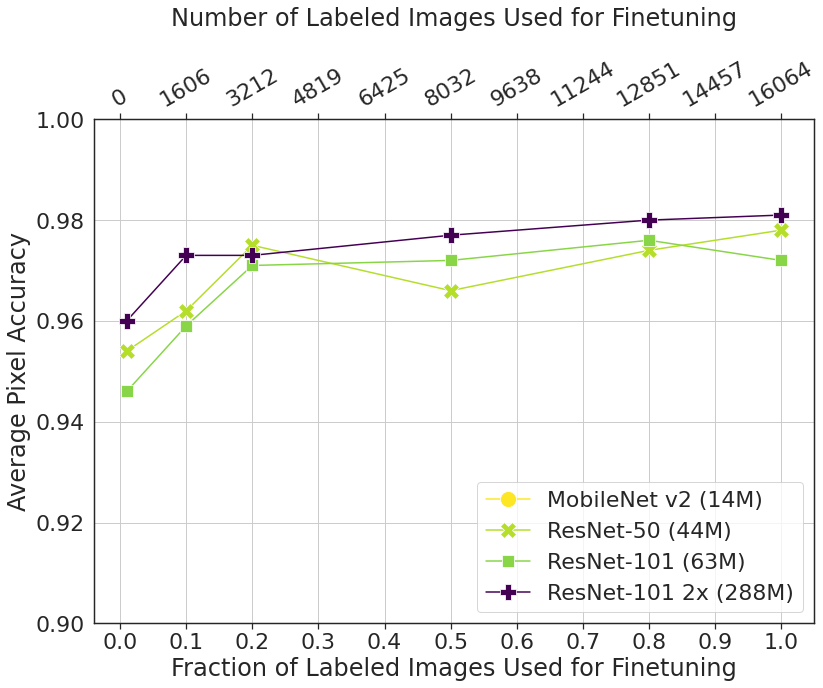
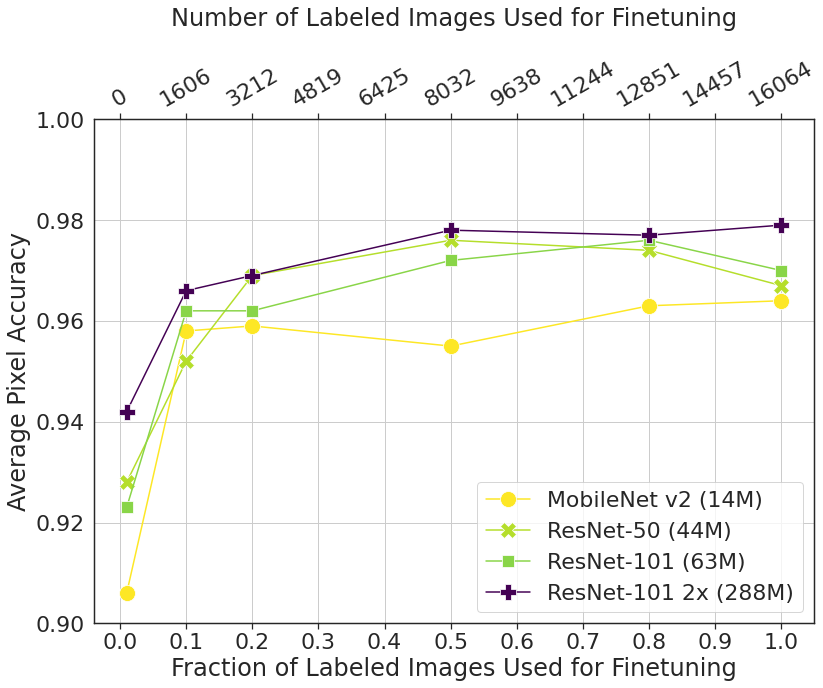
To evaluate the importance of model size, specifically the number of parameters, we simplified our experiments. Four different models, MobileNet v2, ResNet-50, ResNet-101, and ResNet-101 with 2x width, were used to perform finetuning with a training set of the MSL dataset (16,064 images). Figure 8 shows that across a varied number of labeled images used in finetuning, that larger models with an increased number of parameters have the highest pixel accuracy. In comparison to the MobileNet v2 (14 M parameters), the ResNet-101 2x (288 M parameters) improves accuracy at 1% of the available labeled images by 5% and when using 100% of the available labeled images there is 2% increase. Additionally, it is shown that when using these larger model sizes (e.g. ResNet-101 and ResNet-101 2x) with fewer annotated images improves accuracy over smaller models (e.g. MobileNet v2, ResNet-50), but the increase in accuracy with the increase of available labels starts to diminish. These diminishing returns in pixel accuracy question the trade-off in compute expense and accuracy specifically on a constrained edge-device like a planetary rover.
5 Conclusion
This research proposes a state-of-the-art semi-supervised mixed-domain training approach for multi-mission Mars terrain segmentation by combining annotated MSL images from the novel AI4Mars dataset with newly-annotated M2020 images to finetune a contrastive pretrained model, thereby improving performance across both MSL and M2020 test sets.
The idea of combined datasets is not novel, yet decoupling the effects of change in domain training and change in number of samples revealed their relative importance within the context of multi-mission deployment. It was found that while the number of images plays a significant role in enabling the performance gain from a combined dataset, the additional variance in a mixed-domain dataset prevents the model from overfitting to unhelpful examples. We then show that a self-supervised contrastive pretraining method outperforms the published baseline [20] by 5%, using only 20% of the available labels on the combined dataset. Finally, adding different class weighting methods aided in addressing the class imbalance issue that is inherently present within the planetary datasets. By improving performance on the minority classes (i.e. big rock and sand), we can improve a rover’s ability to detect and avoid these potentially hazardous areas.
Areas of future work include expanding this approach to handle multi-task learning (e.g. scientific vs engineering class sets). The model would become valuable as a mission- and task-agnostic method for semantic segmentation in planetary explorations. Additionally, evaluating the performance of the larger model sizes for a multi-mission effort will aid in the development of a distillation pipeline for the deployment of a smaller, computationally less expensive model on a planetary rover.
6 Acknowledgments
This research was carried out at the Jet Propulsion Laboratory, California Institute of Technology, under a contract with the National Aeronautics and Space Administration (80NM0018D0004), and was funded by the Data Science Working Group (DSWG). The authors also acknowledge the Extreme Science and Engineering Discovery Environment (XSEDE) Bridges at Pittsburgh Supercomputing Center for providing GPU resources through allocation TG-CIS220027. The authors would like to thank Hiro Ono and Michael Swan for facilitating access to AI4Mars. U.S. Government sponsorship acknowledged.
References
- [1] Atha, D., Swan, R.M., Didier, A., Hasnain, Z., Ono, M.: Multi-mission terrain classifier for safe rover navigation and automated science. In: IEEE Aerospace Conf (2022)
- [2] Chen, L.C., Papandreou, G., Kokkinos, I., Murphy, K., Yuille, A.L.: Deeplab: Semantic image segmentation with deep convolutional nets, atrous convolution, and fully connected crfs. IEEE transactions on pattern analysis and machine intelligence 40(4), 834–848 (2017)
- [3] Chen, T., Kornblith, S., Norouzi, M., Hinton, G.: A simple framework for contrastive learning of visual representations. In: International conference on machine learning. pp. 1597–1607. PMLR (2020)
- [4] Chen, T., Kornblith, S., Swersky, K., Norouzi, M., Hinton, G.E.: Big self-supervised models are strong semi-supervised learners. Advances in neural information processing systems 33, 22243–22255 (2020)
- [5] Crisp, J.A., Adler, M., Matijevic, J.R., Squyres, S.W., Arvidson, R.E., Kass, D.M.: Mars exploration rover mission. Journal of Geophysical Research: Planets 108(E12) (2003)
- [6] Cunningham, C., Ono, M., Nesnas, I., Yen, J., Whittaker, W.L.: Locally-adaptive slip prediction for planetary rovers using gaussian processes. In: 2017 IEEE International Conference on Robotics and Automation (ICRA). pp. 5487–5494. IEEE (2017)
- [7] Deng, J., Dong, W., Socher, R., Li, L.J., Li, K., Fei-Fei, L.: ImageNet: A Large-Scale Hierarchical Image Database. In: CVPR09 (2009)
- [8] Goh, E., Chen, J., Wilson, B.: Mars terrain segmentation with less labels. arXiv preprint arXiv:2202.00791 (2022)
- [9] Grandini, M., Bagli, E., Visani, G.: Metrics for multi-class classification: an overview. arXiv preprint arXiv:2008.05756 (2020)
- [10] Grotzinger, J.P., Crisp, J., Vasavada, A.R., Anderson, R.C., Baker, C.J., Barry, R., Blake, D.F., Conrad, P., Edgett, K.S., Ferdowski, B., et al.: Mars science laboratory mission and science investigation. Space science reviews 170(1), 5–56 (2012)
- [11] He, K., Zhang, X., Ren, S., Sun, J.: Deep residual learning for image recognition. In: Proceedings of the IEEE conference on computer vision and pattern recognition. pp. 770–778 (2016)
- [12] Higa, S., Iwashita, Y., Otsu, K., Ono, M., Lamarre, O., Didier, A., Hoffmann, M.: Vision-based estimation of driving energy for planetary rovers using deep learning and terramechanics. IEEE Robotics and Automation Letters 4(4), 3876–3883 (2019)
- [13] Li, C., Yang, J., Zhang, P., Gao, M., Xiao, B., Dai, X., Yuan, L., Gao, J.: Efficient self-supervised vision transformers for representation learning. arXiv preprint arXiv:2106.09785 (2021)
- [14] Lin, T.Y., Maire, M., Belongie, S., Hays, J., Perona, P., Ramanan, D., Dollár, P., Zitnick, C.L.: Microsoft coco: Common objects in context. In: European conference on computer vision. pp. 740–755. Springer (2014)
- [15] Lu, S., Zhao, B., Wagstaff, K., Cole, S., Grimes, K.: Content-based classification of mars exploration rover pancam images. In: 52nd Lunar and Planetary Science Conference. p. 1779. No. 2548 in Lunar and Planetary Science Conference (2021)
- [16] McEwen, A.S., Eliason, E.M., Bergstrom, J.W., Bridges, N.T., Hansen, C.J., Delamere, W.A., Grant, J.A., Gulick, V.C., Herkenhoff, K.E., Keszthelyi, L., et al.: Mars reconnaissance orbiter’s high resolution imaging science experiment (hirise). Journal of Geophysical Research: Planets 112(E5) (2007)
- [17] Ono, M., Rothrock, B., Almeida, E., Ansar, A., Otero, R., Huertas, A., Heverly, M.: Data-driven surface traversability analysis for mars 2020 landing site selection. In: 2016 IEEE Aerospace Conference. pp. 1–12. IEEE (2016)
- [18] Panambur, T., Chakraborty, D., Meyer, M., Milliken, R., Learned-Miller, E., Parente, M.: Self-supervised learning to guide scientifically relevant categorization of martian terrain images. In: Proceedings of the IEEE/CVF Conference on Computer Vision and Pattern Recognition. pp. 1322–1332 (2022)
- [19] Qiu, D., Rothrock, B., Islam, T., Didier, A.K., Sun, V.Z., Mattmann, C.A., Ono, M.: Scoti: Science captioning of terrain images for data prioritization and local image search. Planetary and Space Science 188, 104943 (2020)
- [20] Rothrock, B., Kennedy, R., Cunningham, C., Papon, J., Heverly, M., Ono, M.: Spoc: Deep learning-based terrain classification for mars rover missions. AIAA SPACE 2016 p. 5539 (2016)
- [21] Swan, R.M., Atha, D., Leopold, H.A., Gildner, M., Oij, S., Chiu, C., Ono, M.: Ai4mars: A dataset for terrain-aware autonomous driving on mars. In: Proceedings of the IEEE/CVF Conference on Computer Vision and Pattern Recognition. pp. 1982–1991 (2021)
- [22] Tian, J., Mithun, N., Seymour, Z., Chiu, H.P., Kira, Z.: Striking the right balance: Recall loss for semantic segmentation. arXiv preprint arXiv:2106.14917 (2021)
- [23] Wagstaff, K., Lu, S., Dunkel, E., Grimes, K., Zhao, B., Cai, J., Cole, S.B., Doran, G., Francis, R., Lee, J., et al.: Mars image content classification: Three years of nasa deployment and recent advances. arXiv preprint arXiv:2102.05011 (2021)
- [24] Wagstaff, K., Lu, Y., Stanboli, A., Grimes, K., Gowda, T., Padams, J.: Deep mars: Cnn classification of mars imagery for the pds imaging atlas. In: Proceedings of the AAAI Conference on Artificial Intelligence. vol. 32 (2018)
- [25] Williford, K.H., Farley, K.A., Stack, K.M., Allwood, A.C., Beaty, D., Beegle, L.W., Bhartia, R., Brown, A.J., de la Torre Juarez, M., Hamran, S.E., et al.: The nasa mars 2020 rover mission and the search for extraterrestrial life. In: From habitability to life on Mars, pp. 275–308. Elsevier (2018)