Connection between Emission and Absorption Outflows through the Study of Quasars with Extremely-High Velocity Outflows
Abstract
A recently-discovered class of outflows, extremely high-velocity outflows (EHVOs), may be key to understanding feedback processes as it is likely the most powerful in terms of mass-energy. These EHVOs have been observed at redshifts 1.052 7.641, but the potential connection with outflows in emission had not been studied. We find that EHVOs, albeit their small numbers at the moment, appear to show distinct C iv and Heii properties. In particular, EHVOs are more predominant in quasars with large blueshifts of the C iv emission line, suggesting a connection between emission and absorption outflowing signatures for these extreme outflows. We also find incipient trends with the maximum velocity of the outflows, which is similar to what has been previously found in BALQSOs, but now extending previous studies to speeds up to 0.2. We find the bolometric luminosities, Eddington ratios, and black hole masses of our sample are overall very similar from the general quasar population upon considering their C iv emission properties. This is close to the case for Heii EW as we observe a tentative upper limit to the Heii strength for a quasar to host an EHVO. This study shows that extreme outflows such as EHVOs appear in quasars that are clearly a distinct class from the overall BALQSO population, and solidify the relation between outflows observed in emission and in absorption.
1 Introduction
Quasars, the most luminous of the active galactic nuclei (AGNs), are found at the center of the most massive galaxies (e.g., Lynden-Bell 1969; Bahcall et al. 1997). Quasars’ large luminosities allow us to study them at large redshifts, providing information about galactic evolution within our universe.
Outflows are fundamental constituents of AGNs and they provide first-hand information about the physical and chemical properties of the AGN environment. They are studied in emission through the analysis of blueshift of emission lines (e.g., Komossa et al. 2015; Marziani et al. 2017) and through absorption-line signatures (e.g., broad, blue-shifted resonance lines in the UV and X-ray bands) as the gas intercepts some of the light from the central continuum source and broad emission-line region (e.g. Crenshaw et al. 1999; Reichard et al. 2003; Hamann & Sabra 2004; Trump et al. 2006; Dunn et al. 2008; Ganguly & Brotherton 2008; Nestor et al. 2008 and references therein). Outflows have been invoked as a potentially regulating mechanism that would provide the necessary energy and momentum “feedback” (e.g., Silk & Rees, 1998; Di Matteo et al., 2005; Springel et al., 2005; Hopkins et al., 2006) required to explain the correlation between the black hole masses () and the masses of the stellar spheroids () of their host galaxies (e.g., Gebhardt et al., 2000; Merritt & Ferrarese, 2001; Tremaine et al., 2002).
Outflows at large speeds are likely to be the most effective way of transporting energy from the AGN to galactic scales, therefore having more influence on the formation and destruction of galactic structures (Silk & Rees 1998; Scannapieco & Oh 2004; Hopkins et al. 2006). Outflows with speeds 0.2 may carry 1–2.5 orders-of-magnitude larger kinetic power than gas outflowing at what is defined as “high” velocities (5,000–10,000 km s-1), assuming similar distances from the inner source and similar physical properties of the gas, because kinetic power is proportional to . Such outflows have been detected both in X-ray and UV/optical spectra. In the X-rays, the so-called Ultra Fast Outflows (UFOs) have been observed as Fe K-shell absorption in the X-ray spectra of nearby AGNs (predominantly Seyferts) at speeds similar and even larger than those in EHVOs (0.03–0.4; e.g., Chartas et al. 2002; Reeves et al. 2003; Tombesi et al. 2010). However, UFOs have been rarely detected in high- quasars: there are just over 10 cases with 1.5 to date; a systematic study of UFOs at large redshifts is prohibitive at the moment.
The number of known UV/optical broad (FWHM 1,000 km s-1) EHVOs in quasar spectra has exploded in the last two years from only a handful of cases in previous years (Jannuzi et al. 1996; Hamann et al. 1997; Rodríguez Hidalgo et al. 2011; Rogerson et al. 2016), to more than 150 new cases. We have discovered 138 of these new cases at 1.9 4.5: 40 cases (Rodríguez Hidalgo et al. 2020) in the ninth release of the Sloan Digital Sky Survey (SDSS) quasar catalog (DR9Q; Pâris et al., 2012), and 98 new cases (Rodríguez Hidalgo et al. in prep.) in the DR16Q (Lyke et al. 2020). As it is common practice in surveys of BALQSOs (e.g., Gibson et al. 2009), we used the presence of C iv 1548.1950,1550.7700 absorption that appears blue-shifted relative to the C iv emission to identify the EHVO. Among different ionic transitions, C iv is (1) commonly present in quasar outflows, and (2) easily observed due to the fact that it is redshifted into the optical range for quasars in the epoch of peak quasar activity (for luminous Type 1 quasars, the comoving space density peaked at redshifts 23; Schmidt et al. 1995; Ross et al. 2013 and references therein). Prior surveys of C iv BALQSOs had set an arbitrary upper velocity limit of 0.1 to avoid complications due to misidentification with Si iv and other ionic transitions bluewards of the Si iv emission line, but we have developed a method that flags all absorption in the spectral region of interest, and allows the user to visually inspect the spectrum easily to help identify the right C iv transitions, rejecting or including the flagged candidate as a confirmed EHVO case. Narrow (FWHM 500 km s-1) EHVOs have also been studied in statistical studies (e.g., Nestor et al. 2008; Chen et al. 2021), where properties like line locking or correlations with the presence of other outflows suggest an intrinsic nature.
The connection between emission and absorption outflows at these extreme speeds is completely unknown, but there are previous studies in BALs at lower speeds. Using data in DR7, Richards et al. (2011) found a relationship between C iv emission line properties and whether there was absorption present in quasar spectrum by studying a sample of 30,000 quasar spectra. They found a dearth of BALQSOs, which were defined as having broad absorption at speeds up to 20,000 km s-1, in quasars that show C iv emission lines with small blueshifts and large equivalent widths. Most recently, Rankine et al. (2020) has extended this work to 144,000 quasars in SDSS DR14Q and studied the effects of BAL properties. We found that the Balnicity Index (BI; Weymann et al., 1991) and other BAL trough parameters, including the maximum and minimum trough velocities, all increase as the C iv blueshift increases. Also of note is the finding that BAL and non-BAL quasars occupy the same C iv emission space, apart from the region of highest EW and low blueshifts where there are few BALQSOs. The fraction of quasars that have BALs, however, changes across the space with the highest BAL fraction occurring at the highest blueshifts. Quasars with similar C iv emission profiles were found to have similar optical luminosities, Eddington ratios, and, most notably, Heii 1640 EW which is an indicator of the strength of the ionising SED (Leighly, 2004). Other studies have also found the EW of Heii to anti-correlate with C iv emission blueshift (Baskin et al., 2013, 2015) and Rivera et al. (2022) has shown that Heii EW is linearly anti-correlated with C iv distance, a metric describing the distance along a best-fit curve through the C iv space: values of C iv distance are zero at high-EW and low-blueshift (top left) and they increase towards unity along the best-fit curve as we move towards low-EW and high-blueshift (bottom right). The best-fit curve was constructed by McCaffrey & Richards (2021) with piecewise polynomial fitting to the Rankine et al. (2020) sample. Each quasar can then be projected onto the best-fit line and a C iv distance value is assigned. This metric was first introduced by Rivera et al. (2020) to better explore the variability of the SDSS Reverberation Mapping quasars (Shen et al., 2015) and by Richards et al. (2021) to investigate radio trends in C iv space. Rivera et al. (2022) suggest that C iv distance can be used as a proxy for the Eddington ratio and so the Heii EW (thus the SED hardness) is anti-correlated with the Eddington ratio.
However, both Richards et al. (2011) and Rankine et al. (2020) were limited to absorption outflowing up to speeds of 20,000–25,000 km s-1, as most BALQSO studies are. EHVOs present a test to any trend found in BALQSOs as we can triple the range of speeds we can study up to 60,000 km s-1.
In this paper, we study whether there is a connection between outflows in C iv emission and extreme outflows found in absorption as EHVOs. In section §2 we discuss the origin of the known properties we cross-correlate, and in §3 we study potential connections between C iv outflows in absorption and emission by studying the relation between properties of emission lines and our measured properties of EHVOs, as well as contrasting EHVOs in relation to BALQSOs. We discuss their implications in§4.
2 Data
The data on the DR9Q 40 EHVO quasars was published in Rodríguez Hidalgo et al. (2020) (hereafter, RH+2020), where we selected quasars with 1.9 and signal-to-noise ratio () larger than 10, and removed cases without sufficient wavelength coverage in the region of interest, resulting in a parent sample of 6743 quasars. Spectra were then normalized and we systematically searched for EHVO absorption.
The measurements of C iv emission line blueshifts and EWs, as well as Heii EW, used in this paper were measured as part of the analyses of Rankine et al. (2020) (hereafter, Rankine+2020). We produced spectrum reconstructions covering restframe 1260–3000 Å generated by a mean field independent component analysis of a selection of 144,000 quasars in the DR14Q (Pâris et al., 2018) with 1.5 3.5, 45.3 48.2 erg s-1, and spectra with an average per SDSS spectrum pixel. The reconstructions allow for measurements of the intrinsic C iv emission to be made even in the presence of extensive absorption in BAL quasars and also reduce the uncertainty in these measurements in low-S/N spectra by using the information across the entire spectrum to inform the reconstruction. Use of the reconstructions and the non-parametric nature of this procedure remove the requirement to fit Gaussian profiles to the spectra. We refer the reader to section 6.1 in Rankine+2020 for a detailed description but, in summary, calculation of the C iv emission line parameters followed a non-parametric approach: first, a power-law continuum was substracted from the reconstruction, then the emission-line flux was integrated to determine EW, and the blueshift was calculated from the wavelength which bisects the total cumulative line flux, relative to the systemic velocity of the quasar.
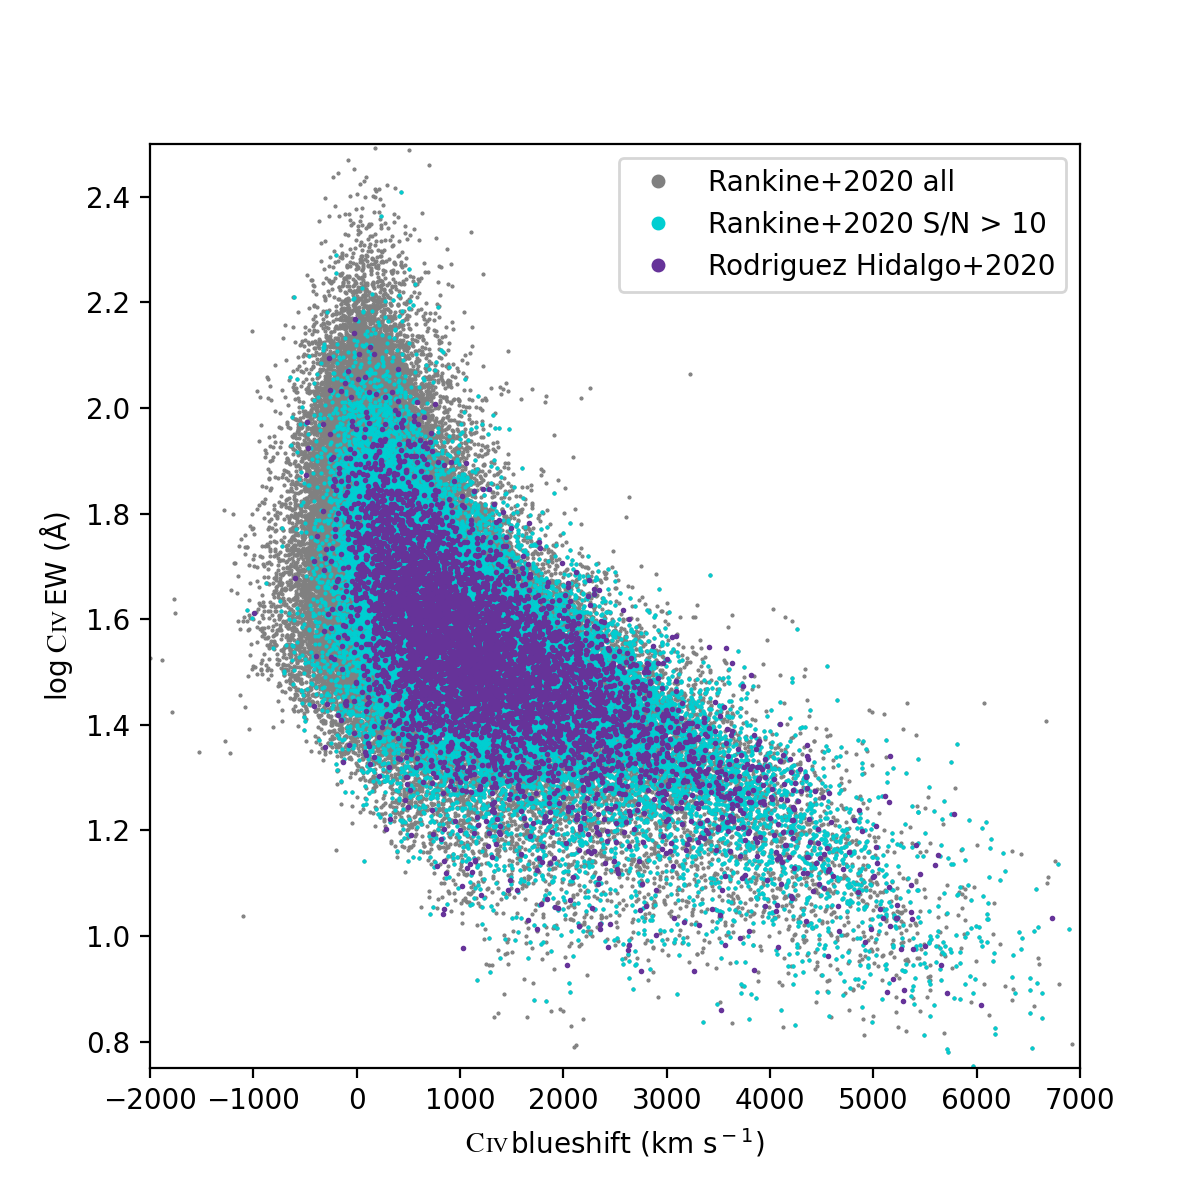
We cross-correlated these two samples using the observation information, namely plate-mjd-fiber, to study where EHVOs lie in the C iv blueshift - EW parameter space. The redshift cutoff in Rankine+2020111Systemic redshifts were calculated using an independent component analysis (ICA) of the 1600–3000 Å restframe wavelength region (Allen et al., 2013) with redshift as a free parameter. Please see Rankine+2020 for an in-depth description, but in summary the 1600–3000 Å region is chosen deliberately to involve low- as opposed to high-ionization lines and thereby exclude the often blueshifted C iv emission line which can bias the redshifts by km s-1 for the highest C iv blueshift sources. Indeed, the ICA-based redshifts are much more consistent with the redshifts of Wu & Shen (2022) for SDSS DR16 than the original SDSS redshifts. We use these ICA redshifts to recalculate EHVO speeds so they are slightly different than in RH+2020; however, we note that our results do not change qualitatively if we use the EHVO speeds from RH+2020. only excludes 3% of our parent sample (215/6743) but 20% (8/40) of our quasars with EHVOs; this was expected as EHVOs seem to be more predominant at higher redshifts (RH+2020; Bischetti et al. 2022; Wang et al. 2018; Wang et al. 2021). We contrasted the parent samples to make sure that differences between them would not affect our study. We observed that the largest difference was due to the cutoffs in signal-to-noise ratio: average in Rankine+2020 versus 10 in RH+2020. Once we apply the same cutoff in the Rankine+2020’s sample both samples mostly overlap (see Fig. 1). Together with the restriction of good spectrum reconstructions with reduced- and excluding the lower-left corner of C iv space which contains mostly intrinsically pathological spectra and FeLoBALs for which the ICA reconstruction scheme is not designed (details in section 4.3 of Rankine+2020), the parent sample in Rankine+2020 is reduced to 41,535 quasars (aqua in Fig. 1), the parent sample in RH+2020 to 5,730 quasars (darker blue in Fig. 1), and the number of EHVO quasars to 31. The resulting luminosity range in Rankine+2020 is similar to that for the parent sample in RH+2020. Measurements of bolometric luminosity (), black hole mass () and Eddington rate () were also taken from Rankine+2020. Only values of , and therefore also , calculated for cases with C iv blueshift 500 km s-1 are included because the correction to take into account the excess, non-virial, blue emission for quasars with large C iv blueshifts (Coatman et al. 2017) is not well defined for cases with negative or modest positive blueshifts. Please see section 6.3 in Rankine+2020 for more information.
We also use the Heii properties from Rankine+2020 to compare the SEDs of the EHVOs to the parent sample in C iv space and with C iv distance by employing the CIVdistance code by McCaffrey & Richards (2021) to project our sample onto the curve and measure the C iv distance.
In our analysis, we also contrast quasars with EHVOs to BALQSOs. The latter were defined slightly differently in both samples. For simplicity, we use the definition in Rankine+2020: Balnicity index in C iv larger than zero. BALQSOs in this sample show C iv absorption with speeds up to 25,000 km s-1.
3 Results
In Figure 2, we show that EHVOs (purple; from RH+2020) appear clearly in quasar spectra with larger values of blueshift and smaller values of equivalent width (EW) of the C iv emission line than the other two populations, namely non-BALQSOs (aqua) and BALQSOs (light blue), both from Rankine+2020.
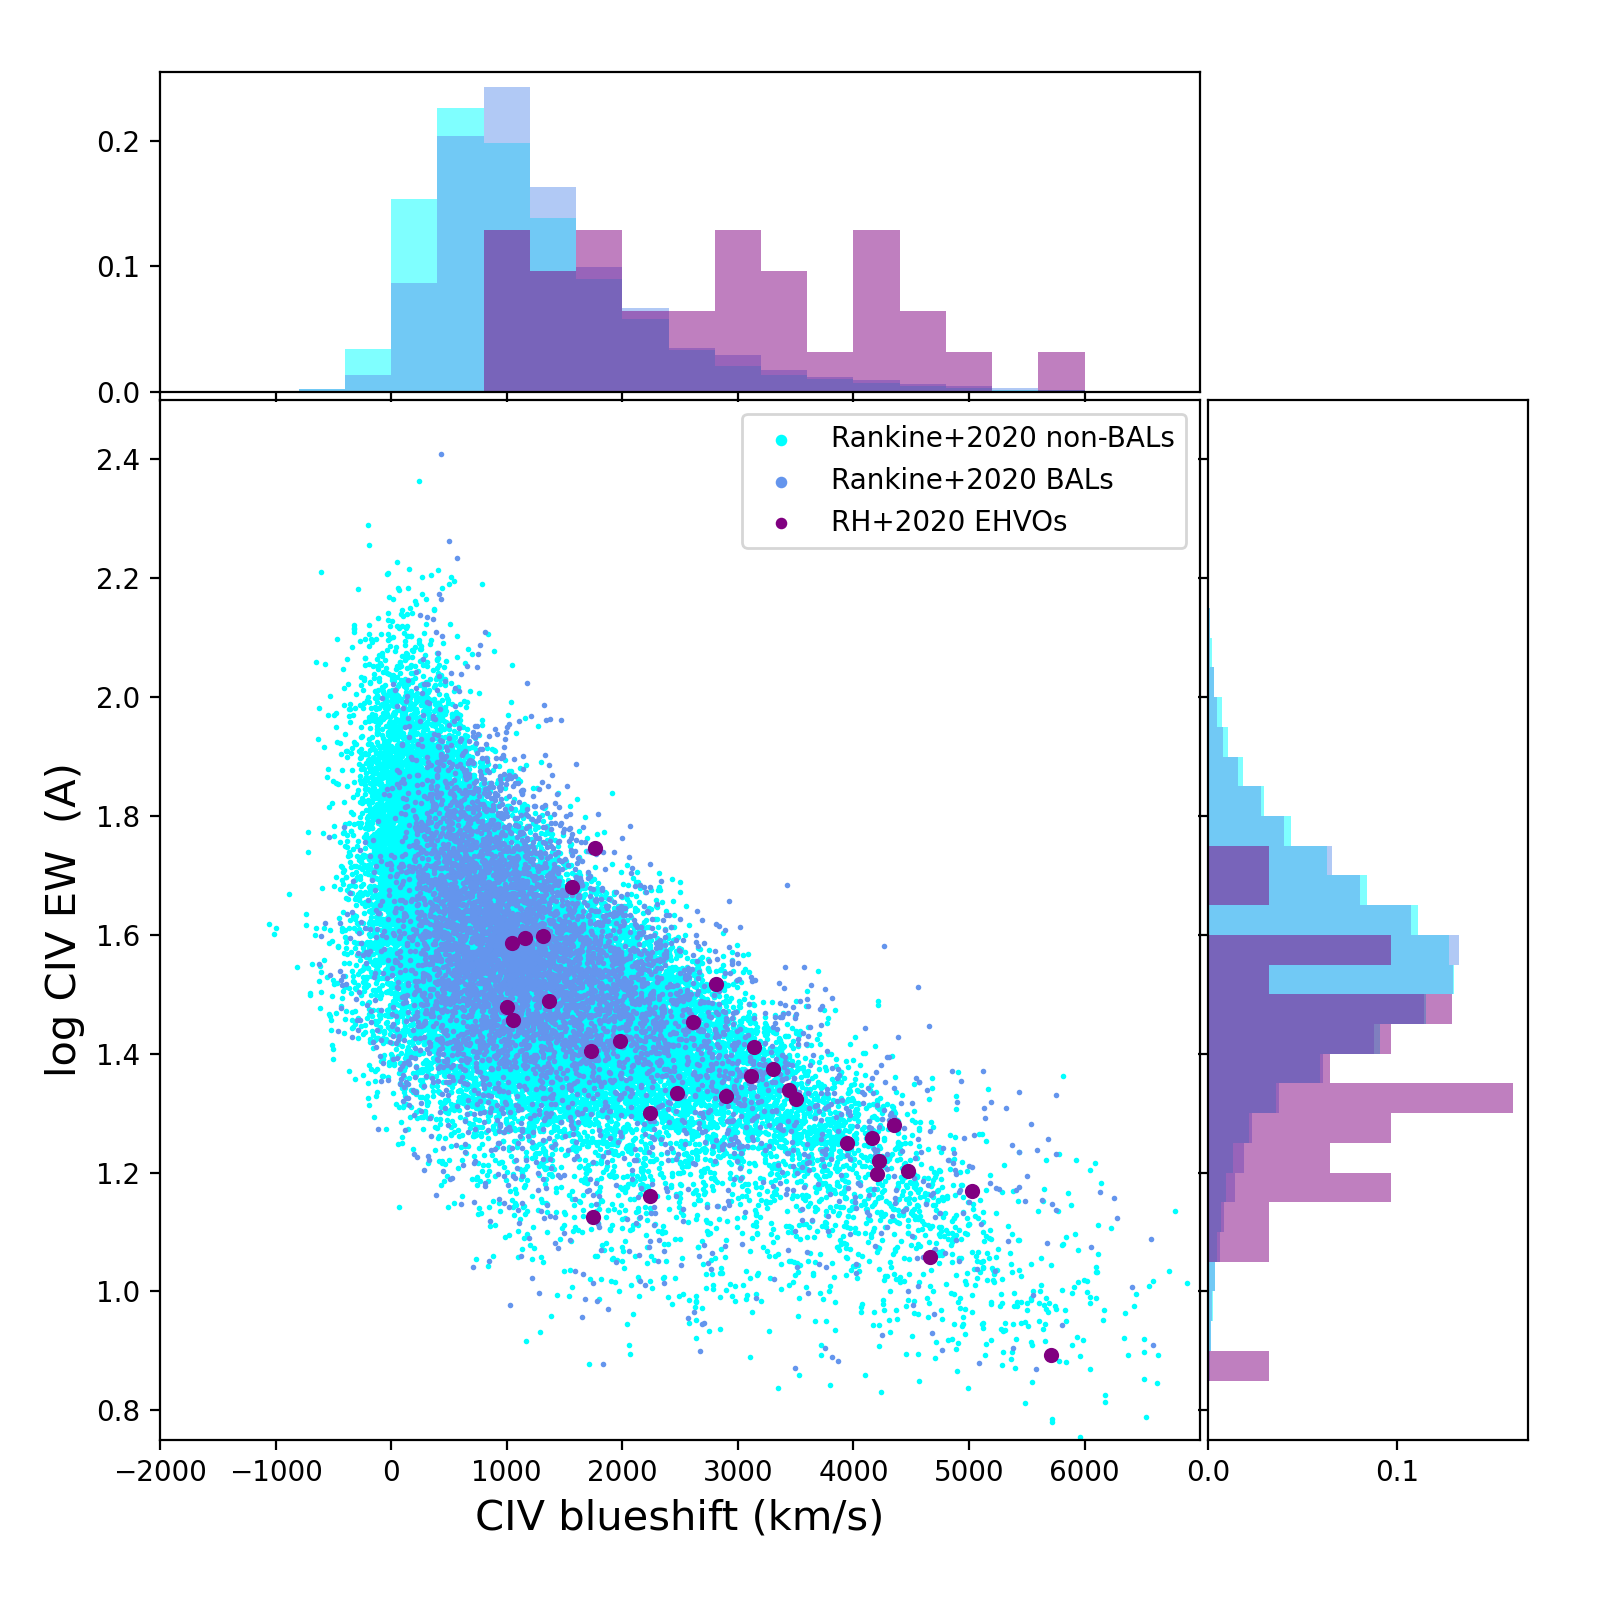
While our number of cases in each sample differ by orders in magnitude (35,694 non-BALs and 5,841 BAL quasars in Rankine+2020, and 31 EHVO quasars in RH+2020), the distributions of C iv emission line properties differ largely. It is implausible that 31 cases selected randomly from either of the other two distributions would result in that same distribution. We performed Kolmogorov–Smirnov (K-S) tests between the distribution of C iv blueshift values in the parent samples, the non-BALQSOs, the BALQSOs versus the EHVO sample, obtaining -values smaller than 1e-08 for all the tests, with KS statistic values larger than 0.5, therefore rejecting the hypothesis that the values for EHVO come from any of the other distributions. We also tried selecting 10,000 times a random sample of 31 quasars from each of the comparison distributions, and counted how many times the median of this selection would be equal or larger than the median of the EHVO C iv blueshift values; we obtained 0 for all cases.
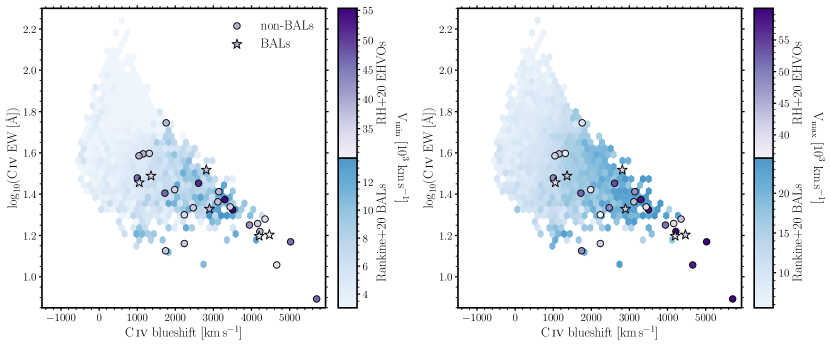
In Figure 3 we examine the relationship between minimum and maximum velocities in C iv emission space against a backdrop of the BI-defined BALQSOs trough parameters from Rankine+2020. Rankine+2020 found the minimum and maximum BAL velocities to correlate with C iv blueshift (see also Rankine+2020’s Figure 16). Particularly noticeable from both panels is that the EHVOs, which by definition have large and , occupy the same region of C iv space where the BALQSOs also have large and , both EHVOs and BALQSOs showing C iv blueshifts 1,000 km s-1. Looking now at the specific EHVO velocities, the minimum EHVO velocity does not appear to show any trend with C iv blueshift. Note that the BALQSOs with EHVOs have absorption present at lower velocities that is not included in the calculation of and subsequent colour-coding of the stars in the left panel of the Figure. The seven BAL quasars in the EHVO sample have BAL minimum velocities greater than 11,000 km s-1 which is consistent with their location in C iv space. Due to the small sample size, there is only a tentative trend of increasing maximum EHVO velocity with increasing C iv blueshift. If confirmed, this trend would be in agreement with the BALQSOs, only at much greater velocities as a result of the BAL and EHVO definitions. Extending this work to the DR16 sample will hopefully provide such a clarification.
Figure 4 shows the studied C iv emission space for the parent and EHVO samples as a function of values of (left), (center), and (right). Except for some outliers, it does not seem that the overall values of these three physical properties are significantly distinct for EHVOs relative to the parent sample in the C iv emission space; in other words, while EHVOs show larger values overall of and (see Discussion), they do not have different values of , , and than the values expected for a quasar with those C iv emission line properties.
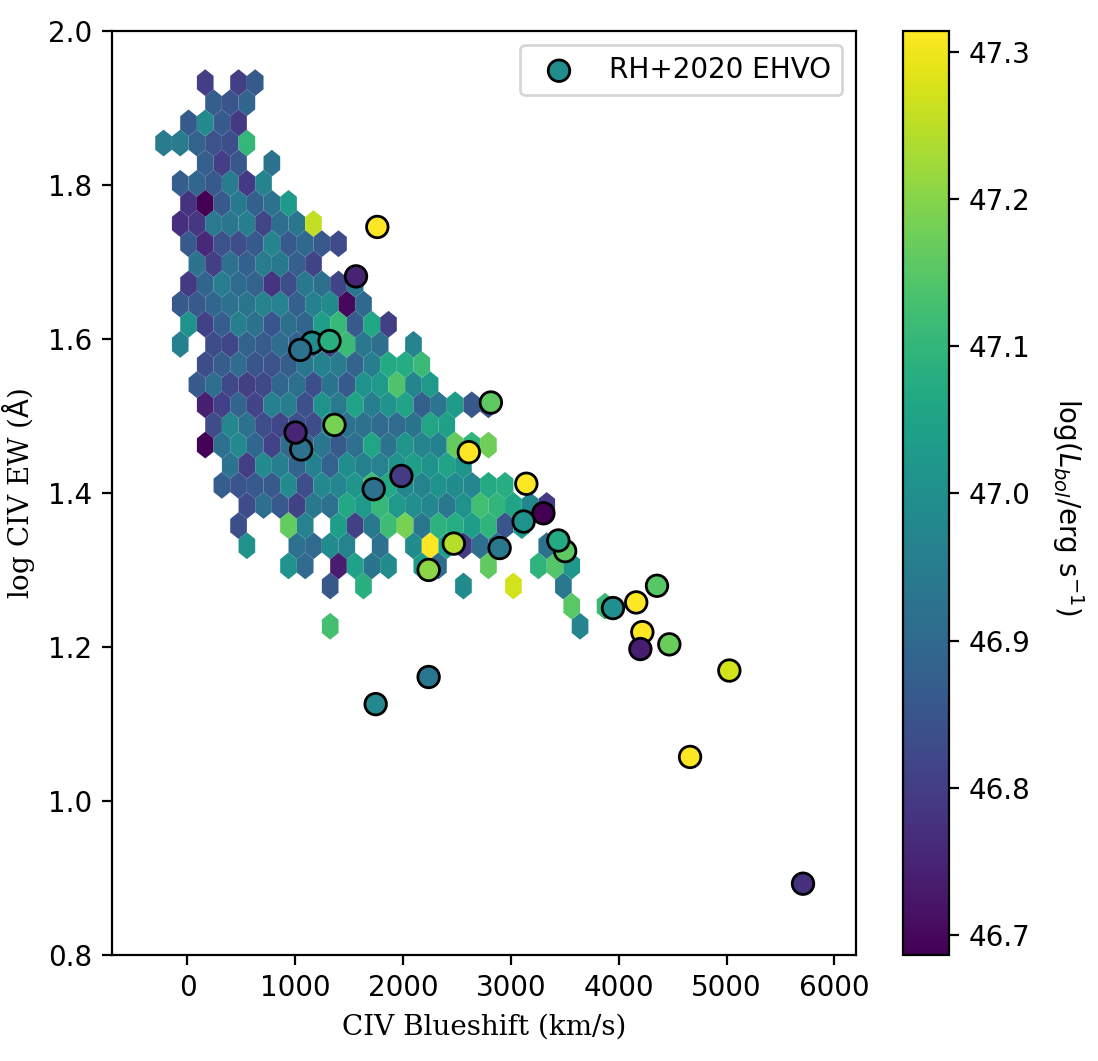
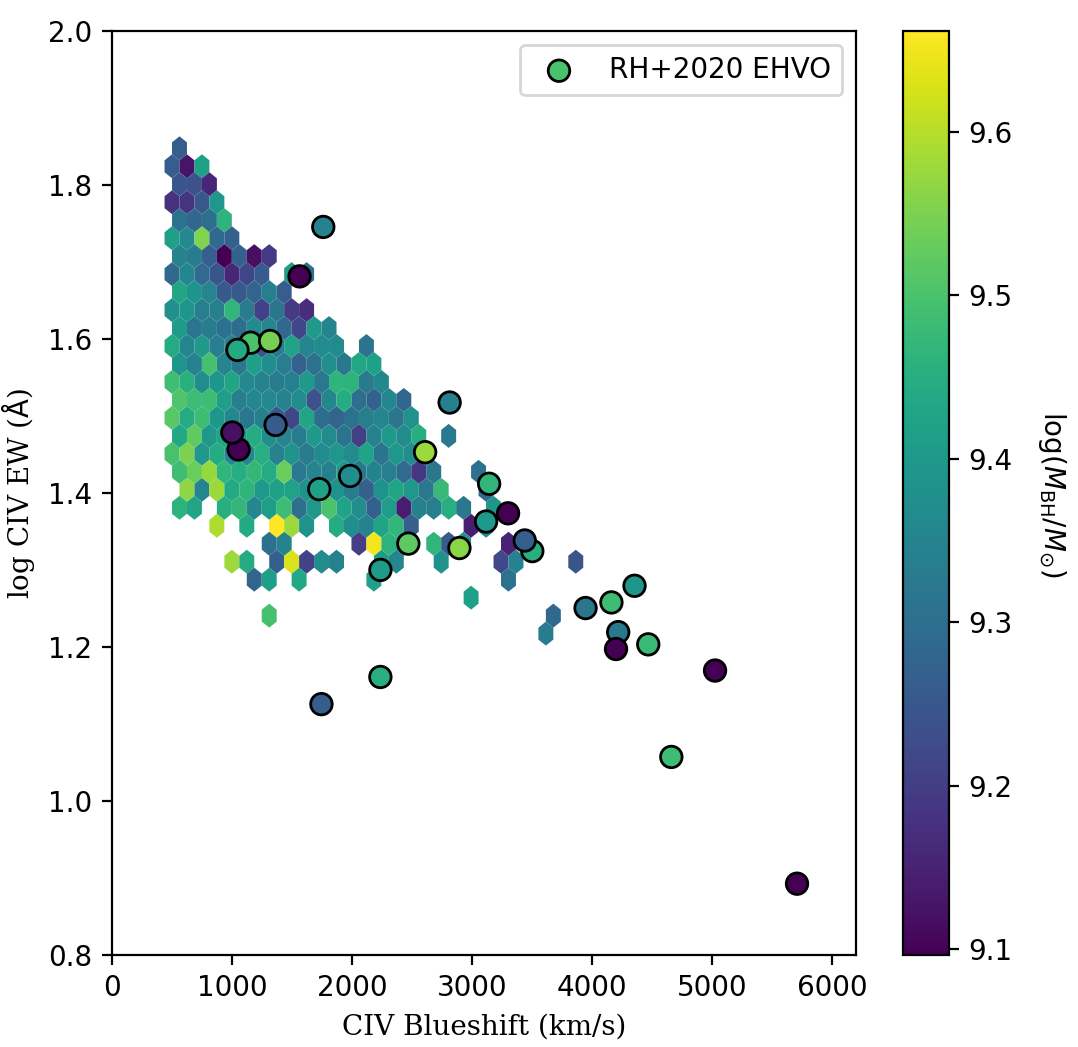
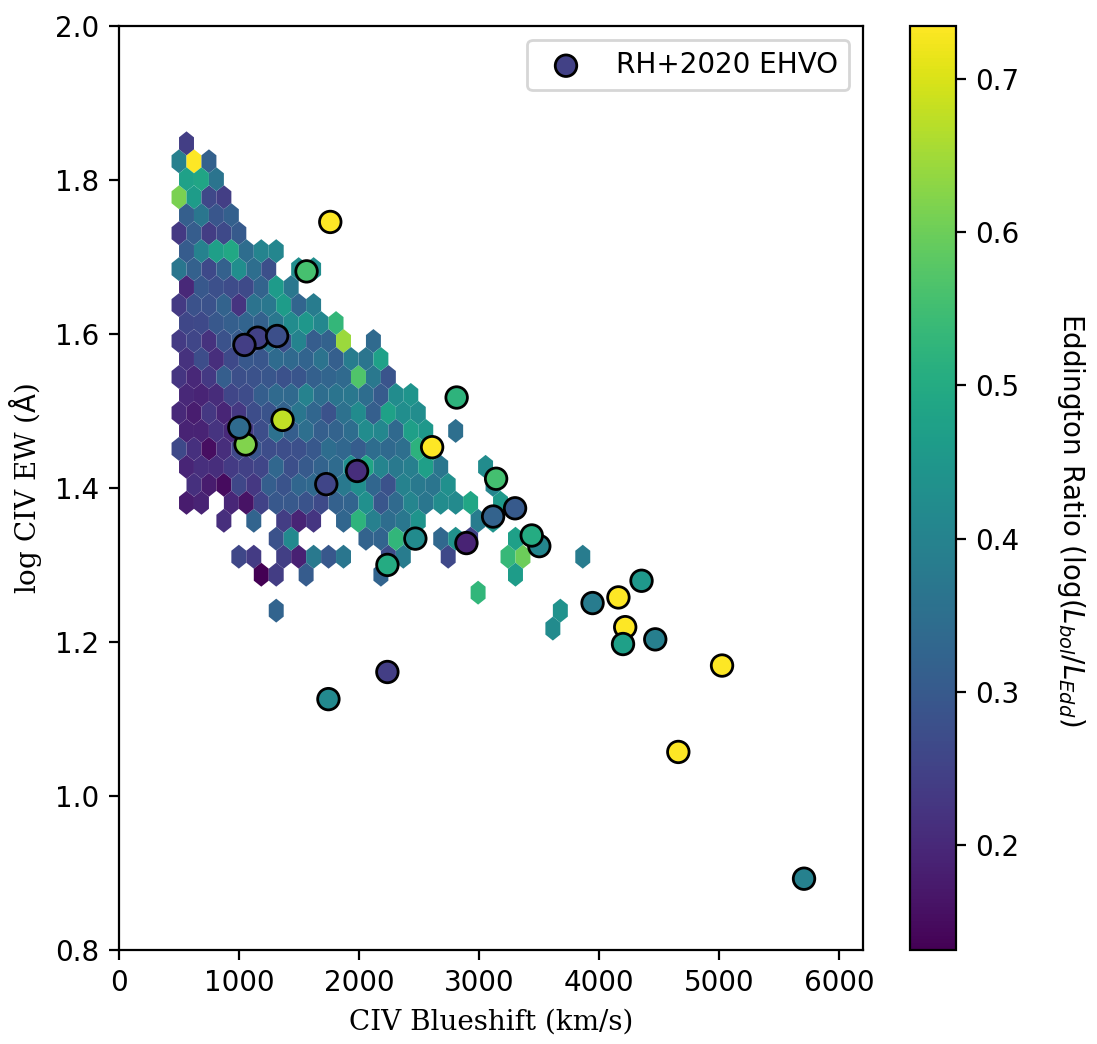
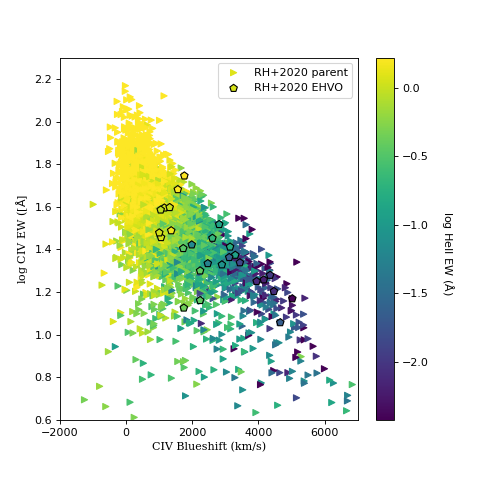
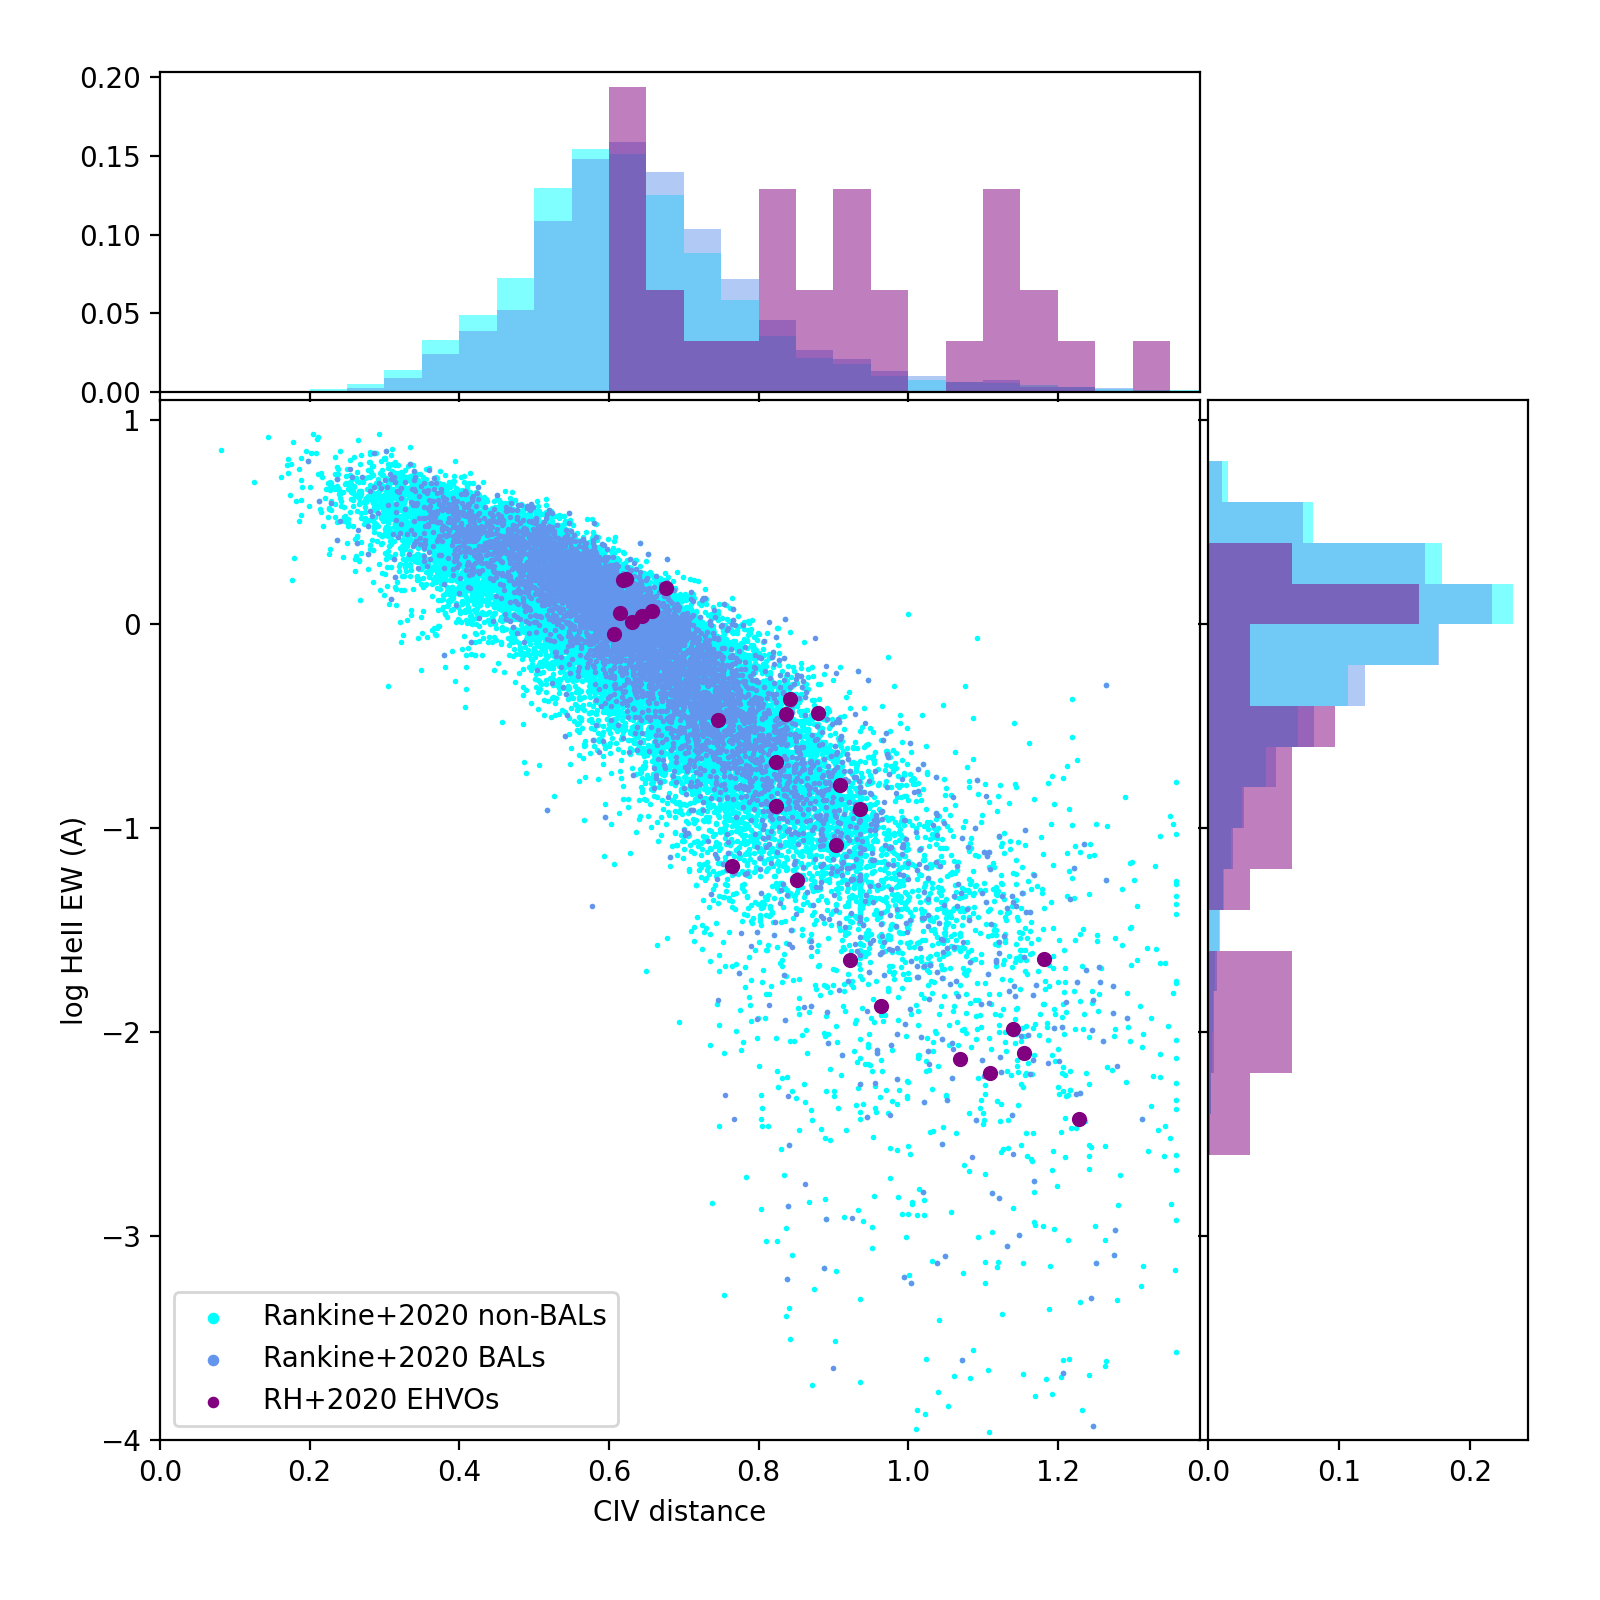
Figure 5 shows our analysis of Heii EW in EHVOs. Figure 5 (top) contains the C iv space colour-coded by the Heii EW for the EHVO and parent samples. In a similar manner to the bolometric luminosity, Eddington ratio and black hole mass, the Heii EWs of the EHVOs are consistent with the parent sample and determined by their location in C iv space. There is a subtle suggestion that the EHVOs with the largest C iv EW have perhaps slightly higher Heii EW than would be expected based on their location in C iv space. To assess this further we reduce the dimensionality by plotting the Heii EW as a function of the C iv distance in the bottom panel of Figure 5. C iv distance has been shown to anti-correlate almost linearly with Heii EW (Rivera et al., 2022), so we can use this metric to examine trends in C iv space more simply. The EHVO sample is clearly shifted to large C iv distances and lower Heii EW; however, from this Figure one can also see a cluster of EHVOs around a C iv distance of 0.7 which have significant Heii emission. The two EHVOs with the largest Heii EW (3 Å) in our sample have Heii emission that is as strong as appears to be allowed for their C iv distance values based on the parent population. Studies with larger samples of EHVOs will facilitate further investigation of this possible phenomenon.
4 Discussion
The literature is only sparsely populated with investigations connecting the outflows observed in absorption with those in emission at intermediate redshifts. Primarily because parameterising the C iv emission outflow signature is challenging in quasars with extensive C iv absorption. For example, Richards et al. (2011) used the blueshifted C iii] complex as a proxy for C iv blueshift; however, we were able to measure the C iv emission directly with the help of our ICA reconstruction scheme in Rankine+2020. Now, with these measurements, we have connected the emission outflow signatures with the extremely high velocity outflows observed in absorption.
Rankine+2020 has already shown that, except for the top-left quadrant of the C iv emission space, BALQSOs and non-BALQSOs share a large range of the parameter space; in other words, most emission-line properties of BALQSOs are indistinguishable from non-BALQSOs. This is not entirely surprising as broad absorption has been found to be variable and it can emerge (i.e., Hamann et al., 2008) and disappear (Filiz Ak et al. 2012) in quasar spectra. Quasars with EHVOs, on the other hand, populate the bottom-right quadrant of the C iv space, showing the largest C iv blueshifts; their distinct C iv emission line profiles suggest that EHVOs may be a distinct class of quasars or a natural progression from BALQSOs as the speeds increase. In fact, BALQSOs with large speeds ( 15,000 km s-1) and EHVOs show similar properties in the C iv emission space, which suggests that the arbitrary cutoff at 0.1 due to the presence of Si iv+ Oiv] emission should be reconsidered: either placed around 0.05 or properties might change gradually as velocity increases. Many quasars that show EHVOs also include outflows in the 0.05-0.1 velocity range. As described in RH+2020, absorption on top of the emission line complex is difficult to confirm, but reconstructions such as those in Rankine+2020 are very promising to increase the number of EHVOs known in this region. Also, more studies comparing properties of EHVOs and those of BALQSOs with large speeds will help us learn whether EHVOs are a distinct class or an extension of large-speed BALQSOs.
Rankine+2020 showed a correlation between values of bolometric luminosity, Eddington ratio, BALQSOs’ speeds and C iv blueshifts. Finding that EHVOs occupy the parameter space with largest C iv blueshifts, we expected they would also show correlations with these parameters. In RH+2020, we had already found that EHVOs tend to have slightly larger bolometric luminosities, which we also find here, but we did not observe originally largest values of Eddington ratios. After investigating the different prescriptions to calculate black hole mass (Shen et al. 2011222 values from Shen et al. (2011) were used in the DR9Q EHVOs in RH+2020; Rankine+2020), we find that measurements that do not take into account the excess, non-virial, blue emission for quasars with large C iv blueshifts can be largely overestimated at large values (Coatman et al. 2017). Using Rankine+2020 we find more moderate values of black hole mass in EHVOs with an overall smaller spread. This results in a correlation between and Eddington ratio for EHVOs, which also show some of the largest values of these two properties (yellow and light green dots in Figure 4). Quasars at large redshift ( 5.8; Bischetti et al. 2022) also seem to have larger values of Eddington ratios. Our results confirm the increase of sub-relativistic accretion disk winds with increasing Eddington ratios predicted by Giustini & Proga (2019). While our study remains in the low end of the Super-Eddington regime, Giustini & Proga (2019) predicts more polar jets which would be interesting to explore in the EHVO cases with large Eddington ratios.
The dearth of BALQSOs in the top-left quadrant (or with the lowest C iv distances) correlates with stronger Heii 1640.42 emission lines. Heii is stronger for harder spectral energy distributions (SEDs; Casebeer et al. 2006), which result in weaker winds because the gas may be too ionized for radiation line driving to be efficient due to the electrons no longer being bound to the nuclei. Indeed, Richards et al. (2011) and Baskin et al. (2015) already showed that BAL-type quasars have typically weaker Heii emission in their composite spectra. However, Rankine+2020 suggested that for a given quasar, the location in C iv emission space is more important for determining the quasar’s properties such as the bolometric luminosity, Eddington ratio, and strength of the ionising SED than whether or not the quasar is a BALQSO. Our results further this conclusion as we find that the location in C iv space is more important for determining the bolometric luminosity, Eddington ratio, and black hole mass than the presence of fast EHVOs as their values for the EHVO sample are consistent with both the non-BAL and BALQSOs. The Heii emission is close to indistinguishable from the parent population; however, the suspected limit on Heii EW for the presence of EHVOs suggests that their is an SED hardness above which EHVOs cannot be driven. This is in contrast to BALQSOs which can have Heii EWs higher than this limit although larger EHVO samples are needed to confirm this. We also find that the values for EHVOs show an incipient trend in the C iv emission space towards larger C iv blueshifts, as BALQSOs show, but it needs to be confirmed by enlarging the sample.
5 Conclusions
We have examined the continuum and emission line properties, namely C iv and Heii, bolometric luminosities, Eddington ratios, and black hole masses, of a sample of 31 quasars with EHVOs and considered these properties in the context of the quasar population as a whole. A summary of our findings:
-
1.
Typically, EHVOs are hosted by quasars found in the lower-right quadrant of C iv space, with large blueshifts and low EWs (Figure 2), both more extreme than the average values for all non-BALQSOs and BALQSOs, but similar to those BALQSOs with large speeds.
-
2.
The small sample size deters us from making any substantial claims about velocity trends; however, the maximum EHVO velocity increases with increasing C iv blueshift, consistent with the trends found in the BALQSOs. The minimum velocity on the other hand shows no such trend (Figure 3).
-
3.
The bolometric luminosities, black hole masses, and Eddington ratios of our EHVO sample are very similar to the corresponding values of other quasars in the parent sample in the same portion of the C iv emission line parameter space (Figure 4). Bolometric luminosities and Eddington ratios appear to be on the slightly larger realm of the parameter space, similarly to what occurs for high- quasars.
-
4.
The Heii EWs, an indicator of the strength of the ionising SEDs, of the EHVO sample are close to identical to the parent sample given their location in C iv space; however, there is the suggestion that their is an upper limit of Heii strength and therefore SED hardness for a quasar to host an EHVO (Figure 5).
With new samples of EHVO quasars (for example, DR16Q, Rodríguez Hidalgo et al. in prep) we will be able to improve the statistics of the trends we have discovered with EHVO velocities, Eddington ratio, luminosity, and black hole mass. Larger samples will also facilitate further study of potential limits of SED hardness via examination of the Heii emission line.
Finding more potential connections between outflows in emission and absorption will become the cornerstone work for future James Webb Space Telescope (JWST) and Atacama Large Millimeter/submillimeter Array (ALMA) proposals to study [CII] and OIII] emission and observe the host galaxies of EHVO quasars.
References
- Allen et al. (2013) Allen, J. T., Hewett, P. C., Richardson, C. T., Ferland, G. J., & Baldwin, J. A. 2013, MNRAS, 430, 3510
- Astropy Collaboration et al. (2013) Astropy Collaboration, Robitaille, T. P., Tollerud, E. J., Greenfield, P., Droettboom, M., Bray, E., Aldcroft, T., Davis, M., Ginsburg, A., Price-Whelan, A. M., Kerzendorf, W. E., Conley, A., Crighton, N., Barbary, K., Muna, D., Ferguson, H., Grollier, F., Parikh, M. M., Nair, P. H., Unther, H. M., Deil, C., Woillez, J., Conseil, S., Kramer, R., Turner, J. E. H., Singer, L., Fox, R., Weaver, B. A., Zabalza, V., Edwards, Z. I., Azalee Bostroem, K., Burke, D. J., Casey, A. R., Crawford, S. M., Dencheva, N., Ely, J., Jenness, T., Labrie, K., Lim, P. L., Pierfederici, F., Pontzen, A., Ptak, A., Refsdal, B., Servillat, M., & Streicher, O. 2013, A&A, 558, A33
- Bahcall et al. (1997) Bahcall, J. N., Kirhakos, S., Saxe, D. H., & Schneider, D. P. 1997, ApJ, 479, 642
- Baskin et al. (2013) Baskin, A., Laor, A., & Hamann, F. 2013, MNRAS, 432, 1525
- Baskin et al. (2015) Baskin, A., Laor, A., & Hamann, F. 2015, MNRAS, 449, 1593
- Bischetti et al. (2022) Bischetti, M., Feruglio, C., D’Odorico, V., Arav, N., Bañados, E., Becker, G., Bosman, S. E. I., Carniani, S., Cristiani, S., Cupani, G., Davies, R., Eilers, A. C., Farina, E. P., Ferrara, A., Maiolino, R., Mazzucchelli, C., Mesinger, A., Meyer, R. A., Onoue, M., Piconcelli, E., Ryan-Weber, E., Schindler, J. T., Wang, F., Yang, J., Zhu, Y., & Fiore, F. 2022, Nature, 605, 244
- Casebeer et al. (2006) Casebeer, D. A., Leighly, K. M., & Baron, E. 2006, ApJ, 637, 157
- Chartas et al. (2002) Chartas, G., Brandt, W. N., Gallagher, S. C., & Garmire, G. P. 2002, ApJ, 579, 169
- Chen et al. (2021) Chen, C., Hamann, F., & Ma, B. 2021, ApJ, 909, 208
- Coatman et al. (2017) Coatman, L., Hewett, P. C., Banerji, M., Richards, G. T., Hennawi, J. F., & Prochaska, J. X. 2017, MNRAS, 465, 2120
- Crenshaw et al. (1999) Crenshaw, D. M., Kraemer, S. B., Boggess, A., Maran, S. P., Mushotzky, R. F., & Wu, C.-C. 1999, ApJ, 516, 750
- Di Matteo et al. (2005) Di Matteo, T., Springel, V., & Hernquist, L. 2005, Nature, 433, 604
- Dunn et al. (2008) Dunn, J. P., Crenshaw, D. M., Kraemer, S. B., & Trippe, M. L. 2008, AJ, 136, 1201
- Filiz Ak et al. (2012) Filiz Ak, N., Brandt, W. N., Hall, P. B., Schneider, D. P., Anderson, S. F., Gibson, R. R., Lundgren, B. F., Myers, A. D., Petitjean, P., Ross, N. P., Shen, Y., York, D. G., Bizyaev, D., Brinkmann, J., Malanushenko, E., Oravetz, D. J., Pan, K., Simmons, A. E., & Weaver, B. A. 2012, ApJ, 757, 114
- Ganguly & Brotherton (2008) Ganguly, R., & Brotherton, M. S. 2008, ApJ, 672, 102
- Gebhardt et al. (2000) Gebhardt, K., Bender, R., Bower, G., Dressler, A., Faber, S. M., Filippenko, A. V., Green, R., Grillmair, C., Ho, L. C., Kormendy, J., Lauer, T. R., Magorrian, J., Pinkney, J., Richstone, D., & Tremaine, S. 2000, ApJ, 539, L13
- Gibson et al. (2009) Gibson, R. R., Jiang, L., Brandt, W. N., Hall, P. B., Shen, Y., Wu, J., Anderson, S. F., Schneider, D. P., Vanden Berk, D., Gallagher, S. C., Fan, X., & York, D. G. 2009, ApJ, 692, 758
- Giustini & Proga (2019) Giustini, M., & Proga, D. 2019, A&A, 630, A94
- Hamann et al. (1997) Hamann, F., Barlow, T. A., Junkkarinen, V., & Burbidge, E. M. 1997, ApJ, 478, 80
- Hamann et al. (2008) Hamann, F., Kaplan, K. F., Hidalgo, P. R., Prochaska, J. X., & Herbert-Fort, S. 2008, MNRAS, 391, L39
- Hamann & Sabra (2004) Hamann, F., & Sabra, B. 2004, in Astronomical Society of the Pacific Conference Series, 311, AGN Physics with the Sloan Digital Sky Survey, ed. G. T. Richards & P. B. Hall, 203
- Hopkins et al. (2006) Hopkins, P. F., Hernquist, L., Cox, T. J., Di Matteo, T., Robertson, B., & Springel, V. 2006, ApJS, 163, 1
- Jannuzi et al. (1996) Jannuzi, B. T., Hartig, G. F., Kirhakos, S., Sargent, W. L. W., Turnshek, D. A., Weymann, R. J., Bahcall, J. N., Bergeron, J., Boksenberg, A., Savage, B. D., Schneider, D. P., & Wolfe, A. M. 1996, ApJ, 470, L11
- Komossa et al. (2015) Komossa, S., Xu, D., Fuhrmann, L., Grupe, D., Yao, S., Fan, Z., Myserlis, I., Angelakis, E., Karamanavis, V., Yuan, W., & Zensus, J. A. 2015, A&A, 574, A121
- Leighly (2004) Leighly, K. M. 2004, ApJ, 611, 125
- Lyke et al. (2020) Lyke, B. W., Higley, A. N., McLane, J. N., Schurhammer, D. P., Myers, A. D., Ross, A. J., Dawson, K., Chabanier, S., Martini, P., Busca, N. G., Mas des Bourboux, H. d., Salvato, M., Streblyanska, A., Zarrouk, P., Burtin, E., Anderson, S. F., Bautista, J., Bizyaev, D., Brandt, W. N., Brinkmann, J., Brownstein, J. R., Comparat, J., Green, P., de la Macorra, A., Muñoz Gutiérrez, A., Hou, J., Newman, J. A., Palanque-Delabrouille, N., Pâris, I., Percival, W. J., Petitjean, P., Rich, J., Rossi, G., Schneider, D. P., Smith, A., Vivek, M., & Weaver, B. A. 2020, ApJS, 250, 8
- Lynden-Bell (1969) Lynden-Bell, D. 1969, Nature, 223, 690
- Marziani et al. (2017) Marziani, P., Negrete, C. A., Dultzin, D., Martínez-Aldama, M. L., Del Olmo, A., D’Onofrio, M., & Stirpe, G. M. 2017, Frontiers in Astronomy and Space Sciences, 4, 16
- McCaffrey & Richards (2021) McCaffrey, T. V., & Richards, G. T. 2021
- Merritt & Ferrarese (2001) Merritt, D., & Ferrarese, L. 2001, ApJ, 547, 140
- Nestor et al. (2008) Nestor, D., Hamann, F., & Hidalgo, P. R. 2008, MNRAS, 386, 2055
- Pâris et al. (2012) Pâris, I., et al. 2012, A&A, 548, A66
- Pâris et al. (2018) Pâris, I., Petitjean, P., Aubourg, É., Myers, A. D., Streblyanska, A., Lyke, B. W., Anderson, S. F., Armengaud, É., Bautista, J., Blanton, M. R., Blomqvist, M., Brinkmann, J., Brownstein, J. R., Brandt, W. N., Burtin, É., Dawson, K., de la Torre, S., Georgakakis, A., Gil-Marín, H., Green, P. J., Hall, P. B., Kneib, J.-P., LaMassa, S. M., Le Goff, J.-M., MacLeod, C., Mariappan, V., McGreer, I. D., Merloni, A., Noterdaeme, P., Palanque-Delabrouille, N., Percival, W. J., Ross, A. J., Rossi, G., Schneider, D. P., Seo, H.-J., Tojeiro, R., Weaver, B. A., Weijmans, A.-M., Yèche, C., Zarrouk, P., & Zhao, G.-B. 2018, A&A, 613, A51
- Rankine et al. (2020) Rankine, A. L., Hewett, P. C., Banerji, M., & Richards, G. T. 2020, MNRAS, 492, 4553
- Reeves et al. (2003) Reeves, J. N., O’Brien, P. T., & Ward, M. J. 2003, ApJ, 593, L65
- Reichard et al. (2003) Reichard, T. A., Richards, G. T., Hall, P. B., Schneider, D. P., Vanden Berk, D. E., Fan, X., York, D. G., Knapp, G. R., & Brinkmann, J. 2003, AJ, 126, 2594
- Richards et al. (2011) Richards, G. T., Kruczek, N. E., Gallagher, S. C., Hall, P. B., Hewett, P. C., Leighly, K. M., Deo, R. P., Kratzer, R. M., & Shen, Y. 2011, AJ, 141, 167
- Richards et al. (2021) Richards, G. T., McCaffrey, T. V., Kimball, A., Rankine, A. L., Matthews, J. H., Hewett, P. C., & Rivera, A. B. 2021, AJ, 162, 270
- Rivera et al. (2022) Rivera, A. B., Richards, G. T., Gallagher, S. C., McCaffrey, T. V., Rankine, A. L., Hewett, P. C., & Shemmer, O. 2022, ApJ, 931, 154
- Rivera et al. (2020) Rivera, A. B., Richards, G. T., Hewett, P. C., & Rankine, A. L. 2020, ApJ, 899, 96
- Rodríguez Hidalgo et al. (2011) Rodríguez Hidalgo, P., Hamann, F., & Hall, P. 2011, MNRAS, 411, 247
- Rodríguez Hidalgo et al. (2020) Rodríguez Hidalgo, P., Khatri, A. M., Hall, P. B., Haas, S., Quintero, C., Khatu, V., Kowash, G., & Murray, N. 2020, ApJ, 896, 151
- Rogerson et al. (2016) Rogerson, J. A., Hall, P. B., Rodríguez Hidalgo, P., Pirkola, P., Brand t, W. N., & Filiz Ak, N. 2016, MNRAS, 457, 405
- Ross et al. (2013) Ross, N. P., McGreer, I. D., White, M., Richards, G. T., Myers, A. D., Palanque-Delabrouille, N., Strauss, M. A., Anderson, S. F., Shen, Y., Brandt, W. N., Yèche, C., Swanson, M. E. C., Aubourg, É., Bailey, S., Bizyaev, D., Bovy, J., Brewington, H., Brinkmann, J., DeGraf, C., Di Matteo, T., Ebelke, G., Fan, X., Ge, J., Malanushenko, E., Malanushenko, V., Mandelbaum, R., Maraston, C., Muna, D., Oravetz, D., Pan, K., Pâris, I., Petitjean, P., Schawinski, K., Schlegel, D. J., Schneider, D. P., Silverman, J. D., Simmons, A., Snedden, S., Streblyanska, A., Suzuki, N., Weinberg, D. H., & York, D. 2013, ApJ, 773, 14
- Scannapieco & Oh (2004) Scannapieco, E., & Oh, S. P. 2004, ApJ, 608, 62
- Schmidt et al. (1995) Schmidt, M., Schneider, D. P., & Gunn, J. E. 1995, AJ, 110, 68
- Shen et al. (2015) Shen, Y., Brandt, W. N., Dawson, K. S., Hall, P. B., McGreer, I. D., Anderson, S. F., Chen, Y., Denney, K. D., Eftekharzadeh, S., Fan, X., Gao, Y., Green, P. J., Greene, J. E., Ho, L. C., Horne, K., Jiang, L., Kelly, B. C., Kinemuchi, K., Kochanek, C. S., Pâris, I., Peters, C. M., Peterson, B. M., Petitjean, P., Ponder, K., Richards, G. T., Schneider, D. P., Seth, A., Smith, R. N., Strauss, M. A., Tao, C., Trump, J. R., Wood-Vasey, W. M., Zu, Y., Eisenstein, D. J., Pan, K., Bizyaev, D., Malanushenko, V., Malanushenko, E., & Oravetz, D. 2015, ApJS, 216, 4
- Shen et al. (2011) Shen, Y., Richards, G. T., Strauss, M. A., Hall, P. B., Schneider, D. P., Snedden, S., Bizyaev, D., Brewington, H., Malanushenko, V., Malanushenko, E., Oravetz, D., Pan, K., & Simmons, A. 2011, ApJS, 194, 45
- Silk & Rees (1998) Silk, J., & Rees, M. J. 1998, A&A, 331, L1
- Springel et al. (2005) Springel, V., Di Matteo, T., & Hernquist, L. 2005, ApJ, 620, L79
- Tombesi et al. (2010) Tombesi, F., Cappi, M., Reeves, J. N., Palumbo, G. G. C., Yaqoob, T., Braito, V., & Dadina, M. 2010, A&A, 521, A57
- Tremaine et al. (2002) Tremaine, S., Gebhardt, K., Bender, R., Bower, G., Dressler, A., Faber, S. M., Filippenko, A. V., Green, R., Grillmair, C., Ho, L. C., Kormendy, J., Lauer, T. R., Magorrian, J., Pinkney, J., & Richstone, D. 2002, ApJ, 574, 740
- Trump et al. (2006) Trump, J. R., Hall, P. B., Reichard, T. A., Richards, G. T., Schneider, D. P., Vanden Berk, D. E., Knapp, G. R., Anderson, S. F., Fan, X., Brinkman, J., Kleinman, S. J., & Nitta, A. 2006, ApJS, 165, 1
- Wang et al. (2021) Wang, F., Yang, J., Fan, X., Hennawi, J. F., Barth, A. J., Banados, E., Bian, F., Boutsia, K., Connor, T., Davies, F. B., Decarli, R., Eilers, A.-C., Farina, E. P., Green, R., Jiang, L., Li, J.-T., Mazzucchelli, C., Nanni, R., Schindler, J.-T., Venemans, B., Walter, F., Wu, X.-B., & Yue, M. 2021, ApJ, 907, L1
- Wang et al. (2018) Wang, F., Yang, J., Fan, X., Yue, M., Wu, X.-B., Schindler, J.-T., Bian, F., Li, J.-T., Farina, E. P., Bañados, E., Davies, F. B., Decarli, R., Green, R., Jiang, L., Hennawi, J. F., Huang, Y.-H., Mazzucchelli, C., McGreer, I. D., Venemans, B., Walter, F., & Beletsky, Y. 2018, ApJ, 869, L9
- Weymann et al. (1991) Weymann, R. J., Morris, S. L., Foltz, C. B., & Hewett, P. C. 1991, ApJ, 373, 23
- Wu & Shen (2022) Wu, Q., & Shen, Y. 2022, A Catalog of Quasar Properties from Sloan Digital Sky Survey Data Release 16, arXiv:2209.03987 [astro-ph]