Investigation of a likely orbital periodicity of Nova Hercules 2021 in X-rays and -rays
Abstract
We report a detection of a 0.153 days period in the classical nova V1674 Her using the NICER observations taken within a month since the outburst (i.e., MJD 59405). The X-ray period is consistent with the orbital period previously found in the optical band, strongly suggesting the NICER signal as the X-ray orbital periodicity of the system. A seemingly double-humped profile was obtained by folding the detrended X-ray light curve with the period after removing the rotational X-ray pulsations of the nova. The profile may be caused by occultation by the companion or the accretion disk, possibly indicating a high inclination of the system. The -ray emission of V1674 Her with a significance level was detected by -LAT close to its optical peak and the emission faded away within 1 day, which is the shortest duration known for a -ray nova. Folded on 0.153 days, a marginal -ray variability can be also seen in the LAT light curve, but without the double-hump feature observed in X-rays. If the -ray modulation is real, its origin is probably different from that observed in the X-ray and optical bands.
keywords:
Novae — methods: data analysis — X-rays: stars — gamma-rays: stars1 Introduction
Nova Herculis 2021 (hereafter V1674 Her) was discovered as TCP J18573095+1653396 by Seiji Ueda on 2021 Jun. 12.5484 UT, with an apparent magnitude 8.4. A 16.62-mag pre-discovery detection from the All-Sky Automated Survey for Supernovae (ASAS-SN) showed that the transient actually started at least 8.4 hours before the discovery (2021 Jun. 12.1903 UT; Aydi et al. 2021), and it was soon identified as a classical nova with optical spectroscopy (Munari et al., 2021). V1674 Her was a fast nova, of which the magnitude dropped by 2 magnitude from the peak of mag in one day (Munari et al., 2021; Quimby et al., 2021), and could be the “fastest nova on record” (Wagner et al., 2021). V1674 Her can be seen in multiple wavelengths from GHz radio to GeV -rays (Sokolovsky et al., 2021; Wagner et al., 2021; Woodward et al., 2021; Kuin et al., 2021; Li, 2021). The X-ray telescope (XRT) of the Neil Gehrels Swift Observatory (Swift) began to detect V1674 Her on 2021 Jun. 14.41. 18 days later, it became a supersoft X-ray source (SSS; Page et al. 2021), and the XRT spectrum can be well fitted by a blackbody model (Drake et al., 2021) with temperatures of eV. In addition, Neutron Star Interior Composition Explorer (NICER) and Chandra Low-Energy Transmission Grating (LETG) confirmed that V1674 Her had entered the supersoft X-ray phase (Drake et al., 2021; Orio et al., 2022).
One of the most interesting features of V1674 Her is its timing properties. A spin period of 501.42 s (i.e., 8.357 min) can be detected using the archival Zwicky Transient Facility (ZTF; Bellm et al. 2019) data collected in the pre-outburst stage (Mroz et al., 2021). A similar signal at 501.52(2) s (i.e., 8.3586(3) min) can also be detected with the time-series photometry observed by the globally distributed telescopes of the Center for Backyard Astrophysics (CBA) during the outburst (i.e., 2021 Jul.– 2021 Aug.; Patterson et al. 2021). In addition to the optical band, -s X-ray pulsations were detected by Chandra (Maccarone et al., 2021; Drake et al., 2021), Swift (Page et al., 2021), and NICER (Orio et al., 2022), suggesting that V1674 Her is an intermediate polar (IP), which hosts a magnetized white dwarf (WD) with a surface magnetic field strength of several G (Orio et al., 2022). No obvious spin-down of V1674 Her can be found (Orio et al., 2022). Besides the spin signal, a double-humped orbital profile with a period of 0.15302(2) d was detected in the optical band (Patterson et al., 2021). However, the community paid less attention to the multi-wavelength analysis on the orbital signal, though the phenomenon is also rare for classical novae. Therefore, in this letter, we present the investigation of the orbital period in the X-ray band using NICER data and the variation of the -ray counterpart for V1674 Her. The possible scenarios of the emitting nature are also discussed in the final section.
2 Data Reduction and Analysis
In this letter, we concentrate on the investigation of V1674 Her in the X-ray band and its -ray counterpart. To accomplish our study, we used the X-ray archive of NICER observations obtained from NASA’s High Energy Astrophysics Science Archive Research Center (HEASARC) and performed the related analyses using the HEASoft package (HEASARC, 2014). In the -ray band, we analyzed the Pass 8 (P8R3) data collected by the Large Area Telescope (LAT). To study the high-energy emission properties of V1674 Her, we extracted the -ray source photons centered at R.A.=, decl.= (J2000) according to the ASAS-SN sky patrol (Aydi et al., 2021). For the timing analysis, we corrected the instrumental time to the barycentric dynamical time (TDB) using the JPL DE405 solar system ephemeris at the aforementioned source position.
2.1 NICER
NICER monitored V1674 Her with a series of observations using the X-ray timing instrument (XTI) from 2021 Jul. 10 to Aug. 31. Before Aug. 12, NICER observed the target everyday with 0.5–16 ks exposures except for Jul. 31 and Aug. 8. From Aug. 20 to 31, NICER did not have observations on Aug. 23–24 and Aug. 27, and the exposures ranged from 0.5 to 2.7 ks. Although NICER does not have an imaging capability, it is enabled a precise temporal resolution ( ns) and a high sensitivity in 0.2–12 keV to investigate the periodic signal embedded in V1674 Her (Okajima et al., 2016).
Photons collected from all the 52 NICER focal plane modules (FPMs) were all kept for timing analysis, but we only extracted them in the energy range of 0.25–12 keV to avoid the significant noise contamination below this energy range. We performed the reduction of all the NICER observations using HEASoft (v.6.29) and the barycentric time correction to the photon arrival times using the barycorr task. We note that the target’s brightness significantly became weaker since 2021 Jul. 31 (i.e., MJD 59425) so we also re-binned the data to trace the variability of the source.
2.2 Fermi
In order to investigate the -ray counterpart of V1674 Her reported by Li (2021), we re-analysed the Fermi Large Area Telescope (LAT) Pass 8 (P8R3) data in the energy range of 0.1–300 GeV. From the Fermi Science Support Center (FSSC), we downloaded the data obtained within an interval from 2021 June 5 (MJD 59370; one week before the nova discovery) to 2021 July 12 (MJD 59407; one month after the discovery). Source photons were extracted using a circular region of interest (ROI) of radius centered at the nova optical position. All the analysis processes were done by the Fermi Science tools (v11r5p3) .
We selected photons that belong to the class for point source or Galactic diffuse analysis (i.e., event class 128) and were collected in the front- and back-sections of the tracker (i.e., event type 3) in our analysis. The instrument response function applied for the selected event type is “P8R3_SOURCE_V2”, which do not have an anisotropic component of the residual background mainly caused by electrons in comparison to the earlier functions. We only used photons obtained in the good-time-intervals (i.e., DATA_QUAL 0) of the spacecraft and removed events with zenith angles larger than to avoid contamination from Earth’s albedo -rays. The binned likelihood analysis method provided by the Fermi science team was adopted with an emission model, which contains all the 4FGL-DR3 -ray sources (Abdollahi et al., 2022) within 15 degrees from the nova and two diffuse background components (i.e., iso_P8R3_SOURCE_V3_v1 and gll_iem_v07), generated by the FSSC user-contributed Python script make4FGLxml.py. Since the V1674 Her was brightest -ray source in the field111The -ray emission reached erg cm-2 s-1 at peak (Li, 2021), and there is no cataloged -ray source of erg cm-2 s-1 within 5 degrees from the nova according to 4FGL-DR3 (Abdollahi et al., 2022)., all the spectral parameters of the 4FGL-DR3 sources in the emission model were fixed for simplicity.
3 Results
3.1 X-ray timing signals
The spin period of V1674 Her was detected in the optical band (Bellm et al., 2019) and can also be confirmed in the X-ray band via different observations including Swift (Page et al., 2022), Chandra (Maccarone et al., 2021; Drake et al., 2021) and NICER (Pei et al., 2021; Orio et al., 2022) even though the source returned to a quiescence stage in 2022. In comparison to the investigation of the evolution of the spin period, the candidate signal of the orbital period was only reported in the optical band (Patterson et al., 2021). We check the orbital periodic signal using the NICER observations to monitor the source for almost two months soon after the outburst in 2022 Jun. We notice that both Swift and NICER provide the long-term observation to our target; however, the larger effective area and a better sensitivity of NICER are helpful in detecting the orbital period that is superimposed with the spin signal.
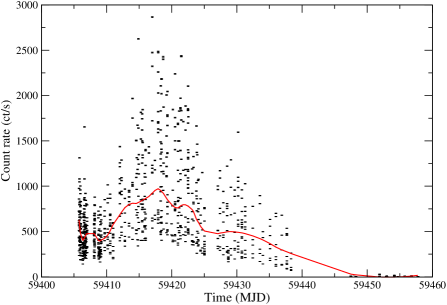
We used 100 s to bin the data summarized in Section 2.1 as shown in Fig. 1, and the red curve was determined by the local regression of nearby 200 data points using weighted linear least squares and a 2nd order polynomial model. In the preliminary test, we considered to check the orbital period in a short time interval with the most dense data points (i.e., 2021 Jul. 10–13) by the Lomb-Scargle periodogram (LSP; Lomb 1976; Scargle 1982). We can obtain two candidate signals with 99.9% white noise significance level (Horne & Baliunas, 1986) at the period of 0.1536(6) d and 0.1110(3) d. For the following time intervals, the data points are relatively sparse and the average count rate of each observation has a significant flux variation so the LSP is much more noisy. We speculated to remove the global trend of the variation as the red curve shown in Fig. 1, and the LSP obtained from the residual light curve for 2021 Jul. 10–13 enhances the Lomb-Scargle power of two major signals; however, the signal of the frequency between 6–7 can still be detected to correspond to 0.1528(3) d with 90% white noise significance level using 2021 Jul. 15–25 observations, but another one became insignificant.
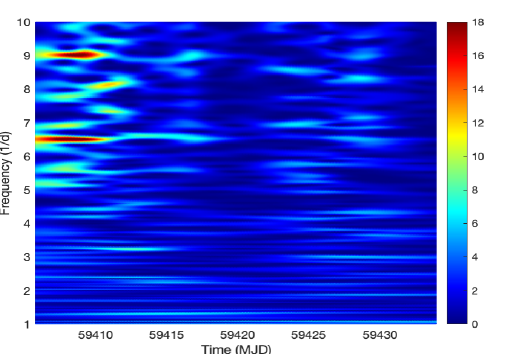
Even though we remove the global trend of the X-ray variation for V1674 Her, the periodic signal is still difficult to be clearly resolved with the LSP by the observations after 2021 Jul. 25. The major reason is that we have fewer data points within a much longer time span after Jul. 25; for instance, we have similar data points within 2021 Jul. 10–13 and Jul. 15–25, and it leads to a significantly drop on the detected power. To investigate the variation of the signal of 0.153 d, we selected the kernel parameter to characterize a small Gaussian envelope (; Foster 1996) to perform the weighted wavelet z-transform, which is a dynamical timing analytical scheme as described in Lin et al. (2015). Fig. 2 demonstrates the result obtained from the WWZ periodogram, and we can see a signal with a frequency between 6–7 d-1 across the entire investigation corresponding to the period of 0.153 d. The signal shows a tendency to slightly increase its frequency since MJD 59410 (i.e., i.e., 2021 Jul. 15), and the power of the signal significantly decreased since MJD 59420, which are consistent to the results obtained from the LSP.
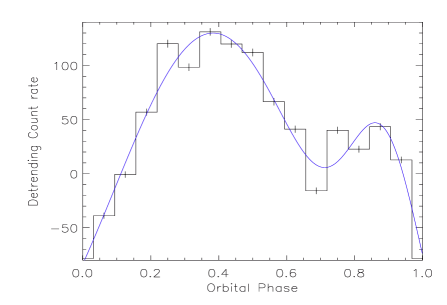
We tried to fold the detrended X-ray light curve with 0.153 d. No significant orbital modulation feature can be seen, and the major variability feature could originate from the scattered data points due to the spin pulsation (ref. Fig. 1). We therefore removed the pulsed component according to the timing solutions reported in the Table 6 of Orio et al. (2022) and regenerated the light curve using a time bin of 50 s with the photons constrained in the off-pulsed phase. Following the aforementioned procedures to detrend the light curve, we folded the light curve with the same signal only using the data collected before 2021 Jul. 25, during which the signal is more prominent (ref. Fig. 2). The modulation feature is still not clear enough to be directly determined by the best-fit to a sinusoidal or a Gaussian model, but the distribution of data points in the folded light curve has a marginally visible trend. Such a trend can be roughly resolved by an orbital profile composed of the mean value of data points in each bin of the folded light curve shown in Fig. 3. Please note that the small error bar of each bin only labels the uncertainty of the accumulated count rate, and it does not represent the dispersion scale of data points in one bin. Here we also provided a best-fit multi-Gaussian model to the profile, which has a double-humped structure similar to the optical detection.
3.2 -ray variations/counterpart
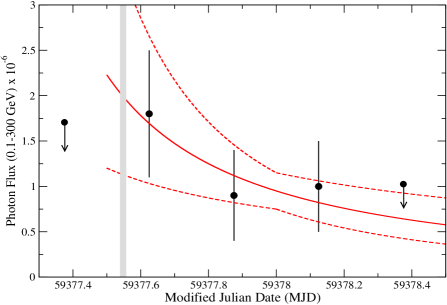
To check the -ray active period of V1674 Her, a preliminary daily -ray light curve was first extracted assuming a simple power-law with a fixed photon index (which is close to that of other known -ray novae, e.g., Abdo et al. 2010; Ackermann et al. 2014; Li et al. 2017). The -ray emission only showed up on June 12 and 13 (MJD 59377 and 59378) with ( and , respectively; the detection significance in the unit of ). We broke the 2-day interval into eight 0.25-day bins for a further investigation and found that the -ray emission was only detected (i.e., ) in 0.75 days from June 12.5 (MJD 59377.5) to June 13.25 (MJD 59378.25). A stack analysis222The iso_P8R3_SOURCE_V3_v1 component was fixed to 1 in this analysis. Otherwise, it goes to zero. with the 0.75-day data gives and photon cm-2 s-1 with . Using the improved spectral emission model with the photon index fixed to the best-fit value, we updated the three 0.75-day detections, and the corresponding values are photon cm-2 s-1 (), photon cm-2 s-1 (), and photon cm-2 s-1 (), respectively. Figure 4 shows the -ray light curve with a best-fit power-law of photon cm-2 s-1 (where is the time in MJD and was defined as MJD 59377) to describe a rapid decline.
We also performed phase-resolved analyses for the spin (501.42 seconds; Bellm et al. 2019) and orbital (0.153 days; this work) periods using the 0.75 days of LAT data. While phase-resolved analyses are generally difficult for novae given the short time interval, and hence, the poor photon statistic (note that the recent 544 s detection from ASASSN-16ma is the only candidate so far; Li 2022), a -ray nova with known orbital/spin periods like V1674 Her is extremely rare and this motivated us to work on -ray timing analysis. We employed the FSSC user-contributed Perl code, like_bphase, which is a straightforward script to compute the exposure-corrected phased light curves for given LAT observations and periods. Besides, we manually computed 95% upper limits for the light curve bins with . The -ray emission of V1674 Her was decreasing rapidly in the 0.75-day interval, and the phased light curves can also be affected by the long-term trend. To eliminate the effect, we detrend the phased light curves from like_bphase using the aforementioned power-law light curve model as well as the LAT exposures in the interval computed by gtexposure. Figure 5 shows the final results with the phase zero determined at MJD 59377.5. In the orbital one, it seems that the -ray emission was a bit brighter in the phase interval of 0–0.4, although the variation is not significant after counting error bars.
4 Discussions
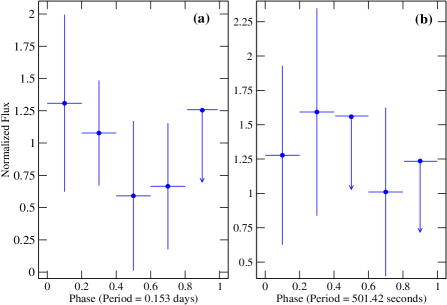
Some SSSs/Novae also have orbital periods detected in the X-ray band (e.g., 0.0593 d of Nova Muscae 1983, a.k.a. GQ Mus; Kahabka 1996, 0.1238 d of V5116 Sgr; Sala et al. 2017, 0.1719 d of 1E0035.4–7230; Kahabka 1996, 0.279 d of V4743 Sgr; Leibowitz et al. 2006, 0.295 d of V959 Mon; Peretz et al. 2016, and 1.77 d of HV Ceti; Beardmore et al. 2012). These detections can have different origins. Kahabka (1995) proposed the 1E0035.4–7230 and Nova Muscae 1983 to be “supersoft polars”, a subclass of SSSs that the magnetized WD with a strong field of – G has synchronized the companion, and the accretion column on the WD surface makes the observed orbital modulation. V4743 Sgr, V959 Mon, and V1674 Her have different spin and orbital periods, and a polar scenario is highly unlikely though the system can still be an intermediate polar with a magnetic field strength of – G (Hillman et al., 2019; Drake et al., 2021; Orio et al., 2022). Furthermore, the X-ray folded light curve of V1674 Her (Fig. 3) probably shows a double-hump profile, which is different from the rotational profiles seen in 1E0035.4–7230 and Nova Muscae 1983 (Kahabka, 1996).
The 0.153-day X-ray modulation could originate from occultation by the companion. Besides, it might be explained by occultation by a non-disrupted or re-formed accretion disk seen in high inclination, e.g., V959 Mon (Peretz et al., 2016). If occultation is the origin, the inclination of the system will be comparable to that of Nova Muscae 1983 (50°-70°; Diaz & Steiner 1994) and V959 Mon (60°–80°; Shore et al. 2013). In addition, we are aware of V1494 Aql and V5116 Sgr, which have several properties very similar to V1674 Her, e.g., fast novae, similar orbital periods of 3–4 hr, double-hump orbital profiles detected in the optical band (Barsukova & Goranskii, 2003; Kato et al., 2004; Dobrotka et al., 2008). It will be intriguing to have a deep investigation on the correlation of these three SSSs in the future.
Including V1674 Her, several novae have been detected in GeV -rays before the SSS phase (Gordon et al., 2021), and V1674 Her is the only nova system that reveals detectable -ray emission in just day, which could be the shortest duration known for a -ray nova. Because the significance of the -ray counterpart is not high (i.e., 5.8) and the -ray duration is short (i.e., less than a day), the limited photon statistic does not allow us to directly measure the spin and orbital periodicities. We therefore performed a phase-resolved likelihood analysis to examine the possible spin or orbital -ray modulations, and only the orbital folded light curve provides a marginal indication (Fig 5). If we rely on such a single broad Gaussian structure as the -ray orbital modulation, it is quite distinctive compared with the double-hump structure resolved in the optical band, indicating a different origin. The -ray emission is thought to be correlated with the shocks internal to the nova ejecta as the late/fast and early/slow nova winds collide (Metzger et al., 2015; Steinberg & Metzger, 2020). It is possible that the fast wind was partially blocked by the companion to create inhomogeneous shock emission, and a quasi-periodic modulated -ray feature could be formed. To clarify the -ray emitting nature, it is worth checking whether the spin or orbital modulation can be detected in other novae (e.g., ASASSN-16ma; Li 2022).
Acknowledgments
This work made use of archival data provided by the LAT data server of FSSC. This work is supported by the National Science and Technology Council (NSTC) through grant Nos. 110-2811-M-006-012 and 110-2112-M-006-006-MY3. C.-P. H. also acknowledges support from the NSTC in Taiwan through grant No. 109-2112-M-018-009-MY3. J. T. acknowledges support from the National Key Research and Development Program of China (grant No. 2020YFC2201400) and the National Natural Science Foundation of China (grant No. 12173014). K.L. L. is supported by the NSTC of Taiwan through grant No. 111-2636-M-006-024, and he is also a Yushan Young Fellow supported by the Ministry of Education of the Republic of China (Taiwan).
DATA AVAILABILITY
The NICER and Fermi observations used in this paper are publicly available at the Data Server.
NICER: https://heasarc.gsfc.nasa.gov/db-perl/W3Browse/
w3table.pltablehead=name%3Dnicermastr&Action=More+Options
Fermi-LAT: https://fermi.gsfc.nasa.gov/ssc/data/access/
References
- Abdo et al. (2010) Abdo A. A., et al., 2010, Science, 329, 817
- Abdollahi et al. (2022) Abdollahi S., et al., 2022, ApJS, 260, 53
- Ackermann et al. (2014) Ackermann M., et al., 2014, Science, 345, 554
- Aydi et al. (2021) Aydi E., et al., 2021, The Astronomer’s Telegram, 14710, 1
- Barsukova & Goranskii (2003) Barsukova E. A., Goranskii V. P., 2003, Astronomy Letters, 29, 195
- Beardmore et al. (2012) Beardmore A. P., et al., 2012, A&A, 545, A116
- Bellm et al. (2019) Bellm E. C., et al., 2019, PASP, 131, 018002
- Diaz & Steiner (1994) Diaz M. P., Steiner J. E., 1994, ApJ, 425, 252
- Dobrotka et al. (2008) Dobrotka A., Retter A., Liu A., 2008, A&A, 478, 815
- Drake et al. (2021) Drake J. J., et al., 2021, ApJL, 922, L42
- Foster (1996) Foster G., 1996, AJ, 112, 1709
- Gordon et al. (2021) Gordon A. C., Aydi E., Page K. L., Li K.-L., Chomiuk L., Sokolovsky K. V., Mukai K., Seitz J., 2021, ApJ, 910, 134
- HEASARC (2014) HEASARC 2014, HEAsoft: Unified Release of FTOOLS and XANADU (ascl:1408.004)
- Hillman et al. (2019) Hillman Y., Orio M., Prialnik D., Shara M., Bezák P., Dobrotka A., 2019, ApJL, 879, L5
- Horne & Baliunas (1986) Horne J. H., Baliunas S. L., 1986, ApJ, 302, 757
- Kahabka (1995) Kahabka P., 1995, in Buckley D. A. H., Warner B., eds, Astronomical Society of the Pacific Conference Series Vol. 85, Magnetic Cataclysmic Variables. p. 432
- Kahabka (1996) Kahabka P., 1996, A&A, 306, 795
- Kato et al. (2004) Kato T., Ishioka R., Uemura M., Starkey D. R., Krajci T., 2004, PASJ, 56, S125
- Kuin et al. (2021) Kuin P., Starrfield S., Orio M., Page K., 2021, The Astronomer’s Telegram, 14736, 1
- Leibowitz et al. (2006) Leibowitz E., Orio M., Gonzalez-Riestra R., Lipkin Y., Ness J. U., Starrfield S., Still M., Tepedelenlioglu E., 2006, MNRAS, 371, 424
- Li (2021) Li K.-L., 2021, The Astronomer’s Telegram, 14707, 1
- Li (2022) Li K.-L., 2022, ApJL, 924, L17
- Li et al. (2017) Li K.-L., et al., 2017, Nature Astronomy, 1, 697
- Lin et al. (2015) Lin L. C.-C., Hu C.-P., Kong A. K. H., Yen D. C.-C., Takata J., Chou Y., 2015, MNRAS, 454, 1644
- Lomb (1976) Lomb N. R., 1976, Ap&SS, 39, 447
- Maccarone et al. (2021) Maccarone T. J., Beardmore A., Mukai K., Page K., Pichardo Marcano M., Rivera Sandoval L., 2021, The Astronomer’s Telegram, 14776, 1
- Metzger et al. (2015) Metzger B. D., Finzell T., Vurm I., Hascoët R., Beloborodov A. M., Chomiuk L., 2015, MNRAS, 450, 2739
- Mroz et al. (2021) Mroz P., Burdge K., Roestel J. v., Prince T., Kong A. K. H., Li K. L., 2021, The Astronomer’s Telegram, 14720, 1
- Munari et al. (2021) Munari U., Valisa P., Dallaporta S., 2021, The Astronomer’s Telegram, 14704, 1
- Okajima et al. (2016) Okajima T., et al., 2016, in den Herder J.-W. A., Takahashi T., Bautz M., eds, Society of Photo-Optical Instrumentation Engineers (SPIE) Conference Series Vol. 9905, Space Telescopes and Instrumentation 2016: Ultraviolet to Gamma Ray. p. 99054X, doi:10.1117/12.2234436
- Orio et al. (2022) Orio M., et al., 2022, arXiv e-prints, p. arXiv:2204.01660
- Page et al. (2021) Page K. L., Orio M., Sokolovsky K. V., Kuin N. P. M., 2021, The Astronomer’s Telegram, 14747, 1
- Page et al. (2022) Page K. L., Beardmore A. P., Starrfield S., Wagner R. M., Woodward C. E., 2022, The Astronomer’s Telegram, 15317, 1
- Patterson et al. (2021) Patterson J., Epstein-Martin M., Vanmunster T., Kemp J., 2021, The Astronomer’s Telegram, 14856, 1
- Pei et al. (2021) Pei S., Luna G. J. M., Orio M., Behar E., Giese M., Mikolajewska J., Ness J.-U., 2021, The Astronomer’s Telegram, 14798, 1
- Peretz et al. (2016) Peretz U., Orio M., Behar E., Bianchini A., Gallagher J., Rauch T., Tofflemire B., Zemko P., 2016, ApJ, 829, 2
- Quimby et al. (2021) Quimby R. M., Shafter A. W., Corbett H., 2021, Research Notes of the American Astronomical Society, 5, 160
- Sala et al. (2017) Sala G., Ness J. U., Hernanz M., Greiner J., 2017, A&A, 601, A93
- Scargle (1982) Scargle J. D., 1982, ApJ, 263, 835
- Shore et al. (2013) Shore S. N., De Gennaro Aquino I., Schwarz G. J., Augusteijn T., Cheung C. C., Walter F. M., Starrfield S., 2013, A&A, 553, A123
- Sokolovsky et al. (2021) Sokolovsky K., et al., 2021, The Astronomer’s Telegram, 14731, 1
- Steinberg & Metzger (2020) Steinberg E., Metzger B. D., 2020, MNRAS, 491, 4232
- Wagner et al. (2021) Wagner R. M., Woodward C. E., Starrfield S., Banerjee D. P. K., Evans A., 2021, The Astronomer’s Telegram, 14746, 1
- Woodward et al. (2021) Woodward C. E., Banerjee D. P. K., Evans A., Wagner R. M., Starrfield S., 2021, The Astronomer’s Telegram, 14765, 1