Clean-limit superconductivity in H3S synthesized from sulfur and hydrogen donor ammonia borane
Abstract
We present detailed studies of the superconductivity in high-pressure H3S. X-ray diffraction measurements show that cubic H3S was synthesized from elemental sulfur and hydrogen donor ammonia borane (NH3BH3). Our electrical transport measurements confirm superconductivity with a transition temperature at . From the analysis of both the normal state resistivity and the slope of the critical field, we conclude that the superconductivity is described by clean-limit behaviour. A significant broadening of the resistive transition in finite magnetic field is found, as expected for superconductors. We identify a linear temperature-over-field scaling of the resistance at the superconducting transition which is not described by existing theories.
The discovery of superconductivity in H3S at a critical temperature of revolutionized the search for high-temperature superconductivity [1]. Since then, high-temperature superconductivity has been observed in a number of binary hydrides at high pressures including LaH10, CeH9, and YH9 and in carbonaceous sulfur hydride [1, 2, 3, 4, 5, 6]. Extreme pressures of typically more than are required for the synthesis and study of these hydride compounds. The high hydrogen stoichiometries yield the high density of electronic states, high-frequency phonon modes, and strong electron-phonon coupling necessary for a high- in phonon mediated superconductivity [6, 5, 7, 8, 9]. Both synthesis and experimental studies of high-temperature hydride superconductors remain very challenging due to the high pressures needed.
Synthesis of hydride superconductors is typically done by laser heating precursors in situ at high pressures. Only in the initial work by Drozdov et al. was superconducting H3S synthesized from the dissociation of molecular H2S at high pressures [1, 10, 11, 12]. All recent studies synthesized H3S from elemental sulfur and either molecular hydrogen or a hydrogen donor material as precursors using laser heating [13, 14, 15, 16, 3, 17, 18, 19]. Whilst molecular hydrogen affords the cleanest synthesis route, loading hydrogen into a diamond anvil cell (DAC) is technically much more demanding. Thus, it is not easily adapted for wide-spread and detailed studies of superconductivity in hydrides by the global physics community. Hence, it is important to establish synthesis routes using hydrogen donor materials like ammonia borane. For some hydrides this can be further simplified with evaporated samples of starting elements such as yttrium or lanthanum [17, 20].
Detailed understanding of the superconductivity in hydride compounds requires structural information, e.g. from x-ray diffraction (XRD) to complement information about the superconducting properties – ideally on the same sample. Transition temperatures up to have been linked to the cubic phase of H3S at a pressure of [1, 21]. At pressures below a rhombohedral distortion leads to a lower symmetry phase with a reduced [22]. Other phases have been reported but have not been probed for superconductivity [10, 11, 15, 19, 14].
Superconductivity in H3S has been confirmed with multiple probes despite the limitations and challenges of measurements in DACs. The most common evidence stems from the observation of zero resistance for various samples by the group of Eremets and the suppression of the resistive transition in magnetic field [1, 21, 13]. In addition, a suppression of has been observed for samples with deuterium substitution [1, 21] roughly in agreement with the expected isotope effect predicted by computational studies [7, 23]. A diamagnetic signal has been observed in DC magnetisation measurements [1, 18], nuclear resonant scattering [24], and in AC susceptibility by [12]. Recently, Minkov et al. have presented detailed magnetisation studies of H3S synthesized from sulfur and ammonia borane from which they extract the lower critical field and London penetration depth[18]. Here, we present electrical resistance measurements demonstrating superconductivity in H3S synthesized with this novel route using ammonia borane and sulfur.
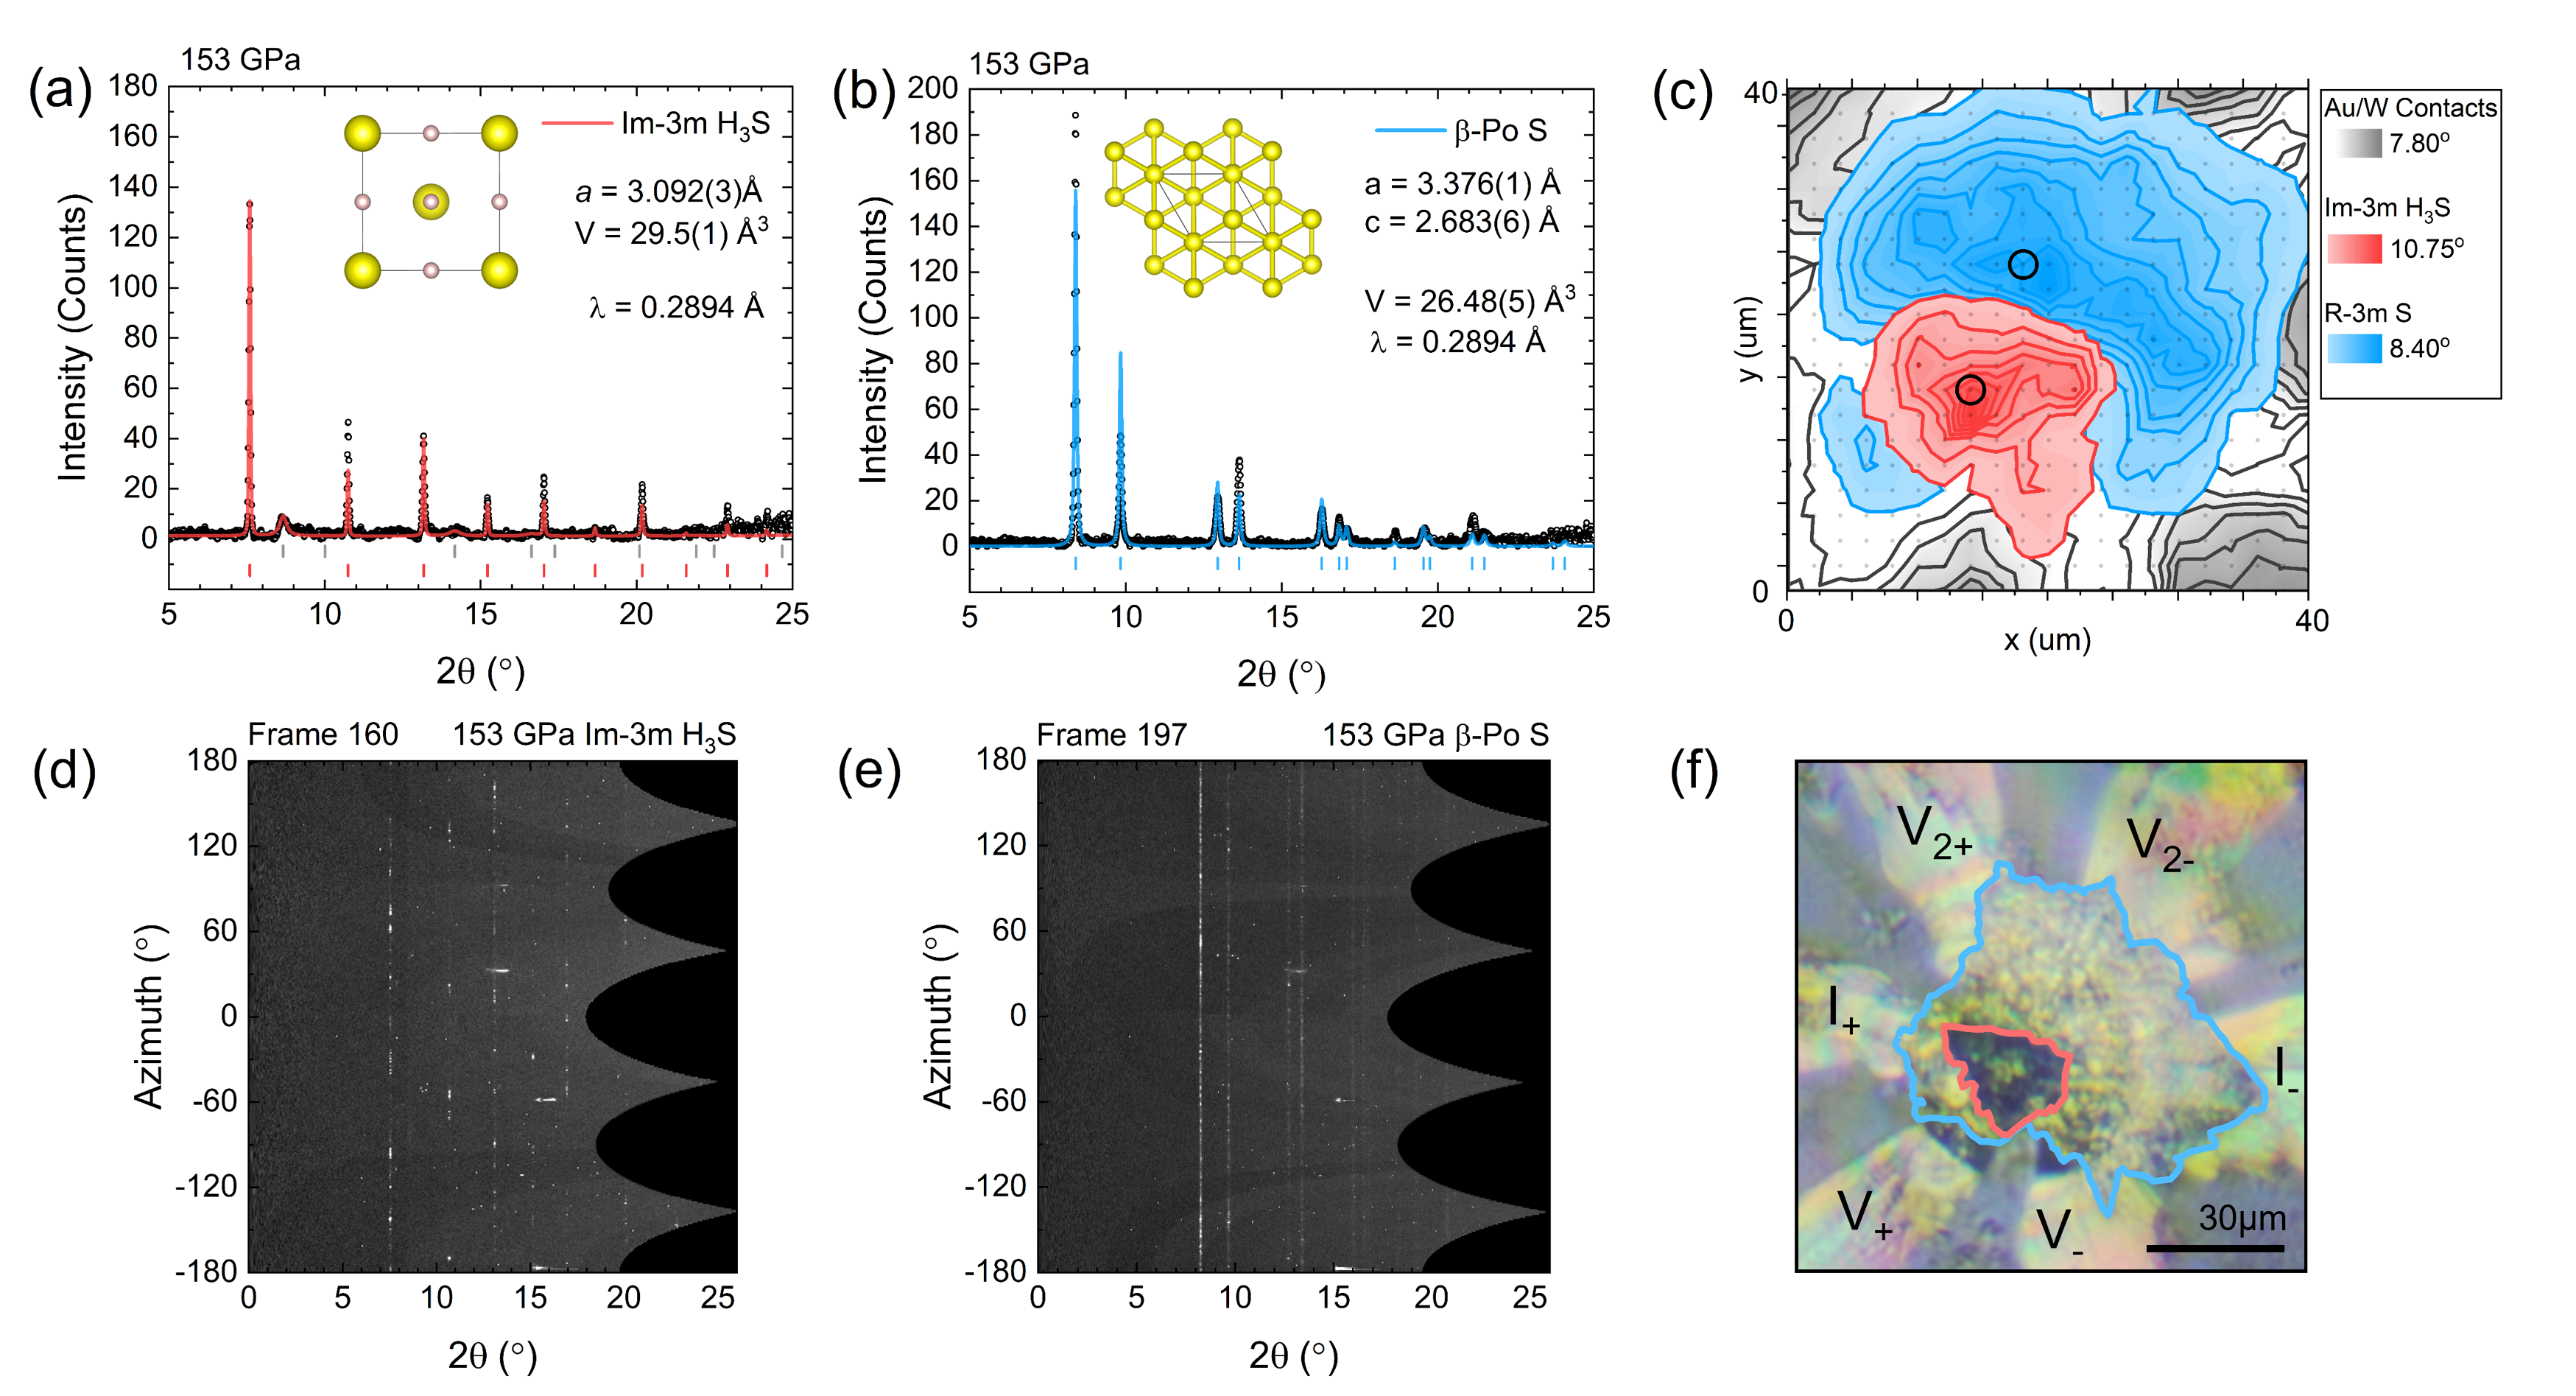
Our successful synthesis of H3S is evident from the XRD data collected on our sample at as presented in Figure 1. After loading sulfur and ammonia borane, we applied and subsequently laser heated the sample in a small area (cf. section I of the supplemental information for synthesis details[25, 26]). In the laser-heated area, we clearly observe an XRD pattern in excellent agreement with H3S as demonstrated in Figure 1 (a). (see section II of the supplementary information[25] and references therein[27, 28] for details of the XRD measurements) In particular, we observe no splitting of the (110) Bragg peak at 2 = and hence conclude that a rhombohedral distortion is absent in our sample. This is in agreement with the stability range of the phase above established from previous XRD measurements [10]. The phase in our sample consists of larger crystallites compared to the elemental sulfur as evident from the spots in the detector images Figure 1 (d) and (e). Yet, a preferred orientation appears to be absent as indicated by the good agreement with the Rietveld refinement of the XRD pattern in Figure 1 (a). For the H3S phase, we find a unit cell volume of in good agreement with previous calculations ()[29] and with earlier XRD studies at similar pressures () where H3S is synthesized using elemental precursors [10, 22]. Outside the laser-heated area, we find XRD patterns in excellent agreement with elemental sulfur (S-V) in its rhombohedral -Po structure (cf. Figure 1 (b)).
Both the XRD mapping and optical image (Figure 1 (c) and (f)) of our sample demonstrate that H3S has formed in an area of . In the optical image, this region is darker than the grainy, metallic elemental sulfur surrounding it and contains a reflective region in its centre. This black region likely marks boron nitride residue from the dissociation of ammonia borane, with weak Bragg reflections associated with boron nitride also visible in Figure 1 (a), whilst the central reflective area constitutes an exposed surface of H3S with metallic reflectivity. Below, we demonstrate that H3S in our sample displays metallic electrical resistance. The XRD mapping of the characteristic peaks (Figure 1) confirms that the entire dark region (including the reflective centre) has been transformed to H3S whilst the remainder of the sample is pure elemental sulfur. In addition, we observe the XRD peaks of tungsten and gold from our electrodes at the outer edges of the area scanned with XRD (gray areas in Figure 1 (c)).
Formation of superconducting H3S in our sample is evident from resistivity measurements presented in Figure 2, which show a large drop in resistance () at (see SI III for further details). Before laser heating, we observe the expected behaviour of elemental sulfur at high pressure: the resistance is metallic and features the superconducting transition of elemental sulfur at [30, 31]. After laser heating, the resistance shows a major drop at which we associate with the formation of superconducting H3S. Below , a residual resistance of remains which stems from residual elemental sulfur in the measurement path using the contacts . With six electrodes, the voltage drop associated with the superconducting transition can be measured in four-point configuration on both sides of the sample. Using the electrodes (labelled in Figure 1 f) close to the H3S part of the sample we find an drop of the resistance. By contrast, the electrodes further away (labelled ) yield a drop of less than . This shows that superconducting H3S is present closer to the electrodes whilst unreacted sulfur dominates the transport behaviour sensed between electrodes . Hence, we associate the resistive transition with superconductivity of the phase detected close to the electrodes.
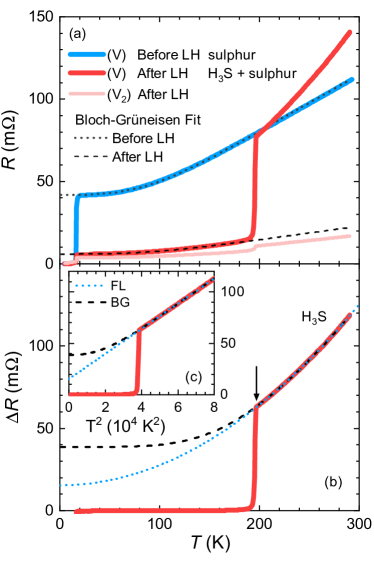
The resistance contribution originating from H3S is extracted in Figure 2 (b). Here, the residual resistance from elemental sulfur is subtracted over the full temperature range. For this, we identify the parameters describing the normal state resistance of elemental sulfur from a Bloch-Grüneisen (BG) fit
| (1) |
between as shown by the dotted line in Figure 2 (a). Here, is the residual resistance of the normal state, quantifies the magnitude of the resistance contribution from electron-phonon scattering, and is the Debye temperature. The exponent assumes different values depending on whether scattering is intra-band () or inter-band () [32]. We use parameters specific to elemental sulfur established from fits to before laser heating as shown by the dotted line in Figure 2: and . These parameters are in good agreement with recent calculations for elemental sulfur which predicts strong interband scattering [33]. With and fixed, only and are fitted to the sulfur contribution in the resistance after laser heating (dashed line in Figure 2 (a)). 111We find that the ratio is increased by for the sulfur contribution after laser heating compared to before laser heating. This suggests that the laser heating has annealed the elemental sulfur and reduced the concentration of dislocations and/or grain boundaries. We obtain the resistance contribution () of H3S by subtracting the fit representing the residual sulfur. This corresponds to the assumption of a series-resistor network which is guaranteed below by the superconducting state of H3S and likely satisfied above given the proximity of the sensing electrodes to the H3S phase in our sample. The resulting curve for the resistance of H3S is shown in Figure 2 (b).
The normal state behaviour of H3S can be well fitted by the BG form (Equation 1) as shown by the dashed line in Figure 2 (b). The limited temperature range f the normal state () does not allow to determine the exponent for H3S, and yield very similar fits to the data. We fix the exponent to the most common value , i.e. assuming that intra-band scattering is dominant in H3S but highlight the resulting uncertainty to other quantities. We find a Debye temperature ( for ) that is considerably larger than for elemental sulfur, reflecting the increased phonon energies stemming from lattice vibrations involving hydrogen. is in good agreement with the characteristic phonon frequency calculated by Errea et al. [7]. We note that the Fermi-liquid (FL) quadratic temperature dependence of the resistance () discussed in previous work [13] is consistent with the crossover range of the BG form as shown in the inset Figure 2 (c). However, the magnitude of the temperature-dependent resistance is much more consistent with the electron-phonon scattering associated with the BG form than the electron-electron scattering associated with the FL form. Specifically, using the lateral dimensions and a plausible thickness of of the H3S phase of the sample we estimate the resistivity and the specific magnitude of the electron-phonon contribution as well as the specific magnitude of the FL contribution . Whilst the uncertainty of and is dominated by the uncertainty of the sample thickness we can compare to values for other metals. is comparable in magnitude to values for simple monovalent metals [32] but is at least one order of magnitude larger than for transition metals [35]. Hence, this comparison suggests that the normal-state resistance of H3S is dominated by electron-phonon scattering.
We estimate the mean free path in our H3S sample to be . For this, we use the sample dimensions of the H3S part to estimate the residual resistivity and the Drude transport equation applied to a single-band free-electron approximation with the charge carrier concentration determined from Hall effect measurements [13].
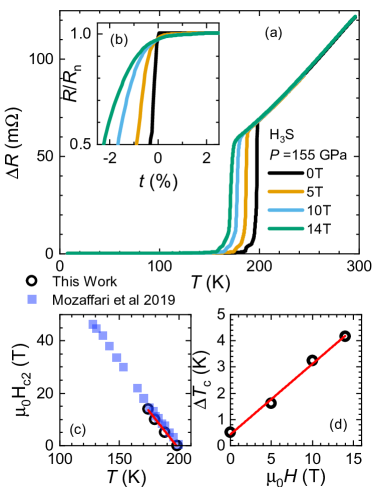
Further evidence for the superconducting nature of the transition at stems from our measurements in magnetic fields up to . In Figure 3(a), we show that the transition is shifted to lower temperature in magnetic field. The temperature-dependence of the upper critical field, , associated with superconductivity of H3S is in agreement with the behaviour reported earlier by Mozaffari et al. (cf. Figure 3(c)) [13]. Our samples and those of Mozaffari et al. have been synthesized with different methods, from sulfur and ammonia borane or hydrogen respectively. This is very likely to lead to different concentrations of impurities as indicated by the difference of resistance ratios at room temperature and low temperature estimated for the normal-state and for our sample and that of Mozaffari et al., respectively. The fact that we observe good agreement of between our samples and those of Mozaffari et al. suggests that the superconducting properties are independent of impurity concentrations, i.e. in the clean limit. By contrast, the samples obtained via dissociation of H2S by Drozdov et al. [1] showed a much smaller resistance ratio and a larger slope at the critical field suggesting an enhancement due to a limited mean free path, i.e. in the dirty limit.
The upper critical field of a superconductor is determined by the orbital and Pauli pair-breaking effects. Near , the Pauli pair-breaking is negligible for conventional superconductors and hence, we use the slope of the critical field to estimate the coherence length, , and Fermi velocity, . In the clean limit, the slope of the critical field is given by
| (2) |
where is the flux quantum. From this, we obtain the coherence length . Comparison of the coherence length with the mean free path () justifies applicability of the clean limit relations. We estimate the Fermi velocity using
| (3) |
where the numerical factor reflects the expected strong coupling behaviour associated with the high-temperature superconductivity in H3S. Based on these assumptions, we obtain .
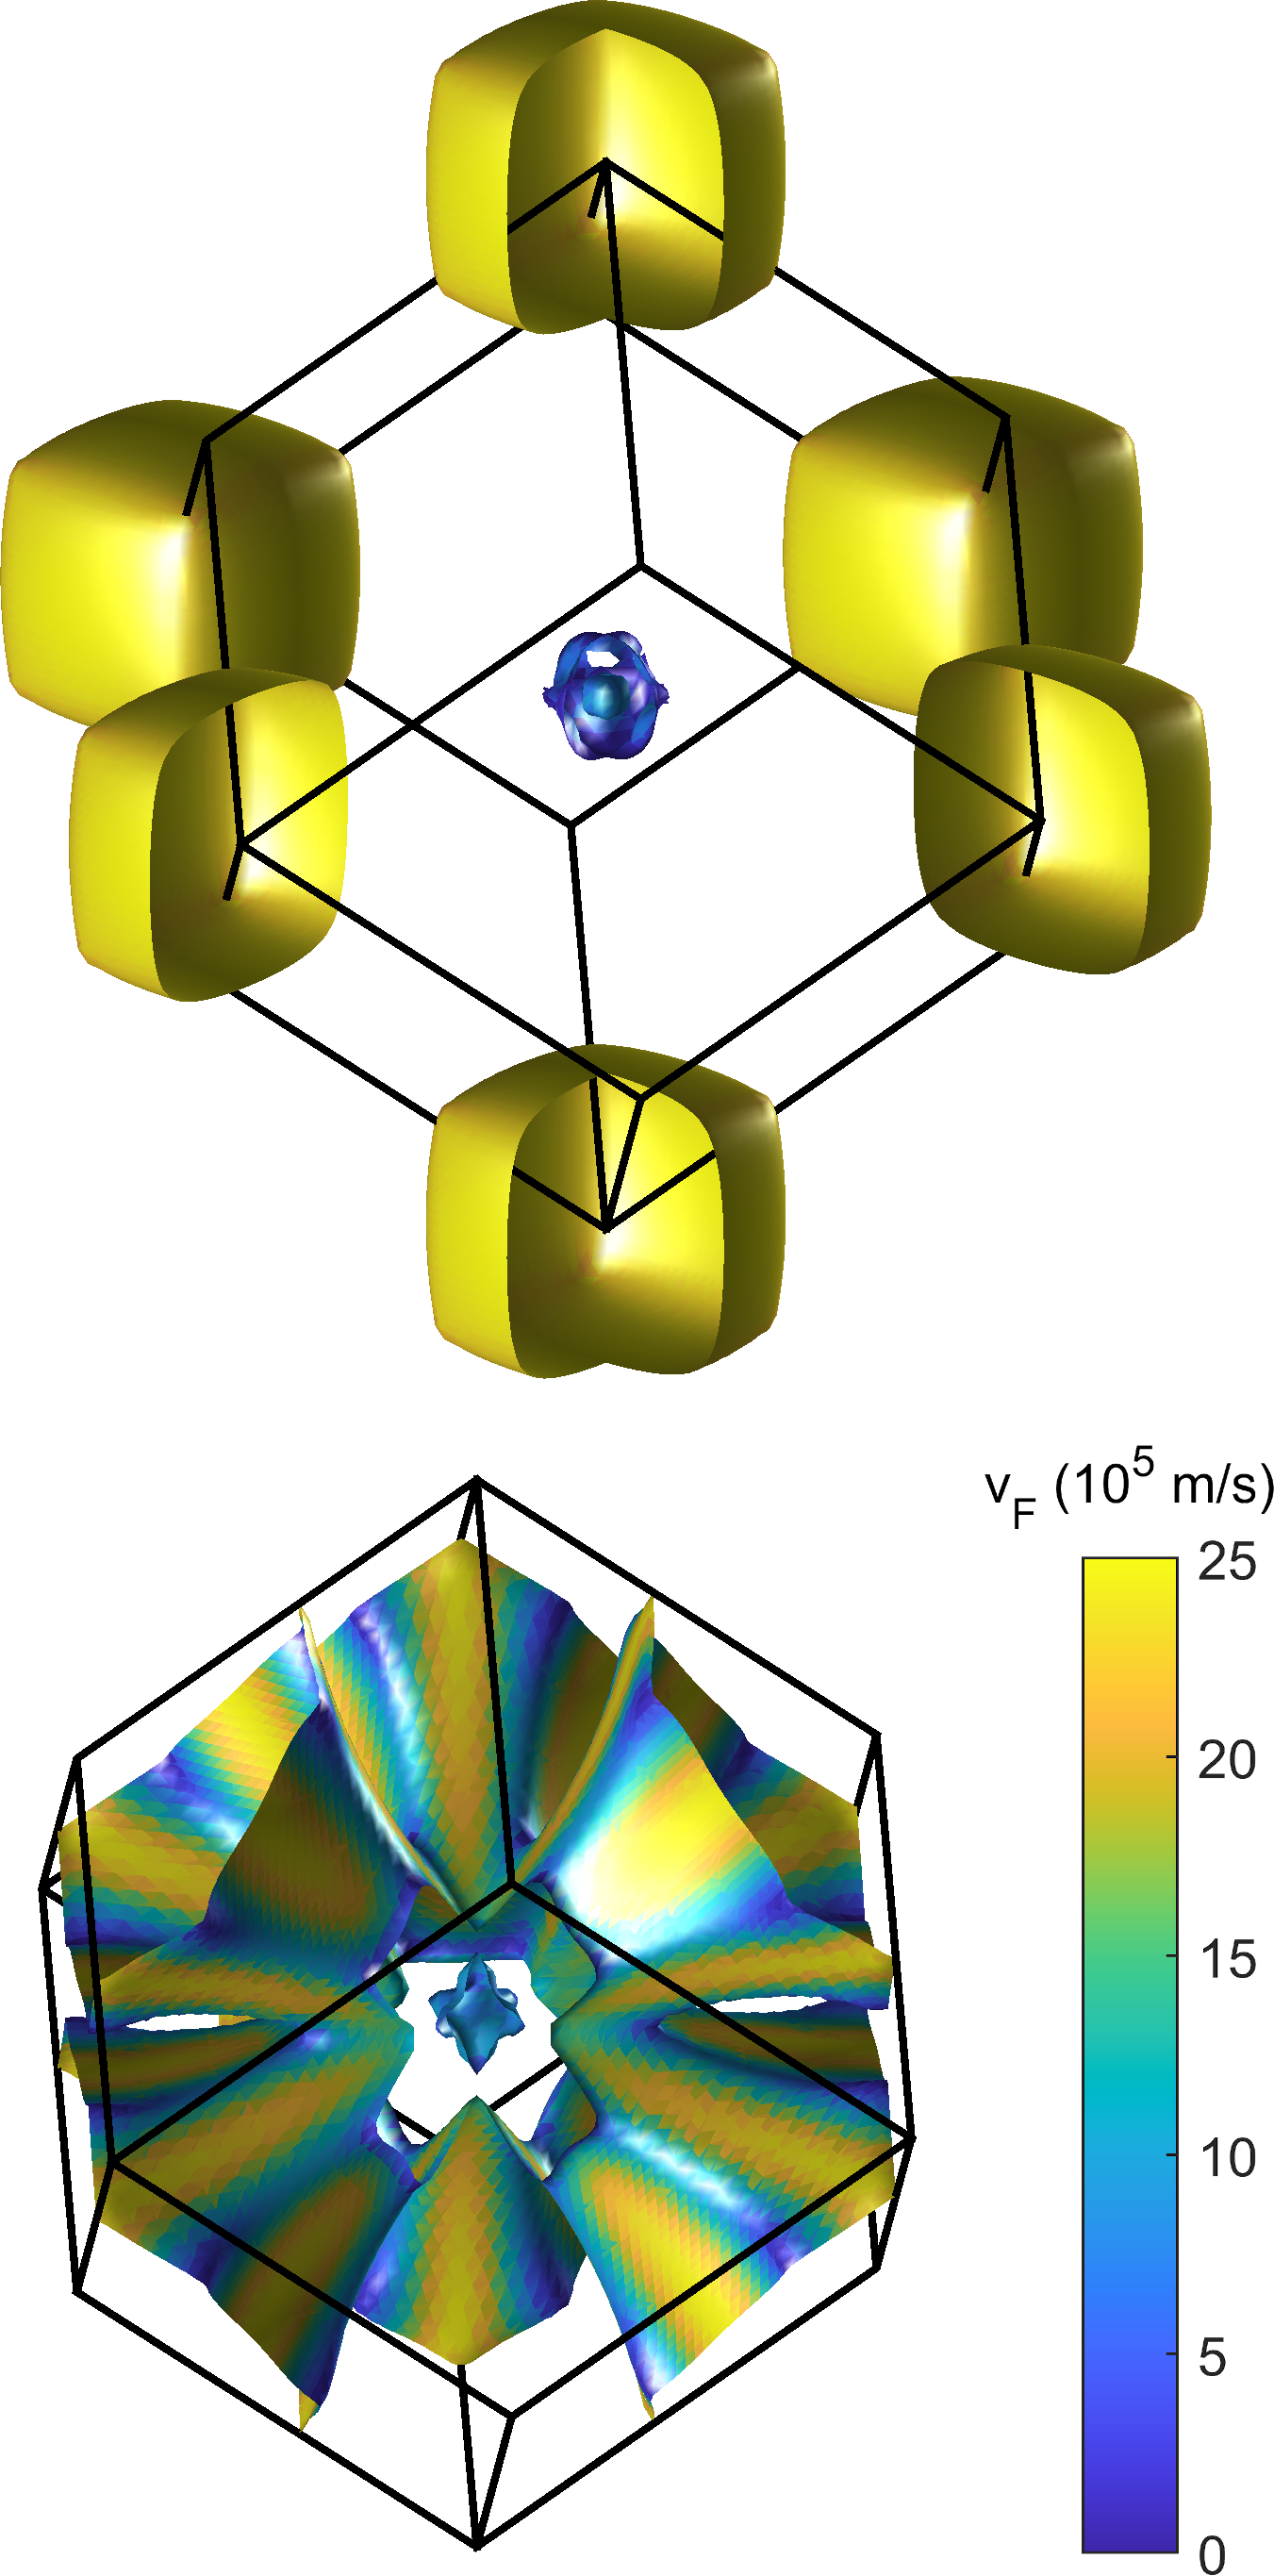
The obtained Fermi velocity is significantly lower than expected from DFT calculations. We employ Wien2k to calculate the band structure of H3S based on the experimental lattice parameters from our XRD results. (Details of the DFT calculation can be found in section IV of the supplementary information [25] and references therein[36, 37].) Our band structure looks very similar to earlier reports [38]. The Fermi velocity at the Fermi energy is shown as a colormap plot over the Fermi surface in Figure 4. A considerable variation of is found over several of the Fermi-surface sheets. Within a simple single-band model we can compare the global average of the Fermi velocity with our experimental result . The reduced Fermi velocity in experiment compared to DFT confirms strong renormalisation of the Fermi velocity due to the strong electron-phonon coupling in H3S [8].
We observe a clear broadening of the superconducting transition in magnetic field. The width of the superconducting transition can be influenced by many factors including inhomogeneities in composition and pressure. In zero field, our sample features a sharp transition with suggesting a good homogeneity of our sample and small pressure gradients. Upon application of a magnetic field, increases linearly as demonstrated in Figure 3(d). A similar linear form with offset has been reported for YH9 [17]. The broadening of the transition is most visible in the inset Figure 2(b). An increase in transition width is in general agreement with expectations for a superconducting state [39].
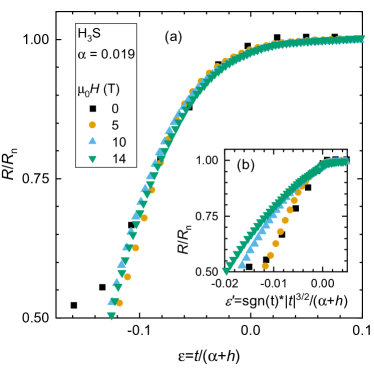
In finite magnetic field, flow of the flux lattice can increase the width of the superconducting transition. Near , the flow of the flux lattice is determined by the activation energy required to overcome pinning leading to the expectation that the resistance scales as [40]. Here is the normalized temperature and the normalized field. Alternatively, the suppression of filamentary superconductivity in finite magnetic fields can cause changes to the superconducting transition – usually leading to a sharper transition with a lower . By analysing the scaling behaviour of a large portion of the resistive transition, we focus on the contributions arising from the bulk of our H3S phase – the suppression of filamentary superconductivity does not usually lead to a scaling form of the resistance. In our sample of H3S, we find reasonable scaling of a large proportion of the superconducting transition as demonstrated in Figure 5. Good scaling is found for a functional form
| (4) |
linear in temperature, i.e. with . To determine , we use estimated by Mozaffari et al. [13] . The constant reflects the finite width of the superconducting transition in zero magnetic field associated with sample inhomogeneities, strain, or other non-thermal causes suggesting that Equation 4 implies a temperature-over-field scaling of the intrinsic superconducting transition in H3S. Notably, the scaling of Equation 4 leads to much better collapse of the data than a form involving predicted by Tinkham et al. [40] (cf. Figure 5(b)). Whilst a precise determination of , i.e. discriminating exponents close to unity will require further measurements over a wider field range the quality of the data collapse in Figure 5 suggests that linear temperature-over-field scaling dominates the fluctuations of the superconducting transition in H3S. A linear form Equation 4 is consistent with data on MgB2 and other hydride superconductors [41]. Yet, we note that the linear transition width and linear temperature-over-field scaling in H3S cannot be associated with granular anisotropic superconductivity like in MgB2 [42] as H3S is cubic. Hence, the linear temperature-over-field scaling of the resistance in H3S suggest that a new model might be required to describe the broadening of the superconducting transition in hydride superconductors.
I Conclusion
H3S can be synthesized from elemental sulfur and ammonia borane. Superconductivity is evident from a sudden drop in resistance which is found to shift to lower temperatures and broaden upon application of magnetic field. Two experimental observations suggest that the superconductivity follows clean-limit behaviour. (i) The critical field curve is found to be identical for different samples at the same pressure synthesized in different ways, i.e. independent of different levels of impurities. (ii) Our estimated mean free path is longer than the coherence length extracted from the slope of the critical field. A significant broadening of the superconducting transition in finite field is found and follows a linear scaling which suggests that a new model is required to describe the fluctuations in proximity to the superconducting transition in hydrides.
Acknowledgements.
The authors thank Antony Carrington for valuable discussions. This work was partially supported by the EPSRC under grants No. EP/V048759/1 and No. EP/L015544/1, as well as the ERC Horizon 2020 programme under grant 715262-HPSuper. O.L. would like to acknowledge support from the Royal Society in the form of a University Research Fellowship (UF150057). We acknowledge DESY (Hamburg, Germany), a member of the Helmholtz Association HGF, for the provision of experimental facilities. Parts of this research were carried out at PETRA III and we would like to thank Hanns-Peter Liermann for assistance in using P02.2. Beamtime was allocated for proposal I-20210376 EC.Additional information
References
References
- Drozdov et al. [2015] A. P. Drozdov, M. I. Eremets, I. A. Troyan, V. Ksenofontov, and S. I. Shylin, Nature 525, 73 (2015).
- Chen et al. [2021] W. Chen, D. V. Semenok, X. Huang, H. Shu, X. Li, D. Duan, T. Cui, and A. R. Oganov, Phys. Rev. Lett. 127, 117001 (2021).
- Snider et al. [2020] E. Snider, N. Dasenbrock-Gammon, R. McBride, M. Debessai, H. Vindana, K. Vencatasamy, K. V. Lawler, A. Salamat, and R. P. Dias, Nature 586, 373 (2020).
- Somayazulu et al. [2019] M. Somayazulu, M. Ahart, A. K. Mishra, Z. M. Geballe, M. Baldini, Y. Meng, V. V. Struzhkin, and R. J. Hemley, Phys. Rev. Lett. 122, 027001 (2019), arXiv:1808.07695v2 [cond-mat.mtrl-sci] .
- Kong et al. [2021] P. Kong, V. S. Minkov, M. A. Kuzovnikov, A. P. Drozdov, S. P. Besedin, S. Mozaffari, L. Balicas, F. F. Balakirev, V. B. Prakapenka, S. Chariton, D. A. Knyazev, E. Greenberg, and M. I. Eremets, Nature Communications 12, 5075 (2021).
- Drozdov et al. [2019] A. P. Drozdov, P. P. Kong, V. S. Minkov, S. P. Besedin, M. A. Kuzovnikov, S. Mozaffari, L. Balicas, F. F. Balakirev, D. E. Graf, V. B. Prakapenka, E. Greenberg, D. A. Knyazev, M. Tkacz, and M. I. Eremets, Nature 569, 528 (2019).
- Errea et al. [2016] I. Errea, M. Calandra, C. J. Pickard, J. R. Nelson, R. J. Needs, Y. Li, H. Liu, Y. Zhang, Y. Ma, and F. Mauri, Nature 532, 81 (2016).
- Errea et al. [2020] I. Errea, F. Belli, L. Monacelli, A. Sanna, T. Koretsune, T. Tadano, R. Bianco, M. Calandra, R. Arita, F. Mauri, and J. A. Flores-Livas, Nature 578, 66 (2020).
- Pickard et al. [2020] C. J. Pickard, I. Errea, and M. I. Eremets, Annu. Rev. Condens. Matter Phys. 11, 57 (2020).
- Goncharov et al. [2016] A. F. Goncharov, S. S. Lobanov, I. Kruglov, X.-M. Zhao, X.-J. Chen, A. R. Oganov, Z. Konôpková, and V. B. Prakapenka, Phys. Rev. B 93, 174105 (2016).
- Li et al. [2016] Y. Li, L. Wang, H. Liu, Y. Zhang, J. Hao, C. J. Pickard, J. R. Nelson, R. J. Needs, W. Li, Y. Huang, I. Errea, M. Calandra, F. Mauri, and Y. Ma, Phys. Rev. B 93, 020103 (2016).
- Huang et al. [2019] X. Huang, X. Wang, D. Duan, B. Sundqvist, X. Li, Y. Huang, H. Yu, F. Li, Q. Zhou, B. Liu, and T. Cui, Natl Sci Rev 6, 713 (2019).
- Mozaffari et al. [2019] S. Mozaffari, D. Sun, V. S. Minkov, A. P. Drozdov, D. Knyazev, J. B. Betts, M. Einaga, K. Shimizu, M. I. Eremets, L. Balicas, and F. F. Balakirev, Nature Communications 10, 2522 (2019), 1901.11208v1 .
- Pace et al. [2020] E. J. Pace, S. E. Finnegan, C. V. Storm, M. Stevenson, M. I. McMahon, S. G. MacLeod, E. Plekhanov, N. Bonini, and C. Weber, Phys. Rev. B 102, 094104 (2020).
- Guigue et al. [2017] B. Guigue, A. Marizy, and P. Loubeyre, Phys. Rev. B 95, 020104 (2017).
- Nakao et al. [2019] H. Nakao, M. Einaga, M. Sakata, M. Kitagaki, K. Shimizu, S. Kawaguchi, N. Hirao, and Y. Ohishi, J. Phys. Soc. Jpn. 88, 123701 (2019).
- Snider et al. [2021] E. Snider, N. Dasenbrock-Gammon, R. McBride, X. Wang, N. Meyers, K. V. Lawler, E. Zurek, A. Salamat, and R. P. Dias, Phys. Rev. Lett. 126, 117003 (2021), 2012.13627 .
- Minkov et al. [2021] V. Minkov, S. Bud’ko, F. Balakirev, V. Prakapenka, S. Chariton, R. Husband, H.-P. Liermann, and M. Eremets, Nature Portfolio 10.21203/rs.3.rs-936317/v1 (2021).
- Laniel et al. [2020] D. Laniel, B. Winkler, E. Bykova, T. Fedotenko, S. Chariton, V. Milman, M. Bykov, V. Prakapenka, L. Dubrovinsky, and N. Dubrovinskaia, Phys. Rev. B 102, 134109 (2020).
- Buhot et al. [2020] J. Buhot, O. Moulding, T. Muramatsu, I. Osmond, and S. Friedemann, Phys. Rev. B 102, 104508 (2020).
- Einaga et al. [2016] M. Einaga, M. Sakata, T. Ishikawa, K. Shimizu, M. I. Eremets, A. P. Drozdov, I. A. Troyan, N. Hirao, and Y. Ohishi, Nature Physics 12, 835 (2016).
- Goncharov et al. [2017] A. F. Goncharov, S. S. Lobanov, V. B. Prakapenka, and E. Greenberg, Phys. Rev. B 95, 140101 (2017).
- Villa-Cortés and De la Peña-Seaman [2022] S. Villa-Cortés and O. De la Peña-Seaman, Journal of Physics and Chemistry of Solids 161, 110451 (2022), arXiv:2103.12055 .
- Troyan et al. [2016] I. Troyan, A. Gavriliuk, R. Rüffer, A. Chumakov, A. Mironovich, I. Lyubutin, D. Perekalin, A. P. Drozdov, and M. I. Eremets, Science 351, 1303 (2016).
- Osmond [2022] I. Osmond, Supplementary material: Clean-limit superconductivity in Im3m H3S synthesized from sulfur and hydrogen donor ammonia - borane (2022).
- Lord et al. [2014] O. T. Lord, E. T. H. Wann, S. A. Hunt, A. M. Walker, J. Santangeli, M. J. Walter, D. P. Dobson, I. G. Wood, L. Vočadlo, G. Morard, and M. Mezouar, Physics of the Earth and Planetary Interiors 233, 13 (2014).
- Prescher and Prakapenka [2015] C. Prescher and V. B. Prakapenka, High Pressure Research 35, 223 (2015), https://doi.org/10.1080/08957959.2015.1059835 .
- Toby and Von Dreele [2013] B. H. Toby and R. B. Von Dreele, Journal of Applied Crystallography 46, 544 (2013).
- Duan et al. [2014] D. Duan, Y. Liu, F. Tian, D. Li, X. Huang, Z. Zhao, H. Yu, B. Liu, W. Tian, and T. Cui, Scientific reports 4, 6968 (2014), 25382349[pmid].
- Struzhkin et al. [1997] V. V. Struzhkin, R. J. Hemley, H.-K. Mao, and Y. A. Timofeev, Nature (London) 390, 382 (1997).
- Gregoryanz et al. [2002] E. Gregoryanz, V. V. Struzhkin, R. J. Hemley, M. I. Eremets, H.-k. Mao, and Y. A. Timofeev, Phys. Rev. B 65, 064504 (2002).
- Ziman [1960] J. M. Ziman, Electrons and phonons (Clarendon Pr., Oxford, 1960).
- Monni et al. [2017] M. Monni, F. Bernardini, A. Sanna, G. Profeta, and S. Massidda, Phys. Rev. B 95, 064516 (2017).
- Note [1] We find that the ratio is increased by for the sulfur contribution after laser heating compared to before laser heating. This suggests that the laser heating has annealed the elemental sulfur and reduced the concentration of dislocations and/or grain boundaries.
- Rice [1968] M. J. Rice, Phys. Rev. Lett. 20, 1439 (1968).
- Blaha et al. [2019] P. Blaha, K. Schwarz, G. Madsen, D. Kvasnicka, and J. Luitz, WIEN2k, 19th ed. (2019).
- Perdew et al. [1996] J. P. Perdew, K. Burke, and M. Ernzerhof, Phys. Rev. Lett. 77, 3865 (1996).
- Jarlborg and Bianconi [2016] T. Jarlborg and A. Bianconi, Scientific Reports 6, 24816 (2016).
- Hirsch and Marsiglio [2021] J. E. Hirsch and F. Marsiglio, Phys. Rev. B 103, 134505 (2021).
- Tinkham [1988] M. Tinkham, Phys. Rev. Lett. 61, 1658 (1988).
- Cornelius et al. [2022] A. L. Cornelius, K. V. Lawler, and A. Salamat, arXiv:2202.04254 [cond-mat.supr-con] 10.48550/arXiv.2202.04254 (2022), arXiv:2202.04254 [cond-mat.supr-con] .
- Eisterer et al. [2003] M. Eisterer, M. Zehetmayer, and H. W. Weber, Phys. Rev. Lett. 90, 247002 (2003).
- Friedemann [2022] S. Friedemann, Data for publication “Clean-limit superconductivity in Im3m H3S synthesized from sulfur and hydrogen donor ammonia borane”, \doi10.5523/bris.31o8e84oir4ug21mx9vqymsjyz (2022).