Understanding Braess’ Paradox in power grids
Abstract
Abstract
The ongoing energy transition requires power grid extensions to connect renewable generators to consumers and to transfer power among distant areas. The process of grid extension requires a large investment of resources and is supposed to make grid operation more robust. Yet, counter-intuitively, increasing the capacity of existing lines or adding new lines may also reduce the overall system performance and even promote blackouts due to Braess’ paradox. Braess’ paradox was theoretically modeled but not yet proven in realistically scaled power grids. Here, we present an experimental setup demonstrating Braess’ paradox in an AC power grid and show how it constrains ongoing large-scale grid extension projects. We present a topological theory that reveals the key mechanism and predicts Braessian grid extensions from the network structure. These results offer a theoretical method to understand and practical guidelines in support of preventing unsuitable infrastructures and the systemic planning of grid extensions.
Introduction
Electrical power grids are among the largest and most fundamental technical systems of our time, foremost due to their broad range of enabling functions Obama2013 : Almost all our infrastructures and activities, from communication to transport and from food supply to health care, crucially depend on a reliable supply of electric power. Due to the rapid increase of distributed renewable power generation shaukat2018survey , electrified vehicles lepoutre2019energy and sector coupling technologies robinius2017linking ; brown2018synergies , the topologies of power grid networks are strongly changing. In particular, extensions and reinforcements of power transmission grids are instrumental to the transition towards sustainable energy supply, requiring multi billion investments ECF2010 ; 50Hertz2012 ; Fuersch2013 . In particular, future power networks will be increasingly relying on long-distance transport via High-Voltage-Directed-Current (HVDC) lines, for instance to connect offshore wind generation with inland industrial sites or large urban areas. As a consequence, grid operation will change comprehensively, requiring a thorough and robust planning of all measures and processes involved.
While a substantial increase of power transmission capacities seems inevitable to meet future demand pesch2014impacts ; schlachtberger2017benefits , already individual measures may introduce novel threats and risks. A cornerstone manifestation of threats results from Braess’ paradox, originally found in economics Braess1968 ; braess2005paradox . The counter-intuitive finding that network extensions or reinforcements may deteriorate a system’s functionality was first described half a century ago by Dietrich Braess for traffic networks Braess1968 ; braess2005paradox ; Kolata1990 ; Knoedel2013 and has since been termed Braess’ Paradox. The paradox has been analyzed for a variety of different systems, including traffic systems bittihn2020braess , automatons bittihn2016braess ; bittihn2018braess , mesoscopic electron transport pala2012transport , table top electric or mechanical systems Cohen1991 , metabolic networks motter2010improved , sports skinner2010price and microfluid flows case2019braess . Here, we use the term "Braess’ paradox" in the following sense: Braess’ paradox occurs when adding network capacity decreases network performance. The added network capacity can be a new line or an upgrade of an existing line. Meanwhile, the decreased performance manifests itself e.g. in terms of longer travel times (traffic), higher costs for participants (economics) or a higher load on specific parts of the network (flow) and thereby reduced stability. With Braess’ paradox arising in these diverse contexts and forms, we have to ask: How and when do we observe this (generalized) Braess’ paradox in power grid extensions? Can we develop tools to predict the occurrence of the paradox and understand it to guide operator decision?
Critically, Braess’ paradox has been discussed and predicted in both DC and AC power systems Cohen1991 ; Witthaut2012 ; Witthaut2013 ; Fazlyaba2015 ; nagurney2016observation ; Coletta2016 ; motter2018antagonistic . However, most of these studies have been purely theoretical. The few experimental studies that investigated Braess’ paradox used table-top settings and were constricted to small-scale, either DC or single-phase AC electric circuits. In particular, the paradox has not yet been identified or demonstrated in any large-scale real-world systems. Furthermore, a systematic understanding of when and how Braess’ paradox emerges in power systems is still needed.
In this article, we demonstrate that and analyze how Braess’ paradox emerges in real-world electric power grids ranging from simple demonstrations to simulations based on real-world settings. We first experimentally demonstrate the paradox in the laboratory in 3-phase AC networks of synchronous and virtual-synchronous machines, offering a direct analogy to those in full-scale power grids. Second, we develop an effective topological indicator to predict edges that exhibit Braessian flow changes. Third, we analyze the potential impact of Braess’ paradox on the planned extension of continental power transmission grids. In particular, we identify Braessian edges in planned extension scenarios, highlighting the mutual impact of extensions planned by two European transmission system operators. For the full-scale German high-voltage grid, we employ a detailed model including unit commitment and power flow studies, as also used by grid operators 50Hertz2012 , to elucidate the core structural features that determine the uncovered Braessian responses to structural changes, going beyond the insights provided by common, purely numerical flow simulations. These results highlight Braess’ Paradox as a prime example of a collective phenomenon required to be respected in temporally faithful and system-wide planning of grid extensions and for reliable grid operations.
Results
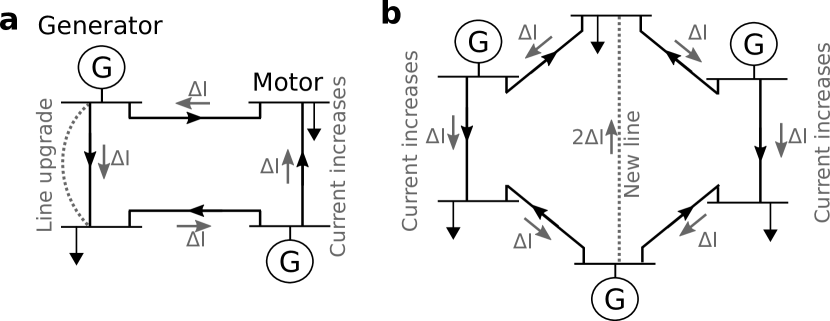
Braess’ paradox, as theoretically predicted for power systems Cohen1991 ; Witthaut2012 ; Witthaut2013 ; Fazlyaba2015 ; Nagurney2016 ; Coletta2016 may emerge due to either upgrading existing lines or adding new lines, see Fig. 1: Upgrading (Fig. 1a) one line leads to a change of the current flowing across every edge. If this additional flow is aligned with the original flow on the line, the line loading increases and the upgrade potentially causes an overload and line shutdowns. A similar behavior is observed when adding a new line (Fig. 1b), where again existing lines are subject to increasing current, see also Supplementary Note 4 for more details.
In the following, we address three joint questions about Braess’ paradox for power grids that so far remained unanswered. First, is Braess paradox observable in laboratory scale experiments with realistic parameters and in systems with synchronous and virtual machines as present in real grids? Second, how can we understand, effectively predict and potentially prevent the occurrence of Braess paradox in power grids? Third, are current large-scale power grids and their already planned extensions susceptible to Braess’ paradox?
Experimental demonstration of Braess’ paradox
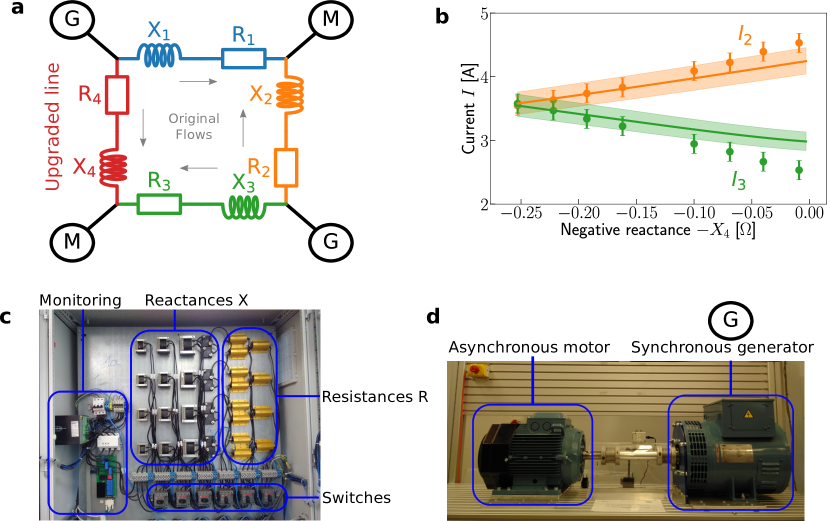
We experimentally demonstrate the existence and fundamental properties of Braess’ paradox in AC electric power grids in a laboratory scale platform. The test grid is constructed out of two physical synchronous generators (Fig. 2a), as they are used in many power plants today Machowski2011 , and two inverter-based nodes that mimic synchronous machines. Inverter-based solutions, such as virtual synchronous machines (VISMA) Beck2007 ; hesse2007virtuelle ; pelczar2012mobile ; DArco2013 ; chen2016virtuelle ; schwake2019 are expected to play an increasingly important role in the near future Carrasco2006 ; Liserre2010 . We remark that the synchronous generator is excited by an asynchronous motor, replacing, e.g., a steam-driven turbine that would drive the generator in conventional power plants. Braess’ paradox was induced by changing the topology of the test grid using variable reactances and resistances, see Fig. 2b. In particular, we reduced the reactance from initially to , increasing the susceptance and thereby upgrading line 4, by enabling additional flow through it, see Fig. 2c.
In contrast to naive intuition, upgrading a transmission line may not only upgrade but can equally downgrade the system functionality. In the example laboratory setting, upgrading transmission line 4 increases the maximal load in the system: The grid extension decreases the load on the adjoining line 3 (green) but increases the load on transmission line 2, which is farther away. We consistently observe this response behavior the laboratory experiment and theoretical estimates confirm this finding, a version of Braess’ paradox, see Fig. 2. Since line 2 is not reinforced, the relative loading of this line as well as the dissipated electric power increases. A local increase of the load or dissipation can bring a transmission line to a critical state where it becomes prone to overheating or tripping, eventually threatening the operability of the entire network. We did not test for complete failure experimentally as this would destroy laboratory equipment. Additional experimental and computational results for parallel lines, for a 6-node network and details on the synchronous machines are described in Supplementary Notes 1, 2 and 4.
These experiments further highlight the basic mechanism causing Braess’ paradox in AC power grids and underlines the importance of the structure of a network’s interactions and supply-demand distribution. Reinforcing one line increases its current and real-power flow, but also affects the flows on all other lines. With power injections at the nodes staying constant, the conservation of energy demands that the additional flow on the reinforced line is inducing a cycle flow, as demonstrated in Fig. 1. This additional cycle flow is necessarily aligned with the initial flow on the reinforced line. The flow changes on all other lines depending on their direction relative to the induced cycle flow. We use this idea of alignment and anti-alignment to define a predictor for Braessian edges in the next section.
We remark that our experimental 4-node system is among the simplest settings to demonstrate Braess’ paradox and hence the paradoxical result might seem intuitive to some experts: Our theoretical predictions correctly capture the increase in current, as observed in the experiment. This alignment of theory and experiment is necessary but not sufficient to understand Braess’ paradox. In larger networks more complex interactions will be at work and it will not be obvious whether an additional line is improving or deteriorating overall performance. In particular, moving beyond single loop networks, multiple cycle flows can be induced such that the current changes will no longer be symmetrical. Computing all currents for all scenarios for any network extension will reveal those scenarios that reduce overall performance but will not explain them. Before considering complex network extensions below, it is thus critical to have validated the basic principles at work in an experimental setup. Hence, the 4-node system discussed above serves as a comprehensible starting point, where experiment and theory readily align. In the following two sections, we build upon this starting point towards a general classification algorithm and more realistic application scenarios.
Flow alignment predicts Braess’ Paradox
How can we predict whether a line upgrade would cause Braess’ paradox, i.e. increase the load on other lines in larger networks? Although Braess’ paradox has been reported in a plethora of contexts Cohen1991 ; Witthaut2012 ; Coletta2016 ; Nagurney2016 , a topological understanding of which edges are likely to induce Braess’ paradox has proven elusive. Here, we demonstrate the first step towards bridging this gap.
We introduce a topological criterion that predicts how the modification of one edge affects the flow on another edge . This approach is applicable to any pair of edges, but we focus on the edge with the highest load for the time being. This reflects the fact that lines with the highest initial load are most vulnerable to overloads. We then categorize an edge as Braessian if increasing its capacity induces an increase of load at the maximally loaded edge.
Let an edge exhibit the maximal load in a network and let the flow be oriented from to . If the capacity of another edge , where the flow is oriented from to , is increased infinitesimally, the change in the flow is given by the edge-to-edge susceptibility Manik2016 . The edge is Braessian if and only if the flow change across the maximally loaded edge is in the same direction (aligned) as the original flow across , i.e. from to . Figuring out if this is the case is analogous to finding the direction of currents in a resistor network, see Supplementary Note 3 for details. In this analog of resistor networks and here specifically, we propose the following heuristic, inspired by the electric lemma, popularized by Shapiro shapirolemma ; kaiser_witthaut_2021 , connecting the currents in resistor networks with the numbers of spanning trees with certain properties in a network: Identify the shortest path from to that includes the edge . If comes before in this path, the infinitesimal flow change is directed from to , i.e. the flow change is aligned with the path.
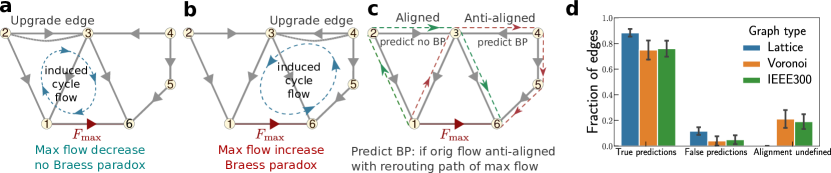
We visualize the idea of alignment in Fig. 3. If the initial flow is anti-aligned, i.e. opposite to the new cycle flow, the resulting flow decreases. (Fig. 3 a). Vice versa, if the flow is aligned, i.e., was originally in the same direction as the newly added cycle flow, the flow increases (Fig. 3b), causing Braess’ paradox. If the shortest cycle is not unique and instead there are different shortest cycles yielding opposite alignments, we say the alignment is undefined. We test this heuristic using extensive numerical simulations with the linearized power flow (DC) approximation. Please see also Supplementary Note 3 for details about the algorithmic implementation and the evaluation statistics. To obtain a comprehensive statistics, we consider the topology of an established test grid, a regular lattice structure, an ensemble of random planar networks generated by constructing the Voronoi tessalation of randomly placed nodes du1999centroidal as well as random power grid networks generated using the model developed in schultz_random , using homogeneous, i.e. unweighted lines. Furthermore, we enhance the statistics by sampling generation and demand randomly multiple times instead of using only one snapshot. As Fig. 3c illustrated, the proposed heuristic performs very well for all considered topologies. For the regular square lattices we observe a failure rate of , which gets slightly higher for the non-regular topologies, . We correctly classify of Braessian additions for square lattices and Voronoi tessalations, as well as for the other two topologies. For the remaining lines alignment is undefined. False predictions can be attributed to cases where several paths of similar length contribute to the rerouting process such that the shortest path is not always the dominant one. Furthermore, paths may interfere leading to surprising collective effects kaiser_witthaut_2021 .
We note that our topological approach is complementary to established numerical methods, improving our general understanding of the impacts and benefits of grid extensions. Power system analysis frequently uses the line outage distribution factors (LODFs), which predict the change of power flows after a line outage from a matrix algebraic computation Wood2013 . These distribution factors can be generalized to arbitrary changes of the grid parameters, including transmission line updates rahmani2016comprehensive ; ronellenfitsch2016dual . But still their computation relies on large-scale matrix algebra, thus restricting human insights. The electric lemma rigorously links the topological and the algebraic approach shapirolemma ; kaiser_witthaut_2021 , but is hard to use in practice. Our approach approximates this lemma and provides an easily applicable predictor as well as an intuitive mechanistic picture of flow rerouting.
Planned grid extension causing Braess’ paradox
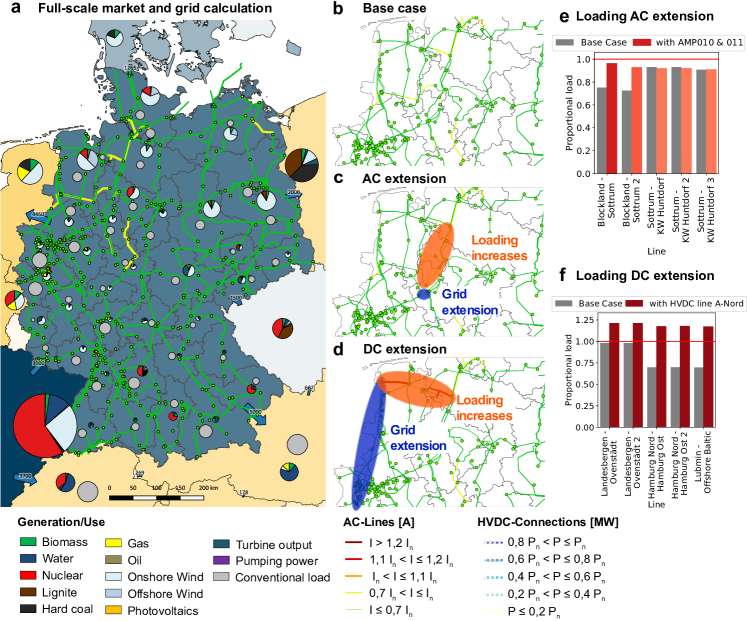
Braess’ paradox may be the rule rather than the exception as previous theory together with the mechanism underlying our heuristic predictor indicate. In particular, Braessian edges are by no means limited to laboratory scale experimental setups and, as we demonstrate in the following, indeed emerge in large scale AC power grids – even for currently ongoing extension projects. We analyze the German high voltage power grid, for which a detailed, governmentally approved extension plan exists: the Netzentwicklungsplan (NEP) 50Hertz2012 . To quantify the impact of grid extensions we employ a high quality grid operation and unit commitment model using scenario data for 2020 (see Methods for details). Figure 4 illustrates the emergence of Braessian edges as a consequence of planned grid extensions. The examples are illustrated for a peak wind scenario in autumn: the hour with the highest wind power injection which causes massive stress to the grid.
In particular, implementing two individual extensions induce Braess’ paradox in the German power grid. Both extensions are currently under construction in the grid of the transmission system operator (TSO) Amprion, one AC extension and one construction of a new HVDC link. Both measures relieve the grid in the Northwest of the Amprion grid (see Fig. 4b for the base case without extension), but increase loads in the Northeast where the grid of two TSOs, Amprion and Tennet, are interconnected: This effect constitutes a classic example of Braess’ paradox, which so far had not been identified in nation-wide grid extensions.
First, when implementing the AC extension projects AMP010 together with AMP011, both involving 380kV lines around the city of Gütersloh, flows increase in the entire corridor Landesbergen-Ruhrgebiet. But not all lines in the corridor are extended and may thus suffer Braess’ paradox. Notably, the remaining lines mostly belong to the TSO Tennet, not to Amprion, and no extensions are planned even at later stages, see Fig. 4c.
Second, the most expensive and momentous projects of the NEP are several new high-voltage DC (HVDC) lines connecting regions with high wind power generation in Northern Germany to the centers of the load. One of these projects, referred to as "corridor A", links the city of Emden at the Northern Sea with the Ruhr area (Fig. 4d). The installation of these lines leads to an immense overloading of the 220 kV AC line Emden-Conneforde, representing another classical example of Braess’ paradox: The AC-DC converter stations in Emden attract immense real power flows from the connecting AC lines, which cannot cope with the additional flow. In fact, the NEP foresees an extension of the line Emden-Conneforde to 380 kV. Braess’ paradox will be avoided if this measure is implemented first, compare, e.g. Witthaut2016 ; pesch2019 . But if it is delayed or fails, the entire HVDC link may become useless or even dangerous for grid operability.
Whereas extensive grid simulations that are thoroughly coordinated between two or more TSOs may in principle detect Braess paradox, we are unaware that Braess paradox has been reported to occur or considered to need active counteraction in this or any other national or international grid extension plan. Our findings thus highlight a particular threat emerging from the collective, system wide interactions of large scale extensions of high-voltage grids and point towards particular care required in the choice and coordinated planning of the location and temporal order of such extensions.
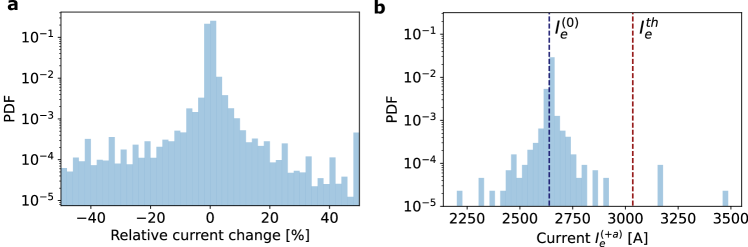
The overload scenarios following a grid enhancement occur regularly and are again explained by induced cycle flows. In analogy to the arguments presented in Fig. 3, an extension in the German grid, induces a cycle flow that, if aligned with the initial flow on the line, leads to an increased flow and potentially an overload, e.g. on the lines Blockland - Sottrum and Landesbergen - Ovenstädt for the AC and DC extensions respectively. To address the question how frequently such flows may increase in real grids, we determine the -criterion of a network: For a given line , we compare its original current with the current , which is the current on line when doubling the capacity of line . We consider this systematically for all lines in terms of their relative current change (Fig. 5a) as well as for one specific line, visualizing its absolute current (Fig. 5b). Enhancing a single line somewhere in the grid often leaves the current constant or induces only small changes (note the pronounced peak in the histograms at 0 relative current or at the initial current ). However, more severe effects are also observed, where the (relative) current changes substantially. Interestingly, these changes are almost evenly split between improving or worsening the grid performance, thus causing many edges to be Braessian in the sense of increasing load. Importantly, we also observe cases, where the current of our unaffected line may increase beyond the security threshold , making the network not -secure (Fig. 5b).
Discussion
In conclusion, we have demonstrated that Braess paradox plays a pivotal role for real power grids in several contexts. Specifically, our results on Braess’ paradox advance the field in several directions: Beyond the original predictions for traffic flow Braess1968 ; braess2005paradox and a range of works on power grids and electrical circuits both theoretically Witthaut2012 ; Witthaut2013 ; Fazlyaba2015 ; Nagurney2016 ; Coletta2016 ; tchuisseu2018curing and in small-scale table-top experiments Cohen1991 ; Nagurney2016 . We demonstrated that Braess’ paradox also robustly emerges in real-world electrical supply networks. In particular, we have shown that Braess’ paradox emerges in laboratory grids involving synchronous machines and virtual synchronous machines settings as well as in planned and ongoing grid extension projects affecting national and potentially continental size grids.
An interesting question arising here is: How often do these Braessian effects already occur in real transmission grids and how do they affect the operational state? We note that the coupling of two busbars at Landesbergen transformer station, i.e. the addition of a new connections to the grid, played a crucial role during the 2006 European power outage maas2007final . With the heuristic predictor presented here, we offer topological insights and intuition into how network changes may strengthen network performance and avoid unintentional damage. This could be of particular importance when decisions have to be made in short time and no extensive simulations are feasible.
The precise extent to which extension projects induce problems via Braess’ paradox is very difficult to gauge since not all extension plans are available to us. However, given the huge costs and long duration of grid extension projects, our finding strongly suggests to put an even larger emphasis on proper robust planning of extension projects, taking delays explicitly into account, including alternative or supportive extensions and considering in detail the resulting collective system response at each state of the extension, as otherwise costly control measures will become necessary to keep the synchronous state ashwin2003synchronization ; scholl2016control ; tchuisseu2018curing .
In addition to establishing the emergence of Braess’ paradox in relevant real grids, our results also offer a first tool for identifying and predicting Braess’ paradox in flow networks. Whereas our predictor is heuristic in nature and by construction cannot be error-free, such a simple predictor using flow alignment is readily applicable across a range of flow networks, for instance for microfluid flows case2019braess or traffic congestion acemoglu2018informational . We stress that the predictor allows identification and understanding of Braess’ paradox from topological intuition in terms of cycle flows. It may thereby guide which additional connections to consider and which ones to avoid.
The observation of Braess’ paradox both in a laboratory distribution and in a large-scale transmission system holds several important lessons for an effective planning of networked systems. First, a systemic integrated planning is necessary, taking into account collective network phenomena such as the emergence of Braessian edges, in particular along corridors of grid extensions. The instance of Braess’ paradox shown in Fig. 4b is rooted in the incomplete reinforcement of one corridor by only one of two TSOs. Second, a temporarily integrated planning is necessary. The delay of one planned measure can render another measure useless or even dangerous (cf. Fig. 4c) even if the final stage of expansion has been suitably designed. As delays commonly occur when realizing large-scale infrastructure measures, planning for them is essential, also from the perspective of robust grid operation. Third, the -criterion should be considered systematically when assessing robustness of transmission grids. The topological predictor presented here may serve as a simple and ready-to-use starting point to quickly assess these issues.
Our results also point to intriguing future research that could further explore potential benefits of the inverse of Braess’ paradox, i.e. how to improve the state of the grid by removing lines to reducing loads, e.g. during cascading failures schafer2018dynamically ; Yang2017small . Intentional shutdown of lines could thereby decrease the current on other lines and protect the function of the entire system. In this context, the structural similarity between our predictor and Line Outage Distribution Factors (LODFs) rahmani2016comprehensive ; ronellenfitsch2016dual could be further exploited to identify lines that need to be disconnected to maintain a stable state. First results on inverse Braess’ paradox stabilizing islanded grids have already been observed mureddu2016islanding . Moreover, the predictor could be developed further by including additional graph theoretical concepts and more complex computations. Furthermore, when deriving our predictor, we assumed infinitesimal line changes. A systematic study extending this to larger line modifications or line additions should be considered. Similarly, we chose to limit the scope of this present article to unweighted networks for the sake of clarity and brevity of presentation. That said, the notion of flow alignment is readily extendable to weighted networks by computing shortest paths based on edge weights.
Methods
Power-Flow computations
To compare the observed flows in the experiment with theoretical predictions but also when using the full market model, we compute flows by solving complex power flow equations. In particular, we use the textbook form, see e.g. Anderson2008 ; Kundur1994 ; Machowski2011 ; Wood2013 :
| (1) |
| (2) |
where is the real power, the reactive power, the voltage phase angle and the voltage amplitude at each node . The line parameters are given by and as the conductances and susceptances respectively. When using and , both sides of the equation use power in units of Watts.
In our experiment, we determined the line parameters as resistances and reactances . Then, we compute the entries of the nodal admittance for non-diagonal elements () as Anderson2008
| (3) |
with the imaginary unit . Finally, and have to be computed as
| (4) |
| (5) |
where and are the real and imaginary part of , respectively.
Simulation setup
Let us briefly review the power flow model used to analyze the effects of the Braess’ paradox in a realistic power grid. As can been seen in Fig. 4, we focus on the German transmission grid, but also include trans-border power flows with neighboring countries. Electricity generation and demand are derived from an European electricity market model. While we provide an overview here, further details on the modelling are provided in pesch2019 .
The European electricity market model includes the power dispatch planning on multiple time scales: Starting with a 1-year plan for the revisions of power plants, a day-ahead optimization is carried out to find the market oriented power generation and usage of flexibility options within Europe on an hourly scale. In this (mixed integer programming) optimization, we explicitly consider technical constraints, such as minimum and maximum power, power gradients of individual plants, start-up processes, minimum running times as well as power withhold for control reserve. Special attention is paid to an efficient modelling and solution of this optimization to include the large number of individual power plants, storage facilities and flexibility options existing in the European power system.
The transmission grid model is a representation of the German transmission system at the extra high and high voltage levels (110-380 kV), including equivalent circuits to model the lower voltage levels and surrounding grids. Data for the grid was made available by the German Federal Network Agency (Bundesnetzagentur). Crucially, data is not only available for the present state of the grid but also for several grid extension scenarios, including the addition of either HVDC or AC lines. The results of the simulation include not only power flows on all lines but also losses, all nodal voltages and currents, as well as the relative loading of all elements. Based on the domestic power dispatch and imports and exports, we can compute and visualize the loading of the grid with an hourly resolution for all possible extension scenarios.
Data availability
A sample trajectory from the experiment for one set of parameters is uploaded at https://osf.io/s9fk2/, including the necessary evaluation software. The grid model can unfortunately not be disclosed as it involves data protected by a non-disclosure agreement. All further data that support the results presented in the figures of this study are available from the authors upon reasonable request.
Code availability
Code to reproduce key results is available at https://osf.io/s9fk2/, as well as at self_Code_to_Reproduce .
References
References
- (1) Obama, B. H. Presidential policy directive 21: Critical infrastructure security and resilience. Washington, DC (2013).
- (2) Shaukat, N. et al. A survey on consumers empowerment, communication technologies, and renewable generation penetration within smart grid. Renewable and Sustainable Energy Reviews 81, 1453–1475 (2018).
- (3) Lepoutre, J., Perez, Y. & Petit, M. Energy transition and electromobility: A review. In The European Dimension of Germany’s Energy Transition, 509–525 (Springer, 2019).
- (4) Robinius, M. et al. Linking the power and transport sectors—part 1: The principle of sector coupling. Energies 10, 956 (2017).
- (5) Brown, T., Schlachtberger, D., Kies, A., Schramm, S. & Greiner, M. Synergies of sector coupling and transmission reinforcement in a cost-optimised, highly renewable european energy system. Energy 160, 720–739 (2018).
- (6) European Climate Foundation. Roadmap 2050 (2010). URL http://www.roadmap2050.eu/attachments/files/Volume1_fullreport_PressPack.pdf.
- (7) 50Hertz Transmission GmbH and Amprion and TenneT TSO and TransnetBW. Netzentwicklungplan Strom (2012). URL http://www.netzentwicklungsplan.de.
- (8) Fürsch, M. et al. The role of grid extensions in a cost-efficient transformation of the european electricity system until 2050. Applied Energy 104, 642–652 (2013).
- (9) Pesch, T., Allelein, H.-J. & Hake, J.-F. Impacts of the transformation of the german energy system on the transmission grid. The European Physical Journal Special Topics 223, 2561–2575 (2014).
- (10) Schlachtberger, D. P., Brown, T., Schramm, S. & Greiner, M. The benefits of cooperation in a highly renewable european electricity network. Energy 134, 469–481 (2017).
- (11) Braess, D. Über ein Paradoxon aus der Verkehrsplanung. Mathematical Methods of Operations Research 12, 258–268 (1968).
- (12) Braess, D., Nagurney, A. & Wakolbinger, T. On a paradox of traffic planning. Transportation science 39, 446–450 (2005).
- (13) Kolata, G. What if they closed 42d street and nobody noticed? The New York Times, URL: http://www.nytimes.com/1990/12/25/health/what-if-they-closed-42d-street-and-nobody-noticed.html (1990).
- (14) Knödel, W. Graphentheoretische Methoden und ihre Anwendungen, vol. 13 (Springer-Verlag, 2013).
- (15) Bittihn, S. & Schadschneider, A. Braess’ paradox in the age of traffic information. arXiv preprint arXiv:2009.02158 (2020).
- (16) Bittihn, S. & Schadschneider, A. Braess paradox in a network of totally asymmetric exclusion processes. Physical Review E 94, 062312 (2016).
- (17) Bittihn, S. & Schadschneider, A. Braess paradox in a network with stochastic dynamics and fixed strategies. Physica A: Statistical Mechanics and its Applications 507, 133–152 (2018).
- (18) Pala, M. G. et al. Transport inefficiency in branched-out mesoscopic networks: An analog of the braess paradox. Physical review letters 108, 076802 (2012).
- (19) Cohen, J. E. & Horowitz, P. Paradoxical behaviour of mechanical and electrical networks. Nature 352, 699 (1991).
- (20) Motter, A. E. Improved network performance via antagonism: from synthetic rescues to multi-drug combinations. Bioessays 32, 236–245 (2010).
- (21) Skinner, B. The price of anarchy in basketball. Journal of Quantitative Analysis in Sports 6 (2010).
- (22) Case, D. J., Liu, Y., Kiss, I. Z., Angilella, J.-R. & Motter, A. E. Braess’s paradox and programmable behaviour in microfluidic networks. Nature 1–6 (2019).
- (23) Witthaut, D. & Timme, M. Braess’s Paradox in Oscillator Networks, Desynchronization and Power Outage. New Journal of Physics 14, 083036 (2012).
- (24) Witthaut, D. & Timme, M. Nonlocal failures in complex supply networks by single link additions. The European Physical Journal B 86, 1–12 (2013).
- (25) Fazlyaba, M., Dörfler, F. & Preciadoa, V. M. Optimal network design for synchronization of kuramoto oscillators. arXiv preprint:1503.07254v2 (2015).
- (26) Nagurney, L. S. & Nagurney, A. Observation of the braess paradox in electric circuits. Europhysics Letters 115, 28004 (2016).
- (27) Coletta, T. & Jacquod, P. Linear stability and the braess paradox in coupled-oscillator networks and electric power grids. Physical Review E 93, 032222 (2016).
- (28) Motter, A. E. & Timme, M. Antagonistic phenomena in network dynamics. Annual Review of Condensed Matter Physics 9, 463–484 (2018).
- (29) Nagurney, L. S. & Nagurney, A. Physical proof of the occurrence of the braess paradox in electrical circuits. EPL (Europhysics Letters) 115, 28004 (2016).
- (30) Beck, H.-P. & Hesse, R. Virtual synchronous machine. In Electrical Power Quality and Utilisation, 2007. EPQU 2007. 9th International Conference on, 1–6 (IEEE, 2007).
- (31) Machowski, J., Bialek, J. & Bumby, J. Power System Dynamics: Stability and Control (John Wiley & Sons, 2011).
- (32) Hesse, R. Virtuelle Synchronmaschine (Papierflieger, Clausthal-Zellerfeld, 2007).
- (33) Pelczar, C. Mobile virtual synchronous machine for vehicle-to-grid applications (Cuvillier Verlag, Göttingen, 2012).
- (34) D’Arco, S. & Suul, J. A. Virtual synchronous machines and classification of implementations and analysis of equivalence to droop controllers for microgrids. In PowerTech (POWERTECH), 2013 IEEE Grenoble, 1–7 (IEEE, 2013).
- (35) Chen, Y. Virtuelle Synchronmaschine (VISMA) zur Erbringung von Systemdienstleistungen in verschiedenen Netzbetriebsarten (Cuvillier Verlag, Göttingen, 2016).
- (36) Schwake, B. Vierleiter-Umrichter mit aktiv moduliertem Neutralleiter zur Netzsymmetrierung (Cuvillier Verlag, Göttingen, 2019).
- (37) Carrasco, J. M. et al. Power-electronic systems for the grid integration of renewable energy sources: A survey. IEEE Transactions on industrial electronics 53, 1002–1016 (2006).
- (38) Liserre, M., Sauter, T. & Hung, J. Y. Future energy systems: Integrating renewable energy sources into the smart power grid through industrial electronics. IEEE industrial electronics magazine 4, 18–37 (2010).
- (39) Manik, D. et al. Network susceptibilities: Theory and applications. Physical Review E 95, 012319 (2017).
- (40) Shapiro, L. W. An electrical lemma. Mathematics Magazine 60, 36–38 (1987). URL https://doi.org/10.1080/0025570X.1987.11977274.
- (41) Kaiser, F. & Witthaut, D. Topological theory of resilience and failure spreading in flow networks. Phys. Rev. Research 3, 023161 (2021). URL https://link.aps.org/doi/10.1103/PhysRevResearch.3.023161.
- (42) Du, Q., Faber, V. & Gunzburger, M. Centroidal voronoi tessellations: Applications and algorithms. SIAM review 41, 637–676 (1999).
- (43) Schultz, P., Heitzig, J. & Kurths, J. A random growth model for power grids and other spatially embedded infrastructure networks. The European Physical Journal. Special Topics 223, 2593–2610 (2014).
- (44) Wood, A. J., Wollenberg, B. F. & Sheblé, G. B. Power Generation, Operation and Control (John Wiley & Sons, New York, 2013).
- (45) Rahmani, M., Kargarian, A. & Hug, G. Comprehensive power transfer distribution factor model for large-scale transmission expansion planning. IET Generation, Transmission & Distribution 10, 2981–2989 (2016).
- (46) Ronellenfitsch, H., Timme, M. & Witthaut, D. A dual method for computing power transfer distribution factors. IEEE Transactions on Power Systems 32, 1007–1015 (2016).
- (47) Witthaut, D., Rohden, M., Zhang, X., Hallerberg, S. & Timme, M. Critical links and nonlocal rerouting in complex supply networks. Physical Review Letters 116, 138701 (2016).
- (48) Manik, D., Witthaut, D. & Timme, M. Predicting braess’ paradox in supply and transport networks. arXiv preprint arXiv:2205.14685 (2022).
- (49) Manik, D. Dynamics of Complex Flow Networks. PhD dissertation, Georg-August-Universität Göttingen, freely available at http://hdl.handle.net/11858/00-1735-0000-002E-E573-8 (2019).
- (50) Pesch, T. Multiskalare Modellierung integrierter Energie- und Elektrizitätssysteme, vol. 485 of Schriften des Forschungszentrums Jülich. Energie Umwelt / Energy Environment (Verlag des Forschungszentrums Jülich, Jülich, 2019). URL http://publications.rwth-aachen.de/record/780996. Dissertation, RWTH Aachen University, 2019.
- (51) Tchuisseu, E. B. T. et al. Curing braess’ paradox by secondary control in power grids. New Journal of Physics 20, 083005 (2018).
- (52) Maas, G., Bial, M. & Fijalkowski, J. Final report-system disturbance on 4 november 2006. Union for the Coordination of Transmission of Electricity in Europe, Tech. Rep 1 (2007).
- (53) Ashwin, P. Synchronization from chaos. Nature 422, 384–385 (2003).
- (54) Schöll, E., Klapp, S. H. & Hövel, P. Control of self-organizing nonlinear systems (Springer, 2016).
- (55) Acemoglu, D., Makhdoumi, A., Malekian, A. & Ozdaglar, A. Informational braess’ paradox: The effect of information on traffic congestion. Operations Research 66, 893–917 (2018).
- (56) Schäfer, B., Witthaut, D., Timme, M. & Latora, V. Dynamically induced cascading failures in power grids. Nature communications 9, 1–13 (2018).
- (57) Yang, Y., Nishikawa, T. & Motter, A. E. Small vulnerable sets determine large network cascades in power grids. Science 358, eaan3184 (2017).
- (58) Mureddu, M., Caldarelli, G., Damiano, A., Scala, A. & Meyer-Ortmanns, H. Islanding the power grid on the transmission level: less connections for more security. Scientific Reports 6, 1–11 (2016).
- (59) Anderson, P. M. & Fouad, A. A. Power System Control and Stability (John Wiley & Sons, 2008).
- (60) Kundur, P., Balu, N. J. & Lauby, M. G. Power system stability and control, vol. 7 (McGraw-hill New York, 1994).
- (61) Manik, D. Code to Reproduce Results on Braes Paradox in Electrical Power Grid Models (2022). URL https://doi.org/10.5281/zenodo.6363078.
Acknowledgements.
We gratefully acknowledge support from the Federal Ministry of Education and Research (BMBF grants no. 03SF0472 and 03EK3055) (B.S., D.W., M.T.), the Helmholtz Association (via the joint initiative “Energy System 2050 - A Contribution of the Research Field Energy” and the grant no. VH-NG-1025 and no. VH-NG-1727) (B.S., D.W.) and the German Science Foundation (DFG) by a grant toward the Cluster of Excellence “Center for Advancing Electronics Dresden” (cfaed) (B.S., M.T.). This project has received funding from the European Union’s Horizon 2020 research and innovation programme under the Marie Skłodowska-Curie grant agreement No 840825 (B.S.).Author contributions
B.S., T.P., D.M., J. G., G. L., H.-P. B., D.W. and M.T. conceived and designed the research. B.S., J. G., G. L. conducted the experiments and analyzed the experimental data. T.P. performed simulations on realistic grid settings. D.M., D.W. and M.T. provided theoretical results on the predictor. B.S. and M.T. provided theoretical results on upgrading transmission lines in the laboratory grid. All authors contributed to discussing and interpreting the results and writing the manuscript. Overall, B.S., T.P. and D.M. contributed equally, as did D.W. and M.T.
Competing interests
The authors declare no competing interests.