Emission line star catalogues post-Gaia DR3
Abstract
Aims. Gaia DR3 and further releases have the potential to identify and categorise new emission-line stars in the Galaxy. We perform a comprehensive validation of astrophysical parameters from Gaia DR3 with the spectroscopically estimated emission-line star parameters from LAMOST OBA emission catalogue.
Methods. We compare different astrophysical parameters provided by Gaia DR3 with those estimated using LAMOST spectra. By using a larger sample of emission-line stars, we perform a global polynomial and piece-wise linear fit to update the empirical relation to convert Gaia DR3 pseudo-equivalent width to observed equivalent width, after removing the weak emitters from the analysis.
Results. We find that the emission-line source classifications given by DR3 is in reasonable agreement with the classification from LAMOST OBA emission catalogue. The astrophysical parameters estimated by esphs module from Gaia DR3 provides a better estimate when compared to gspphot and gspspec. A second degree polynomial relation is provided along with piece-wise linear fit parameters for the equivalent width conversion. We notice that the LAMOST stars with weak H emission are not identified to be in emission from BP/RP spectra. This suggests that emission-line sources identified by Gaia DR3 is incomplete. In addition, Gaia DR3 provides valuable information about the binary and variable nature of a sample of emission-line stars.
Key Words.:
catalogues – stars: emission-line, Be – stars: variables: Herbig Ae/Be – methods: data analysis – techniques: spectroscopic1 Introduction
Emission-line stars (ELS) are a class of objects with emission lines, particularly H, at 6563 Å in the spectrum. They also exhibit physical processes such as stellar winds, jets or outflows, and/or mass accretion through the circumstellar disc. The hot ELS are classified mainly into main-sequence Classical Ae/Be (CAe/CBe; Rivinius et al., 2013) and pre main-sequence (PMS) Herbig Ae/Be (HAeBe; Waters & Waelkens, 1998) based on its evolutionary stage. Many large sky surveys such as 2MASS (Cutri et al., 2003), WISE (Cutri et al., 2012), IPHAS (Drew et al., 2005), etc., have improved the ELS research by providing precise photometric measurements which are used to classify the ELS into various categories (Koenig & Leisawitz, 2014; Witham et al., 2008).
The Gaia Data Release 3 (Gaia DR3) catalogue represents a substantial advance in Galactic stellar astronomy. Gaia DR3 (Gaia Collaboration et al., 2021) builds on previous releases by improving the quality of previously released data and introducing entirely new data products, such as mean dispersed BP/RP spectra from spectro-photometry and radial velocity spectra (RVS), in addition to their integrated photometry in , , and the white light G-band published in Gaia EDR3 (De Angeli et al., 2022). Gaia BP/RP and/or RVS spectra is now available for sources with G ¡ 19 mag, and astrophysical parameters for sources with G ¡ 17.6 mag.
The previous Gaia releases played a pivotal role in identifying and studying new populations of ELS in the Galaxy. Some notable examples are the selection of 11,000 high confidence PMS from Sco OB2 association (Damiani et al., 2019), and understanding the dynamics of young stellar objects (YSOs) in the Vela OB association (Cantat-Gaudin et al., 2019). The Spitzer/IRAC Candidate YSO (SPICY) catalogue was compiled from the YSO candidates identified using the high-quality astrometric data from Gaia EDR3 along the Galactic midplane (Kuhn et al., 2022). More homogeneous studies on the stellar parameters of YSOs were carried out by Arun et al. (2019) and Wichittanakom et al. (2020) using Gaia DR2, and Guzmán-Díaz et al. (2021) and Vioque et al. (2022) using Gaia EDR3. Even though Gaia has extensively improved stellar parameters of the previously known ELS in the Milky Way, the unavailability of H emission measurements for the Gaia sources hindered the classification of more ELS.
The Large sky Area Multi-Object fibre Spectroscopic Telescope (LAMOST) has observed and catalogued 10,431,197 spectra of astronomical sources in their latest DR7 data release. Due to the availability of such a large database of spectra, the number of newly identified ELS has improved. Hou et al. (2016) identified 10,436 early-type ELS using LAMOST DR2 and studied various H profiles. Shridharan et al. (2021, hereafter, called as LEMC) compiled a catalogue of 3339 hot ELS from 451,695 O, B, and A-type spectra from the LAMOST DR5 release. After careful spectral type re-estimation, they reported 1088 CBe, 233 CAe, and 56 HAeBe stars based on the analysis of optical/IR magnitudes and colours. This makes it one of the largest homogeneous ELS catalogue with a thorough classification using spectroscopy and available photometry. More recently, Zhang et al. (2022) identified 25,886 early-type ELS from LAMOST DR7. Even though the number of ELS objects increased with such large spectroscopic surveys, they cannot be classified accurately unless astrometric and photometric data are available. Hence, the field of ELS improves when the large spectroscopic surveys and all-sky astrometric surveys progress in tandem. This is achieved by the recently released Gaia DR3 data which provides astrometric, photometric, and spectroscopic parameters for more than 200 million objects. There is no doubt that the DR4 and further releases will greatly improve the ELS research.
As the first step in this direction, we compare the new dataset released by Gaia DR3 with a previously existing, well-characterised spectroscopic catalogue. In this work, we aim to provide an external validation for the astrophysical parameters and to improve our ELS catalogue with newly available data from Gaia DR3.
2 Data analysis and Results
We use the 3339 ELS from LEMC and queried various DR3 tables using the source identifier from EDR3. The query was made using ADQL facility in the Gaia archive 111https://gea.esac.esa.int/archive/. We explore the different datasets that Gaia provides with its new release.
2.1 Classification and astrophysical parameters from Gaia DR3
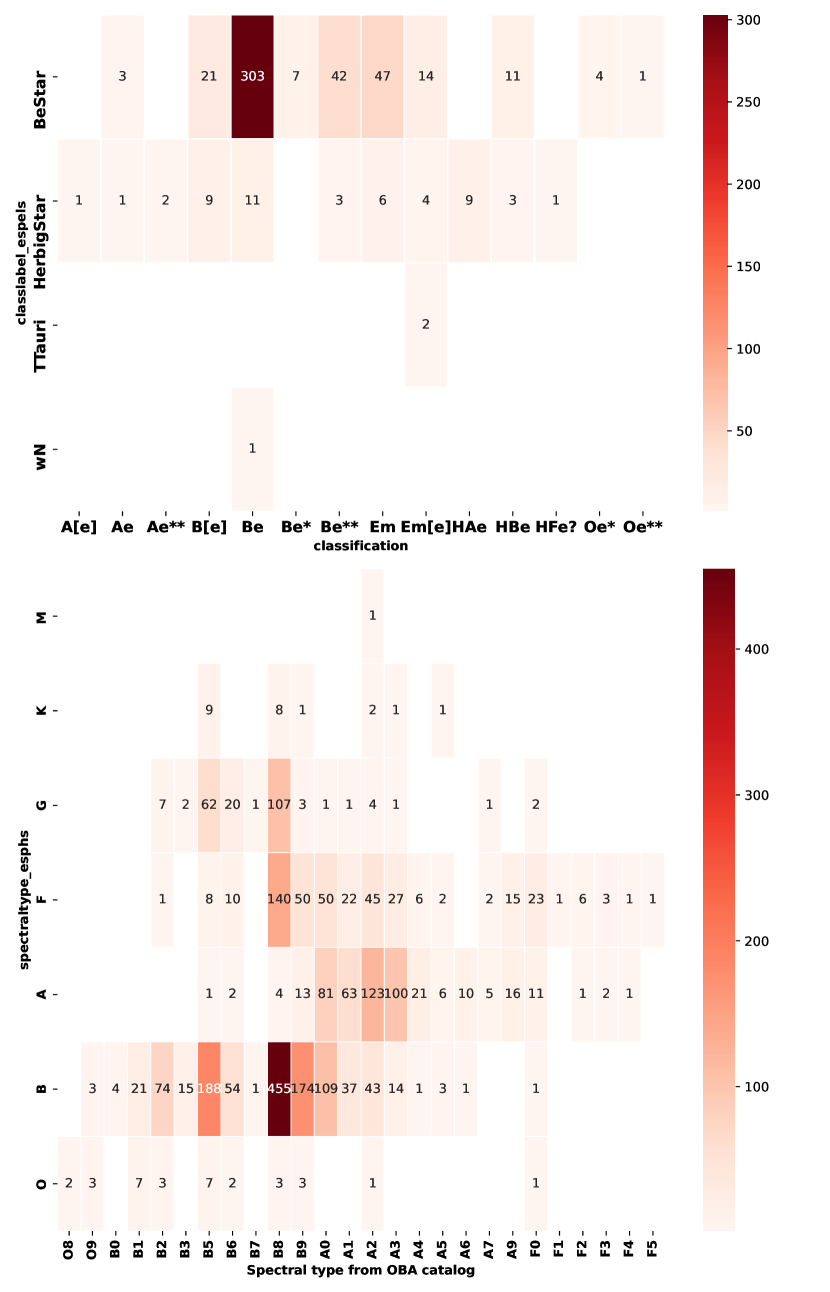
The gaiadr3.astrophysical_parameters table provides plenty of information using the BP/RP spectra, the details of which can be found in Fouesneau et al. (2022, hereafter APSIS-II). The comparison between the sub-classification of ELS reported in LEMC with the classification done using the ‘Extended Stellar Parametrizer for Emission-Line stars (ESP-ELS)’ module of Gaia DR3 (mentioned as classlabel_espels), for a sample of 506 stars, is shown as a heatmap in the top panel of Figure 1. The bottom panel of Figure 1 shows the heatmap of the spectral type comparison between 3109 ELS from LEMC with those estimated from the ‘Extended Stellar Parametrizer for Hot Stars (ESP-HS)’ module in Gaia DR3 (denoted as spectraltype_esphs).
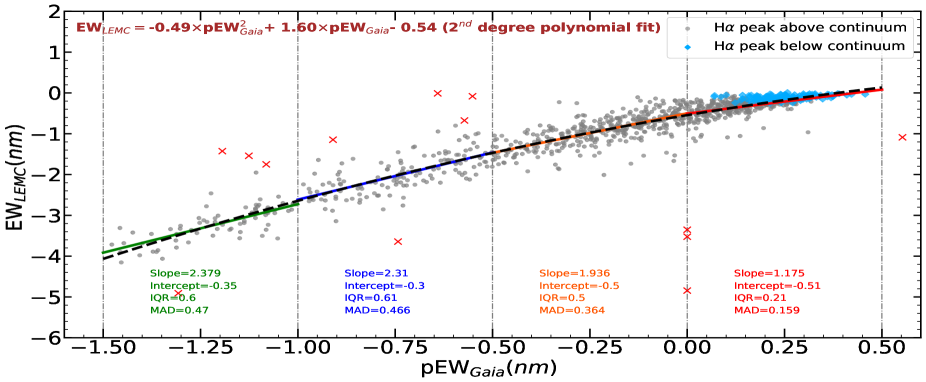
. Further, the piecewise fit within each interval is shown along with the fit parameters in corresponding colours. Negative EW values denote lines in emission.
From the figure (Figure 1; top panel), we see that the classification provided by LEMC and classlabel_espels DR3 matches well. Of 315 CBe stars with Gaia DR3 estimates, 303 (96 %) stars are classified as ‘BeStar’, 11 (4 %) stars as ‘HerbigStar’and 1 star as ‘wN ’by Gaia DR3. The quality of classlabel_espels classification is given by the classlabel_espels_flag, where classlabel_espels_flag ¡= 2 denotes a probability larger than 50%. Interestingly, the 11 stars which are classified as Herbig stars are having quality flag classlabel_espels_flag ¿= 4. For the 303 stars classified as ‘BeStar’, 155 stars have classlabel_espels_flag ¡= 2 and 148 have classlabel_espels_flag ¿ 2. The sub-sample of 89 stars with unclear classifications in LEMC (Be**, Be*, Em*) 222Be** = LEMC B-type star but no detection in Gaia EDR3
Be* = LEMC B-type star with Gaia EDR3 detection but not in 2MASS
Em* = H emission object for which spectral type could not be calculated
can now be classified as ‘Be Star’(83) and ‘Herbig Star’(6).
The bottom panel of Figure 1 shows the comparison between the spectral type given in LEMC and those estimated by Gaia DR3, spectraltype_esphs. It can be seen that stars with spectraltype_esphs=‘B’, the spectral type estimated are reasonably matching with LEMC spectral types ranging from O (¡1%), B0-B5 (25%), B5-B9 (57%) to A0-A5 (17%). However, the problem with spectraltype_esphs can be seen clearly when we consider the stars with LEMC spectral type B8 (767 stars). Of the 767 stars, 255 (33%) stars are classified by Gaia DR3 to be spectraltype_esphs=F/G/K. This is a very significant deviation from the accurate spectral type given in LEMC, which was performed through a semi-automated template matching technique. The deviation of 33% towards later spectral types should be kept in mind before using the spectraltype_esphs in future studies. A possible explanation for the observed deviation can be the line-of-sight extinction. The 33% of the B8 stars misclassified by Gaia DR3 as F/G/K have higher extinction values in both Green’s 3D dustmap (Green et al., 2019) and Gaia DR3 (AG-DR3), whereas the extinction value for the 59% of B8 stars classified to be B spectral type, is within 0-1 mag. Thus, higher the observed extinction value, higher the chances of Gaia DR3 spectral type estimation being different from the spectral type in LEMC.
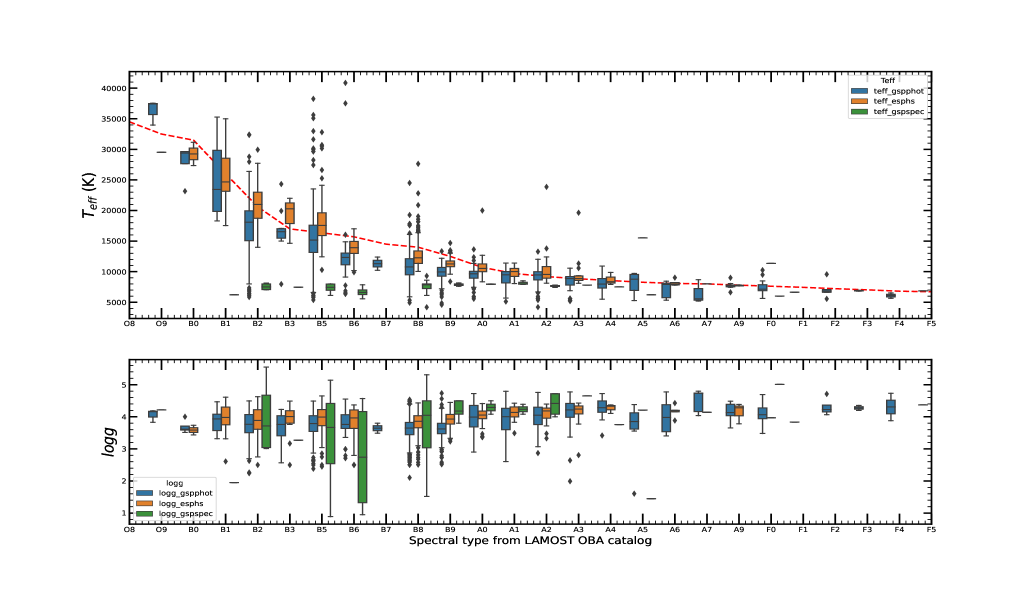
Gaia DR3 provides several astrophysical parameters such as , , sin, mass, radius and luminosity based on the BP/RP spectrum. For hot stars and ELS, they have used special modules to estimate these parameters. We compare all the different estimates with our spectral type to identify the best value for hot ELS. It should be noted that spectral type estimates from LEMC, although performed meticulously, have errors of about ±2 subtypes. Figure 2 shows the distribution of various and estimates of ELS available from Gaia DR3 with spectral type estimated in LEMC. It is very evident from Figure 2 (top) that for B-type stars, is significantly underestimated using RVS spectra (teff_gspspec). Two different modules were used to estimate using BP/RP spectra i.e., teff_gspphot and teff_esphs. Figure 2 (top) reveals that the teff_esphs value matches better when compared to from Pecaut & Mamajek (2013) calibration table and also, it has significantly lower inter-quartile range (IQR) when compared to teff_gspphot. We notice a large number of outliers in the teff_gspphot boxplot for each spectral type, which questions its validity. Hence it is clear from our analysis that teff_esphs provides an better estimate for B-type stars. In addition, there are other estimates available from modules such as teff_gspphot_marcs, teff_gspphot_ob and teff_gspphot_a in the gaiadr3.astrophysical_parameters_supp table. An appropriate model selection can be done based on the object of interest.
Similarly, Figure 2 (bottom) shows the distribution of values for a subsample of LEMC stars. The estimate from RVS spectra (logg_gspspec) shows a large scatter when compared to the estiamtes from BP/RP spectra i.e., logg_gspphot and logg_esphs, which are distributed in the range 3-4 dex. Since the LEMC sample contains mainly CBe and HAeBe stars, it is fair to expect to be within 3-5. Hence we conclude that, when compared to other modules used in Gaia DR3, the ESP-HS module provides accurate astrophysical parameters and can be used for the analysis of OBA stars. According to Frémat et al. (2022), the sin estimations from the vbroad module degrades noticeably at ¿ 7500 K and ¿ 10. Therefore, the sin would be highly inaccurate for our sample of hot ELS stars. Consequently, we did not include sin analysis in the present study.
2.2 Comparison of Gaia DR3 pEW with EW from LAMOST spectra
Gaia DR3 made available pseudo-equivalent width (pEW) measurements of H for about 235 million sources, which are given in Gaia DR3 astrophysical_parameters table as ew_espels_halpha parameter. The classification and the ELS catalogue provided by Gaia DR3 are dependent on this pEW calculation. However, due to the low resolution of BP/RP spectra, using pEW solely may not provide a complete list of ELS which can be identified from Gaia DR3. Hence it is important to calibrate pEW values with actual EW measurements carefully. APSIS-II provides an empirical relation between pEW and the EW values available from various ELS catalogues in the literature (Figure 21 and Table 3 of APSIS-II). They estimated the slope of the linear fit to be in the range of 2.26 and 2.83, which can be used to convert pEW to actual H EW.
We improve upon this analysis by performing a second degree polynomial fit to a large sample of 1088 CBe stars from LEMC. Even though we have a bigger sample of 3339 ELS, we do not attempt to make a fit with other classes to avoid problems like emission inside the absorption core (CAe stars; Anusha et al., 2021), the low number statistics (HAeBe) and the contamination from [NII] forbidden lines. We use the sample of 1088 CBe stars from LEMC for which the EW were measured homogeneously using IRAF (Anusha et al., in prep). Stars showing H emission peak inside the absorption core are shown (light blue diamonds) in Figure 3 and were not used in the analysis. We emphasise here that, Gaia DR3 identifies the H to be in emission only if the emission peak is above the local continuum. Thus, for B-type stars, Gaia DR3 can identify sources as ELS only if the observed EW is greater than 0.5 nm. For A-type stars, the threshold value will only increase, since the H absorption peaks at A0 spectral type (Gray & Corbally, 2009). Hence the catalogue of ELS provided by Gaia DR3 may not be complete with weak emitters, specifically those with emission peak inside the absorption core. This is a known caveat owing to the very low resolution of BP/RP spectra (Martayan et al., 2008). The second degree polynomial relation is shown in Equation 1.
| (1) |
Since we have larger sample of CBe stars when compared to Silaj et al. (2010) and Raddi et al. (2015), we also perform piece-wise linear fit in intervals of 0.5 nm. The slope and intercept of the linear fit along with IQR () and median absolute deviation (MAD) along axis as a representative of the scatter is given for each interval range. A global polynomial fit and a piece-wise fit for different intervals of pEW values are shown in Figure 3. As seen from piece-wise linear fit values, the slope gets steeper as we move towards intense emitters. We suggest using the respective slopes and intercepts for calculating observed EWs from each pEW range for hot ELS (Figure 3). However, the users should be aware that the LAMOST and Gaia have obtained the spectra at different epochs; the scatter and deviation of some points can be attributed to intrinsic variability of some CBe stars that range in the orders of days to years (Mathew & Subramaniam, 2011; Cochetti et al., 2021). The addition of pEW measurement in DR3 will improve the sample of ELS and can serve as target list for future H ELS surveys.

2.3 Synthetic photometry from BP/RP spectra
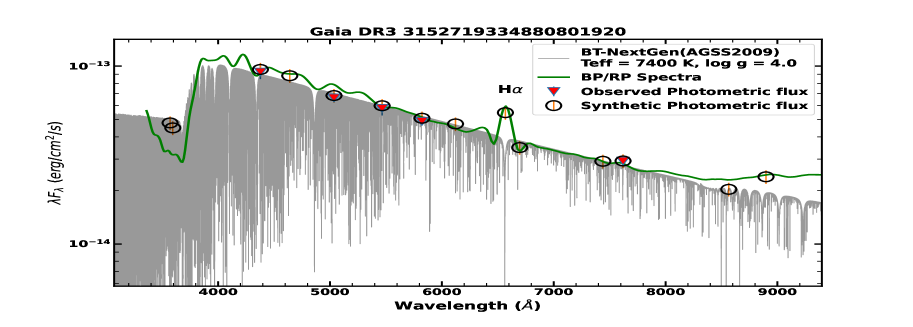
For 686 stars in the LEMC, we could not estimate the spectral type due to the low SNR in the bluer region of the LAMOST spectra. Due to the observation strategy of LAMOST DR5, the majority of our sample is towards the galactic anti-center direction (Figure 1 of Shridharan et al., 2021). Limited photometric survey footprints towards this region restricted us from studying these stars photometrically or using SEDs to estimate their stellar parameters. For our sample of 3339 ELS, 2872 stars have continuous BP/RP spectra. The gaiaxpy package enables the user to calculate the synthetic magnitudes based on the continuous BP/RP spectra from DR3. We used the gaiaxpy package to generate Johnson, SDSS, PanSTARRS, and IPHAS photometric magnitudes for our sample of 2872 stars. To show the improvement of creating SED using BP/RP spectra, we present a representative SED which compares the data before and after incorporating Gaia DR3 data, in Figure 4. The SED is fitted with a Python routine used in Arun et al. (2021) and Bhattacharyya et al. (2022). We suggest that for sources with bad quality photometric measurements, synthetic photometry from BP/RP spectra can be used to improve the SED studies.
| DR3Name | LAMOST ID | Classification | nss_solution_type | Period | Inclination | Eccentricity | Center_of_mass_velocity |
|---|---|---|---|---|---|---|---|
| (days) | (degrees) | (km/s) | |||||
| 440218930776209664 | J030719.47+523014.2 | Be*-onlynir | SB1 | 47.53 | - | 0.182 | -57.457 |
| 2685047840736856448 | J212547.34-022251.2 | Ae*-onlynir | SB1 | 195.252 | - | 0.326 | -143.58 |
| 4549079418323779712 | J173714.72+160334.7 | F[e]? | SB1 | 8.55 | - | 0.4349 | -15.50 |
| 760463232938062464 | J112045.14+362535.6 | Ae | SB1 | 6.93 | - | 0.053 | 1.405 |
| 948585824160038912 | J072441.51+404013.1 | Be | SB1 | 8.20 | - | 0.077 | 9.46 |
| 666842467830419200 | J074942.34+153117.3 | Em | SB1 | 11.47 | - | 0.25765 | -13.58 |
| 277055356579399296 | J043023.15+550408.8 | Be*-onlynir | SB1 | 57.082 | - | 0.01306 | -20.97 |
| 2081810716132810368 | J200645.38+435107.9 | Em[e] | Orbital | 573.77 | - | 0.469 | - |
| 3441613167517590400 | J053943.43+265316.2 | Em[e] | EclipsingBinary | 1.48 | 77.59 | 0.0 | - |
| 3340108762301888256 | J054241.85+114343.3 | A[e] | EclipsingBinary | 0.876 | 72.08 | 0.0 | - |
2.4 Non-single stars and variable stars
One of the major improvements in Gaia DR3 is the classification of 813,687 stars as non-single stars with orbital binary solutions for 356,132 stars. Massive stars are known to have a binary companion or clustering around it (Chini et al., 2013). Hence, we use non-single stars catalogue to find the binary stars in our sample. Among our sample of ELS, only 10 have solutions in gaiadr3.nss_two_body_orbit which gives the parameters for spectroscopic and eclipsing binaries. They also provide mass_ratio, eccentricity, inclination, teff_ratio, which can be used to characterise binaries. The LAMOST ID along with the parameters from gaiadr3.nss_two_body_orbit is shown in Table 1.
Gaia DR3 classified a sample of its sources into different variable categories based on multi-epoch photometry. From LEMC, 363 stars are classified as variable stars in Gaia DR3. Epoch photometry of variable stars with good quality classification (best_class_score ¿ 0.6) are shown in Figure 5. The cause of variability can also be related to the evolving nature of emission region and hence, a detailed analysis of these stars will be taken up in a future work.
3 Summary
The newly released Gaia DR3 data will accelerate the field of astronomy as it provides astrophysical parameters for 470,759,263 sources using the mean BP/RP spectra. In that, 2,382,015 sources are classified as hot stars which can increase the number of known CBe and HAeBe stars. As a first step towards achieving this, we compared the astrophysical parameters provided by DR3 with carefully classified OBA-type ELS identified from LAMOST DR5.
We see that the ELS classification provided by Gaia DR3 as classlabel_elseps matches reasonably well with our LEMC catalogue. Gaia DR3 also provides new classification and spectral type estimate for stars classified as ‘Em’and ‘Em[e]’in LEMC catalogue. The mismatch between the spectral types provided by Gaia DR3 (spectraltype_esphs) and LEMC was evident on comparison. The spectraltype_esphs estimates should be used with caution along with quality flag provided. Gaia DR3 also provides from 3 different modules using both BP/RP spectra and RVS spectra. Based on our comparison of values with spectral types from LEMC catalogue, we see that teff_esphs values matches well with the theoretical values. The teff_gspspec values are severely underestimated for early B-type stars. Similarly, teff_gspphot estimate may not be reliable because of the scatter and high number of outliers. We conclude that, teff_esphs should be used as the estimate for early-type ELS.
We used the sample of 1088 CBe stars from LEMC to perform a global polynomial fit and piece-wise fit analysis to obtain a relation to convert pEW to the actual H EW. In cases where one needs a more accurate estimate of actual EW for a specific range of pEW, the piece-wise slope and intercept values can be used. It should be noted that the weak emitters (with emission peak inside the absorption core) in LEMC have positive pEW values in Gaia DR3. This directly implies the incompleteness of ELS catalogue provided by Gaia DR3.
We also checked for non-single stars and variable stars present in LEMC catalogue. Among our sample, 10 non-single stars with 7 of them classified as spectroscopic binaries for which various parameters are provided. From LEMC, 363 stars are classified as variables. These H emitting binaries and variable ELS will be studied in a future work.
To summarise, this work provides an account of how the data provided by the recent Gaia DR3 can improve the study of ELS. Along with photometry and astrometric measurements, the availability of BP/RP spectra for a large number of sources will increase the number of already known ELS. The astrophysical parameters estimated from the BP/RP and RVS spectra will help to study a large number of ELS with ease.
Acknowledgements.
We would like to thank the Science & Engineering Research Board (SERB), a statutory body of the Department of Science & Technology (DST), Government of India, for funding our research under grant number CRG/2019/005380. We thank the Center for Research, CHRIST (Deemed to be University), Bangalore, India, for funding our research under the grant number MRP DSC-1932. This work has made use of data from the European Space Agency (ESA) mission Gaia (https://www.cosmos.esa.int/gaia), processed by the Gaia Data Processing and Analysis Consortium (DPAC, https://www.cosmos.esa.int/web/gaia/dpac/consortium). Funding for the DPAC has been provided by national institutions, in particular the institutions participating in the Gaia Multilateral Agreement. Guoshoujing Telescope (the Large Sky Area Multi-Object Fiber Spectroscopic Telescope LAMOST) is a National Major Scientific Project built by the Chinese Academy of Sciences. Funding for the project has been provided by the National Development and Reform Commission. LAMOST is operated and managed by the National Astronomical Observatories, Chinese Academy of Sciences. We thank the SIMBAD database and the online VizieR library service for helping us with the literature survey and obtaining relevant data.References
- Anusha et al. (2021) Anusha, R., Mathew, B., Shridharan, B., et al. 2021, MNRAS, 501, 5927
- Arun et al. (2021) Arun, R., Mathew, B., Maheswar, G., et al. 2021, MNRAS, 507, 267
- Arun et al. (2019) Arun, R., Mathew, B., Manoj, P., et al. 2019, AJ, 157, 159
- Bhattacharyya et al. (2022) Bhattacharyya, S., Mathew, B., Ezhikode, S. H., et al. 2022, ApJ, 933, L34
- Cantat-Gaudin et al. (2019) Cantat-Gaudin, T., Jordi, C., Wright, N. J., et al. 2019, A&A, 626, A17
- Chini et al. (2013) Chini, R., Barr, A., Buda, L. S., et al. 2013, Central European Astrophysical Bulletin, 37, 295
- Cochetti et al. (2021) Cochetti, Y. R., Arias, M. L., Kraus, M., et al. 2021, Astronomy & Astrophysics, 647, A164
- Cutri et al. (2003) Cutri, R., Skrutskie, M., Van Dyk, S., et al. 2003, The IRSA 2MASS All-Sky Point Source Catalog
- Cutri et al. (2012) Cutri, R. et al. 2012, VizieR Online Data Catalog, II
- Damiani et al. (2019) Damiani, F., Prisinzano, L., Pillitteri, I., Micela, G., & Sciortino, S. 2019, A&A, 623, A112
- De Angeli et al. (2022) De Angeli, F., Weiler, M., Montegriffo, P., et al. 2022, arXiv e-prints, arXiv:2206.06143
- Drew et al. (2005) Drew, J. E., Greimel, R., Irwin, M. J., et al. 2005, Monthly Notices of the Royal Astronomical Society, 362, 753
- Eyer et al. (2022) Eyer, L., Audard, M., Holl, B., et al. 2022, arXiv e-prints, arXiv:2206.06416
- Fouesneau et al. (2022) Fouesneau, M., Frémat, Y., Andrae, R., et al. 2022, arXiv e-prints, arXiv:2206.05992
- Frémat et al. (2022) Frémat, Y., Royer, F., Marchal, O., et al. 2022, arXiv e-prints, arXiv:2206.10986
- Gaia Collaboration et al. (2021) Gaia Collaboration, Brown, A. G. A., Vallenari, A., et al. 2021, A&A, 649, A1
- Gray & Corbally (2009) Gray, R. O. & Corbally, Christopher, J. 2009, Stellar Spectral Classification
- Green et al. (2019) Green, G. M., Schlafly, E., Zucker, C., Speagle, J. S., & Finkbeiner, D. 2019, The Astrophysical Journal, 887, 93
- Guzmán-Díaz et al. (2021) Guzmán-Díaz, J., Mendigutía, I., Montesinos, B., et al. 2021, A&A, 650, A182
- Hou et al. (2016) Hou, W., Luo, A. L., Hu, J.-Y., et al. 2016, Research in Astronomy and Astrophysics, 16, 138
- Koenig & Leisawitz (2014) Koenig, X. & Leisawitz, D. 2014, The Astrophysical Journal, 791, 131
- Kuhn et al. (2022) Kuhn, M. A., Saber, R., Povich, M. S., et al. 2022, arXiv e-prints, arXiv:2206.04090
- Martayan et al. (2008) Martayan, C., Frémat, Y., Blomme, R., et al. 2008, in SF2A-2008, ed. C. Charbonnel, F. Combes, & R. Samadi, 499
- Mathew & Subramaniam (2011) Mathew, B. & Subramaniam, A. 2011, Bulletin of the Astronomical Society of India, 39, 517
- Pecaut & Mamajek (2013) Pecaut, M. J. & Mamajek, E. E. 2013, ApJS, 208, 9
- Raddi et al. (2015) Raddi, R., Drew, J., Steeghs, D., et al. 2015, Monthly Notices of the Royal Astronomical Society, 446, 274
- Rivinius et al. (2013) Rivinius, T., Carciofi, A. C., & Martayan, C. 2013, The Astronomy and Astrophysics Review, 21, 1
- Shridharan et al. (2021) Shridharan, B., Mathew, B., Nidhi, S., et al. 2021, Research in Astronomy and Astrophysics, 21, 288
- Silaj et al. (2010) Silaj, J., Jones, C., Tycner, C., Sigut, T., & Smith, A. 2010, The Astrophysical Journal Supplement Series, 187, 228
- Vioque et al. (2022) Vioque, M., Oudmaijer, R. D., Wichittanakom, C., et al. 2022, ApJ, 930, 39
- Waters & Waelkens (1998) Waters, L. B. F. M. & Waelkens, C. 1998, ARA&A, 36, 233
- Wichittanakom et al. (2020) Wichittanakom, C., Oudmaijer, R. D., Fairlamb, J. R., et al. 2020, MNRAS, 493, 234
- Witham et al. (2008) Witham, A., Knigge, C., Drew, J., et al. 2008, Monthly Notices of the Royal Astronomical Society, 384, 1277
- Zhang et al. (2022) Zhang, Y.-J., Hou, W., Luo, A. L., et al. 2022, ApJS, 259, 38