Two-dimensional Particle-in-Cell simulations of axisymmetric black hole magnetospheres: angular dependence of the Blandford-Znajek flux
Abstract
We examine the temporary evolution of axisymmetric magnetospheres around rapidly rotating black holes (BHs), by applying our two-dimensional particle-in-cell simulation code. Assuming a stellar-mass BH, we find that the created pairs fail to screen the electric field along the magnetic field, provided that the mass accretion rate is much small compared to the Eddington limit. Magnetic islands are created by reconnection near the equator and migrate toward the event horizon, expelling magnetic flux tubes from the BH vicinity during a large fraction of time. When the magnetic islands stick to the horizon due to redshift and virtually vanish, a strong magnetic field penetrates the horizon, enabling efficient extraction of energy from the BH. During this flaring phase, a BH gap appears around the inner light surface with a strong meridional return current toward the equator within the ergosphere. If the mass accretion rate is 0.025 percent of the Eddington limit, the BH’s spin-down luminosity becomes 16-19 times greater than its analytical estimate during the flares, although its long-term average is only 6 percent of it. We demonstrate that the extracted energy flux concentrates along the magnetic field lines threading the horizon in the middle latitudes. It is implied that this meridional concentration of the Poynting flux may result in the formation of limb-brightened jets from low-accreting BH systems.
1 Introduction
The study of nonthermal plasmas in the vicinity of black holes (BHs) is astrophysically interesting in the context of collimated relativistic outflows observed from microquasars and active galactic nuclei. Such relativistic outflows, a.k.a. jets, are believed to be energized by rapidly rotating BHs that are immersed in a globally ordered magnetic field. In particular, when magnetic field () lines thread the event horizon, an electromotive force (EMF) is produced across the field lines in the same way as an unipolar inductor. In the direct vicinity of the horizon, this EMF induces a meridional current , which exerts a counter torque on the BH via force (Blandford & Znajek, 1977; Koide et al., 2002; McKinney et al., 2012). If such a current forms a closed circuit in a global BH magnetosphere, the extracted BH’s rotational energy is carried away as the Poynting flux to be dissipated at some electric load located at large distances, e.g., as synchrotron emissions in the jet downstream.
In the case of low-luminosity radio galaxies, their flat spectrum radio emission with high brightness temperature is interpreted to originate in a synchrotron-emitting jet (Jones et al., 1974a, b; Blandford & Königl, 1979; Marscher, 1983; Lobanov, 1998). In the case of BH binaries, their flat spectrum radio emission during a hard/quiescent state is also considered to be from a jet (Hjellming & Johnston, 1988; Stirling et al., 2001; Dhawan et al., 2000; Fender et al., 2004; Gallo et al., 2005). In such low accreting systems, their small plasma density results in a negligible turbulent diffusion, which prevents equatorial accretion to enter the jet-launching, polar regions in which horizon-penetrating magnetic field lines reside.
Although it is difficult to replenish jet materials by accretion in this way, photon-photon pair production is considered to be a viable mechanism as the source of jet plasmas. Gap models envisage large-scale regions in which a magnetic-field-aligned electric field accelerates charged leptons into ultra-relativistic energies, leading to a pair-production cascade of the gap-emitted -rays in a target, soft photon field (Beskin et al., 1992; Hirotani & Okamoto, 1998; Levinson, 2000; Levinson & Rieger, 2011; Ptitsyna & Neronov, 2016; Hirotani et al., 2016, 2017; Levinson & Segev, 2017; Hirotani et al., 2018; Ford et al., 2018; Katsoulakos & Rieger, 2020). Drizzle models, on the other hand, consider near-horizon, transient and small scale regions in which high-energy component of electrons produce MeV photons, which collide each other to produce pairs (Mościbrodzka et al., 2011; Wong et al., 2021). In the present paper, we focus on the former model, considering a jet-launching, low-accreting BH systems, which are realized in the center of low-luminosity radio galaxies or BH binaries in a hard/quiescent state.
When a BH is accreting at a highly sub-Eddington rate, such as in the case of M87* or BH binaries in a hard/quiescent state, plasmas become highly collisionless, which makes it impossible to justify the magnetohydrodynamic (MHD) approximations in the jet-launching regions (Hirotani et al., 2021, hereafter Paper I). Instead, kinetic method, or the particle-in-cell (PIC) method becomes appropriate (e.g., Nishikawa et al. (2021) for a recent review).
Assuming that the gap local physics does not affect the global structure, such as the magnetospheric currents, one-dimensional general relativistic PIC (GRPIC) simulations were performed by Levinson & Cerutti (2018); Chen & Yuan (2020); Kisaka et al. (2020). They consistently solved the radiative-transfer equation (or at least treated the inverse-Compton scatterings and pair production in a realistic way in the last case), together with the motion of the created pairs and the evolution of the electromagnetic fields.
To incorporate the back reaction on the global magnetosphere, however, we should proceed to two-dimensional (2D) cases. In this context, Parfrey et al. (2019) first performed 2D GRPIC simulations of BH magnetospheres, assuming the pair injection rate is proportional to the strength of acceleration electric field, instead of solving the radiative transfer equation. Adopting an extremely small magnetic field strength, they demonstrated that the Penrose process contributes to the extraction of energy from a maximally rotating BH. Subsequently, Crinquand et al. (2020) examined 2D GRPIC simulations, solving the radiative transfer equation, and assuming a fixed monopole magnetic field, which is, indeed, appropriate in a time-averaged sense in the horizon vicinity. They showed that the BH’s rotational energy can be electromagnetically extracted via the Blandford-Znajek (BZ) process, and that a highly time-dependent spark gap opens near the inner light surface. In addition, Crinquand et al. (2021) coupled their 2D GRPIC code with a raytracing algorithm by post processing, and examined synthetic -ray light curves of the gap activity. Moreover, Bransgrove et al. (2021) applied 2D GRPIC and 3D MHD methods to a stellar-mass BH which is collapsing from a neutron star surrounded by plasma, and demonstrated that the ‘no hair’ theorem holds in the sense that the stress-energy tensor decays exponentially in time.
In addition to these works, in Paper I, we applied our 2D GRPIC code to stellar-mass BHs, without solving the radiative transfer equation. When solving the Maxwell equations, we solved only three components of the electromagnetic fields, namely the radial and meridional components of the electric field and the toroidal component of the magnetic field. Assuming a radial magnetic-field geometry near the BH, we demonstrated that the BH’s rotational energy is preferentially extracted along the magnetic field lines threading the event horizon in the middle latitudes, namely between and (or and ) from the rotation axis.
Developing the 2D GRPIC method adopted in Paper I, we solve all the six components of the electromagnetic fields in the present paper. In the next section, we describe the basic equations in our GRPIC scheme. Then in § 3, we show that the main conclusion of Paper I – the middle-latitude concentration of the BZ flux – also holds when we solve all the six electromagnetic-field components, and demonstrate that the force-free approximation breaks down when plasmas are less efficiently supplied in the magnetosphere. We finally discuss an implication on the formation of a limb-brightened jet in § 5.
2 The particle-in-cell (PIC) scheme
We formulate our axisymmetric, 2D GR PIC method in this section.
2.1 Background geometry
Around a rotating, non-charged BH, the background geometry is described by the Kerr metric (Bardeen, 1970). In the Boyer-Lindquist coordinates (Boyer & Lindquist, 1967), the line element can be expressed as
| (1) |
where
| (2) |
| (3) |
, , . In equations (1)–(3), we adopt the geometrized unit, putting , where and denote the speed of light and the gravitational constant, The horizon radius, , is obtained by , where corresponds to the gravitational radius. The spin parameter becomes for a maximally rotating BH, and for a non-rotating BH.
To avoid singular behaviours at (i.e., at the poles) due to the differential operator in the Maxwell equations, we introduce a new meridional variable, . Adopting this coordinate, we obtain
| (4) |
Here, (or ) corresponds to the rotational axis in the uuper (or lower) hemisphere, and denotes the equatorial plane.
In the radial direction, we adopt the so-called “tortoise coordinate” ,
| (5) |
In this coordinate, the event horizon corresponds to . Away from the BH (), it tends to the standard radial coordinate, .
2.2 Background electromagnetic fields
Throughout this paper, we assume that there exist stationary electromagnetic fields that are represented by the Wald solution (Wald, 1974), which is realized when a ring current flows on the equator at a large enough distance from the BH. The amplitude of the ring current determines the magnetic field strength, , near the BH. To specify , we use its equipartition value, , with the accreting plasmas. When accretion takes place as an advection-dominated accretion flow (ADAF) (Ichimaru, 1977; Narayan & Yi, 1994; Tchekhovskoy et al., 2011; Narayan et al., 2021), we obtain (Yuan & Narayan, 2014),
| (6) |
Here, the dimensionless accretion rate is defined by
| (7) |
where denotes the mass accretion rate. The Eddington accretion rate is defined by
| (8) |
where denotes the Eddington luminosity. We adopt the conversion efficiency .
In the present paper, we assume that the background, Wald solution has a field strength so that its meridional average at may match . Since our code cannot simulate a plasma containing protons, we do no solve the normal plasmas consisting an ADAF. Instead, as the footpoint of a pair-dominated jet (Reynolds et al., 1996; Wardle et al., 1998; Hirotani, 2005; Kino et al., 2014), we focus on the electron-positron pair plasmas that are created within the magnetosphere. Therefore, we use merely to specify (and hence near the BH), and to specify the pair-supply rate, (§ 2.6).
2.3 The Maxwell equations
In addition to the Wald solution described in the foregoing section, we consider additional electromagnetic fields produced by the electric currents flowing near the BH. Accordingly, the total electromagnetic fields are given by the superposition of the stationary Wald solution and these non-stationary fields. We describe how to solve the latter fields within our PIC scheme below.
When we solve the Maxwell equations, we should not solve for the Faraday tensor components that are defined in the Boyer-Lindquist coordinates, because numerical instabilities arise inside the ergosphere, in which a non-rotating observer becomes space-like. Instead, we can adopt a physical observer, such as the Zero-Angular-Momentum Observer (ZAMO) to avoid this ill behaviour. In this paper, instead of converting quantities into their ZAMO-measured values, we redefine the and components of the electric field such that
| (9) | |||||
| (10) |
where denotes a Faraday tensor component, and does the frame-dragging angular frequency. These transformations mimic the adoption of ZAMO; see also the arguments after equation (12) of Paper I for physical explanations of these variable transformations. In what follows, we put in equations for simplicity, and recover when appropriate.
Using these re-defined electric field (eqs. [9] & [10]), we find the following six time-dependent Maxwell equations:
| (11) |
| (12) |
| (13) | |||||
| (14) |
| (15) |
| (16) | |||||
where
| (17) |
| (18) |
| (19) |
and
| (20) |
if we recover for clarity. The electric currents are defined by
| (21) |
| (22) |
| (23) |
where the sigma symbol, , denotes a summation of the electric currents carried by all the particle crossing the area where we count the current, designates the number of macro particles in each subdomain, does the charge on the macro particle with identity number , and does the invariant three-dimensional volume of each cell around the grid point. The four-velocity components, , , , and satisfy the definition of the proper time, . Note that , , and are all dimensionless.
It is worth noting that solving equations (11)-(16) for the PIC fields, and (), is equivalent with solving the Maxwell equations for the total electromagnetic fields, because the Maxwell equations are linear, and hence additive. For instance, writing the total fields as a summation of the (stationary) Wald fields and the (time-dependent) PIC fields, we find that all the terms containing the Wald fields vanish. Namely, temporal derivatives of the Wald fields vanish by definition. The curl of the Wald electric field vanishes by the Faraday’s law. The curl of the Wald magnetic field vanishes by the Ampere’s law, because we impose a current-free condition when obtaining the Wald solution. Note that the required equatorial, ring current at a large enough radius comes into the Wald solution only through the outer boundary condition, not through the (electric-current) source terms.
Let us also describe how to construct the electric currents. We divide the particle motion into the poloidal and toroidal components, adopting the area weighting (Villasenor & Buneman, 1992) on the poloidal plane, and computing the toroidal component of the current from the azimuthal displacement of individual charged leptons, reflecting the area weighting. However, the area weighting in a curved spacetime results in an accumulation of small numerical errors in each time step, and eventually ends up with non-physical short-wavelength noise in the electromagnetic fields due to failure to satisfy the Gauss’s law. Therefore, in the present paper, we apply the Poisson correction to the electric field (e.g., Langdon & Lasinski, 1976).
Let us briefly describe the units used in the code. Electromagnetic field components , , , , , , are computed in the cgs gaussian unit. Note that all these six components are well-behaved at the horizon. The charge density is also measured in the cgs gaussian unit (i.e., ). The current components, , , and are in unit. The macro particle’s four-velocity components are dimensionless. Namely, denotes the ratio of the elapsed coordinate time and the proper time . Thus, became the Lorentz factor in the special relativistic limit. denotes the radial velocity in (not ) coordinate in basis, does the meridional angular velocity, and does the azimuthal angular velocity.
To solve these six Maxwell equations (eqs. [11]–[16]), we must impose boundary conditions. Along the northern and southern polar axes (i.e., at and ), we impose
| (24) |
At the outer boundary, we impose that the radial derivatives of , , , , , and vanish for simplicity. We tested several combinations of other radial boundary conditions, and confirmed that conclusions were unaffected.
At the inner boudary, we impose the “radiative boundary condition” so that the tangential components of the electromagnetic fields may look to a ZAMO like radiation propagating into the stretched horizon, or equivalently, all the components of the electromagnetic fields should be finite for a freely-falling observer (§ III C 4 of Thorne et al., 1986). In ZAMO’s orthonormal basis, this condition reads , which gives the following inner boundary conditions
| (25) |
in our current notation.
2.4 Initial conditions
We start the PIC simulation from
| (26) |
at time . Note that and () describe the nonstationary fields that are to be superposed on the stationary Wald fields. We assume that the densities of electrons and positrons are at , where the Goldreich-Julian number density is defined by
| (27) |
at each point. In each cell, we give 50 initial macro electrons and positrons (i.e., 100 in total) with equal charge weight, distributing their positions randomly in the cell. We assume that these macro particles are static on the poloidal plane and corotating with the space time at . That is, macro electrons and positrons are moving at the same toroidal velocity initially; accordingly, they do not carry any electric currents at .
2.5 Particle equation of motion
In a highly vacuum BH magnetosphere, charged leptons are deccelerated by the radiation-reaction forces. In the same manner as in Paper I, we include the radiation reaction force as a friction term in the equation of motion (EOM).
With such a friction term, the EOM can be expressed by (Chapter 17 of Jackson, 1962)
| (28) | |||||
where refers to the particle proper time, represents the absolute value of the charge on the electron, and does the mass of the electron.
Let us briefly describe the boundary conditions on the motion of electrons and positrons. Due to the symmetry, we assume that the particles moving across the polar axis (at or ) will be reflected toward the equator with opposite meridional velocity. Both the inner and outer boundaries are treated as particle sinks. Thus, when particles move across these two radial boundaries, they are excluded from the simulation.
2.6 Plasma supply
In BH magnetospheres, pairs can be supplied via two-photon and/or one-photon (i.e., magnetic) pair production processes. In the present paper, we focus on the former process, and consider the collisions of MeV photons emitted via Bremsstrahlung from an ADAF. The collision rate, or equivalently, the pair supply rate (pairs per second per volume) is given by
| (29) |
where denotes the total cross section of photon-photon pair production, and does the MeV photon density. Adopting the Newtonian self-similar ADAF model (Mahadevan, 1997), and assuming that the most energetic MeV photons are emitted within , we obtain (Paper I)
| (30) |
We randomly introduce a macro particle in each cell at every time step with probability ; that is, particles are injected in each cell at every time steps on average. In this case, each created macro positron or electron has the electric charge
| (31) |
where denotes the interval of each time step, and the invariant volume of each cell. Note that holds, where and denote the intervals in Boyer-Linquist radial and meridional coordinates. In the present paper, and coordinates are uniformly gridded; thus, both and are gridded non-uniformly.
As the PIC simulation proceeds, the number of macro particles increases with to saturate at a few hundred in each PIC cell on average. Here, the maximum value of the Courant number is set to be in and coordinates. In total, there are about macro particles in the entire simulation region.
To solve the temporal evolution of the electromagnetic fields and the particle distribution functions, we adopt a radial grid of 1200 uniform cells (in coordinate) between , and 1120 uniform cells (in coordinate) between , which corresponds to . It is noteworthy that the plasma skin depth can not be resolved at when the plasma density increases enough (particularly in the polar regions). Thus, we adopt only the results obtained in as the appropriate PIC solution, interpreting that the solution in merely gives the outer boundary condition at . Alternatively, we could set some outer boundary conditions on the electromagnetic fields and the particle injection rate at . Nevertheless, in the present paper, we infer the boundary conditions at by solving the magnetosphere also in . By this treatment, the boundary conditions on the electromagnetic fields at little affect the solution in . On the other hand, inward particle flux at do depend on the condition imposed on the particle injection rate at . Thus, we assume no particle injection across , although particles freely escape outward across . Since the pair production rate rapidly decreases with radius (eq. [30]), particle inward flux at is little affected by the outer boundary position, as long as it is located at .
We adopt the cgs Gaussian unit in the code. Thus, in the Maxwell equations (11)–(16), we measure the electric field () in , and the magentic field in gauss. Time and spatial variables are in dimensionless unit. For instance, is measured in , and is in ; is dimensionless by definition. In the particle equations of motion (28), the four velocity is measured in , and the proper time in .
It is checked a posteriori that the invariant grid intervals resolve the skin depth
| (32) |
at every point at any elapsed time, where the plasma frequency is computed by the plasma density and its mean Lorentz factor as (Levinson & Cerutti, 2018)
| (33) |
In addition, we adopt a heavy electron mass of . Partly because we adopt this heavy electron/positron mass, and mainly because the leptons are ultra-relativistic (), and because the plasma density is very small (), the plasma skin depth, , is resolved by the current grid intervals for stellar-mass BHs (§ 5.1).
3 Nonstationary magnetosphere
In this section, we apply the PIC method to a rapidly rotating stellar-mass BH with spin and mass . We adopt a small mass accretion rate throughout this paper. In what follows, electromagnetic fields mean the total fields that are obtained by superposing the stationary Wald fields and the nonstationary PIC fields, unless explicitly mentioned to distinguish them.
3.1 Initial electromagnetic fields
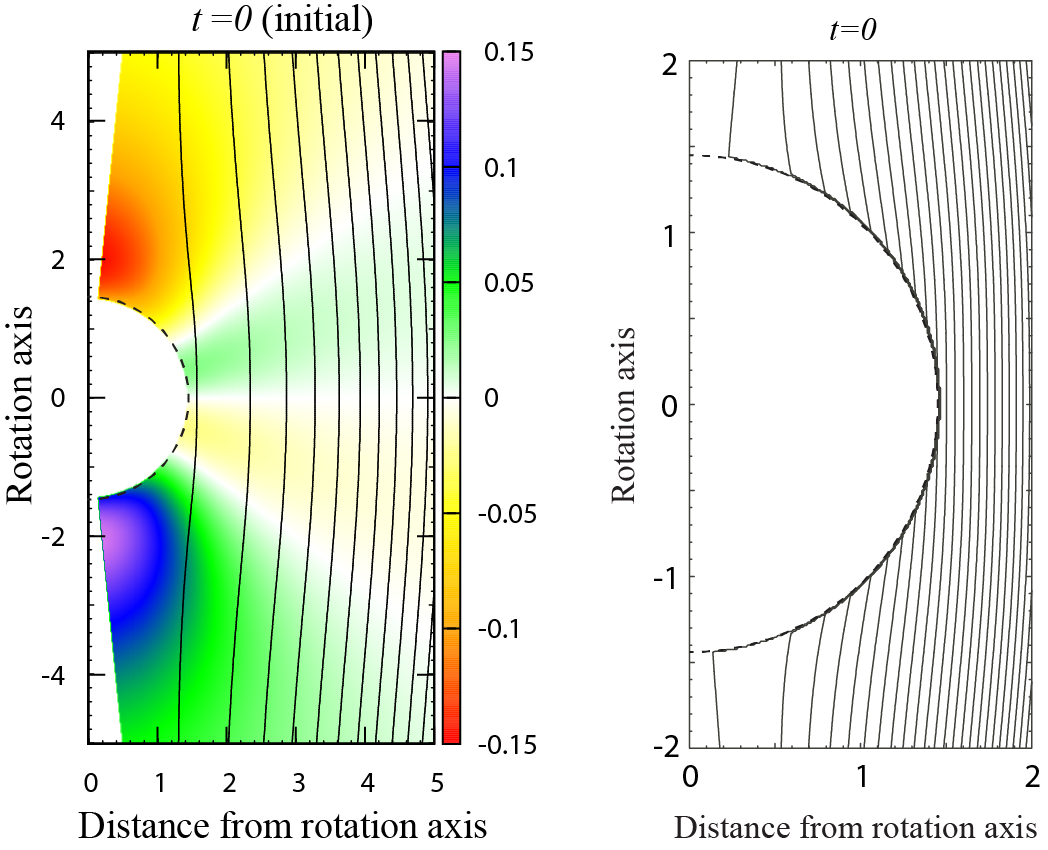
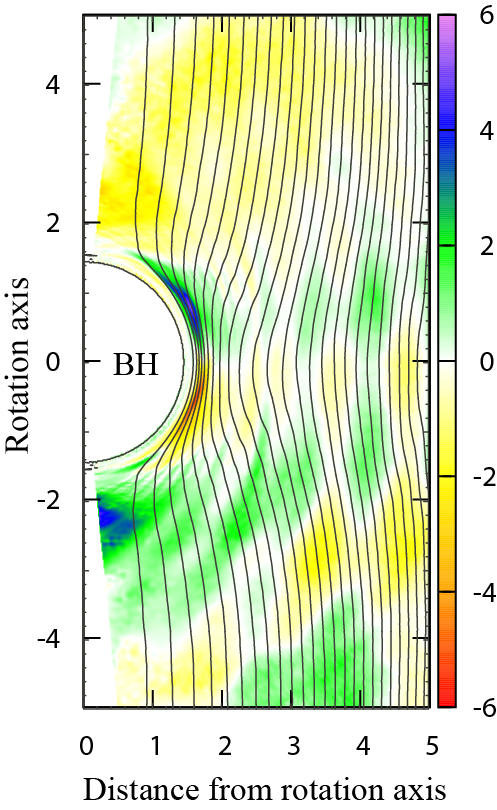
Because of the frame dragging, there appears an electric field along the local magnetic field lines. For , we obtain a non-vanishing at from the Wald solution, as presented in the left panel of figure 1. We also plot equi- contours, which represent the magnetic field lines in the poloidal plane in a stationary and axisymmetric magnetosphere (as in the case of the Wald solution), as solid curves. Here, denotes the magnetic flux function, and is the component of the vector potential , which is related to the Faraday tensor by .
Since the contour interval is taken to be constant, the density of the solid curves shows the magnetic-field strength. In the right panel, we plot the magnetic field lines with smaller contour interval than the left panel, closing up the BH vicinity, , where (i.e., the abscissa) denotes the distance from the rotation axis measured in the Boyer-Lindquist coordinate.
We define that the magnetic field direction so that it may point upward in both hemispheres. Thus, the yellow-red (or green-violet) region indicates inward electric field in the upper (or lower) hemisphere. This non-vanishing, magnetic-field-aligned electric field, will accelerate electrons outwards (or positrons inwards) in the higher latitudes, and accelerate electrons inwards (or positrons outwards) in the lower latitudes. The motion of such charges induces electric currents in the magnetosphere once the simulation begins at .
3.2 Electric fields and currents
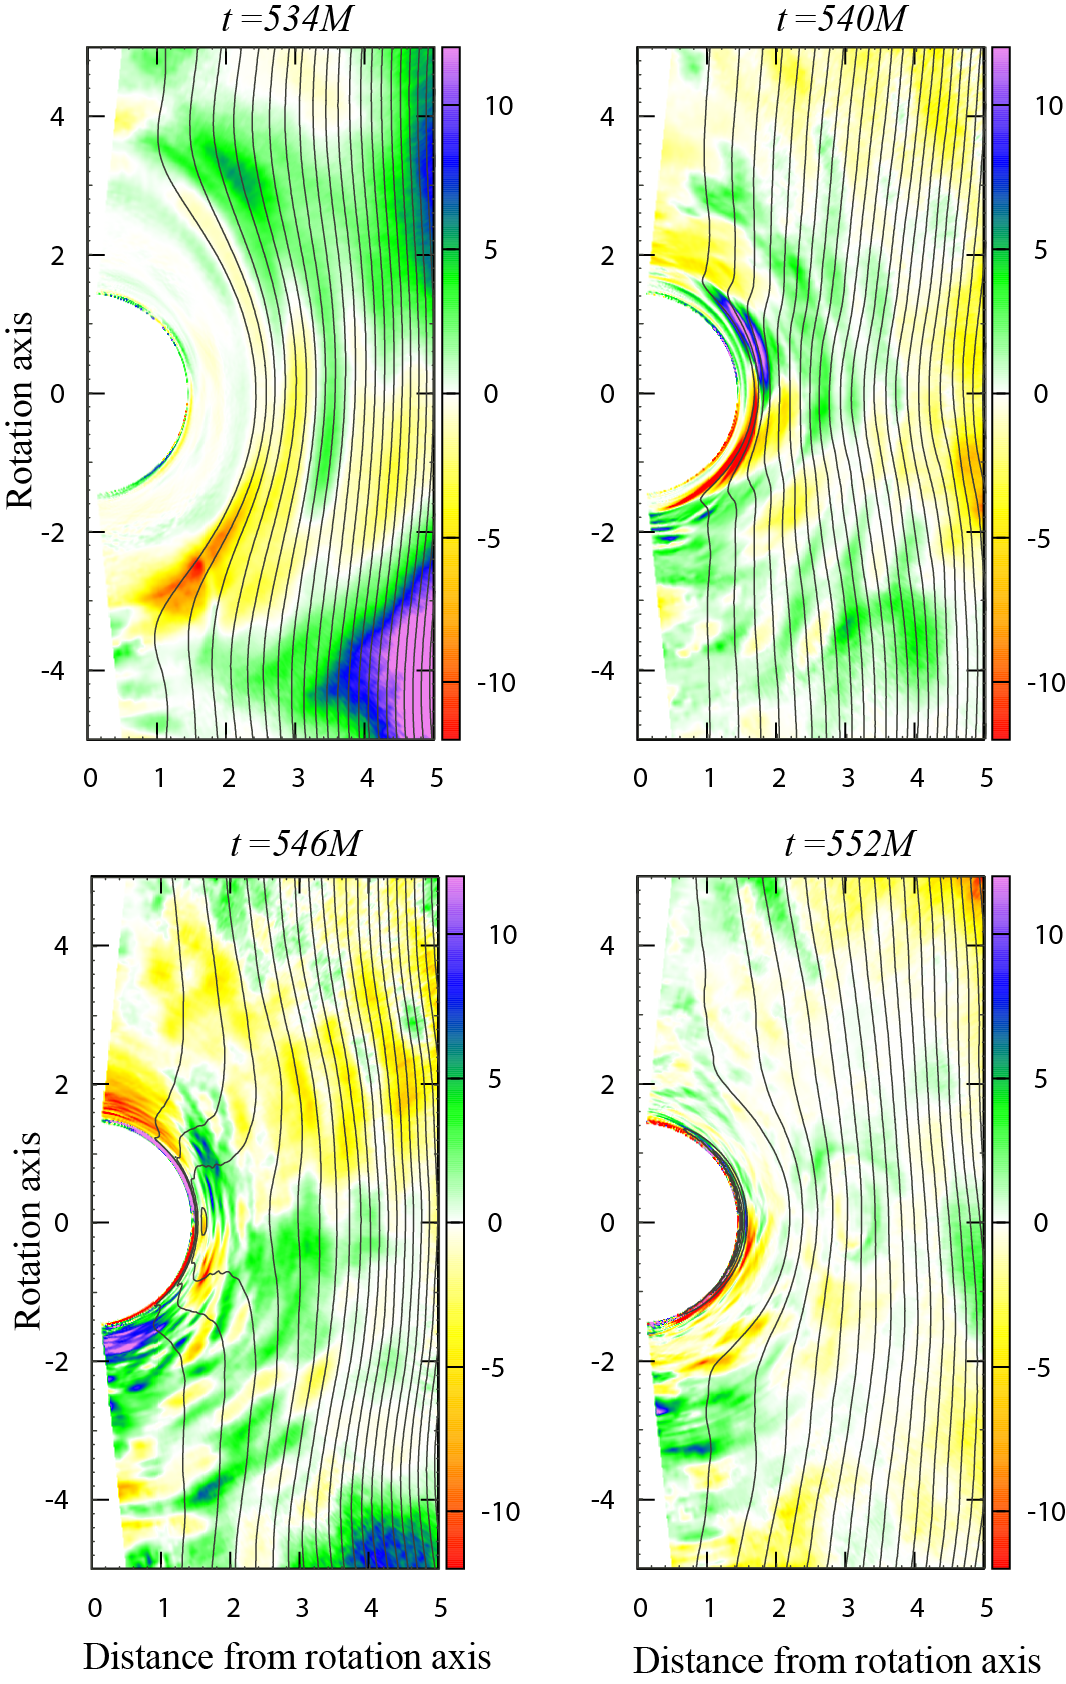
As time elapses, the electric current carried by the charged leptons alter the electric field through the Ampere’s law, and hence the magnetic field through the Faraday’s law. Accordingly, the acceleration electric field, , evolves to a qualitatively different configuration from the initial one. Figure 2 shows by the color images at four discrete elapsed times, , , , and . We also plot equi- contours by black solid curves. It follows that a non-vanishing changes with time, and becomes much greater than in some limited regions. At a small accretion rate , the ADAF cannot supply enough MeV photons that are capable of materializing as pairs, and cannot sustain the magnetosphere force-free. We also find that peaks around the inner light surface (fig. 2 of Hirotani & Pu, 2016) at , and that the magnetic field lines densely reside near the horizon at the same timing, as the top right panel shows. This point will be examined more closely in § 3.6 in relation to the energy extraction from the BH. In the top left panel, magnetic field lines do not seem to exist near the horizon; however, it merely shows that the magnetic field is week there.
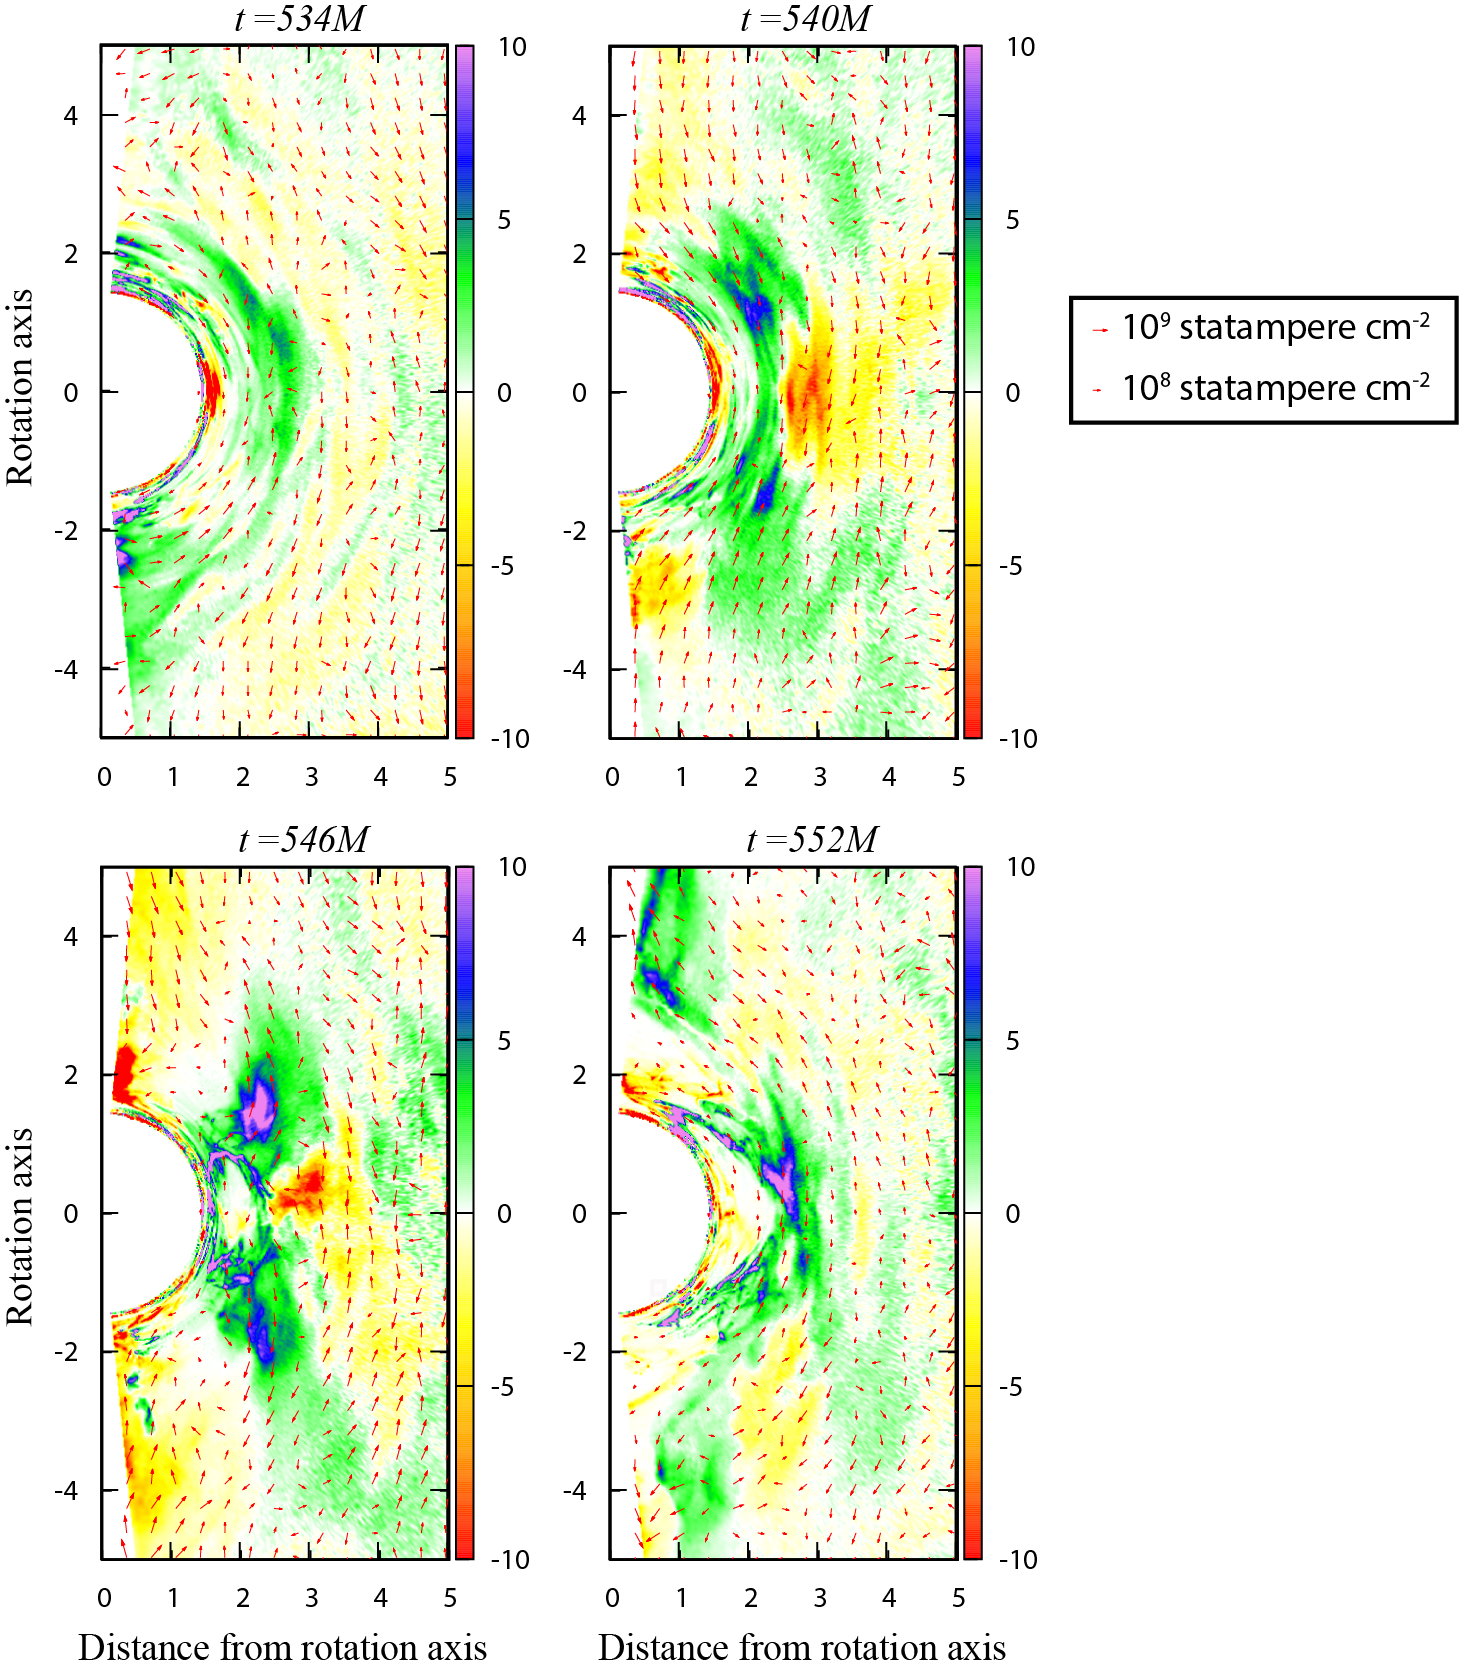
In figure 3, we plot the real charge density (color image) and the electric currents (red arrow) on the poloidal plane at the same four discrete timings. It shows that the charge density is comparable to the Goldreich-Julian value. Both the charge density and the current evolve within several dynamical timescales. It also follows from the top right panel that a return current is formed towards the equator within the ergosphere at . We will examine this point more closely in § 3.6 in relation to the energy extraction from the BH.
3.3 Magnetic field
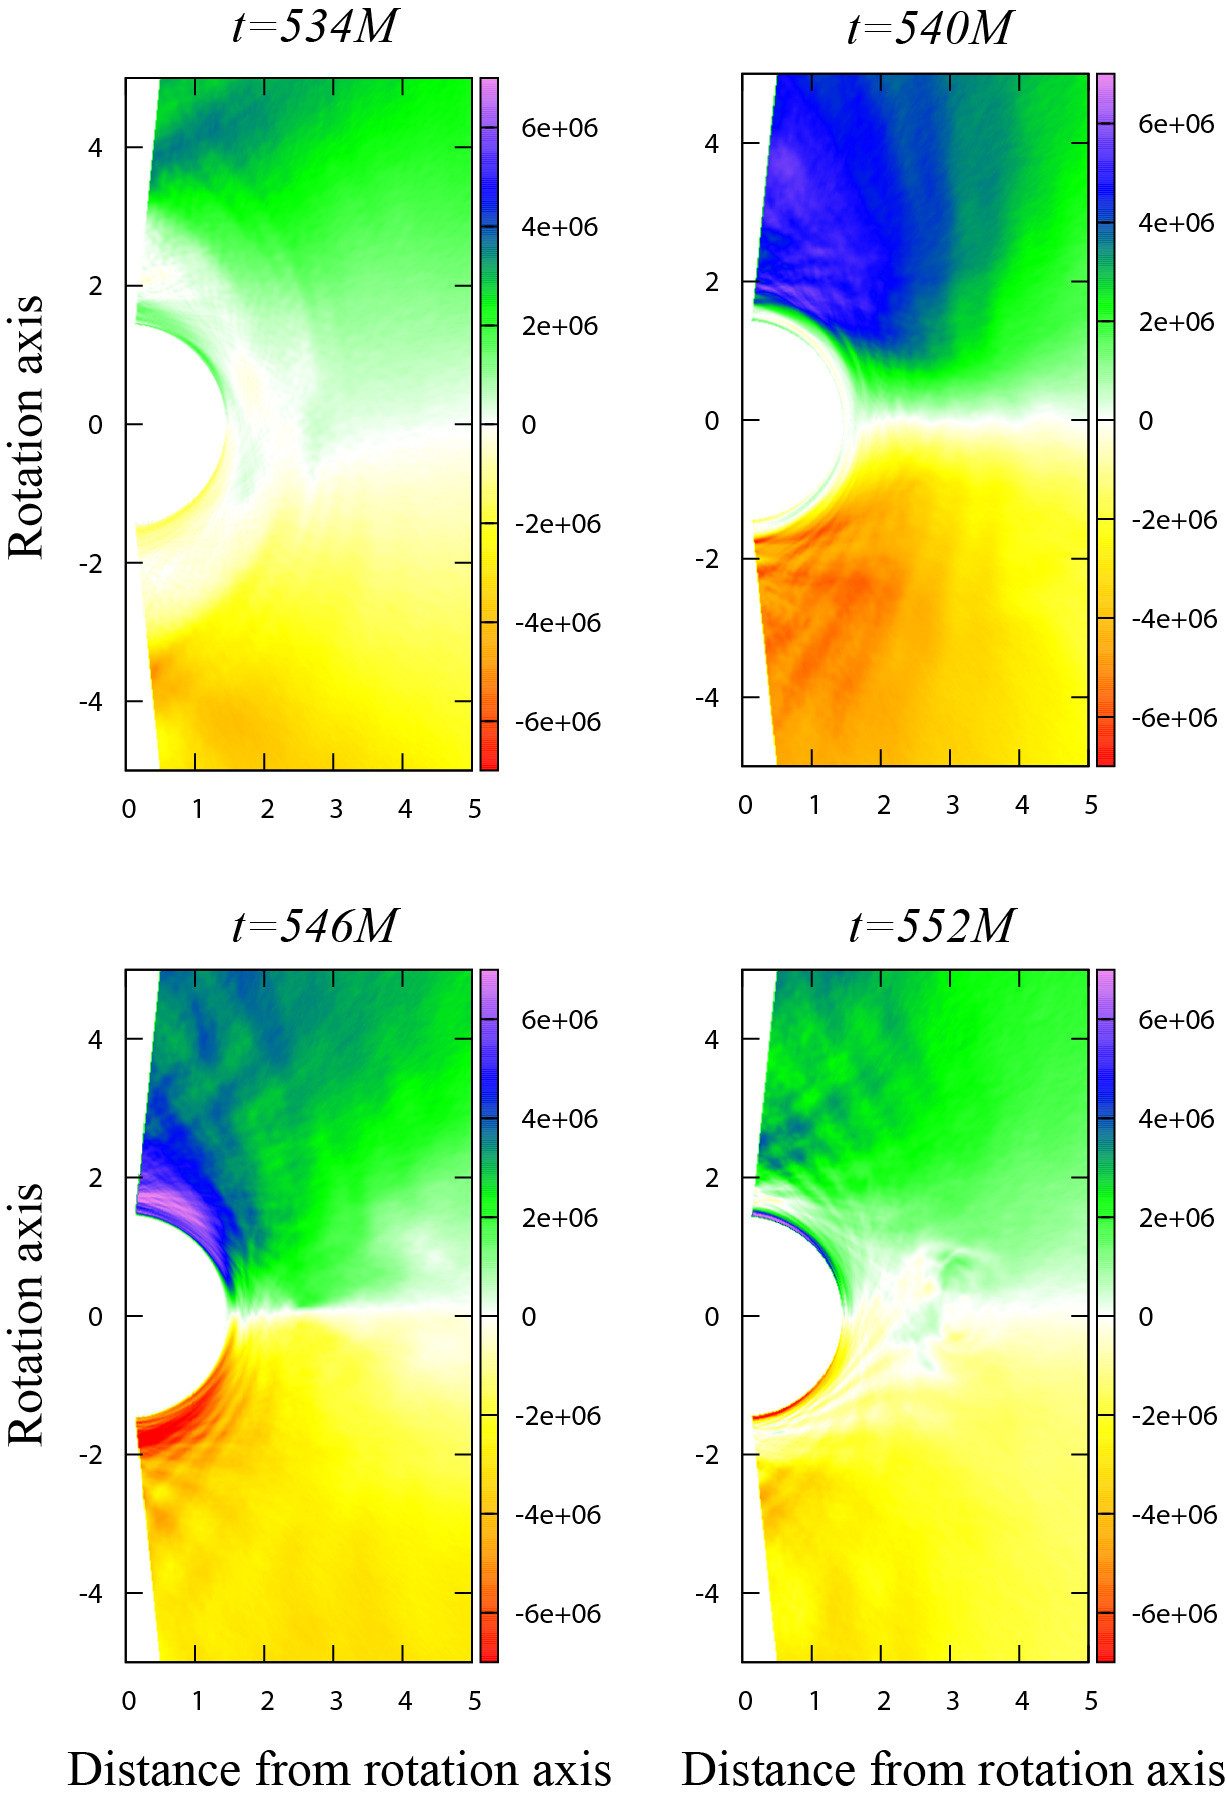
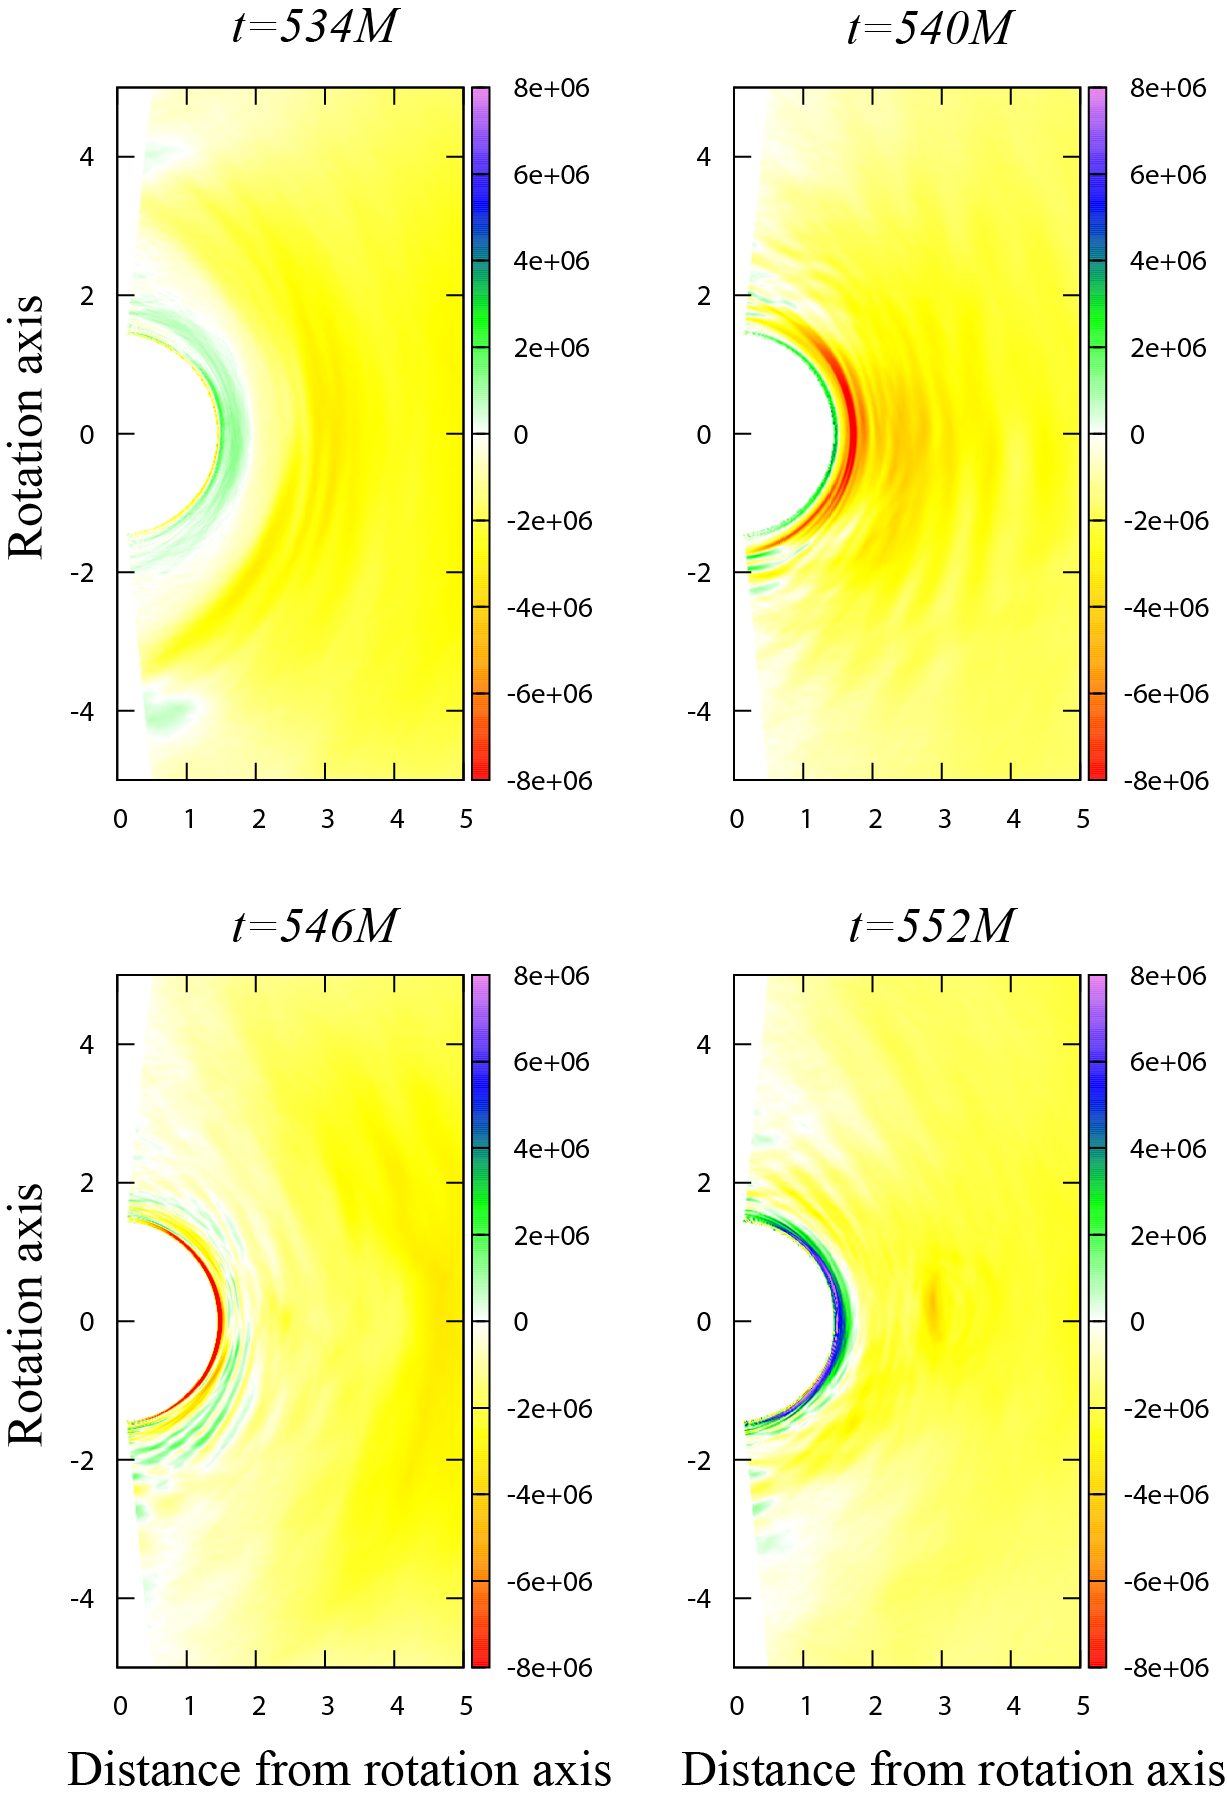
Let us next examine the magnetic field. First, we plot the ZAMO-measured radial component in figure 4. It follows that takes a large value in the higher and middle latitudes at and gradually decreases with time. By symmetry, changes sign between the upper and the lower hemispheres.
Second, we plot the ZAMO-measured meridional component, , in figure 5. Except for the horizon vicinity, takes negative values with smaller amplitude than . We can also find large-amplitude oscillations appearing in radial direction in the direct vicinity of the horizon. This is due to the redshift effect and will be discussed again in the final part of this subsection.
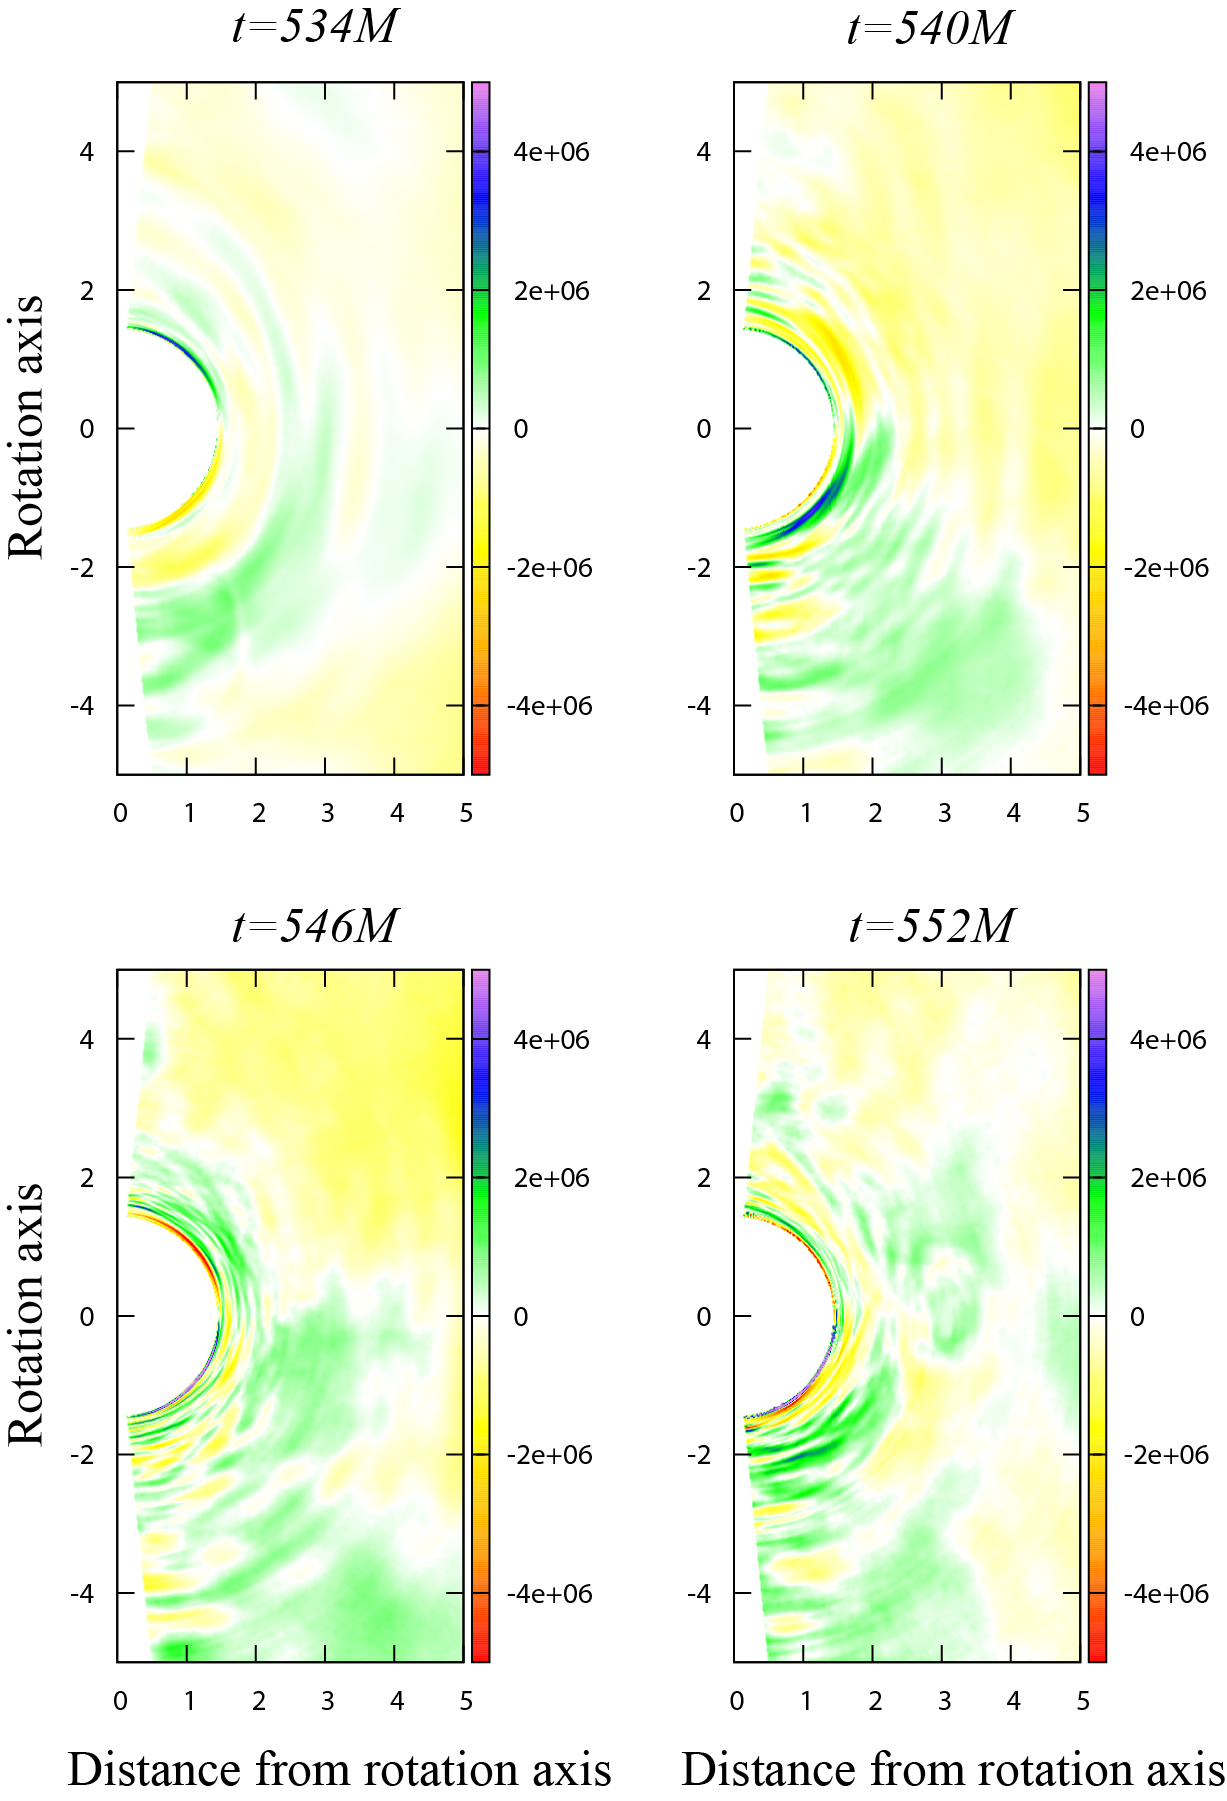
Third, we plot the ZAMO-measured toroidal component, in figure 6. For this horizontal component at the horizon, there appears a divergent factor, , in the right-hand side, because the ZAMO becomes an unphysical observer at the horizon. (Note that we use ZAMO-measured quantities only for presentation purpose. We never adopt the ZAMO in any actual computation in our PIC scheme.) Neglecting this artificial divergence (i.e., the ill behaviour of ZAMO) at the horizon, we find in most regions. It is also clear that generally becomes negative (or positive) in the upper (or lower) hemisphere, because the magnetic field lines tend to be swept back by rotation.
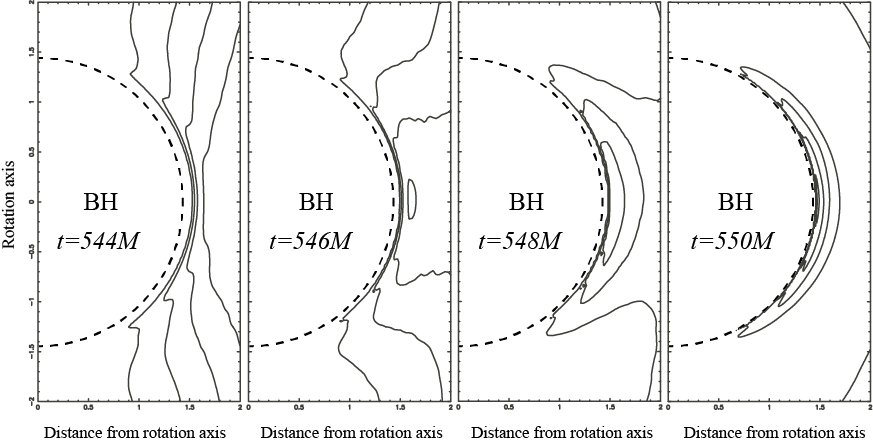
Let us briefly examine the evolution of magnetic-field lines. In figure 7, we present the equi- contours near the horizon at four discrete timings as indicated. It is found that magnetic islands appear due to magnetic reconnection within the ergosphere at , and migrate towards the BH, being elongated along the horizon due to the gravitational redshift, as the right two panels show. Because of this effect, alternate the sign in the direct vicinity of the horizon, as figure 5 demonstrates. Note that it takes infinite time for magnetic islands to arrive the horizon in the Boyer-Lindquist coordinates. We thus adopt the tortoise coordinate, , to resolve the anti-parallel magnetic field lines accumulated in the direct vicinity of the horizon.
3.4 Magnetic reconnection near the horison
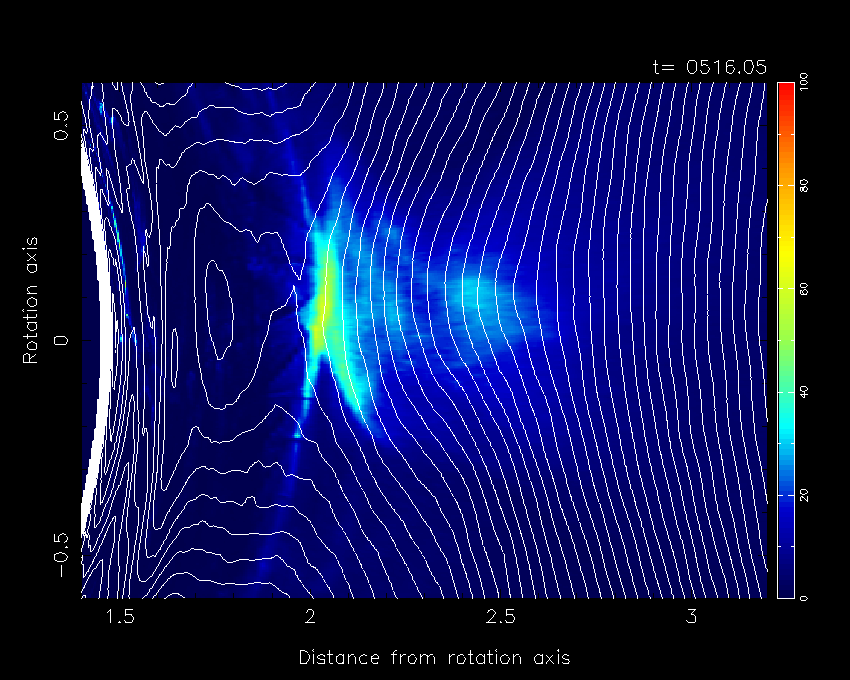
It is noteworthy that Crinquand et al. (2021) reported magnetic reconnections taking place on the equator, including outside the static limit (i.e., at on the equator). In their simulation, their initial poloidal magnetic field (their eq. [9]) quickly dies out in a few tens of . Accordingly, relatively weak poloidal magnetic field outside the ergosphere allowed X and O points (where the magnetic field forms an X-like or O-like geometry in the poloidal plane) to arise at (their fig. 4). On the other hand, in the present analysis, we superpose stationary Wald electromagnetic fields on non-stationary PIC fields, assuming a stationary ring current at some large-enough distance on the equator. As a result, the initial poloidal magnetic field does not die out and prevents X and O points to arise at . That is, magnetic reconnection takes place efficiently only inside the static limit.
In figure 8, we plot the equi- contours by white curves and the total pair number density, in color. It follows from the online animation that magnetic reconnections subsequently take place at the X-type point, which is located at and (i.e., inside the ergosphere near the equator). Pair plasmas are ejected from this reconnection region horizontally both rightward and leftward. Plasmas ejected rightward (i.e., into greater ) are compressed outside the ergosphere, . On the other hand, plasmas ejected leftward (i.e., toward the horizon) are not efficiently compressed around the O-type point (located around ), because the magnetic-field strength is weak there compared to those at , as can be seen from the difference of contour intervals. Instead, in-falling plasmas are compressed in the direct vicinity of the horizon (in the Boyer-Lindquist coordinates); however, the resultant high-density regions (in red color) are hidden under the piled-up magnetic field lines, which appear as a bunch of white curves right above the horizon.
3.5 Particle energy distribution
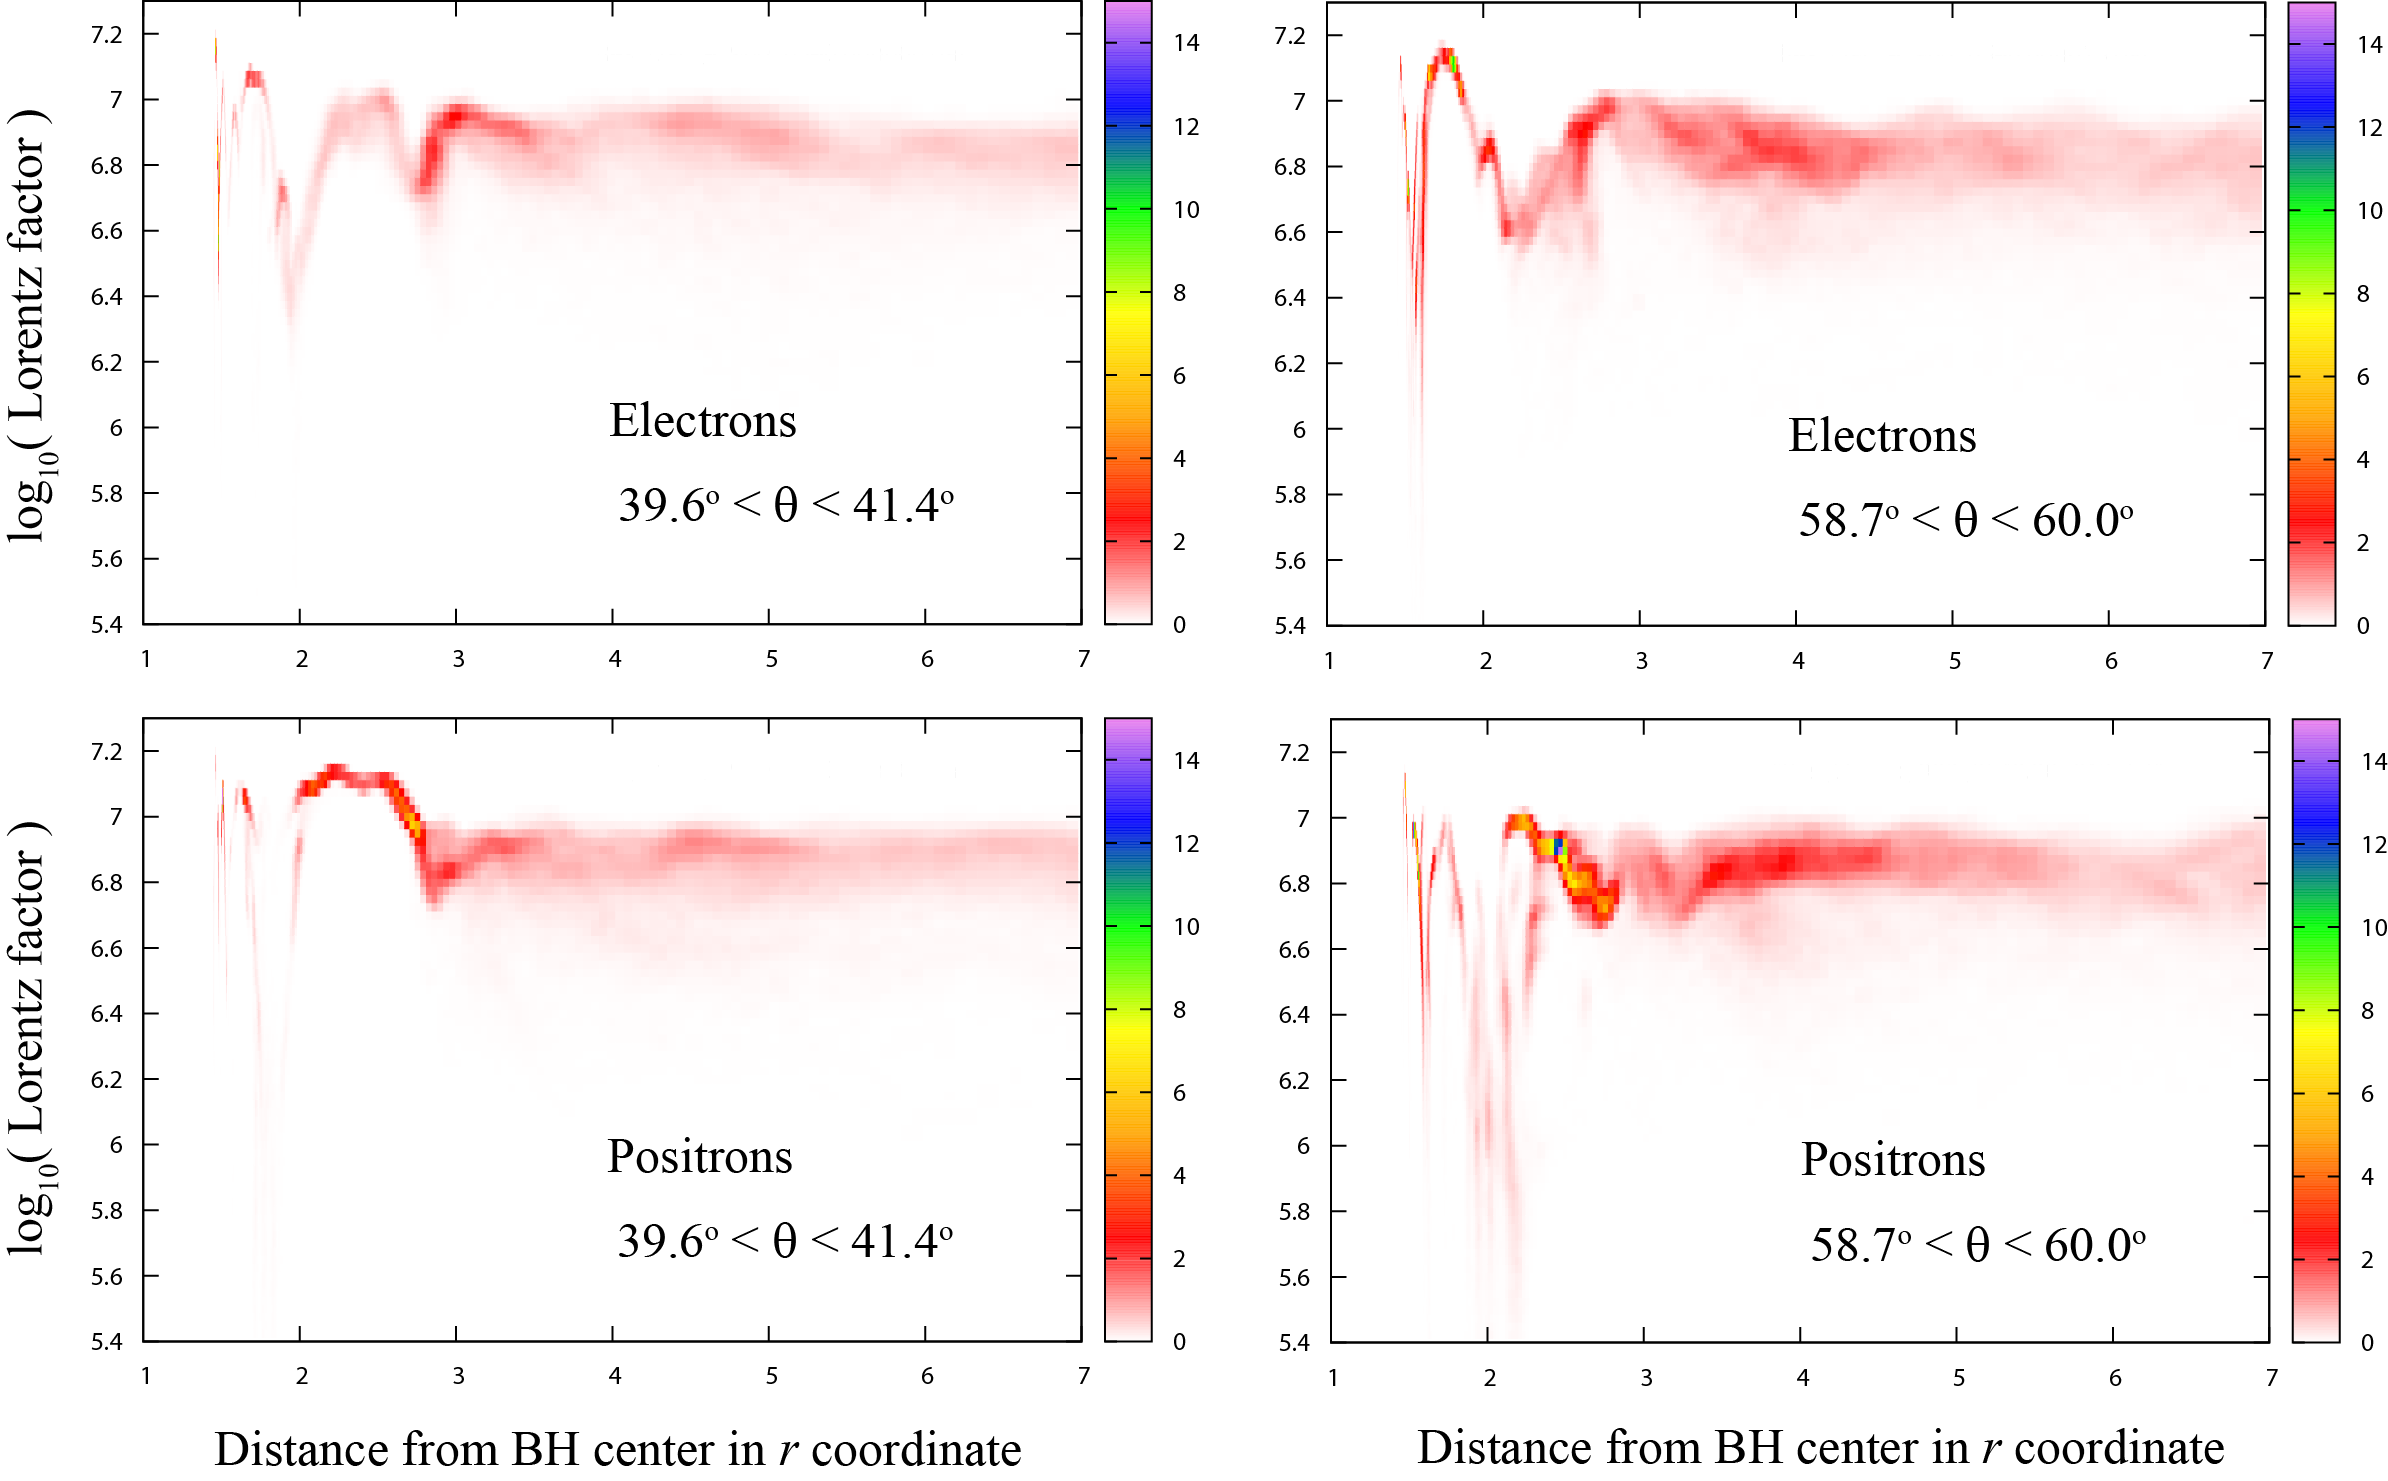
Let us briefly browse the energy dependence of macro particles. In figure 9, we plot the distribution of as a function of the distance from the BH. In special relativity, refers to the Lorentz factor. However, in the present case, also contains the time dilation due to the gravitational redshift and the frame dragging at the particle’s position. Nevertheless, for simplicity, we represent as the ‘Lorentz factor’ in this figure. The color image shows the particle distribution function normalized by the Goldreich-Julian number density. For the details of this normalization, see § 3.5.2 of Paper I, where in equation (60) of Paper I corresponds to in the present notation.
We plot the electron (or positron) energy distributions at as the top (or bottom) two panels. The left two panels show the distribution within the colatitude , and the right ones do within . It is found that the particle Lorentz factors are kept above at each position. Because a strong acceleration electric field arises near the inner light surface at , the Lorentz factor distribution peaks within for both electrons and positrons at this timing, . If we integrate over the particles within the specified latitudinal range at each at elapsed time , we find that the positronic (or electronic) density peaks at (or ) with averaged Lorentz factor (or ) in the region and .
3.6 The Blandford-Znajek flux
Now let us consider the BZ flux. The radial component of the BZ flux (i.e., the Poynting flux) become,
In what follows, we normalize with its analytically inferred value, , where denotes the typical BZ flux obtained by dividing the typical BZ luminosity with the surface area , and . The typical BZ luminosity is estimated by (Tchekhovskoy et al., 2010)
| (35) |
where the total magnetic flux threading the horizon is given by
| (36) |
and for a radial magnetic field near the horizon. The present magnetosphere is magnetically dominated, in the sense that the magnetic energy density dominates the particles’ rest-mass energy densities. Accordingly, particle contribution is negligible when we discuss the energy flux.
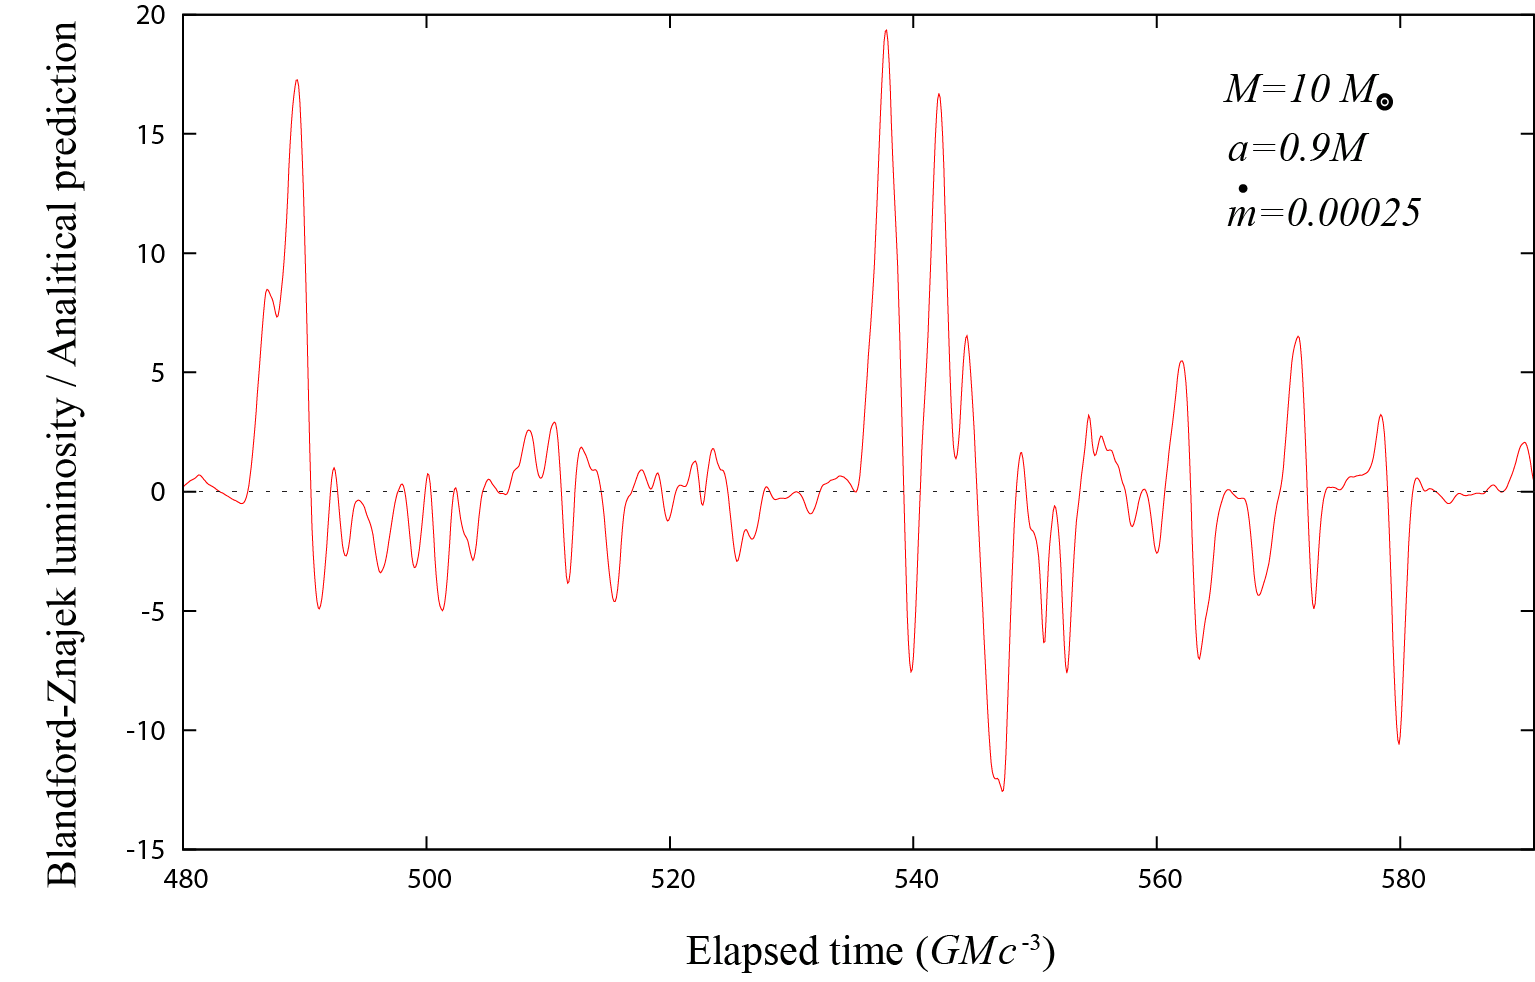
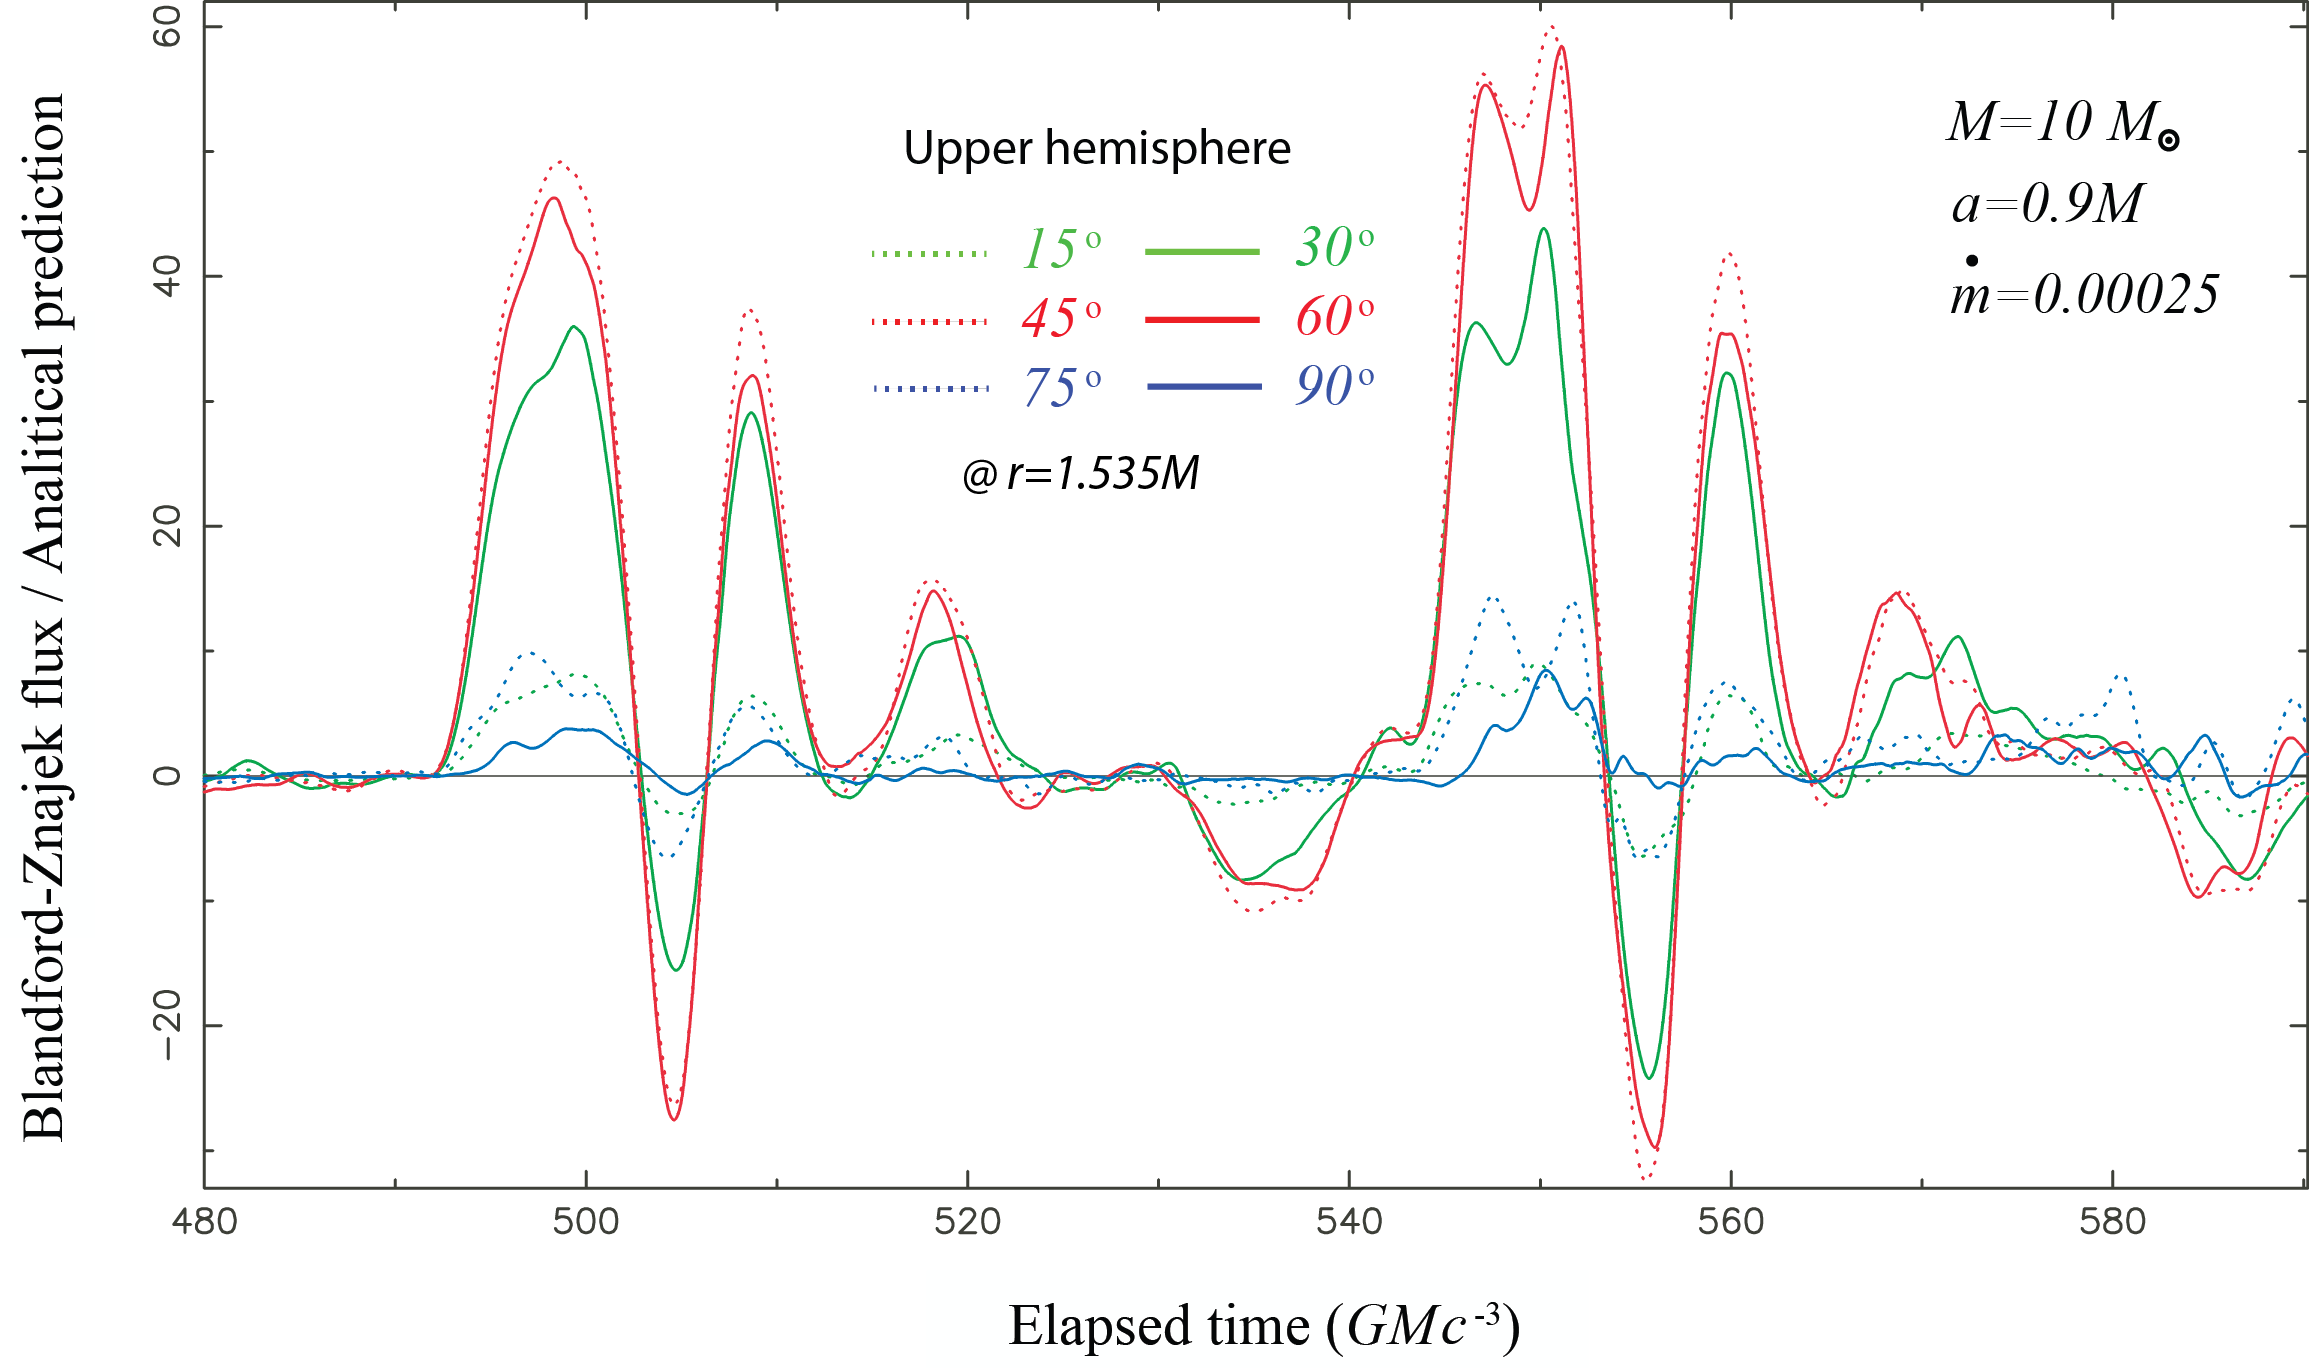
In figure 10, we plot the normalized BZ flux, , as a function of the dimensionless elapsed time , at position and , , and . The left panel shows the BZ fluxes during the entire simulation period, while the right panel focuses the elapsed time after . It follows that the flux oscillates between positive and negative values and peaks with an interval . This typical flaring period, , does not change if we adopt different outer boundary radius, such as or , instead of .
To see the averaged flux, we take a moving average with period . Figure 11 shows the result for the upper hemisphere (left panel) and the lower hemisphere (right panel). It follows that the net flux is positive in both hemispheres, which means that the BH’s rotational energy is extracted in the form of the Poynting flux, and that the solution is more or less symmetric between the upper and lower hemispheres. We can also find that the BZ flux concentrates in the middle latitude (red curves) rather than in the higher (green) or lower (blue) latitudes.
It is worth considering the relation between the BZ-flux variation and the magnetic-island evolution. As figure 7 indicates, when a magnetic island is formed near the equator within the ergosphere, it expels magnetic field lines outside. As time elapses, the magnetic island migrates inwards being elongated along the horizon, and eventually sticks to it and virtually disappear, as the right-most panel of figure 7 shows. After the magnetic islands virtually disappear, magnetic flux tubes return to the horizon vicinity, as the top-right and bottom-left panels of figure 2 show, or the left-most panel of figure 7 shows. During this phase, magnetic field becomes strong as the top-right panel of figure 4 shows, inducing a strong acceleration electric field near the inner light surface, as the top-right panel of figure 2 shows. It also follows from the top-right panel of figure 3 that a strong return current is formed at the same timing within the ergosphere towards the equator. This meridional current acts Lorentz forces on the magnetized plasmas pushing them into negative-energy orbits, and exerts a counter torque on the horizon. Accordingly, the BH’s rotational energy is efficiently extracted.
On the other hand, when there exists a giant magnetic island within the ergosphere, the weak magnetic field near the horizon cannot facilitate the BZ process efficiently. Indeed, magnetic islands occupy a good fraction of the ergosphere in a large fraction of time. As a result, the BZ flux increases only sporadically, as figure 10 shows. The characteristic flaring period, , is regulated by the time scale of reconnection taking place within the ergosphere.
It is worth noting that the BZ process is facilitated by virture of these return currents outside the horizon. Assuming a stationary and axisymmetric BH magnetosphere, Punsly (1996) pointed out the infeasibility of the BZ process in relation to the causality and the plasma’s inertia. However, this criticism can be overcome by the formation of these strong, time-dependent return currents within the ergosphere.
Since we are not considering the pair production between the gap-emitted -rays and disk-emitted soft photons, we do not find the quasi-periodic gap activities through gap reopening and resultant pair cascade as reported in 1D GRPIC simulations with photon tracking (Kisaka et al., 2020; Chen & Yuan, 2020).
To examine the angular dependence of the BZ flux, we plot the BZ flux as a function of the colatitude at five discrete elapsed times in the left panel of figure 12. At , the BZ flux peaks at and . If we take a time average after , we find that the BZ flux does peak in the middle latitude in (upper hemisphere) and in (lower hemisphere), as the right panel indicates.


Let us quickly take a look at the BZ luminosity, by integrating the BZ flux over the entire spherical surface at a fixed . When , we can evaluate the magnetic-field strength at the horizon by its equipartition value, G at , which allows us to analytically infer the luminosity as . Evaluating the simulated flux at , and normalizing its integrated value with , we obtain the BZ luminosity as presented in figure 13. We find that the BZ luminosity flares every dynamical time scales, as expected, and the peak values attain times of the analytically inferred value.
The time-averaged BZ luminosity is found to be , which corresponds to % of the analytical value. Therefore, when the accretion rate is as small as , we can conclude that the spin-down luminosity of the BH exceeds times of the analytical estimate during the flare although its long-term average is kept at only % of it.
3.7 Power spectrum of the BZ flux
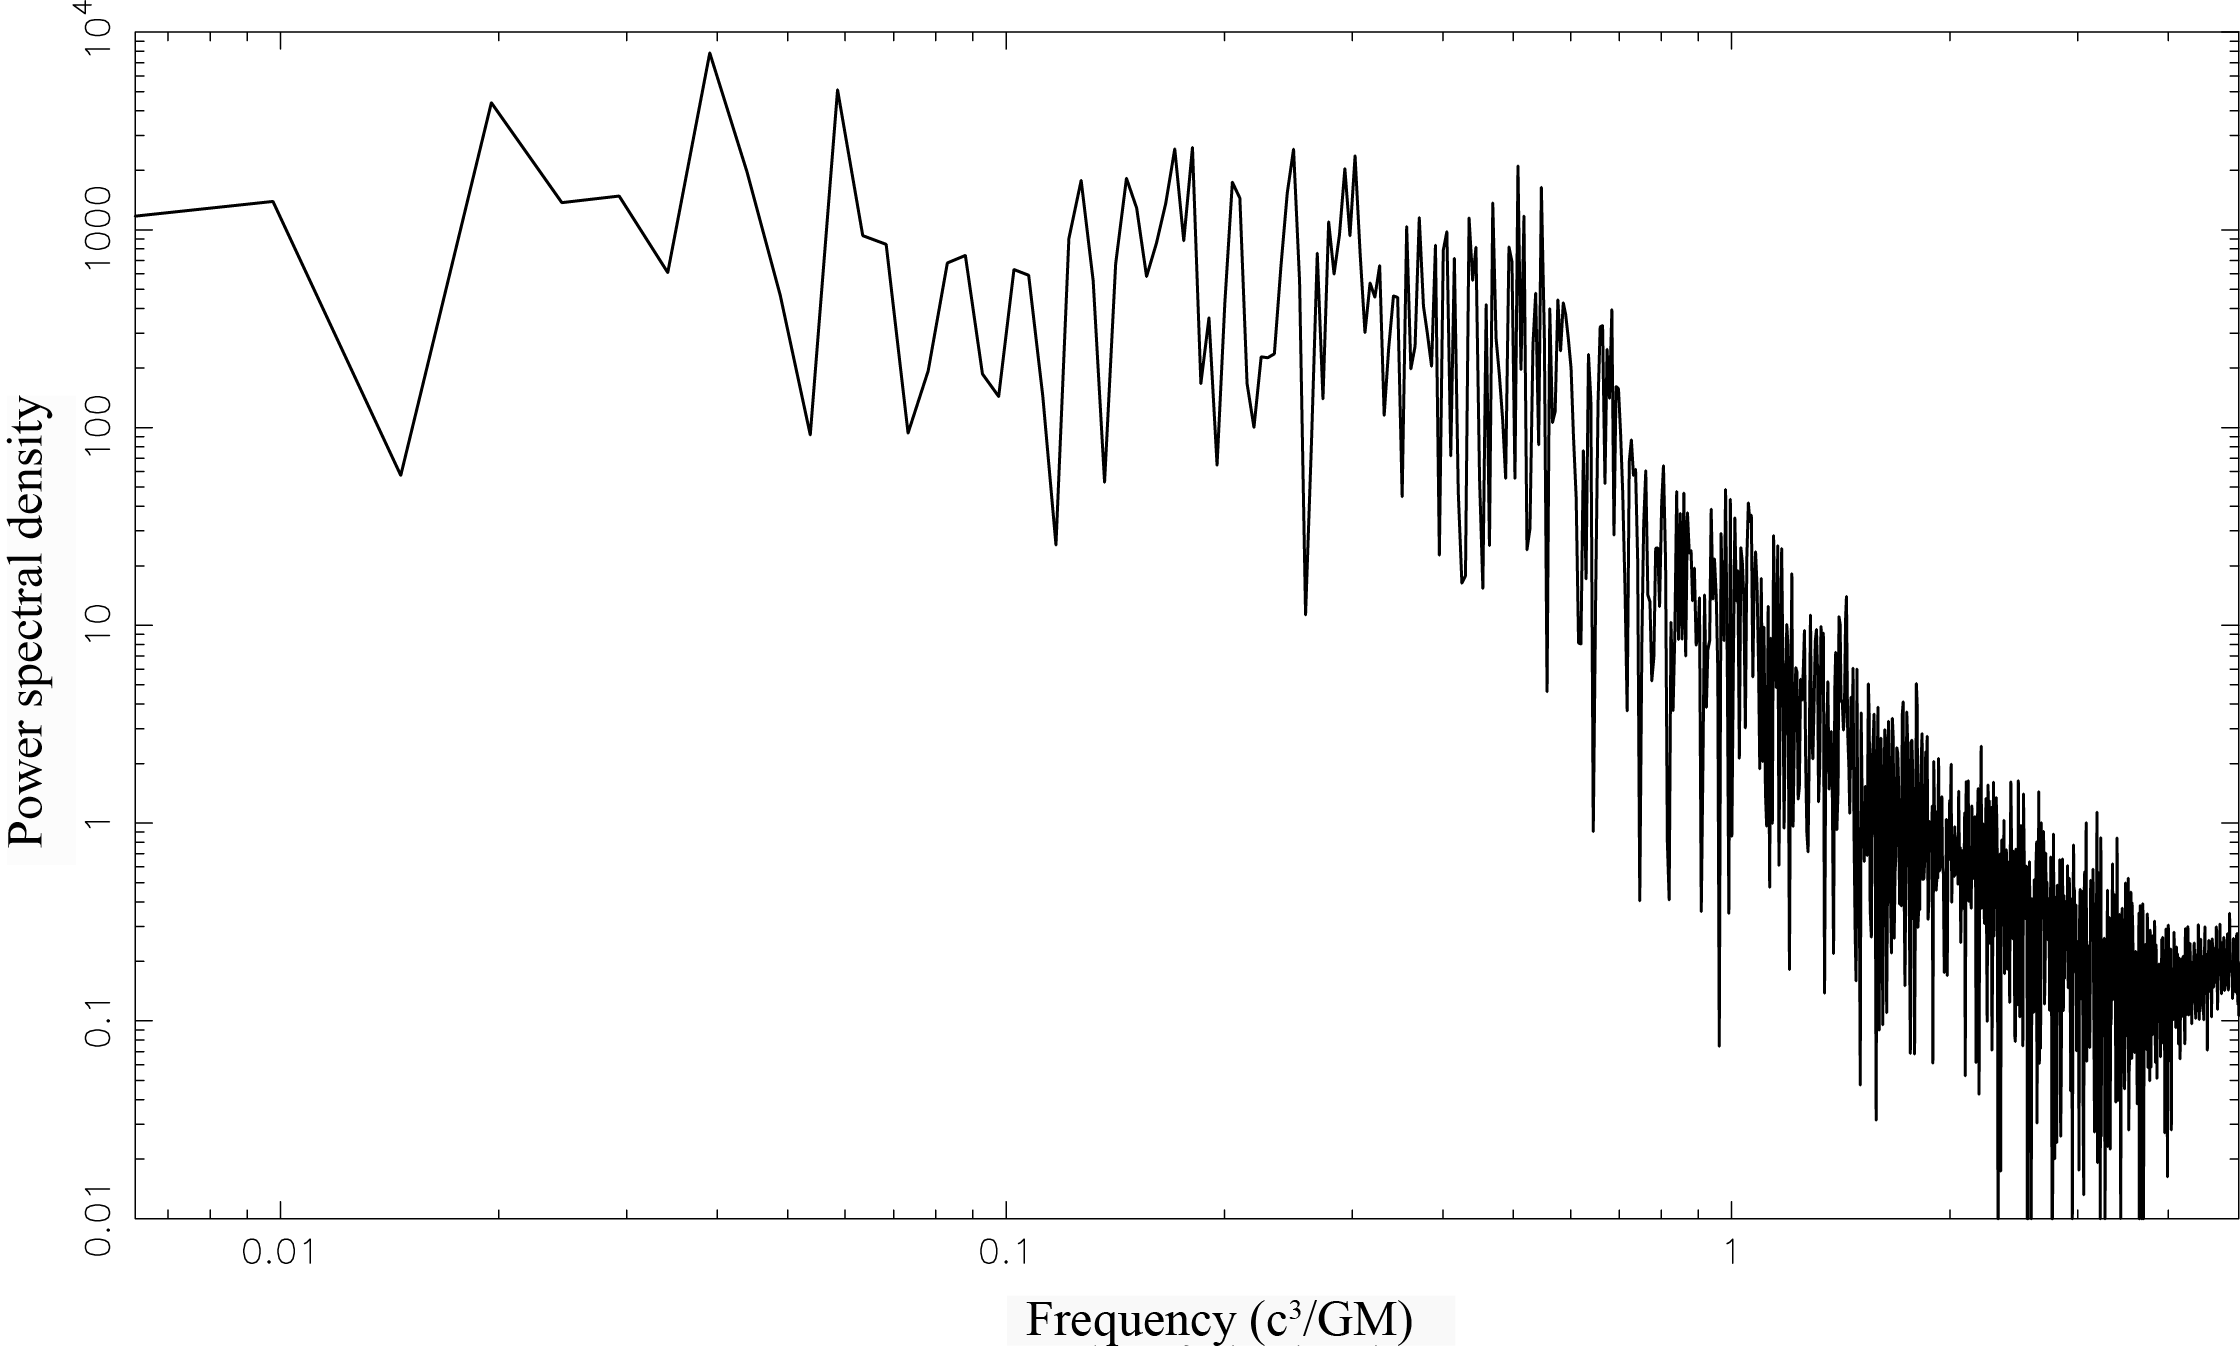
To look more closely at the time variability properties, let us Fourier-transform the BZ flux. For this purpose, we introduce a normalized power spectral density (PSD), , of function , so that the normalization may be defined by
| (37) |
where in the right-hand side denotes the frequency. The function (in this particular case, the BZ flux) is sampled at points, which span a range of time . The sampling interval is ; thus, the Nyquist frequency is .
We plot the PSD at in figure 14. It follows that a quasi-periodic oscillation (QPO) appears around , and its higher harmonics appear around and . The fundamental frequency of the QPO, , means that there is a modulation of the amplitude with a period , which corresponds to interval of the flares that can be seen in figures 10 and 11.
4 The case of greater accretion rate
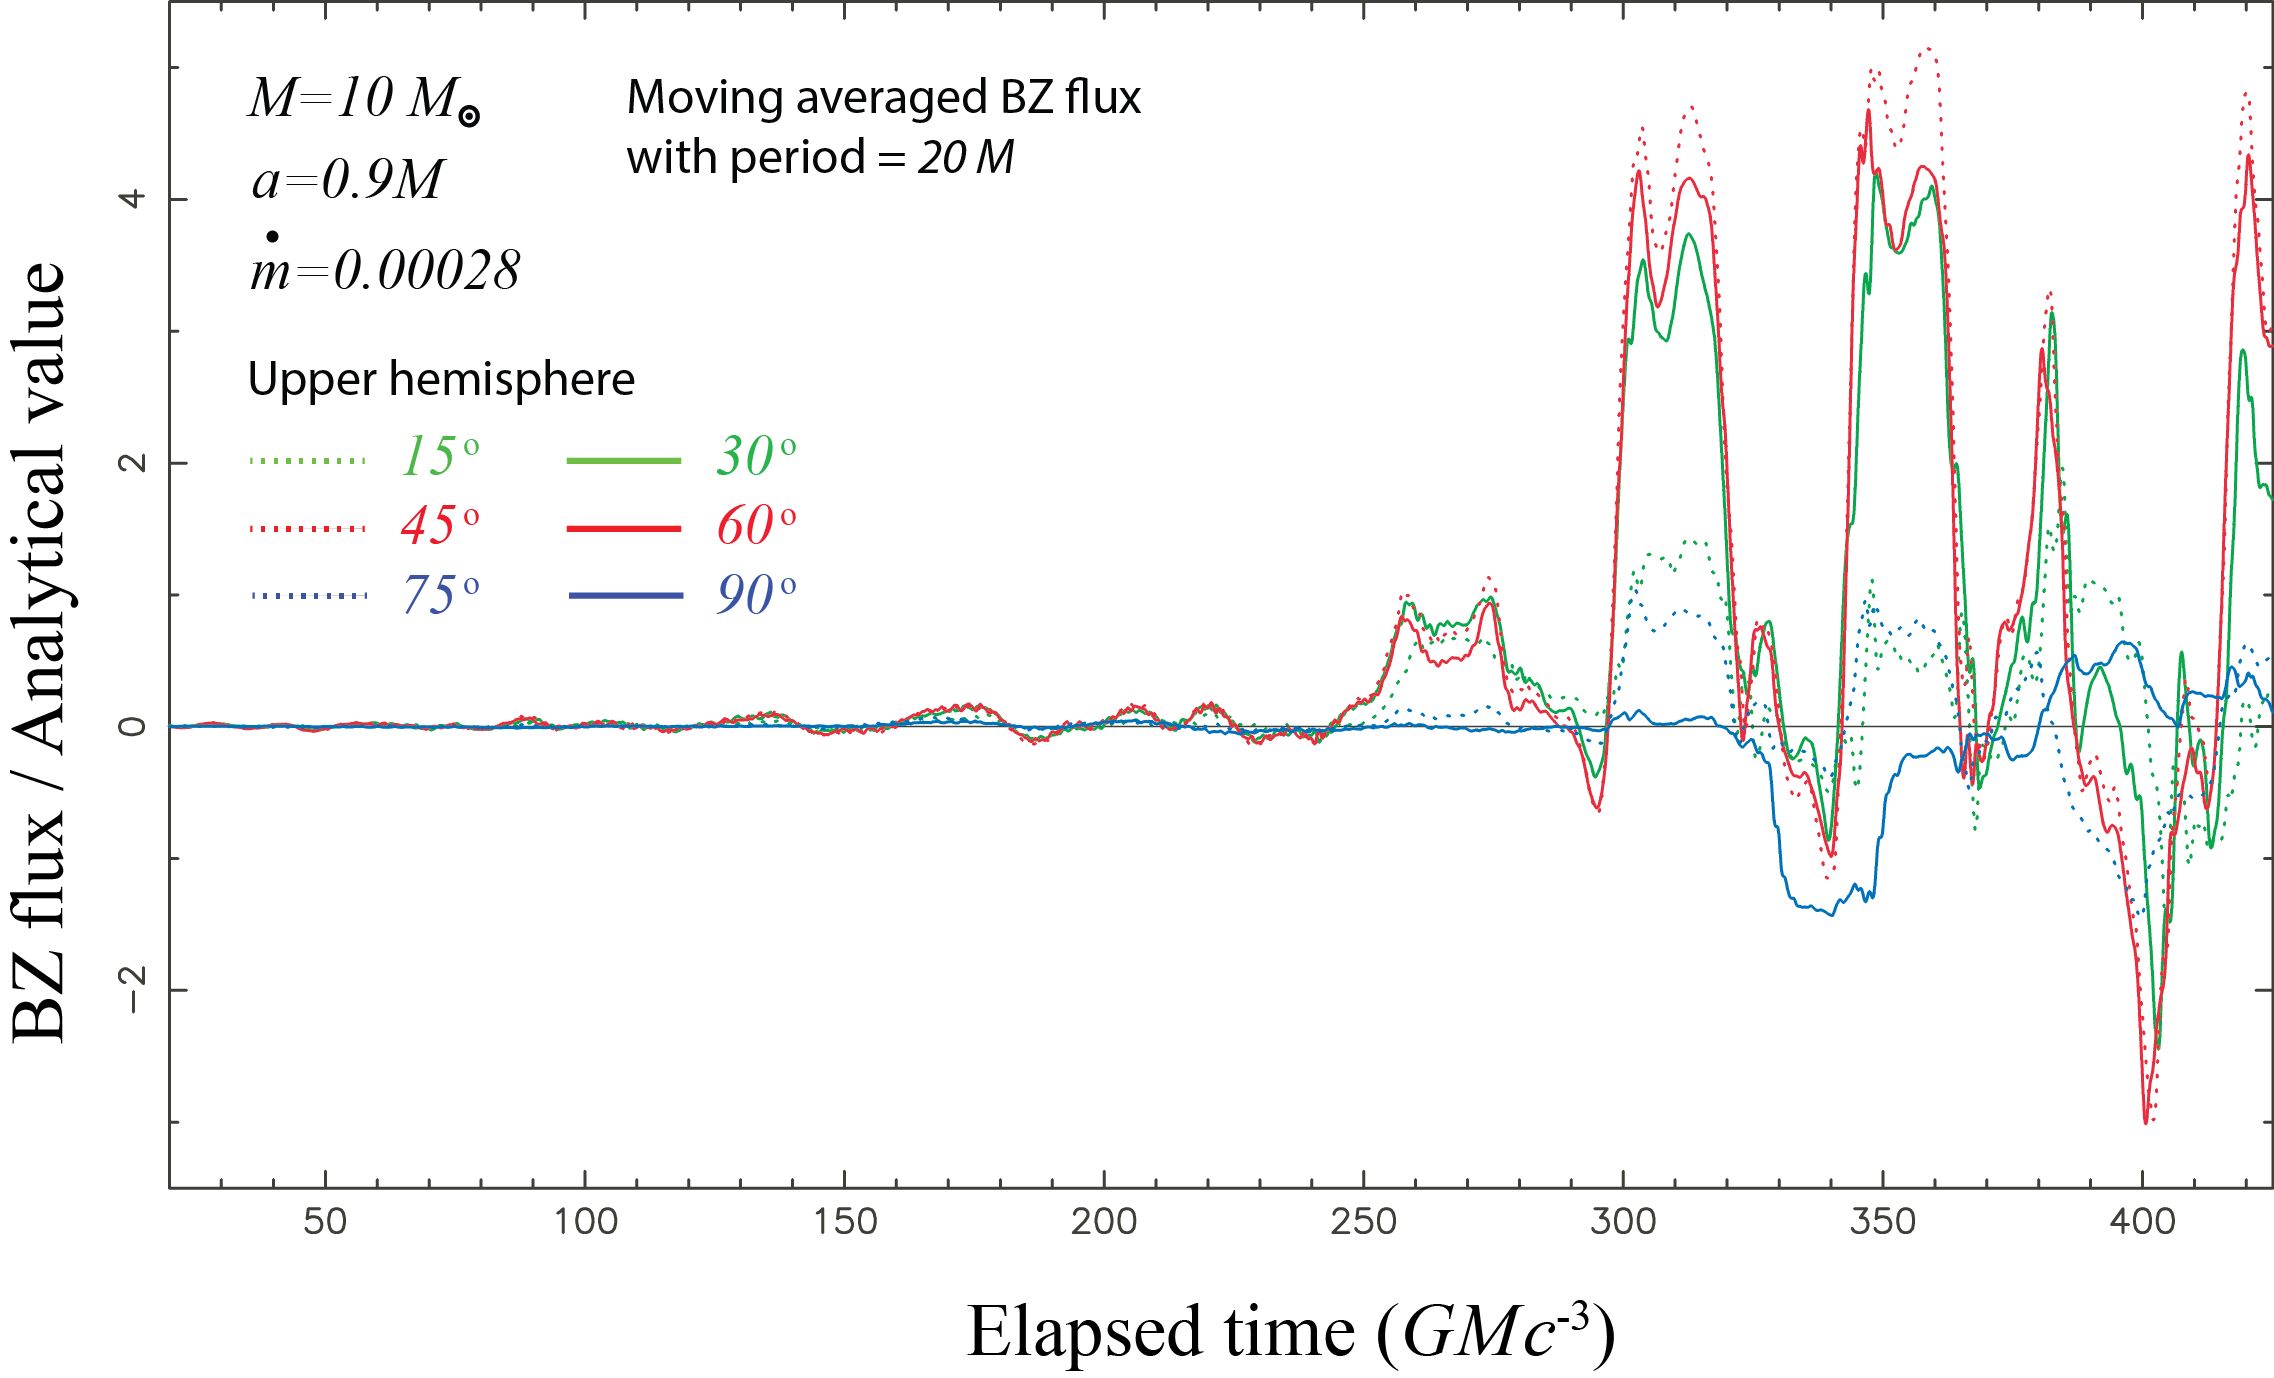
Let us briefly consider a greater accretion rate, . In figure 15, we present moving-averaged BZ fluxes at six discrete colatitudes for this case. Comparing with the left panel of figure 11, we find that the BZ flux shows flaring activity with an interval , and that the BZ flux concentrates in the middle latitudes between and . Although the QPO frequency, , little depends on , the peak of the normalized BZ flux decrease below , whereas it was between and when . This is because the amplitude of the fluctuation reduces owing to the increased plasma density when (and hence the pair production rate) increases.
As an example, we present at (i.e., when the BZ flux peaks) in figure 16. Comparing with the top right panel of figure 2, which also shows at a peak, we find that the magnetic-field-aligned electric field decreases with increasing . In another word, the magnetosphere becomes highly charge-starved when the pair production rate (eq. [30]) is small enough. As increases (i.e., as pair production increases), the magnetosphere approaches a force-free solution, in the sense that the electric field is more efficiently screened along the magnetic field lines. However, if we adopt , the solutions become unstable from the horizon vicinity near the equator, because the variation of the compiled electromagnetic fields there becomes too sharp to be resolved even in the coordinates. This is a limitation which we may encounter in the Boyer-Lindquist coordinates. On the contrary, Parfrey et al. (2019) adopted the Kerr-Schild coordinates, which are regular at the horizon, and demonstrated that their PIC solutions approach the force-free solution when they assumed greater pair-production rates than ours.
5 Discussion
To sum up, we simulated the evolution of a BH magnetosphere by a PIC scheme, when the electron-positron pair plasmas are steadily supplied externally. Provided that the mass accretion rate is as small as % of the Eddington limit, the rotational energy of a black hole (BH) is electromagnetically extracted via the Blandford-Znajek process. For a ten-solar-mass BH with the spin parameter , the extracted energy flux shows flaring activity with a period of dynamical time scales, which is regulated by the magnetic reconnection within the ergosphere. During the flare, strong acceleration electric field appears around the inner light surface with a meridional return current towards the equator inside the static limit. The flare’s energy flux concentrate along the magnetic field lines that thread the event horizon in the middle latitudes.
5.1 Plasma skin depth
Let us show that the plasma skin depth (eq. [32]) is resolved by the present grid interval. Normalizing the pair density by the GJ value, , we obtain
| (38) | |||||
where and ; measures the magnetic field strength in dimensionless unit. For a non-rotating BH (i.e., ), we find so that gives the actual pair density. In Parfrey et al. (2019); Crinquand et al. (2021); Bransgrove et al. (2021), they employed in their re-scaled formulation, which corresponds to G for and G for . Note that we have G for , and G for , where . By virtue of such tiny magnetic field strengths, , the skin depth was resolved in their works even for supermassive BHs, , despite due to the smallness of .
In the present paper, on the other hand, we adopted a stellar-size BH mass and heavy electron/positron mass . Evaluating the mean Lorentz factor, plasma density, and the magnetic field strength at each position at each time, we find at and at as the conservative lower limits, where . Therefore, it follows from the last line of equation (38) that the plasma skin depth is greater than at , which can be resolved by the present grid interval, there. Also at , we find that can be resolved by the grid interval there.
5.2 Horizontal magnetic field lines at the exact horizon
As figure 7 shows, the magentic field lines become horizontal at the exact horizon when magnetized plasmas accrete, if we adopt the Boyer-Lindquist coordinates. Similar configuration of the lines of force also appear for the electric field when two oppositely charged particles are separated near the horizon (fig. 17 of § II D 5 in Thorne et al., 1986). Nevertheless, if we introduce the ‘stretched horizon’ slightly above the true horizon and consider the physics only outside of the stretched horizon, we obtain horizon-penetrating lines of force at finite elapsed time. After an infinite time elapses, the stretched horizon eventually matches the true horizon.
Although the time-dependent magnetic lines of force is kept horizontal at the true horizon within a finite time, it does not mean that the BH’s rotational energy can be extracted only at infinite elapsed time. This is because the magnetized plasmas fall onto the horizon with negative energies, which realizes outward Poynting flux continuously in space. In figure 17, we present the BZ flux measured at much smaller radius . Note that the coordinate time (i.e., the abscissa) corresponds to the proper time of a distant static observer. By virtue of the time-dependent in-falling motion of magnetized plasmas with negative energies (see e.g., Hirotani et al., 1992; McKinney et al., 2012, for the MHD Penrose proess), comparable amount of energy is carried outward at both and along individual magnetic flux tubes.
5.3 Formation of limb-brightened jets
Finally, let us briefly discuss how the middle-latitude concentration of the Poynting flux could result in the formation of limb-brightened jets, which were observed from Mrk 501 (Giroletti et al., 2004), M87 (Hada et al., 2016), Cyg A (Boccardi et al., 2016), 3C84 (Kim et al., 2019), PG 1553+113 (Lico et al., 2020), NGC315 (Park et al., 2021), and Cen A (Janssen et al., 2021).
In the present paper, we assumed that a nearly cylindrical magnetic field lines are sustained by a strong, equatorial ring current at a large distance from the BH, and superposed the electromagnetic fields created by the magnetospheric currents near the BH, using a PIC method. However, it is unrealistic to consider that such a ring current (that creates the Wald fields) would exist at much larger distance than the jet downstream region. Thus, it is natural that the external Wald field is maintained only near the BH. Nevertheless, we could concatenate our PIC results (obtained near the BH) with the downstream region (far away from the BH), assuming e.g., that the time-averaged luminosity (i.e., Poynting flux times cross section) carried along each magnetic flux tube is constant as a function of the distance from the BH. Near the BH, we demonstrated that the Poynting flux is tiny in the higher latitudes. Thus, it is possible that a hollow jet is formed in the sense that the Poynting flux is small along the jet axis. In the subsequent paper, we will convert the Poynting flux as a function of the magnetic flux function, , near the BH, and quantitatively argue the formation of limb-brightened jets at large distances from the BH.
References
- Bardeen (1970) Bardeen, J. M. 1970, Nature, 226, 64, doi: 10.1038/226064a0
- Beskin et al. (1992) Beskin, V. S., Istomin, Y. N., & Parev, V. I. 1992, Soviet Ast., 36, 642
- Blandford & Königl (1979) Blandford, R. D., & Königl, A. 1979, ApJ, 232, 34, doi: 10.1086/157262
- Blandford & Znajek (1977) Blandford, R. D., & Znajek, R. L. 1977, MNRAS, 179, 433, doi: 10.1093/mnras/179.3.433
- Boccardi et al. (2016) Boccardi, B., Krichbaum, T. P., Bach, U., et al. 2016, A&A, 585, A33, doi: 10.1051/0004-6361/201526985
- Boyer & Lindquist (1967) Boyer, R. H., & Lindquist, R. W. 1967, Journal of Mathematical Physics, 8, 265, doi: 10.1063/1.1705193
- Bransgrove et al. (2021) Bransgrove, A., Ripperda, B., & Philippov, A. 2021, Phys. Rev. Lett., 127, 055101, doi: 10.1103/PhysRevLett.127.055101
- Chen & Yuan (2020) Chen, A. Y., & Yuan, Y. 2020, ApJ, 895, 121, doi: 10.3847/1538-4357/ab8c46
- Crinquand et al. (2021) Crinquand, B., Cerutti, B., Dubus, G., Parfrey, K., & Philippov, A. 2021, A&A, 650, A163, doi: 10.1051/0004-6361/202040158
- Crinquand et al. (2020) Crinquand, B., Cerutti, B., Philippov, A. e., Parfrey, K., & Dubus, G. 2020, Phys. Rev. Lett., 124, 145101, doi: 10.1103/PhysRevLett.124.145101
- Dhawan et al. (2000) Dhawan, V., Mirabel, I. F., & Rodríguez, L. F. 2000, ApJ, 543, 373, doi: 10.1086/317088
- Fender et al. (2004) Fender, R. P., Belloni, T. M., & Gallo, E. 2004, MNRAS, 355, 1105, doi: 10.1111/j.1365-2966.2004.08384.x
- Ford et al. (2018) Ford, A. L., Keenan, B. D., & Medvedev, M. V. 2018, Phys. Rev. D, 98, 063016, doi: 10.1103/PhysRevD.98.063016
- Gallo et al. (2005) Gallo, E., Fender, R. P., & Hynes, R. I. 2005, MNRAS, 356, 1017, doi: 10.1111/j.1365-2966.2004.08503.x
- Giroletti et al. (2004) Giroletti, M., Giovannini, G., Feretti, L., et al. 2004, ApJ, 600, 127, doi: 10.1086/379663
- Hada et al. (2016) Hada, K., Kino, M., Doi, A., et al. 2016, ApJ, 817, 131, doi: 10.3847/0004-637X/817/2/131
- Hirotani (2005) Hirotani, K. 2005, ApJ, 619, 73, doi: 10.1086/426497
- Hirotani et al. (2021) Hirotani, K., Krasnopolsky, R., Shang, H., Nishikawa, K.-i., & Watson, M. 2021, ApJ, 908, 88, doi: 10.3847/1538-4357/abd3a6
- Hirotani & Okamoto (1998) Hirotani, K., & Okamoto, I. 1998, ApJ, 497, 563, doi: 10.1086/305479
- Hirotani & Pu (2016) Hirotani, K., & Pu, H.-Y. 2016, ApJ, 818, 50, doi: 10.3847/0004-637X/818/1/50
- Hirotani et al. (2016) Hirotani, K., Pu, H.-Y., Lin, L. C.-C., et al. 2016, ApJ, 833, 142, doi: 10.3847/1538-4357/833/2/142
- Hirotani et al. (2017) —. 2017, ApJ, 845, 77, doi: 10.3847/1538-4357/aa7895
- Hirotani et al. (2018) Hirotani, K., Pu, H.-Y., Outmani, S., et al. 2018, ApJ, 867, 120, doi: 10.3847/1538-4357/aae47a
- Hirotani et al. (1992) Hirotani, K., Takahashi, M., Nitta, S.-Y., & Tomimatsu, A. 1992, ApJ, 386, 455, doi: 10.1086/171031
- Hjellming & Johnston (1988) Hjellming, R. M., & Johnston, K. J. 1988, ApJ, 328, 600, doi: 10.1086/166318
- Ichimaru (1977) Ichimaru, S. 1977, ApJ, 214, 840, doi: 10.1086/155314
- Jackson (1962) Jackson, J. D. 1962, Classical Electrodynamics
- Janssen et al. (2021) Janssen, M., Falcke, H., Kadler, M., et al. 2021, Nature Astronomy, doi: 10.1038/s41550-021-01417-w
- Jones et al. (1974a) Jones, T. W., O’Dell, S. L., & Stein, W. A. 1974a, ApJ, 188, 353, doi: 10.1086/152724
- Jones et al. (1974b) —. 1974b, ApJ, 192, 261, doi: 10.1086/153057
- Katsoulakos & Rieger (2020) Katsoulakos, G., & Rieger, F. M. 2020, ApJ, 895, 99, doi: 10.3847/1538-4357/ab8fa1
- Kim et al. (2019) Kim, J. Y., Krichbaum, T. P., Marscher, A. P., et al. 2019, A&A, 622, A196, doi: 10.1051/0004-6361/201832920
- Kino et al. (2014) Kino, M., Takahara, F., Hada, K., & Doi, A. 2014, ApJ, 786, 5, doi: 10.1088/0004-637X/786/1/5
- Kisaka et al. (2020) Kisaka, S., Levinson, A., & Toma, K. 2020, ApJ, 902, 80, doi: 10.3847/1538-4357/abb46c
- Koide et al. (2002) Koide, S., Shibata, K., Kudoh, T., & Meier, D. L. 2002, Science, 295, 1688, doi: 10.1126/science.1068240
- Langdon & Lasinski (1976) Langdon, A. B., & Lasinski, B. F. 1976, in Controlled Fusion, 327–366
- Levinson (2000) Levinson, A. 2000, Phys. Rev. Lett., 85, 912, doi: 10.1103/PhysRevLett.85.912
- Levinson & Cerutti (2018) Levinson, A., & Cerutti, B. 2018, A&A, 616, A184, doi: 10.1051/0004-6361/201832915
- Levinson & Rieger (2011) Levinson, A., & Rieger, F. 2011, ApJ, 730, 123, doi: 10.1088/0004-637X/730/2/123
- Levinson & Segev (2017) Levinson, A., & Segev, N. 2017, Phys. Rev. D, 96, 123006, doi: 10.1103/PhysRevD.96.123006
- Lico et al. (2020) Lico, R., Liu, J., Giroletti, M., et al. 2020, A&A, 634, A87, doi: 10.1051/0004-6361/201936564
- Lobanov (1998) Lobanov, A. P. 1998, A&A, 330, 79. https://arxiv.org/abs/astro-ph/9712132
- Mahadevan (1997) Mahadevan, R. 1997, ApJ, 477, 585, doi: 10.1086/303727
- Marscher (1983) Marscher, A. P. 1983, ApJ, 264, 296, doi: 10.1086/160597
- McKinney et al. (2012) McKinney, J. C., Tchekhovskoy, A., & Bland ford, R. D. 2012, MNRAS, 423, 3083, doi: 10.1111/j.1365-2966.2012.21074.x
- Mościbrodzka et al. (2011) Mościbrodzka, M., Gammie, C. F., Dolence, J. C., & Shiokawa, H. 2011, ApJ, 735, 9, doi: 10.1088/0004-637X/735/1/9
- Narayan et al. (2021) Narayan, R., Chael, A., Chatterjee, K., Ricarte, A., & Curd, B. 2021, arXiv e-prints, arXiv:2108.12380. https://arxiv.org/abs/2108.12380
- Narayan & Yi (1994) Narayan, R., & Yi, I. 1994, ApJ, 428, L13, doi: 10.1086/187381
- Nishikawa et al. (2021) Nishikawa, K., DuÅ£an, I., Köhn, C., & Mizuno, Y. 2021, Living Reviews in Computational Astrophysics, 7, 1, doi: 10.1007/s41115-021-00012-0
- Parfrey et al. (2019) Parfrey, K., Philippov, A., & Cerutti, B. 2019, Phys. Rev. Lett., 122, 035101, doi: 10.1103/PhysRevLett.122.035101
- Park et al. (2021) Park, J., Hada, K., Nakamura, M., et al. 2021, ApJ, 909, 76, doi: 10.3847/1538-4357/abd6ee
- Ptitsyna & Neronov (2016) Ptitsyna, K., & Neronov, A. 2016, A&A, 593, A8, doi: 10.1051/0004-6361/201527549
- Punsly (1996) Punsly, B. 1996, ApJ, 467, 105, doi: 10.1086/177588
- Reynolds et al. (1996) Reynolds, C. S., Fabian, A. C., Celotti, A., & Rees, M. J. 1996, MNRAS, 283, 873, doi: 10.1093/mnras/283.3.873
- Stirling et al. (2001) Stirling, A. M., Spencer, R. E., de la Force, C. J., et al. 2001, MNRAS, 327, 1273, doi: 10.1046/j.1365-8711.2001.04821.x
- Tchekhovskoy et al. (2010) Tchekhovskoy, A., Narayan, R., & McKinney, J. C. 2010, ApJ, 711, 50, doi: 10.1088/0004-637X/711/1/50
- Tchekhovskoy et al. (2011) —. 2011, MNRAS, 418, L79, doi: 10.1111/j.1745-3933.2011.01147.x
- Thorne et al. (1986) Thorne, K. S., Price, R. H., & MacDonald, D. A. 1986, Black holes: The membrane paradigm
- Villasenor & Buneman (1992) Villasenor, J., & Buneman, O. 1992, Computer Physics Communications, 69, 306, doi: 10.1016/0010-4655(92)90169-Y
- Wald (1974) Wald, R. M. 1974, Phys. Rev. D, 10, 1680, doi: 10.1103/PhysRevD.10.1680
- Wardle et al. (1998) Wardle, J. F. C., Homan, D. C., Ojha, R., & Roberts, D. H. 1998, Nature, 395, 457, doi: 10.1038/26675
- Wong et al. (2021) Wong, G. N., Ryan, B. R., & Gammie, C. F. 2021, ApJ, 907, 73, doi: 10.3847/1538-4357/abd0f9
- Yuan & Narayan (2014) Yuan, F., & Narayan, R. 2014, ARA&A, 52, 529, doi: 10.1146/annurev-astro-082812-141003