GOALS-JWST: Mid-Infrared Spectroscopy of the Nucleus of NGC 7469
Abstract
We present mid-infrared spectroscopic observations of the nucleus of the nearby Seyfert galaxy NGC 7469 taken with the MIRI instrument on the James Webb Space Telescope (JWST) as part of Directors Discretionary Time Early Release Science (ERS) program 1328. The high resolution nuclear spectrum contains 19 emission lines covering a wide range of ionization. The high ionization lines show broad, blueshifted emission reaching velocities up to 1700 km s-1 and FWHM ranging from km s-1. The width of the broad emission and the broad to narrow line flux ratios correlate with ionization potential. The results suggest a decelerating, stratified, AGN driven outflow emerging from the nucleus. The estimated mass outflow rate is one to two orders of magnitude larger than the current black hole accretion rate needed to power the AGN. Eight pure rotational H2 emission lines are detected with intrinsic widths ranging from FWHM km s-1. We estimate a total mass of warm H2 gas of M⊙ in the central 100 pc. The PAH features are extremely weak in the nuclear spectrum, but a m PAH feature with an equivalent width m and a flux of W m-2 is detected. The spectrum is steeply rising in the mid-infrared, with a silicate strength , significantly smaller than seen in most PG QSOs, but comparable to other Seyfert 1’s. These early MIRI mid-infrared IFU data highlight the power of JWST to probe the multi-phase interstellar media surrounding actively accreting supermassive black holes.
1 Introduction
Luminous Infrared Galaxies (LIRGs), with thermal IR[8-1000 m] dust emission in excess of 1011 L⊙, are ideal laboratories for studying star formation and black hole growth in the local Universe. The bolometric luminosity of most LIRGs is dominated by massive bursts of star formation, but also show a wide range of contributions from Active Galactic Nuclei (AGN) which become increasingly important at the highest luminosities (Petric et al., 2011; Stierwalt et al., 2013, 2014). Multi-wavelength observations have shown that local LIRGs are a mixture of single disk galaxies, interacting systems, and advanced mergers (Stierwalt et al., 2013; Kim et al., 2013; Larson et al., 2016).
Our understanding of the energetics and evolutionary states of LIRGs at low and high-redshifts was greatly expanded through studies with the Infrared Spectrograph (IRS - see Houck et al., 2004) on the Spitzer Space Telescope (see Armus et al., 2020, for a summary). While Spitzer was extremely efficient and capable of deep as well as large area photometric and spectroscopic surveys, it was ultimately limited in sensitivity and spatial resolution by its modest 0.85m primary mirror. With the successful launch and commissioning of the James Webb Space Telescope (JWST), and its 1-2 orders of magnitude gain in both sensitivity, and spatial and spectral resolution over Spitzer, we are now poised to greatly extend our understanding of dusty star-forming regions, nascent AGN, galactic outflows, and all variety of active galaxies over an extremely large stretch of cosmic time. To highlight the power of JWST to explore the inner regions of nearby LIRGs, we have undertaken a Director’s Discretionary Time, Early Release Science (ERS) program (1328 - PI’s Armus, L., Evans, A.S.) to obtain near and mid-infrared images and spectra of four LIRGs drawn from the Great Observatories All-Sky LIRG Survey (GOALS - Armus et al., 2009). GOALS uses multi-wavelength observations from the ground and space to understand the physical conditions in over 200 low-redshift () LIRGs selected from the Revised IRAS Bright Galaxy Sample (Sanders et al., 2003). This paper highlights some of the first results from ERS program 1328, “A JWST Study of the Starburst-AGN Connection in Merging Luminous Infrared Galaxies”.
NGC 7469 (IRAS 23007+0836; UGC 12332) contains a Seyfert 1.5 nucleus surrounded by a bright, circumnuclear ring of star formation with a radius of 1.8” (580 pc). The total infrared luminosity of NGC 7469 is L⊙. It is a nearly face-on spiral, about 26 kpc away in projection from an inclined companion galaxy (IC 4283) with a highly disturbed morphology. NGC 7469 has a supermassive black hole mass of M⊙, measured through reverberation mapping (Peterson et al., 2004). The starburst ring is visible at multiple wavelengths, with a large number of star forming regions having a bi-modal age distribution (Díaz-Santos et al., 2007). There is evidence for a highly ionized, outflowing wind on small and large scales (U et al., 2019; Müller-Sánchez et al., 2011; Robleto-Orús et al., 2021). The mid-infrared Spitzer spectrum of NGC 7469 shows a mix of strong Poly-cyclic Aromatic Hydrocarbon (PAH) emission features, high-ionization lines, and warm molecular gas, indicative of a complex, composite source powered by an active nucleus and a starburst (Inami et al., 2013; Stierwalt et al., 2014). High resolution observations of CO(), CO() and [CI] in the inner 2 kpc region with ALMA show largely rotational kinematics and a large mass of molecular gas (Izumi et al., 2020; Nguyen et al., 2021). With a central AGN, a circumnuclear starburst ring, a high velocity outflow, and a dusty, gas rich ISM, NGC 7469 is an ideal laboratory for studying the co-evolution of galaxies and supermassive black holes at high resolution with JWST.
Here, we present JWST integral field spectroscopic observations of the nucleus of NGC 7469 with the Mid-Infrared Instrument (MIRI; Rieke et al., 2015; Labiano et al., 2021). The high spectral-spatial resolution enables us to map the physical properties and kinematics of the atomic and warm molecular gas as well as the dust on sub-kpc scales in the mid-infrared for the first time. Specifically, the Integral Field Unit (IFU) data allow us to separately extract and analyze high signal-to-noise, mid-infrared spectra of the starburst ring, the inner ISM, and the central AGN. The ring spectra are presented in Lai et al. (2022). Spectra of the circumnuclear ISM are presented in U et al. (2022). Here, we focus on the MIRI spectra of the central active nucleus. Throughout this paper, we adopt km s-1 Mpc-1, = 0.30, and = 0.70. At the distance of NGC 7469, 70.6 Mpc (), 1″subtends a projected linear scale of 330 pc.
2 Observations and Data Reduction
Observations of NGC 7469 were taken with MIRI in Medium Resolution Spectroscopy (MRS) mode on 2022 July 3-4 UT. The observations covered the full m range using the short (A), medium (B), and long (C) sub-bands in all four channels. The FASTR1 readout pattern was used to optimize the dynamic range in the observations. The total exposure time per sub-band was 444 seconds, using 40 groups per integration and a 4-pt dither pattern. Because NGC 7469 is extended, dedicated background observations with the same observational parameters in all three grating settings were obtained. MIRI imaging observations were taken using three filters, F560W, F770W, and F1500W, using a cycling three point dither pattern. Data were collected with both the full imaging field of view (74″″) and with the SUB128 subarray mode (14.1″″) to recover a non-saturated image of the bright nucleus. The total exposure times are 309s, 101s, and 101s and 46s, 48s, and 48s for the F560W, F770W, F1500W filters and full and sub-array modes respectively. The MIRI and NIRCam imaging of the starburst ring in NGC 7469 will be presented in Bohn et al. (2022).
Data for the science and background observations were processed with the JWST Science Calibration Pipeline Bushouse et al. (2022) version 1.6 in batch mode. The Detector1 pipeline applies detector-level corrections and ramp fitting to the individual exposures. The output rate images were subsequently processed outside the JWST pipeline to flag newly-acquired bad pixels and additional cosmic ray artifacts, and to remove vertical stripes and zero point residuals remaining after the pipeline dark subtraction. These additional corrections broadly follow the steps taken for JWST ERO observations as described by Pontoppidan et al. (2022). The resulting rate files are then processed with the JWST Spec2 pipeline for distortion and wavelength calibration, flux calibration, and other 2d detector level steps. Stage 3 processing (Spec3) performs background subtraction before combining data from multiple exposures into the final data cubes. Background light is subtracted from the 2-D science images using a master background frame generated from our associated background observations. The master background is a 1-D median sigma-clipped spectrum calculated over the FOV of the background observations and projected to the entire 2-D detector array. Residual fringe corrections using prototype pipeline code have been applied to both the Stage 2 products and to the 1-D spectra resulting from Stage 3 processing after spectral extraction (see below).
| Feature ID | IP | Flux | FWHM | |
|---|---|---|---|---|
| ) | (eV) | ) | ( ) | |
| H2 S(8) | 5.053 | 0.64 (0.17) | 268 (47) | |
| 5.062 | 7.9 | 0.38 (0.07) | ||
| HeII | 5.228 | 24.6 | 1.29 (0.19) | 298 (33) |
| 5.340 | 7.9 | 1.31 (0.07) | 234 (11) | |
| 5.447 | 124 | 1.98 (0.28) | 372 (26) | |
| 4.09 (0.36) | 1095 (63) | |||
| 5.503 | 186.5 | 1.03 (0.32) | 189 (32) | |
| 4.05 (0.42) | 621 (36) | |||
| H2 S(7) | 5.511 | 1.45 (0.15) | 124 (18) | |
| 5.610 | 109.2 | 3.51 (0.33) | 231 (11) | |
| 9.66 (0.41) | 726 (22) | |||
| H2 S(6) | 6.11 | 0.53 (0.05) | 175 (12) | |
| 6.2 PAH | 6.22 | 27.1 (0.2) | ||
| H2 S(5) | 6.910 | 3.05 (0.11) | 188 (5) | |
| 6.985 | 15.8 | 13.48 (0.61) | 261 (10) | |
| 7.318 | 47.3 | 1.76 (0.17) | 427 (29) | |
| 7.652 | 126.2 | 26.7 (1.99) | 309 (13) | |
| 18.0 (2.25) | 962 (64) | |||
| H2 S(4) | 8.025 | 1.59 (0.23) | 214 (23) | |
| 8.991 | 27.6 | 7.00 (2.78) | 291 (38) | |
| 5.31 (1.47) | 563 (156) | |||
| 9.527 | 99.1 | 2.07 (0.69) | 237 (34) | |
| 2.35 (0.74) | 631 (197) | |||
| H2 S(3) | 9.665 | 2.94 (0.63) | 265 (43) | |
| 10.511 | 34.8 | 22.86 (0.99) | 299 (9) | |
| 10.9 (1.40) | 667 (65) | |||
| H2 S(2) | 12.279 | 2.71 (0.51) | 202 (29) | |
| 12.814 | 21.6 | 49.62 (3.62) | 313 (14) | |
| 14.322 | 97.1 | 41.77 (3.64) | 259 (13) | |
| 32.68 (4.51) | 814 (62) | |||
| 15.555 | 41.0 | 91.61 (4.65) | 287 (8) | |
| 45.85 (4.79) | 920 (38) | |||
| H2 S(1) | 17.035 | 4.16 (1.95) | 331 (140) | |
| 17.936 | 7.9 | 2.46 (0.97) | 319 (90) | |
| 18.713 | 23.3 | 46.77 (1.37) | 207 (5) | |
| 24.318 | 97.1 | 42.48 (4.07) | 224 (12) | |
| 34.82 (6.24) | 861 (85) | |||
| 25.890 | 54.9 | 151.73 (26.31) | 261 (20) | |
| 96.4 (34.61) | 706 (165) |
Note. — Basic properties of the emission lines measured in the JWST/MIRI MRS nuclear spectrum of NGC 7469. Column 1: Feature ID; Column 2: rest wavelength (m); Column 3: line flux ( W m-2); Column 4: intrinsic FWHM (km s-1) after subtraction of the instrumental broadening. Lines that have been fit with an additional broad component have a second entry row. One-sigma uncertainties in the fitted quantities are given in parentheses. The m emission feature is a series of resolved components, not a single emission line, so does not have an entry in Column 4.
3 Results
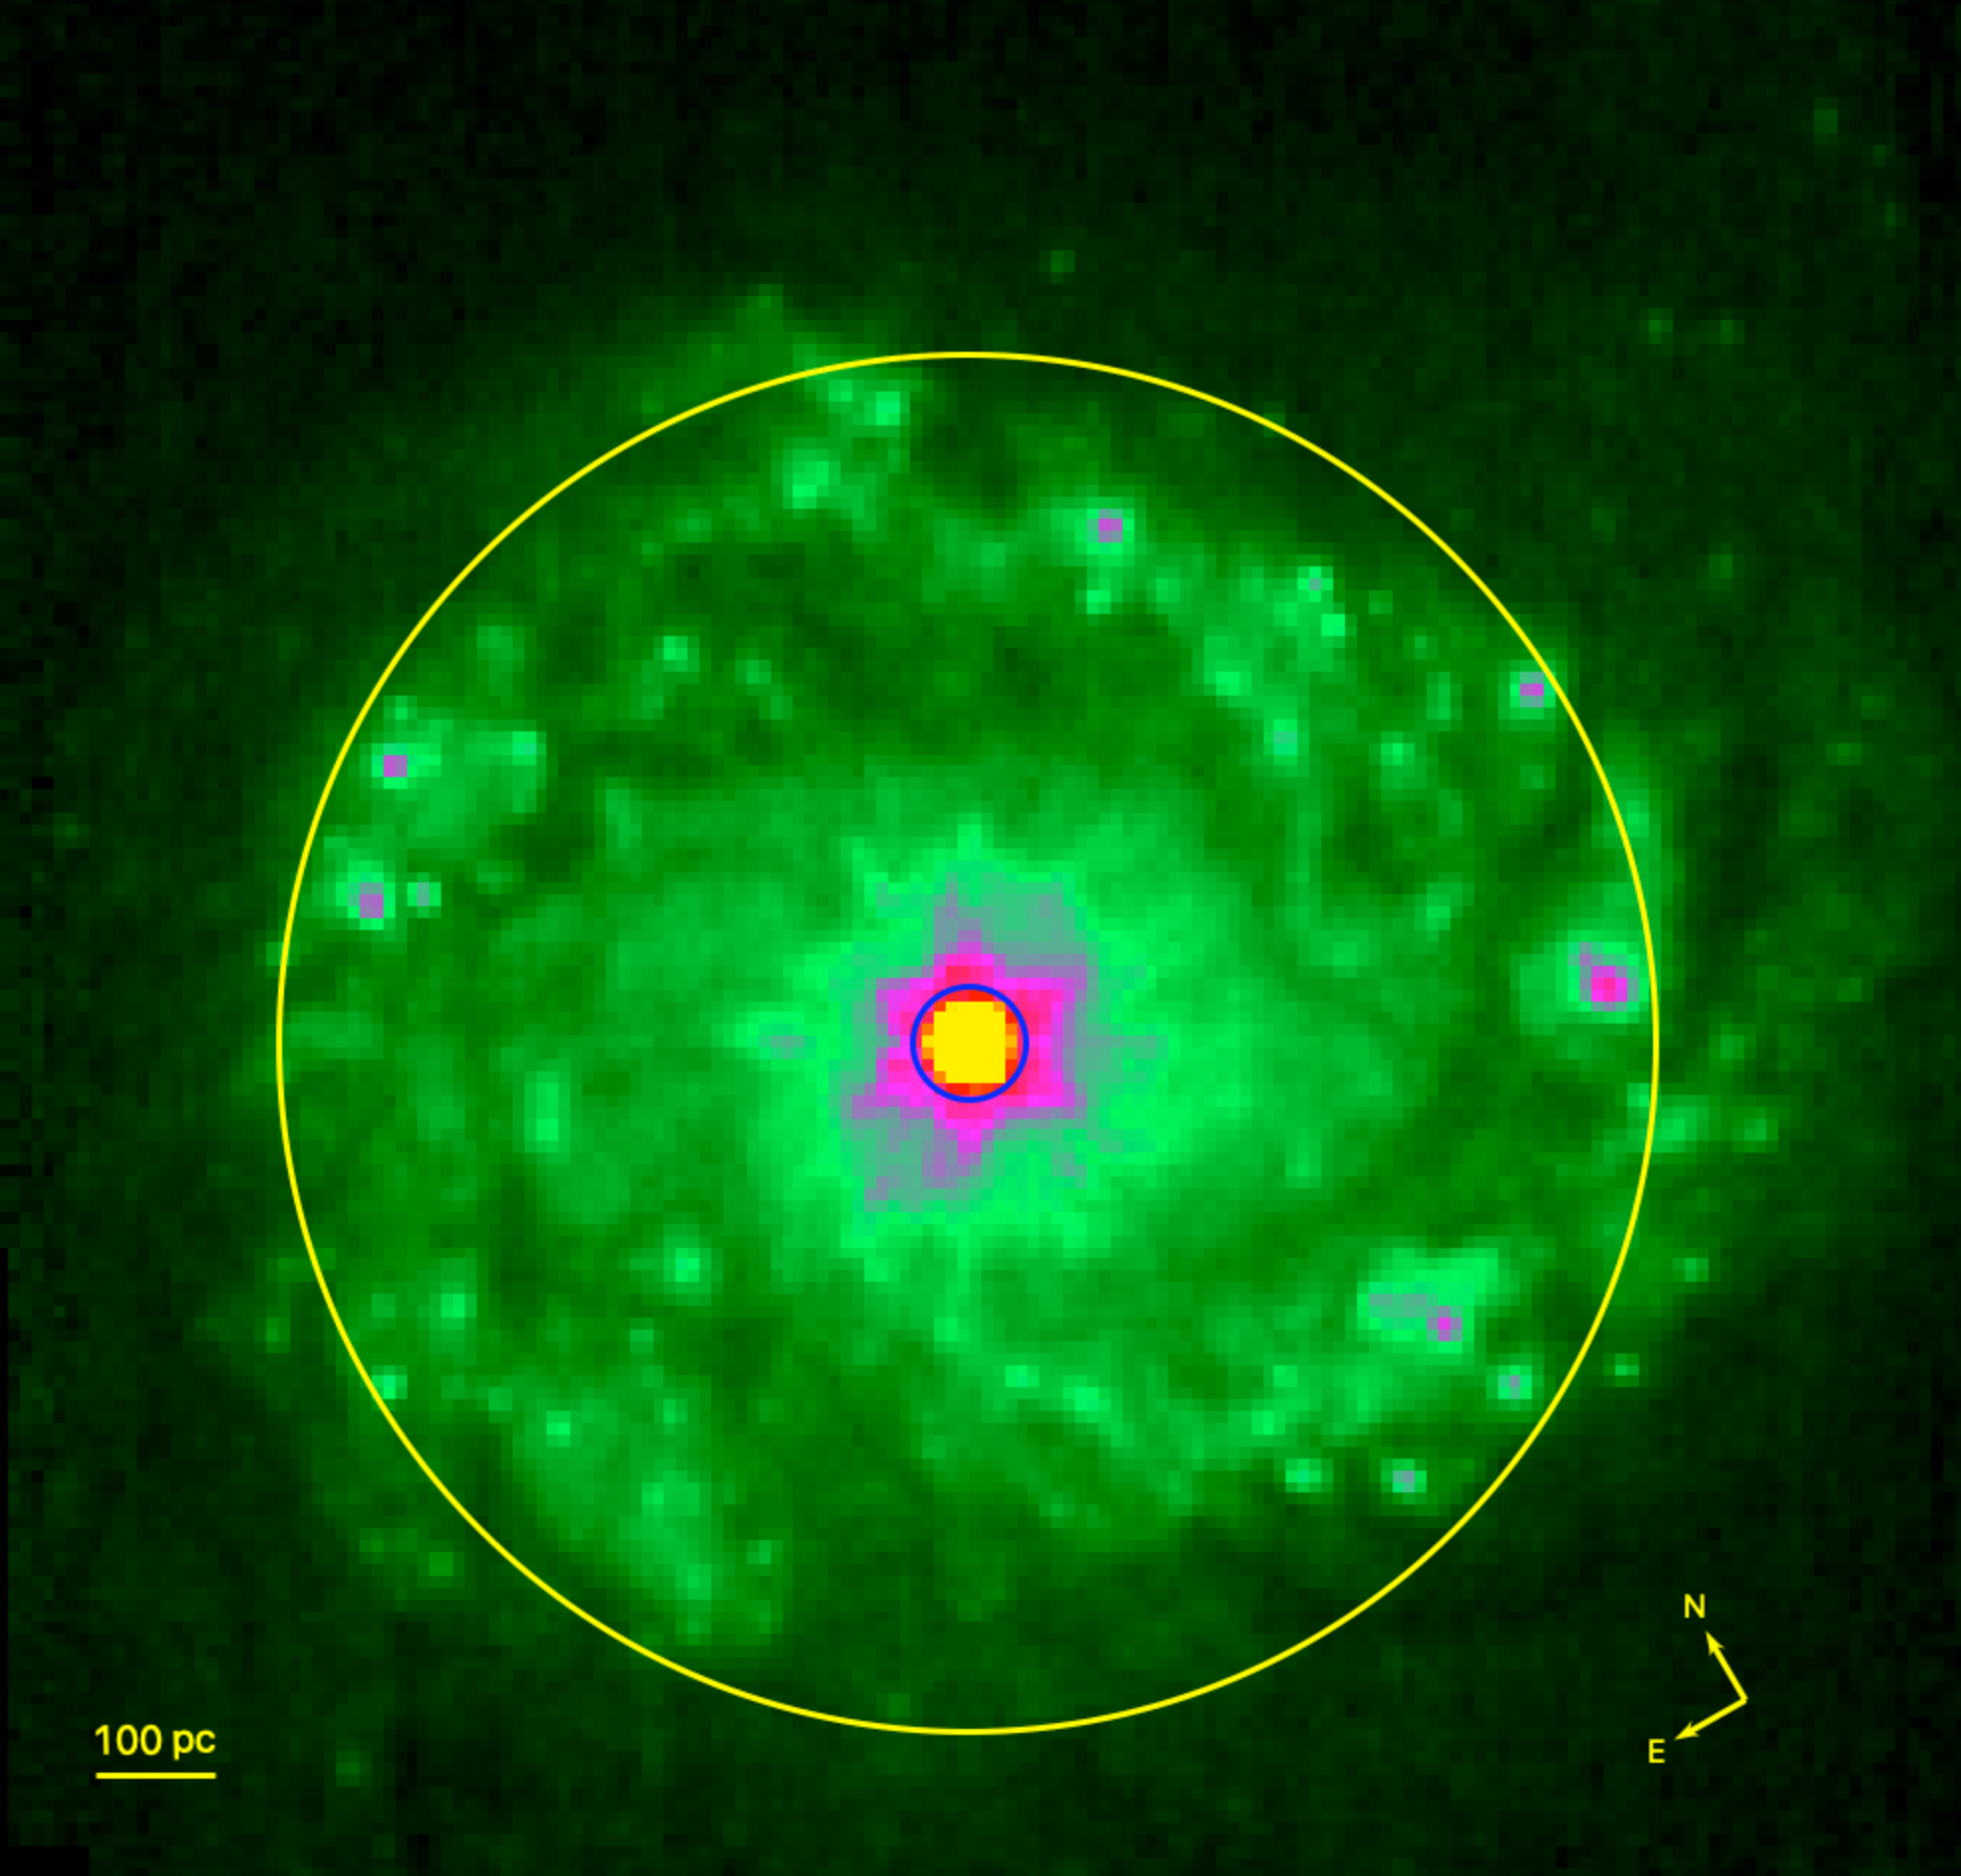
We have extracted two spectra from the NGC 7469 MRS data cubes. The first, hereafter the “total” spectrum, is defined as the largest cylindrical aperture that covers the full wavelength extent of MIRI. This aperture has a radius of 1.8″, centered on the nucleus. The second extraction, meant to isolate the central AGN, is also centered on the nucleus, but with a one FWHM diameter (0.3″at m) expanding cone. Because this nuclear aperture is fairly small and dominated by the central AGN by design, a wavelength-dependent aperture correction, constructed from standard star observations has been applied to the data before measuring emission line fluxes. Both apertures are drawn on the NIRCAM F150W sub-array image in Fig. 1.
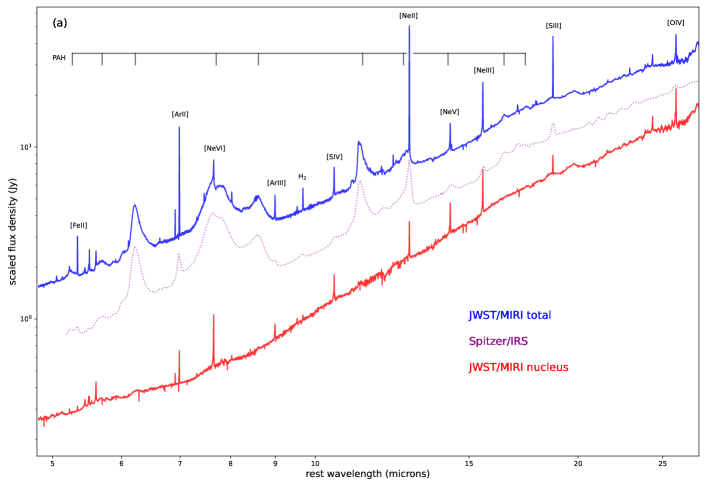
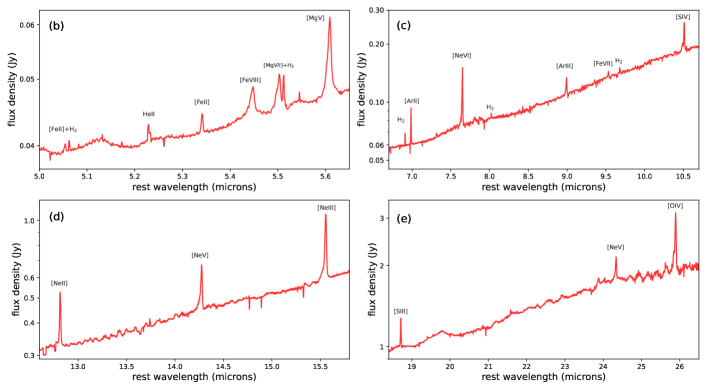
The two NGC 7469 MIRI spectra are shown in Fig. 2, along with the low-resolution spectrum from Stierwalt et al. (2013) for comparison. The Spitzer/IRS spectrum is derived from a single pointing on the nucleus with the short-low (3.6″wide) and long-low (10.5″wide) slits. As in the Spitzer spectrum, the total NGC 7469 MIRI spectrum is dominated by PAH emission features (complexes) at 6.2, 7.7, 8.6, 11.3 and 12.6m. There are also weaker PAH features at 5.3, 14.2, 16.4 and 17.4m. In addition, strong, narrow atomic fine structure emission lines from a variety of species such as Fe, Ne, Ar, Si, S, O, Mg, and Na, are visible. Emission lines from a number of rotational transitions of warm H2 are also seen throughout the spectrum. The brightest of these atomic and molecular gas emission lines were visible in the Spitzer data, but the MIRI spectrum reveals many more lines, and the greatly increased resolving power allows the shapes of the mid-infrared lines and hence the dynamics of the atomic and warm molecular gas, to be analyzed in detail for the first time.
Of particular note is that the NGC 7469 nuclear spectrum shows a striking lack of strong PAH emission, and an abundance of high ionization lines, tracing the hard ionizing radiation field emerging from the AGN. There are also eight H2 emission lines present in the nuclear spectrum indicative of warm molecular gas. Finally, there is a slight blue upturn in the nuclear spectrum shortward of about m that may signal the presence of very warm dust heated by the AGN. The comparison of the two JWST/MIRI spectra demonstrates that in the total spectrum, as in the Spitzer/IRS spectrum, the PAH emission is dominated by the starburst ring, while most of the high-ionization lines (not surprisingly) are coming from the nucleus. The H2 emission emerges from the ring and the nucleus. The properties of the outflow and the dust and gas in the starburst ring as traced with MIRI, are discussed in U et al. (2022) and Lai et al. (2022), respectively. Here we concentrate on the properties of the high resolution nuclear spectrum and what they reveal about the AGN and the wind.
3.1 Ionized Gas
We detect emission lines from the nucleus of NGC 7469 spanning a wide range of ionization states, from [FeII] with IP=7.9 eV to [MgVII] with IP=186.5 eV, allowing us to explore properties of the circumnuclear atomic gas as a function of ionization. The coronal lines are strong in the nucleus of NGC 7469. The [NeV]/[NeII] and [OIV]/[NeII] line flux ratios are 1.5, and 5.0, respectively, comparable to the values seen in nearby AGN and AGN-dominated ULIRGs with and Spitzer (Genzel et al., 1998; Lutz et al., 2000; Sturm et al., 2002; Armus et al., 2004; Weedman et al., 2005; Armus et al., 2007).
Because of the high spectral resolving power of MIRI, nearly all of the emission lines are resolved in the MRS nuclear spectrum. All lines show a strong narrow component that dominates the emission, while some show a more complex line profile. The narrow line widths, corrected for instrumental broadening, range from km s-1, with a median width of about 260 km s-1. While the wavelength calibration is still being refined for MRS, in most cases the centroids of the narrow line components are consistent with the systemic velocity of NGC 7469.
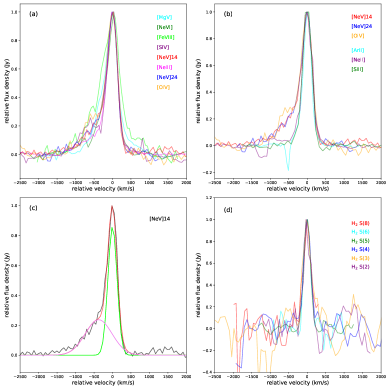
A large number of the emission line profiles exhibit broad, blue wings. This broad emission is prominent in the high-ionization, coronal lines (e.g. [NeV], [NeVI], [MgVII]) but absent from the low-ionization lines (e.g., [NeII]). The high velocity emission extends up to km s-1 blueward of the narrow component. There is little or no redshifted emission in the high-ionization lines, with the exception of [MgV] m and [FeVIII] m, which do show red wings extending out to about 1000 km s-1. We have fit all lines that show broad emission with a simple two-component Gaussian model profile to extract and compare the basic parameters of the components between lines. The broad components have FWHM that range from km s-1. While we designate these features as broad to facilitate a comparison to the narrow emission, they are far narrower than those from the canonical broad line region. The FWHM of the H broad line in NGC 7469 is over 4300 km s-1 (Peterson et al., 2004). The offsets between the centroids of the narrow and broad components range from km s-1. The fluxes and widths of the narrow and broad components are presented in Table 1 and a subset of the lines are shown scaled and shifted to a common velocity in Fig. 3. Because the line is very bright, the broad blueshifted emission in the [OIV] line was also seen in the Spitzer/IRS long-high spectrum of NGC 7469 (Inami et al., 2013), even though the spectral resolving power was only and the slit was extremely wide (including emission from the disk and starburst ring). The [NeIII] and [NeV] m lines were also resolved in the Spitzer spectra, with intrinsic widths of and km s-1, respectively.
3.2 Warm Molecular Gas
The MIRI MRS spectrum of the nucleus of NGC 7469 reveals the presence of a number of pure rotational emission lines of H2 that trace the warm molecular gas in the vicinity of the AGN. Eight transitions are detected in the spectrum, with fluxes ranging from W m-2. All the H2 lines are resolved, with intrinsic line widths (FWHM) ranging from km s-1. The median line width is km s-1 FWHM. None of the H2 emission lines show the broad, blueshifted emission seen in the high ionization lines (see Fig. 3). The widths of the H2 lines are comparable to, or less than, those of the low ionization atomic lines. The S(1) line is the broadest, but its width is highly uncertain.
Following Togi & Smith (2016), we have fit the H2 line fluxes with a power-law, temperature dependent excitation function to estimate the characteristic gas temperature and implied mass. The power-law index is 4.55, and there is approximately M⊙ of warm gas at T 200K, and an extrapolated mass (down to 50K) of M⊙ in a 0.3″diameter aperture. The latter is approximately 0.4% of the total estimated H2 mass within a radius of 2.5″in NGC 7469 (Davies et al., 2004; Izumi et al., 2020) and 18% the estimated H2 mass within a radius of 0.2″(Izumi et al., 2020).
3.3 Dust
The strong PAH features that dominate the total mid-infrared spectrum of NGC 7469 are weak or absent from the nuclear spectrum (see Fig. 2). The spectrum does have some residual continuum noise that makes identification of very weak and broad PAH features difficult, but it is clear that the strong PAH emission seen in the total MIRI and Spitzer spectra is not present in the nuclear spectrum. This is consistent with the results of Lai et al. (2022) and Hönig et al. (2010). We do, however, detect a weak PAH feature at m with a flux of W m-2, and upper limits on the fluxes of the m and m PAH features of W m-2, and W m-2, respectively. The m nuclear flux is about 0.5% of the PAH emission in the “total” MIRI spectrum. Our 6.2/7.7 PAH flux ratio limit of does not allow us to confidently constrain the grain size, but the m PAH Equivalent Width (EQW) of m is within the range seen for other AGN (e.g., Spoon et al., 2007).
The NGC 7469 nuclear spectrum is steeply rising over much of the MIRI wavelength range with a slight inflection around m that may signal the presence of warm dust heated by the AGN. The 15 to m flux density ratio is . There is no indication of either strong silicate absorption or emission at m or m. The m silicate strength, as defined in Hao et al. (2007), is . This is significantly smaller than found for many nearby QSOs where silicate emission is common, larger than most Seyfert 2’s and ULIRGs where absorption dominates and the silicate strengths are negative, but consistent with other Seyfert 1 galaxies observed with Spitzer (Hao et al., 2005, 2007; Schweitzer et al., 2006; Netzer et al., 2007). For comparison, the silicate strength measured in the Spitzer spectrum of NGC 7469 is -0.14, indicative of a small apparent absorption, undoubtedly the result of a significant amount of optically thick dust from the starburst ring within the large Spitzer slit. The silicate strength together with the m PAH EQW places NGC 7469 between Class 1A and 1B objects in the diagnostic diagram of Spoon et al. (2007). The low silicate strength, weak PAH EQW and steep spectral slope may also indicate a contribution from ongoing star formation to the nuclear spectrum (Marshall et al., 2018).
4 Discussion
The high spectral resolution of the MIRI MRS data, together with the range of detected atomic and H2 lines allows us to probe the dynamics and ionization structure of the atomic gas and the warm molecular gas in NGC 7469 on scales of pc in the mid-infrared for the first time.
NGC7469 is known to have an outflowing, highly-ionized nuclear wind seen in the near-infrared [SiVI] coronal line on sub-arcsecond scales (Müller-Sánchez et al., 2011). The atomic gas measured with MIRI is most likely associated with this outflow. One striking difference, however, is that the MIRI data show gas moving at much higher velocity than mapped in [SiVI], which reaches velocities of km s-1 at radii of about ″. Broad blueshifted emission extending to nearly km s-1 is seen in the central spaxel of the Keck/OSIRIS data, but the single Gaussian fits used to construct the outflow model are clearly dominated by slower moving gas at radii of pc. The high-ionization, high velocity gas in the JWST MIRI spectrum is also seen as a faint, Eastern extension in the [MgV] map produced by U et al. (2022).
The fact that the high velocity gas is most prominent in the coronal lines is consistent with an ionized, decelerating wind. In this picture, the more highly ionized gas is closer to the AGN and is moving at greater speeds. The enhanced blueshifted emission is a result of geometry and possibly extinction, with the receding gas being partially blocked by dust in the inner disk. Despite the high velocities, the bulk of the gas appears to be photoionized, as the [SIV]/[NeII], [NeIII]/[NeII] and the limit on the [FeII]/[OIV] ratios all imply that shock heating is negligible (Inami et al., 2013). It is likely that the coronal line gas we see in NGC 7469 may also be related to the high velocity, warm absorber and emission line gas inferred to exist on much smaller scales ( pc) by Grafton-Waters et al. (2020) through modeling of the XMM/RGS spectrum. Blueshifted coronal lines in the mid-infrared have been seen in nearby ULIRGs with powerful outflows (e.g., Spoon & Holt, 2009), and it is reminiscent of the kinematic structures seen in some Narrow-Line Seyfert Type-1 galaxies (NLSI’s) known as “blue outliers” (Komossa et al., 2008), typically identified via asymmetric optical [OIII] emission.
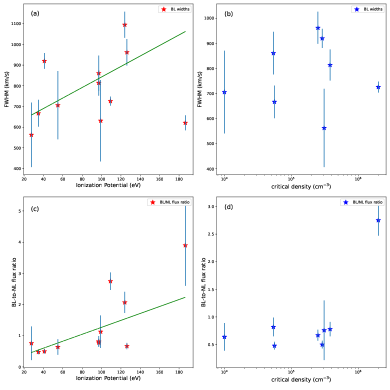
To better understand the NGC 7469 outflow probed with MIRI, we plot the broad line widths and the broad-to-narrow line flux ratios as a function of ionization potential and critical density in Fig. 4. With the exception of the [MgVII] line at m which is partially blended with H2 S(7), the broad line widths show a moderate correlation with ionization potential and the broad to narrow line flux ratio (Pearson’s r=0.58 and r=0.57, respectively). There is no correlation with critical density, but this is not surprising since the ratio of the [NeV] m and [NeV] m lines is ( for the broad lines alone), indicating the coronal line gas is in the low density limit with ncm-3 (see Alexander et al., 1999). The primary correlations of the line widths and relative fluxes are with ionization, similar to what is seen in NGC 1068 (Lutz et al., 2000). The correlations among fit components strengthen the picture of the simple model that is evident from the line profiles alone, namely that the prominence of the high velocity, mostly blueshifted gas among the coronal lines seen with MIRI suggests a decelerating, stratified, AGN driven outflow in NGC 7469.
To estimate the mass outflow rate in the coronal gas, we need to know the gas density, filling factor, maximum velocity and lateral surface area of the wind. From the [SiVI] emission, Müller-Sánchez et al. (2011) estimate a mass outflow rate of M⊙ yr-1, assuming a density of 5000 cm-3, and a filling factor of 0.001 together with a modeled wind area of pc2 and a maximum velocity of 130 km s-1. If the high velocity gas we see with JWST emerges in the wind over an area consistent with our aperture and the Eastern extension in U et al. (2022), and the gas has a maximum velocity of 1700 km s-1, a density of cm-3, and a filling factor of 0.001, then we would arrive at a mass outflow rate of M yr-1, significantly smaller than that estimated by Müller-Sánchez et al. (2011). The mass outflow rate is highly uncertain, but is still much larger that the gas accretion rate required to power the AGN. Using the scaling between [OIV] and the Black Hole Accretion Rate (BHAR) in Stone et al. (2022), we estimate a BHAR of M⊙yr-1, or roughly one to two orders of magnitude less than the mass outflow rate in the ionized wind.
As has been shown by Komossa & Xu (2007), the narrow line widths can be used as a surrogate for the stellar velocity dispersion and therefore used to estimate the black hole mass in Seyfert galaxies, once components associated with any outflowing gas are removed. While many of the lines show clear blueshifted emission in the MIRI MRS spectrum of NGC 7469, the narrow components have centroids consistent with the systemic velocity. This strong narrow line component can be used to estimate the mass of the central SMBH, assuming it dominates the dynamical mass in the sampled volume.
Correlations between the widths and luminosities of the mid-infrared [NeV] m and [OIV] m lines and the mass of the central SMBH have been established by Dasyra et al. (2008) using Spitzer/IRS data of a sample nearby Seyfert galaxies, including NGC 7469. Using the width of the narrow component of the [NeV] and [OIV] lines in the MIRI/MRS nuclear spectrum, we estimate a mass of M⊙, about half the value calculated from reverberation line estimates (Peterson et al., 2004), or one third the value estimated by Nguyen et al. (2021) from fits to the rotating central nuclear disk measured in [CI] and CO with ALMA. Similarly, the luminosities of the narrow lines imply SMBH masses of 4.4 and M⊙ for [NeV] and [OIV], respectively, or about a factor of 4-5 larger than the reverberation line esimate. As noted by Dasyra et al. (2008), a large Eddington ratio would lower the SMBH mass predicted from the [OIV] and [NeV] line luminosities perhaps bringing them more in line with the reverberation line estimate. The widths of the broad components in the MIRI/MRS nuclear spectrum imply SMBH masses that are a factor of 75-80 higher than measured by Peterson et al. (2004). This is consistent with our association of the high velocity gas with the outflow. Future studies of large samples of Seyfert galaxies with JWST, where outflowing and infalling gas can be identified and separated with the MIRI and NIRSpec IFUs, could provide a revised calibration of this correlation and a powerful tool to estimate SMBH masses in Seyfert galaxies.
The strong but relatively narrow H2 lines in the nuclear spectrum along with the relatively flat power law index suggest that warm molecular gas in the central pc is dominated by AGN heating. This is consistent with the relative dip in the line dispersion seen by U et al. (2022) on the nucleus. The fan-shaped structure to the Northwest seen as an enhancement in the H2 dispersion by U et al. (2022) may reveal molecular gas shock heated by the wind. The enhanced central [CI] emission has also been suggested as evidence for AGN heating of the circumnuclear gas in an XDR (Izumi et al., 2020). The near-infrared H2 line ratios can be explained by AGN heating or arise in dense gas illuminated by hot stars (Davies et al., 2005). If the m PAH emission seen in the nuclear spectrum is powered by star formation, then the implied star formation rate is M⊙ yr-1 (Pope et al., 2008), or less than 1% of the total star formation rate in NGC 7469.
5 Summary
We provide an analysis of the high-resolution, mid-infrared spectrum of the nucleus of NGC 7469 taken with the MIRI instrument onboard the James Webb Space Telescope. The rich set of emission features have provided a detailed picture of the dynamics and physical conditions of the ionized atomic and warm molecular gas, and the dust in inner pc of NGC 7469. Our results can be briefly summarized as follows:
-
1.
There are 19 identified emission lines covering a wide range of ionization potential up to 187 eV. The high ionization lines all show broad, blueshifted emission reaching up to -1700 km s-1 with respect to bright, narrow systemic emission. The broad, blueshifted emission is not seen in the low-ionization lines. The width of the broad emission and the broad to narrow line flux ratios correlate with ionization potential. We interpret the results as indicative of a decelerating, stratified, AGN driven outflow emerging from the NGC 7469 nucleus. The estimated mass outflow rate in the wind is significantly larger than the current black hole accretion rate needed to power the AGN.
-
2.
There are eight pure rotational H2 emission lines detected in the nuclear spectrum. The H2 lines have a median intrinsic FWHM km s-1, with none showing the broad, blueshifted emission seen in the high ionization atomic lines. We estimate there is a total mass of warm gas of M⊙ in the central 100pc. The high temperature and relatively narrow H2 lines in the nuclear spectrum suggest that this warm molecular gas is heated by the AGN.
-
3.
The PAH features that dominate the total mid-infrared spectrum of NGC 7469 are significantly weaker in the nuclear spectrum. We detect a m feature with an EQW m and a flux of Wm-2. If the PAH emission in the nuclear spectrum is a result of star formation, then the implied star formation rate is M⊙ yr-1, or less than 1% of the total star formation rate in NGC 7469.
-
4.
The NGC 7469 nuclear spectrum is steeply rising over the MIRI wavelength range. There is no indication of strong silicate absorption or emission at m. The measured silicate strength is , significantly smaller than found for many nearby QSOs, but consistent with other Seyfert 1’s.
The mid-infrared, nuclear spectrum of NGC 7469 presented here demonstrates the power of MIRI/MRS to disentangle the complex excitation and kinematic properties in the circumnuclear environments of nearby merging galaxies that are both feeding AGN and rapidly producing stars. These regions are inherently multi-phase, and the ability to spatially and spectrally resolve the atomic and molecular gas emission as well as the dust in these galaxies is a unique ability made possible with infrared integral field spectrographs on JWST. Planned and future JWST observations of NGC 7469 and other nearby LIRGs and Seyfert galaxies will undoubtedly shed even more light on feeding and feedback at the centers of rapidly evolving galaxies.
Acknowledgements
This work is based on observations made with the NASA/ESA/CSA JWST. The research was supported by NASA grant JWST-ERS-01328. The data were obtained from the Mikulski Archive for Space Telescopes at the Space Telescope Science Institute, which is operated by the Association of Universities for Research in Astronomy, Inc., under NASA contract NAS 5-03127 for JWST. VU acknowledges funding support from NASA Astrophysics Data Analysis Program (ADAP) grant 80NSSC20K0450. The Flatiron Institute is supported by the Simons Foundation. AMM acknowledges support from the National Science Foundation under Grant No. 2009416. ASE and SL acknowledge support from NASA grant HST-GO15472. YS was funded in part by the NSF through the Grote Reber Fellowship Program administered by Associated Universities, Inc./National Radio Astronomy Observatory. F.M-S. acknowledges support from NASA through ADAP award 80NSSC19K1096. SA gratefully acknowledges support from an ERC Advanced Grant 789410, from the Swedish Research Council and from the Knut and Alice Wallenberg (KAW) Foundation. KI acknowledges support by the Spanish MCIN under grant PID2019-105510GB-C33/AEI/10.13039/501100011033. Finally, this research has made use of the NASA/IPAC Extragalactic Database (NED) which is operated by the Jet Propulsion Laboratory, California Institute of Technology, under contract with the National Aeronautics and Space Administration.
References
- Alexander et al. (1999) Alexander, T., Sturm, E., Lutz, D., et al. 1999, ApJ, 512, 204, doi: 10.1086/306751
- Armus et al. (2020) Armus, L., Charmandaris, V., & Soifer, B. T. 2020, Nature Astronomy, 4, 467, doi: 10.1038/s41550-020-1106-3
- Armus et al. (2004) Armus, L., Charmandaris, V., Spoon, H. W. W., et al. 2004, ApJS, 154, 178, doi: 10.1086/422915
- Armus et al. (2007) Armus, L., Charmandaris, V., Bernard-Salas, J., et al. 2007, ApJ, 656, 148, doi: 10.1086/510107
- Armus et al. (2009) Armus, L., Mazzarella, J. M., Evans, A. S., et al. 2009, PASP, 121, 559, doi: 10.1086/600092
- Astropy Collaboration et al. (2013) Astropy Collaboration, Robitaille, T. P., Tollerud, E. J., et al. 2013, A&A, 558, A33, doi: 10.1051/0004-6361/201322068
- Astropy Collaboration et al. (2018) Astropy Collaboration, Price-Whelan, A. M., Sipőcz, B. M., et al. 2018, AJ, 156, 123, doi: 10.3847/1538-3881/aabc4f
- Bohn et al. (2022) Bohn, T., Inami, H., Diaz-Santos, T., et al. 2022, arXiv e-prints, arXiv:2209.04466. https://arxiv.org/abs/2209.04466
- Bushouse et al. (2022) Bushouse, H., Eisenhamer, J., Dencheva, N., et al. 2022, spacetelescope/jwst: JWST 1.6.2, 1.6.2, Zenodo, doi: 10.5281/zenodo.6984366
- Dasyra et al. (2008) Dasyra, K. M., Ho, L. C., Armus, L., et al. 2008, ApJ, 674, L9, doi: 10.1086/528843
- Davies et al. (2005) Davies, R. I., Sternberg, A., Lehnert, M. D., & Tacconi-Garman, L. E. 2005, ApJ, 633, 105, doi: 10.1086/444495
- Davies et al. (2004) Davies, R. I., Tacconi, L. J., & Genzel, R. 2004, ApJ, 602, 148, doi: 10.1086/380995
- Díaz-Santos et al. (2007) Díaz-Santos, T., Alonso-Herrero, A., Colina, L., Ryder, S. D., & Knapen, J. H. 2007, ApJ, 661, 149, doi: 10.1086/513089
- Genzel et al. (1998) Genzel, R., Lutz, D., Sturm, E., et al. 1998, ApJ, 498, 579, doi: 10.1086/305576
- Grafton-Waters et al. (2020) Grafton-Waters, S., Branduardi-Raymont, G., Mehdipour, M., et al. 2020, A&A, 633, A62, doi: 10.1051/0004-6361/201935815
- Hao et al. (2007) Hao, L., Weedman, D. W., Spoon, H. W. W., et al. 2007, ApJ, 655, L77, doi: 10.1086/511973
- Hao et al. (2005) Hao, L., Spoon, H. W. W., Sloan, G. C., et al. 2005, ApJ, 625, L75, doi: 10.1086/431227
- Hönig et al. (2010) Hönig, S. F., Kishimoto, M., Gandhi, P., et al. 2010, A&A, 515, A23, doi: 10.1051/0004-6361/200913742
- Houck et al. (2004) Houck, J. R., Roellig, T. L., van Cleve, J., et al. 2004, ApJS, 154, 18, doi: 10.1086/423134
- Hunter (2007) Hunter, J. D. 2007, Computing in Science & Engineering, 9, 90, doi: 10.1109/MCSE.2007.55
- Inami et al. (2013) Inami, H., Armus, L., Charmandaris, V., et al. 2013, ApJ, 777, 156, doi: 10.1088/0004-637X/777/2/156
- Izumi et al. (2020) Izumi, T., Nguyen, D. D., Imanishi, M., et al. 2020, ApJ, 898, 75, doi: 10.3847/1538-4357/ab9cb1
- Kim et al. (2013) Kim, D. C., Evans, A. S., Vavilkin, T., et al. 2013, ApJ, 768, 102, doi: 10.1088/0004-637X/768/2/102
- Komossa & Xu (2007) Komossa, S., & Xu, D. 2007, ApJ, 667, L33, doi: 10.1086/522002
- Komossa et al. (2008) Komossa, S., Xu, D., Zhou, H., Storchi-Bergmann, T., & Binette, L. 2008, ApJ, 680, 926, doi: 10.1086/587932
- Labiano et al. (2021) Labiano, A., Argyriou, I., Álvarez-Márquez, J., et al. 2021, A&A, 656, A57, doi: 10.1051/0004-6361/202140614
- Lai et al. (2022) Lai, T. S. Y., Armus, L., U, V., et al. 2022, arXiv e-prints, arXiv:2209.06741. https://arxiv.org/abs/2209.06741
- Larson et al. (2016) Larson, K. L., Sanders, D. B., Barnes, J. E., et al. 2016, ApJ, 825, 128, doi: 10.3847/0004-637X/825/2/128
- Lim et al. (2022) Lim, P. L., O’Steen, R., Earl, N., et al. 2022, spacetelescope/jdaviz: v2.8.0, v2.8.0, Zenodo, doi: 10.5281/zenodo.6877878
- Lutz et al. (2000) Lutz, D., Sturm, E., Genzel, R., et al. 2000, ApJ, 536, 697, doi: 10.1086/308972
- Marshall et al. (2018) Marshall, J. A., Elitzur, M., Armus, L., Diaz-Santos, T., & Charmandaris, V. 2018, ApJ, 858, 59, doi: 10.3847/1538-4357/aabcc0
- Marshall et al. (2007) Marshall, J. A., Herter, T. L., Armus, L., et al. 2007, ApJ, 670, 129, doi: 10.1086/521588
- Müller-Sánchez et al. (2011) Müller-Sánchez, F., Prieto, M. A., Hicks, E. K. S., et al. 2011, ApJ, 739, 69, doi: 10.1088/0004-637X/739/2/69
- Netzer et al. (2007) Netzer, H., Lutz, D., Schweitzer, M., et al. 2007, ApJ, 666, 806, doi: 10.1086/520716
- Newville et al. (2014) Newville, M., Stensitzki, T., Allen, D. B., & Ingargiola, A. 2014, LMFIT: Non-Linear Least-Square Minimization and Curve-Fitting for Python, 0.8.0, Zenodo, doi: 10.5281/zenodo.11813
- Nguyen et al. (2021) Nguyen, D. D., Izumi, T., Thater, S., et al. 2021, MNRAS, 504, 4123, doi: 10.1093/mnras/stab1002
- Ott (2012) Ott, T. 2012, QFitsView: FITS file viewer, Astrophysics Source Code Library, record ascl:1210.019. http://ascl.net/1210.019
- Peterson et al. (2004) Peterson, B. M., Ferrarese, L., Gilbert, K. M., et al. 2004, ApJ, 613, 682, doi: 10.1086/423269
- Petric et al. (2011) Petric, A. O., Armus, L., Howell, J., et al. 2011, ApJ, 730, 28, doi: 10.1088/0004-637X/730/1/28
- Pontoppidan et al. (2022) Pontoppidan, K., Blome, C., Braun, H., et al. 2022, arXiv e-prints, arXiv:2207.13067. https://arxiv.org/abs/2207.13067
- Pope et al. (2008) Pope, A., Chary, R.-R., Alexander, D. M., et al. 2008, ApJ, 675, 1171, doi: 10.1086/527030
- Rieke et al. (2015) Rieke, G. H., Wright, G. S., Böker, T., et al. 2015, PASP, 127, 584, doi: 10.1086/682252
- Robleto-Orús et al. (2021) Robleto-Orús, A. C., Torres-Papaqui, J. P., Longinotti, A. L., et al. 2021, ApJ, 906, L6, doi: 10.3847/2041-8213/abd32f
- Sanders et al. (2003) Sanders, D. B., Mazzarella, J. M., Kim, D. C., Surace, J. A., & Soifer, B. T. 2003, AJ, 126, 1607, doi: 10.1086/376841
- Schweitzer et al. (2006) Schweitzer, M., Lutz, D., Sturm, E., et al. 2006, ApJ, 649, 79, doi: 10.1086/506510
- Spoon & Holt (2009) Spoon, H. W. W., & Holt, J. 2009, ApJ, 702, L42, doi: 10.1088/0004-637X/702/1/L42
- Spoon et al. (2007) Spoon, H. W. W., Marshall, J. A., Houck, J. R., et al. 2007, ApJ, 654, L49, doi: 10.1086/511268
- Stierwalt et al. (2013) Stierwalt, S., Armus, L., Surace, J. A., et al. 2013, ApJS, 206, 1, doi: 10.1088/0067-0049/206/1/1
- Stierwalt et al. (2014) Stierwalt, S., Armus, L., Charmandaris, V., et al. 2014, ApJ, 790, 124, doi: 10.1088/0004-637X/790/2/124
- Stone et al. (2022) Stone, M., Pope, A., McKinney, J., et al. 2022, ApJ, 934, 27, doi: 10.3847/1538-4357/ac778b
- Sturm et al. (2002) Sturm, E., Lutz, D., Verma, A., et al. 2002, A&A, 393, 821, doi: 10.1051/0004-6361:20021043
- Togi & Smith (2016) Togi, A., & Smith, J. D. T. 2016, ApJ, 830, 18, doi: 10.3847/0004-637X/830/1/18
- U et al. (2019) U, V., Medling, A. M., Inami, H., et al. 2019, ApJ, 871, 166, doi: 10.3847/1538-4357/aaf1c2
- U et al. (2022) U, V., Lai, T., Bianchin, M., et al. 2022, arXiv e-prints, arXiv:2209.01210. https://arxiv.org/abs/2209.01210
- van der Walt et al. (2011) van der Walt, S., Colbert, S. C., & Varoquaux, G. 2011, Computing in Science Engineering, 13, 22
- Virtanen et al. (2020) Virtanen, P., Gommers, R., Oliphant, T. E., et al. 2020, Nature Methods, 17, 261, doi: https://doi.org/10.1038/s41592-019-0686-2
- Weedman et al. (2005) Weedman, D. W., Hao, L., Higdon, S. J. U., et al. 2005, ApJ, 633, 706, doi: 10.1086/466520
- Wright (2006) Wright, E. L. 2006, PASP, 118, 1711, doi: 10.1086/510102