The Equation of State with the EPOS3 model
Abstract
Transitions between different states of matter and their thermodynamic properties are described by the Equation of State (EoS). A universal representation of the EoS of Quantum Chromodynamics (QCD) for the wide range of phase diagram has yet to be determined. The expectation of the systems to undergo various types of transitions depending on the temperature (T), the chemical potential (), and other thermodynamic features make solving that puzzle challenging. Furthermore, it needs to be apparent which experimentally measurable observables could provide helpful information for determining EoS. The application of different EoS for hydrodynamical evolution was introduced in the EPOS3 generator, which allows one to study its changing effect on the experimental observables. The family of EoS proposed by the BEST Collaboration was implemented. The Critical Point (CP) location and the strength of criticality variations were investigated with particle yield, transverse momentum spectra, flow, and moments of the net-proton distributions.
I Introduction
Determining the EoS is crucial for the complete description and understanding of the QCD phase diagram. The relations between thermodynamic quantities characterizing different states of matter are depicted in the construction of EoS. The substantial topic of the present research is the investigation of transitions between partonic and hadronic mediums. Depending on the medium’s T and , it is expected to undergo smooth cross-over or rapid first-order phase transition. EoS expresses the relations between various matter parameters such as pressure, temperature, energy density, speed of sound, and the former. It is not trivial to determine it for the broad range of the . At and extreme T, one can apply the non-perturbative QCD and based on the first principles Lattice QCD computations [1, 2, 3]. It provides quantitative information on the deconfined state QGP and cross-over transition. Even though applying increasingly sophisticated algorithms [4], the area of the figure at non-zero is still not fully understood. The existence and placement of the CP, where the cross-over transition switches to possible first-order phase one, cannot be predicted using fundamental principles.
Various attempts are performed to generate the EoS, allowing one to characterize the whole QCD phase diagram, starting from and ending with higher baryon density matter. Some EoS introduce the first-order phase transition for finite and relatively lower T. Nevertheless, several provide information about the CP location and properties of this phase transition [4, 5].
II BEST EoS
Collaboration Beam Energy Scan Theory (BEST) proposed a family of EoS describing the same region of the QCD phase diagram as studied in the BES program [5, 6]. BEST covered the region of in the range - MeV and T between MeV - MeV. The equations respect the lattice QCD results up to (). They consider the existence of cross-over transition, and first-order phase transition and give a possibility to choose the location of CP on the QCD phase diagram . The coverage of EoS at finite is possible due to the applied by BEST strategy [5, 6]:
-
1.
Describe the universal scaling behavior of the EoS in the 3D Ising model close to the CP using an appropriate parametrization;
-
2.
The 3D Ising model phase diagram is mapped using a parametric change of variables onto the QCD one (Ising variables to QCD coordinates: ), where is magnetic field, and is reduced temperature .
-
3.
Estimate the critical contribution to the expansion coefficients from Lattice QCD using the thermodynamics of the Ising model EoS;
-
4.
Reconstruct the full pressure, incorporating the proper critical behavior and matching Lattice QCD at .
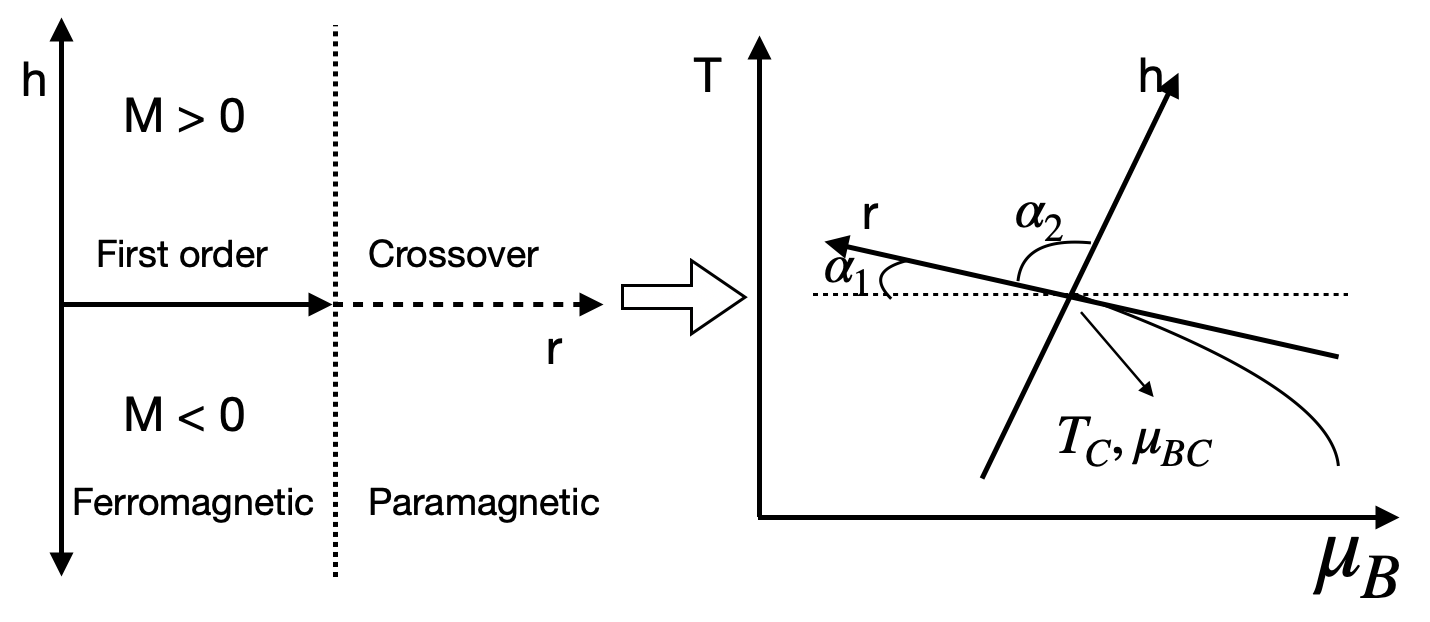
In Fig. 1, the non-universal mapping procedure is illustrated. Using six parameters (listed and described in Sec. II.1), the critical thermodynamics is linearly transferred to QCD.
II.1 Selection of the EoS parameters
The primary studies possible due to the modifications and development of the EPOS3 model [7] allow one to study the impact on final observables of the changes between the variety of EoS. As mentioned in Section II, the BEST EoS is, in reality, the family of EoS, the set of various EoS tables. To obtain the EoS, one must choose the parameters corresponding to mapping properties and locate the CP on the QCD phase diagram.
The composition of the input parameters is crucial in setting the strength of the criticality of the transitions of the matter. Moreover, by changing the CP’s location to some extreme values, one can expect the cross-over or the first-order transitions in the evolution of examined simulated systems. The structure of the parameter input file is as follows:
Where (all visualized in the right panel of Fig. 1):
-
•
MODE - corresponds to way of locating the CP on the diagram. In this study, the CP lies on a parabola parallel to the chiral transition line - which reports to MODE = PAR;
-
•
- the value of T at which the parabolic pseudo-critical line crosses the T axis;
-
•
- the curvature of the transition line at the T axis;
-
•
and - the and at the CP;
-
•
- the difference between two angles shown in Fig. 1.
-
•
- the global scaling parameter in the mapping (the higher the less criticality in transitions of matter);
-
•
- the relative scaling in the mapping; both and application described in more details in [6];
The , can be easily calculated from the given parameters:
| (1a) | |||
| (1b) | |||
| (1c) | |||
III EPOS3 Model
EPOS3 is an abbreviation of Energy conserving quantum mechanical multiple scattering approach, based on Partons (parton ladders), Off-shell remnants, and Saturation of parton ladders.
The model consists of several phases of evolution:
- •
- •
-
•
hydrodynamical evolution [11],
-
•
hadronization based on the given EoS,
- •
-
•
resonance decays.
The crucial element of the model’s theoretical framework is the sophisticated treatment of the hadron-hadron scattering and the initial stage of the collisions at ultra-relativistic energies. It is highly relevant in the understanding of possible parton-hadron phase transition. The merged approach of Gribov-Regge Theory (GRT) and the eikonalised parton model is utilized to treat the first interactions happening just after the collision properly - satisfying conservation laws and equal treatment of subsequent Pomerons [9, 8, 15].
If the density of the strings is very high, they cannot decay independently, what describes scenario of the heavy-ions and the high-multiplicity collisions. In EPOS3, the dynamical process of division of the strings segments into core and corona is introduced in order to deal with this issue [10, 11, 12].
The separation is based on the abilities of a given string segment to leave the ”bulk matter”. As the criteria for deciding if it goes to core or corona, the transverse momentum of the element and the local string density are considered. If the string segment belongs to the very dense area, it will not escape but will build the core, which will be driven in the next step by a hydrodynamical evolution. When the segment originates from the part of the string close to a kink, characterized by the high transverse momenta, it escapes the bulk matter and joins the corona and consequently will show up as a hadron (jet-hadrons). There is also a possibility that the string segment is close to the surface of the dense part of the medium, and its momentum is high enough to leave it; it also becomes a corona particle. The following equation is used for the determination of the core and corona:
| (2) |
where: is the trajectory of the segment, the string density, and a non-zero constant for , null for and interpolated linearly between and . If the is positive for a given segment, it escapes and becomes a corona particle; in the opposite case, it contributes to the core.
As it has been studied [16, 17, 18, 19], the QGP does not expand like an ideal fluid, and the effect of the bulk viscosity has to be taken into account in the simulations. In EPOS3, the 3D+1 viscous hydrodynamics is applied, providing an proper description of the collective expansion of the matter [11]. The hydrodynamic evolution is based on the EoS. In this project we introduced the possibility to change EoS and apply the BEST ones.
In the simulations, the definitive treatment of individual events is essential - the generalization in considering smooth initial conditions for all events is not applied. The event-by-event (ebe) approach in hydrodynamical evolution is based on the random flux tube initial conditions [11]. It has a relevant impact on the final observables, such as spectra or various harmonics of flow. The hadronization process occurs according to the microcanonical approach described in [20, 21].
When the system’s density is very high and the mean free paths of constituent particles are small about any macroscopic length scale, the hydrodynamic description can be used - in the initial phase of the QGP evolution. With the system’s cooling, the density and the mean free paths decrease; oppositely, the increases. Finally, the differences in the mean free path of various particle species become relevant, and the system’s collective description becomes inadequate. When the density and the temperature are low enough, the kinetic theory is applied using the UrQMD code [13, 14].
The particles can interact only when they leave the hyper-surface of the freeze-out. The hadronic scattering is performed according to the measure reaction cross sections [22]. Of the 60 different baryonic species and their antiparticles, about 40 mesonic states are considered [14, 13]. There are implemented such interactions between hadrons as [23]:
-
•
elastic scattering,
-
•
string excitations,
-
•
resonance excitations,
-
•
strangeness exchange reactions
The hadronic scattering significantly impacts the final observables [24, 25].
IV Results and discussion
IV.1 Simulations
The two collision energies were studied: Au+Au collisions at GeV and GeV. Below the GeV the onset of QGP is expected according to STAR experimental results [26, 27, 28], which motivates the choice of the lower collision energy. The second one is the medium one in BES-I at RHIC [29]. The EPOS3 model simulations where performed using following EoS:
The substantial statistics is needed for the precise studies of narrow centrality binning. In this research, we performed the preliminary investigation using lower number of events but looking into effects of various EoS.
| Number | |||||||||||||
|---|---|---|---|---|---|---|---|---|---|---|---|---|---|
| BEST 1: | PAR | 155 | -0.0149 | 350 | 90 | 1 | 2 | 143 | 350 | 3 | 93 | 143 | 286 |
| BEST 2: | PAR | 155 | -0.0149 | 350 | 90 | 4 | 1 | 143 | 350 | 3 | 93 | 572 | 572 |
| BEST 3: | PAR | 155 | -0.0149 | 420 | 90 | 0.75 | 2 | 138 | 420 | 4 | 94 | 103 | 207 |
| BEST 4: | PAR | 155 | -0.0149 | 350 | 90 | 10 | 1 | 143 | 350 | 3 | 93 | 1432 | 1432 |
| BEST 5: | PAR | 169 | -0.0149 | 420 | 90 | 1 | 1 | 153 | 420 | 4 | 94 | 153 | 153 |
| BEST 6: | PAR | 169 | -0.0149 | 420 | 90 | 0.5 | 1 | 153 | 420 | 4 | 94 | 76 | 76 |
| BEST 7: | PAR | 174 | -0.0149 | 440 | 90 | 1 | 1 | 157 | 440 | 4 | 94 | 157 | 157 |
| BEST 8: | PAR | 178 | -0.0149 | 300 | 90 | 1 | 1 | 170 | 300 | 2 | 92 | 170 | 170 |
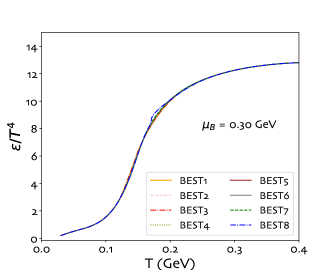
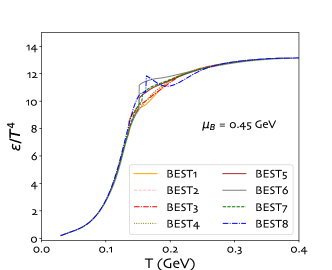
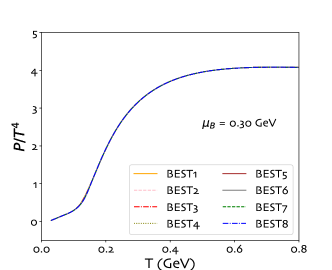
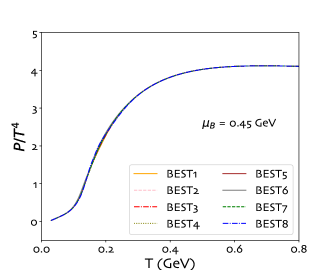
The only element of the simulation at given energy performed by the EPOS3 model which changes is the EoS. All the presented data sets can be used to directly compare the proposed EoS. The Figures 3-6 illustrate the dependencies of energy density and pressure with temperature for each EoS at GeV and GeV. The significant variations due to the presence of CP are visible in the density energy plots in the GeV region.
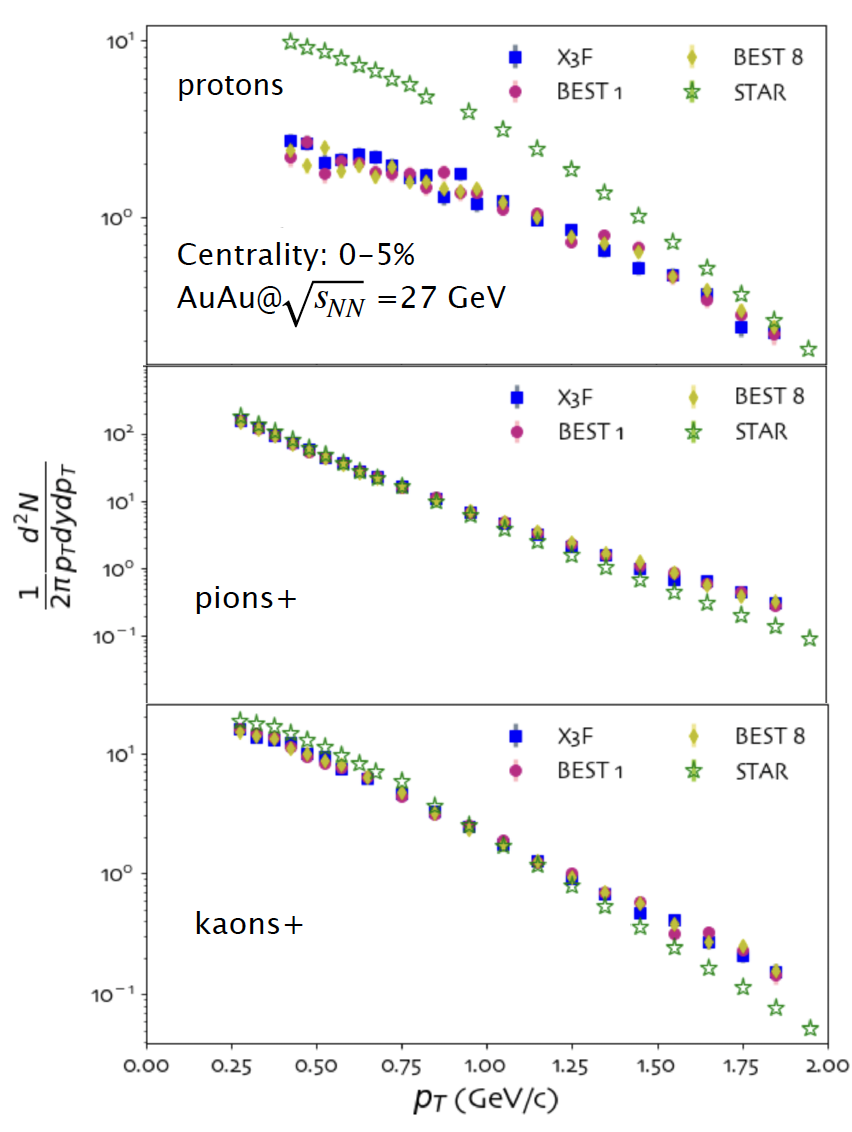
IV.2 Production of particles
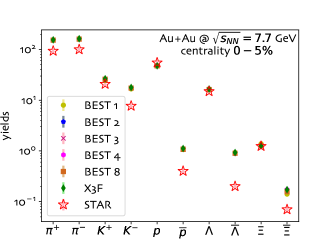
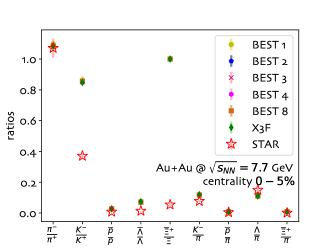
Figure 7 shows the particle production at the most central collisions of Au+Au simulated with EPOS3 model. They are compared with STAR data published in [30]. Centrality in the model are defined using the Glauber model. Various EoS sets of parameters were used in performed simulations; the numbers of EPOS3 data sets correspond to those listed in Table 1. As all the points from simulations precisely overlap each other, so only part of the data sets were plotted. The relations between particles’ and antiparticles’ production are reflected using ratios in Figure 8.
The higher number of produced baryons than antibaryons proves that in EPOS3 simulations, the impact of non-zero baryon potential is kept for all the proposed EoS. The model reflects the experimental data reasonably, except for pions twice overestimated. Nonetheless, their ratio is kept.
The possible reason for such discrepancies is the too-wide rapidity distribution of simulated data. In the experimental analysis, the selection of particles characterized by the is very narrow. In such a case, even a tiny deviation in the rapidity distribution strongly affects the performed investigation.
In both Fig. 7 and 8, no relevant differences between simulations obtained with various EoS are observed. Notwithstanding the EoS corresponds to the cross-over transition, which is not expected to happen for cooling systems created in collisions of Au+Au at GeV.
IV.3 Particles’ dynamics
The differences between the EoS were searched in the dynamics of the expanding matter. The listed below observables were investigated:
-
•
transverse momentum () spectra of identified hadrons: p, , , (Au+Au at and GeV, and centrality ranges),
-
•
elliptic flow () of identified hadrons: p, , , (Au+Au at and GeV, centrality),
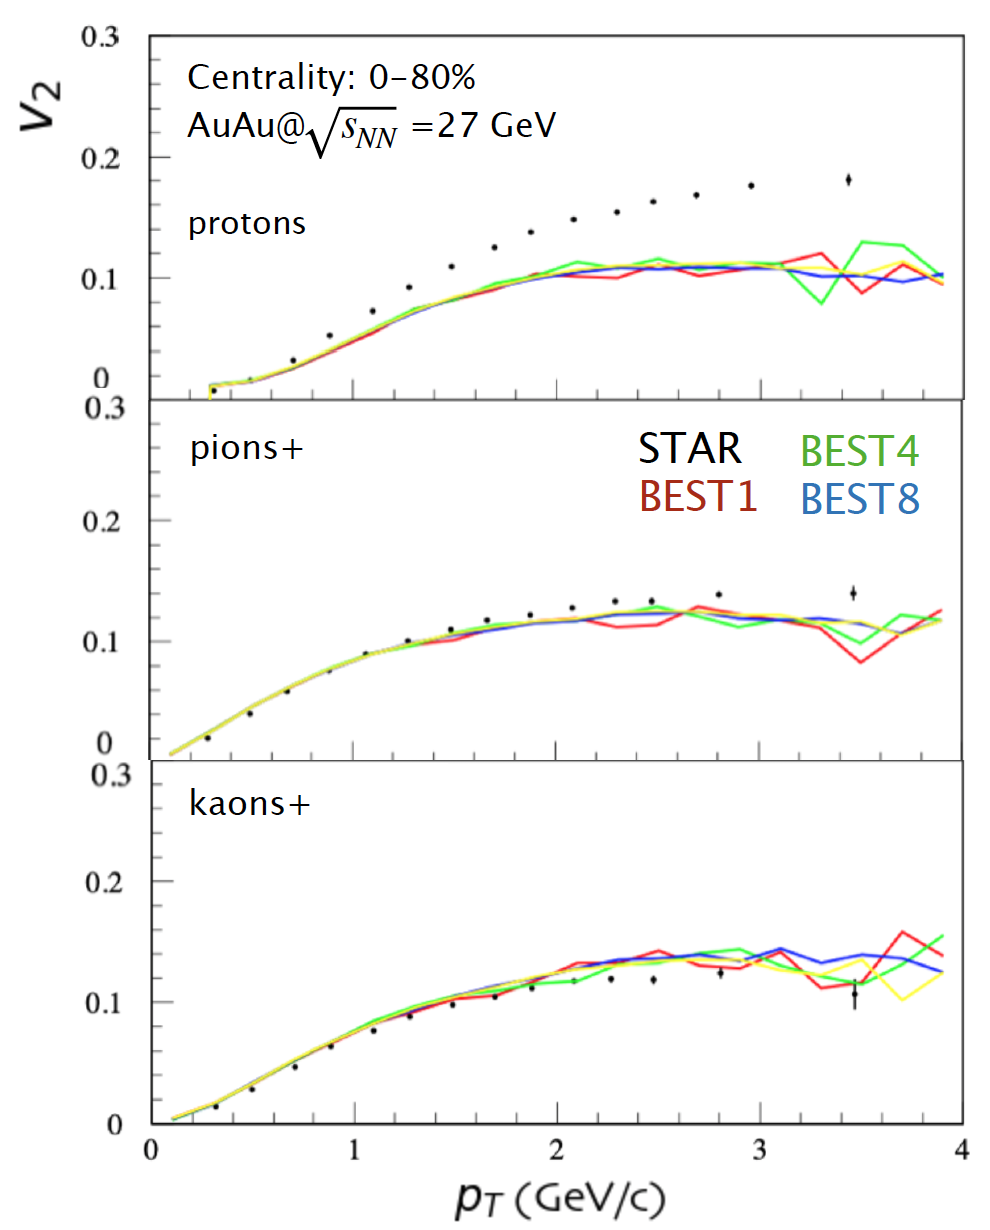
Surprisingly, none of the abovementioned observables depended on the applied EoS. Figures 9 and 10 show the comparison of the simulated EPOS3 and with STAR experiment for Au+Au collisions at GeV. Whereas the model describes the meson data reasonably well, there is clearly a problem with protons (which will be addressed in the future).
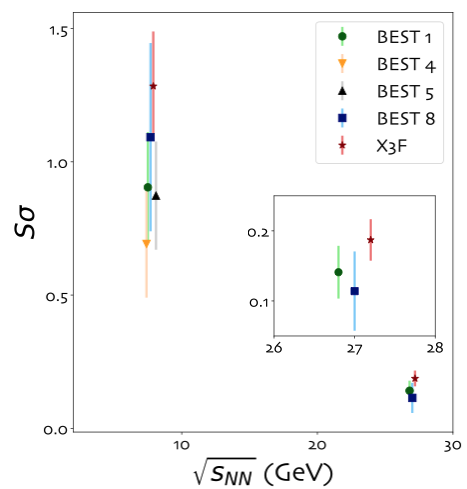
IV.4 Moments of particle distributions
The non-monotonic behavior in the event-by-event fluctuations of globally conserved quantities is treated as one of the signatures of the presence of CP [31, 32]. The moments of distributions characterizing the given fluctuations are: mean (), standard deviation (), skewness (), the kurtosis (). They are linked with the corresponding higher-order thermodynamic susceptibilities and the system’s correlation length [33, 34], which are expected to fluctuate for large samples in equilibrium at the CP. In the vicinity of CP, in reality, the system is driven away from the thermodynamic equilibrium, and the maximum value of correlation length attains 1.5-3 fm [34]. During the fireball evolution after the hadronization stage, the freeze-out signal information can dissipate [35]. However, if it survives, the higher moments can become helpful in studies of CP’s location. As the CP’s location is changed in various EoS, the moments of particle distributions are expected to be a useful tool in the performed investigation. In the EPOS3 model, the critical fluctuations are not propagated in the hydro framework. However, still, the variations between different EoS could be visible.
Figures 11 and 12 show the and integrated overall as a function of the collision energy. To perform this analysis in smaller centrality bins, enormous statistics are required. However, even in integrated data, significant energy dependence is present for for all EoS. All the points at the given energy are within the statistic uncertainties; effectively, no clear statement about the discrepancies between the EoS. shows more considerable variations between different EoS data sets. At GeV, the highest point corresponds to the EoS where the CP is located at high T and low and the simulated system is expected to go through the first-order transition. At the same time, the negative value is related to BEST4, where the criticality is less pronounced. For data sets simulated at GeV, the differences are minor; however, the BEST8 value is the highest. The energy dependence is not definite.
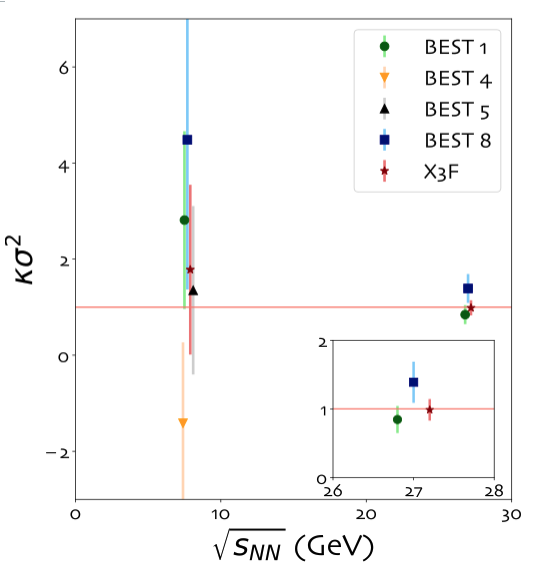
The measurements of the net-proton distributions’ moments show the differences between data simulated using various EoS. They are more pronounced in peripheral collisions where we do not expect an immense contribution from the core particles, consequently, less dependent on the EoS.
V Conclusion
The studies of various EoS implemented in the EPOS3 model were described. Developing the generator’s code by introducing a new EoS gave a possibility to investigate the impact of EoS on the final observables. Apart from the EoS, the whole structure of the model remained unchanged. EPOS3 model did not show the variations between different implemented EoS for most of the examined observables (like flow or yields). It concludes that the EPOS3 model is not sensitive to switching the EoS used in simulations. This version of the model is still under development. Studies based on higher statistics will be performed on the final model version, EPOS4.
VI Acknowledgements
We thank Yurii Karpenko and Gabriel Sophys for the fruitful discussions. This work was supported by the Grant of the National Science Centre, Poland, No: 2021/41/B/ST2/02409 and 2020/38/E/ST2/00019 . Studies were funded by IDUB-POB-FWEiTE-3, a project granted by Warsaw University of Technology under the program Excellence Initiative: Research University (ID-UB), Deutsche Akademische Austauschdienst, GETINvolved Programme, and Humboldt-Forschungsstipendium für Postdocs, and U.S. Department of Energy grant DE-SC0020651.
References
- Allton et al. [2002] C. Allton, S. Ejiri, S. Hands, O. Kaczmarek, F. Karsch, E. Laermann, C. Schmidt, and L. Scorzato, The QCD thermal phase transition in the presence of a small chemical potential, Phys. Rev. D 66, 074507 (2002), arXiv:hep-lat/0204010 .
- Redlich et al. [2004] K. Redlich, F. Karsch, and A. Tawfik, Heavy ion collisions and lattice QCD at finite baryon density, J. Phys. G 30, S1271 (2004), arXiv:nucl-th/0404009 .
- Gavai and Gupta [2008] R. Gavai and S. Gupta, QCD at finite chemical potential with six time slices, Phys. Rev. D 78, 114503 (2008), arXiv:0806.2233 [hep-lat] .
- Stephanov [2006] M. Stephanov, QCD phase diagram: An Overview, PoS LAT2006, 024 (2006), arXiv:hep-lat/0701002 .
- Parotto [2019] P. Parotto, Equation of state for QCD with a critical point from the 3D Ising Model, Nucl. Phys. A 982, 183 (2019), arXiv:1808.03695 [hep-ph] .
- Parotto [2018] P. Parotto, Parametrized Equation of State for QCD from 3D Ising Model, Proceedings, 11th International Workshop on Critical Point and Onset of Deconfinement (CPOD2017): Stony Brook, NY, USA, August 7-11, 2017, PoS CPOD2017, 036 (2018), arXiv:1801.07801 [hep-ph] .
- Werner et al. [2018] K. Werner, B. Guiot, I. Karpenko, A. G. Knospe, C. Markert, T. Pierog, G. Sophys, and M. Stefaniak, Multiple Scattering in EPOS, Adv. Ser. Direct. High Energy Phys. 29, 391 (2018).
- Gribov [1968] V. Gribov, A REGGEON DIAGRAM TECHNIQUE, Sov. Phys. JETP 26, 414 (1968).
- Drescher et al. [2001] H. J. Drescher, M. Hladik, S. Ostapchenko, T. Pierog, and K. Werner, Parton based Gribov-Regge theory, Phys. Rept. 350, 93 (2001), arXiv:hep-ph/0007198 [hep-ph] .
- Werner et al. [2014] K. Werner, B. Guiot, I. Karpenko, and T. Pierog, Analysing radial flow features in p-Pb and p-p collisions at several TeV by studying identified particle production in EPOS3, Phys. Rev. C89, 064903 (2014), arXiv:1312.1233 [nucl-th] .
- Werner et al. [2010] K. Werner, I. Karpenko, T. Pierog, M. Bleicher, and K. Mikhailov, Event-by-Event Simulation of the Three-Dimensional Hydrodynamic Evolution from Flux Tube Initial Conditions in Ultrarelativistic Heavy Ion Collisions, Phys. Rev. C82, 044904 (2010), arXiv:1004.0805 [nucl-th] .
- Werner [2007] K. Werner, Core-corona separation in ultra-relativistic heavy ion collisions, Phys. Rev. Lett. 98, 152301 (2007), arXiv:0704.1270 [nucl-th] .
- Bleicher et al. [1999] M. Bleicher et al., Relativistic hadron hadron collisions in the ultrarelativistic quantum molecular dynamics model, J. Phys. G25, 1859 (1999), arXiv:hep-ph/9909407 [hep-ph] .
- Bass et al. [1998] S. A. Bass et al., Microscopic models for ultrarelativistic heavy ion collisions, Prog. Part. Nucl. Phys. 41, 255 (1998), [Prog. Part. Nucl. Phys.41,225(1998)], arXiv:nucl-th/9803035 [nucl-th] .
- Werner [1993] K. Werner, Strings, pomerons and the venus model of hadronic interactions at ultrarelativistic energies, Physics Reports 232, 87 (1993).
- Demir and Bass [2009] N. Demir and S. A. Bass, Shear-viscosity to entropy-density ratio of a relativistic hadron gas, Phys. Rev. Lett. 102, 172302 (2009).
- El et al. [2009] A. El, A. Muronga, Z. Xu, and C. Greiner, Shear viscosity and out of equilibrium dynamics, Phys. Rev. C 79, 044914 (2009).
- Snellings [2011] R. Snellings, Elliptic Flow: A Brief Review, New J. Phys. 13, 055008 (2011), arXiv:1102.3010 [nucl-ex] .
- Gale et al. [2013] C. Gale, S. Jeon, and B. Schenke, Hydrodynamic Modeling of Heavy-Ion Collisions, Int. J. Mod. Phys. A28, 1340011 (2013), arXiv:1301.5893 [nucl-th] .
- Werner and Aichelin [1995] K. Werner and J. Aichelin, Microcanonical treatment of hadronizing the quark - gluon plasma, Phys. Rev. C 52, 1584 (1995), arXiv:nucl-th/9503021 .
- [21] K. Werner, Regge Gribov-Regge approach and EPOS, Invited lecture, KSETA graduate school for particle and astroparticle physics, Karlsruhe, 1-2 April 2019, published in hal-02434245.
- Patrignani et al. [2016] C. Patrignani et al. (Particle Data Group), Review of Particle Physics, Chin. Phys. C 40, 100001 (2016).
- Steinheimer et al. [2018a] J. Steinheimer, V. Vovchenko, J. Aichelin, M. Bleicher, and H. Stöcker, Final state hadronic rescattering with UrQMD, EPJ Web Conf. 171, 05003 (2018a).
- Stefaniak [2018] M. Stefaniak, Examination of Heavy-ion Collisions Using EPOS Model in the Frame of BES Program, Proceedings, NICA days 2017: Warsaw, Poland, November 6-10, 2017, Acta Phys. Polon. Supp. 11, 695 (2018).
- Steinheimer et al. [2018b] J. Steinheimer, V. Vovchenko, J. Aichelin, M. Bleicher, and H. Stöcker, Conserved charge fluctuations are not conserved during the hadronic phase, Phys. Lett. B 776, 32 (2018b), arXiv:1608.03737 [nucl-th] .
- Pandit [2013] Y. Pandit (STAR), Beam Energy Dependence of First and Higher Order Flow Harmonics from the STAR Experiment at RHIC, Proceedings, 23rd International Conference on Ultrarelativistic Nucleus-Nucleus Collisions : Quark Matter 2012 (QM 2012): Washington, DC, USA, August 13-18, 2012, Nucl. Phys. A904-905, 357c (2013), arXiv:1210.5315 [nucl-ex] .
- Adamczyk et al. [2016] L. Adamczyk et al. (STAR), Centrality dependence of identified particle elliptic flow in relativistic heavy ion collisions at =7.7–62.4 GeV, Phys. Rev. C93, 014907 (2016), arXiv:1509.08397 [nucl-ex] .
- Adamczyk et al. [2013] L. Adamczyk et al. (STAR), Elliptic flow of identified hadrons in Au+Au collisions at 7.7-62.4 GeV, Phys. Rev. C88, 014902 (2013), arXiv:1301.2348 [nucl-ex] .
- Odyniec [2013] G. Odyniec, The RHIC Beam Energy Scan program in STAR and what’s next …, Proceedings, Workshop on Discovery Physics at the LHC (Kruger 2012): Kruger National Park, Mpumalanga, South Africa, December 3-9, 2012, J. Phys. Conf. Ser. 455, 012037 (2013).
- Adamczyk et al. [2017] L. Adamczyk et al. (STAR), Bulk Properties of the Medium Produced in Relativistic Heavy-Ion Collisions from the Beam Energy Scan Program, Phys. Rev. C96, 044904 (2017), arXiv:1701.07065 [nucl-ex] .
- Sombun et al. [2018] S. Sombun, J. Steinheimer, C. Herold, A. Limphirat, Y. Yan, and M. Bleicher, Higher order net-proton number cumulants dependence on the centrality definition and other spurious effects, J. Phys. G 45, 025101 (2018), arXiv:1709.00879 [nucl-th] .
- Luo and Xu [2017] X. Luo and N. Xu, Search for the QCD Critical Point with Fluctuations of Conserved Quantities in Relativistic Heavy-Ion Collisions at RHIC : An Overview, Nucl. Sci. Tech. 28, 112 (2017), arXiv:1701.02105 [nucl-ex] .
- Stephanov [2009] M. Stephanov, Non-Gaussian fluctuations near the QCD critical point, Phys. Rev. Lett. 102, 032301 (2009), arXiv:0809.3450 [hep-ph] .
- Athanasiou et al. [2010] C. Athanasiou, K. Rajagopal, and M. Stephanov, Using Higher Moments of Fluctuations and their Ratios in the Search for the QCD Critical Point, Phys. Rev. D 82, 074008 (2010), arXiv:1006.4636 [hep-ph] .
- Stephanov [2010] M. Stephanov, Evolution of fluctuations near QCD critical point, Phys. Rev. D 81, 054012 (2010), arXiv:0911.1772 [hep-ph] .