Angle-resolved transport nonreciprocity and spontaneous symmetry breaking in twisted trilayer graphene
The ability to identify and characterize spontaneous symmetry breaking is central to our understanding of 2D materials with strong correlation, such as the moiré flat bands in magic-angle twisted graphene bilayer and trilayer. In this work, we utilize angle-resolved measurements of transport nonreciprocity to investigate spontaneous symmetry breaking in twisted trilayer graphene. By analyzing the angular dependence of nonreciprocity in both longitudinal and transverse channels, we are able to identify the symmetry axis associated with the underlying electronic order. We report that a hysteretic rotation in the mirror axis can be induced by thermal cycles and a large current bias, which offers unambiguous evidence for the spontaneous breaking of rotational symmetry. Moreover, the onset of nonreciprocity with decreasing temperature coincides with the emergence of orbital ferromagnetism. Combined with the angular dependence of the superconducting diode effect, our findings uncover a direct link between rotational and time-reversal symmetry breaking. These symmetry requirements point towards the exchange-driven instabilities in the momentum space as a possible origin for transport nonreciprocity in tTLG.
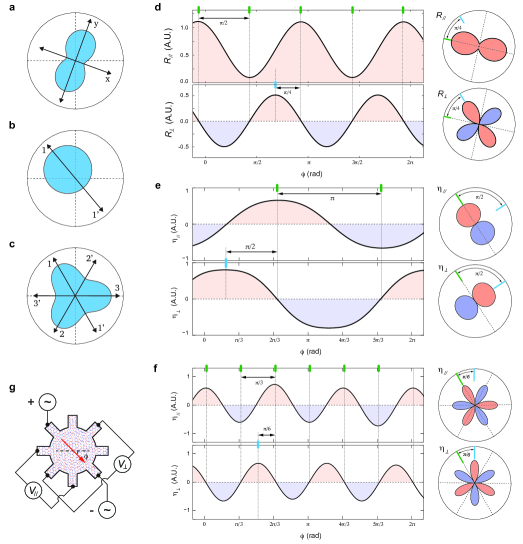
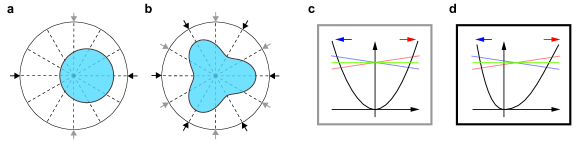
Electronic nematicity describes the Coulomb-driven phenomenon with reduced in-plane rotational symmetry compared to the underlying crystal lattice Fradkin et al. (2010); Oganesyan et al. (2001); Kivelson et al. (1998). For instance, the orthorhombic anisotropy emerges as the Fermi surface undergoes a quadruple distortion to save Coulomb energy. Such a Coulomb-driven phenomenon has been widely observed in a series of strongly correlated 2D systems, such as strontium ruthenate, cuprate materials Wu et al. (2017, 2020); Ando et al. (2002); Hinkov et al. (2008), magic-angle twisted bilayer and trilayer graphene Jiang et al. (2019); Choi et al. (2019); Kerelsky et al. (2019); Cao et al. (2021); Rubio-Verdú et al. (2022); Zhang et al. (2022). An orthorhombic anisotropy features two mirror axes that are orthogonal to each other (Fig. 1a). As a result, the symmetry associated with a two-fold in-plane rotation, , is preserved. Further lifting symmetry promises to unlock a new dimension of rich physical constructions beyond the orthorhombic anisotropy. It is recently proposed that exchange interaction amongst trigonally-warped Fermi pockets enables novel instabilities in the momentum-space. For instance, electronic state in multilayer graphene could acquire a non-zero net momentum as charge carriers spontaneously condense into one of the Fermi pockets Lin et al. (2023); Dong et al. (2023); Jung et al. (2015); Huang et al. (2022). Unlike the orthorhombic anisotropy, the momentum-space instability breaks and time-reversal symmetry simultaneously.
Rotational symmetry breaking can be identified based on angle-resolved transport measurement Wu et al. (2017, 2020), which conventionally focuses on the linear and reciprocal component of transport response, such as the longitudinal and transverse resistance, and , in the limit of small current bias. The angular dependence of and is constrained by the underlying symmetry axes. A Fermi surface with quadruple distortion preserves symmetry, which gives rise to two orthogonal mirror axes, which are marked by black arrows in Fig. 1a. As a function of , the longitudinal (transverse) transport response is expected to be symmetric (anti-symmetric) around a mirror axis. Not only does this symmetry constraint gives rise to a period of in the angular oscillation of and , but it also accounts for a phase shift of between longitudinal and transverse channels. Together, the angular dependence can be expressed as and . Here, defines the orientation of the mirror axes, whereas the phase shift of is captured by cosine and sine functions.
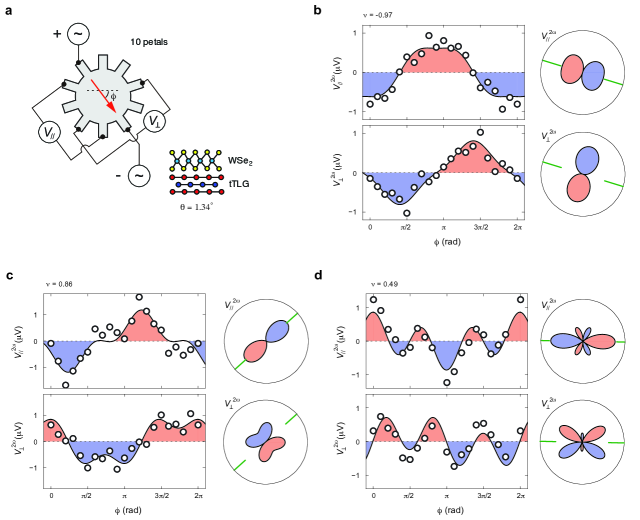
Beyond the orthorhombic anisotropy, the nature of electronic orders with symmetry breaking is directly linked to the nonlinear and nonreciprocal transport response. For simplicity, we label nonreciprocity in the longitudinal (transverse) channels as (), which is simply defined as the difference in () between forward and reverse current bias. The angular dependence of nonreciprocity shares the same symmetry constraint as the linear transport response. Consequently, () is expected to be maximized (zero) when current flows along the mirror line. Owing to symmetry breaking, the electronic order can have either one or three mirror axes, as shown in Fig. 1b-c). An electronic state with a single mirror axis (Fig. 1b) enables an angular period of and a phase shift of between and (Fig. 1e). Along the same vein, a state with three mirror axes (Fig. 1c) is identifiable by a period of in the angular oscillation, along with a phase shift of between and (Fig. 1f).
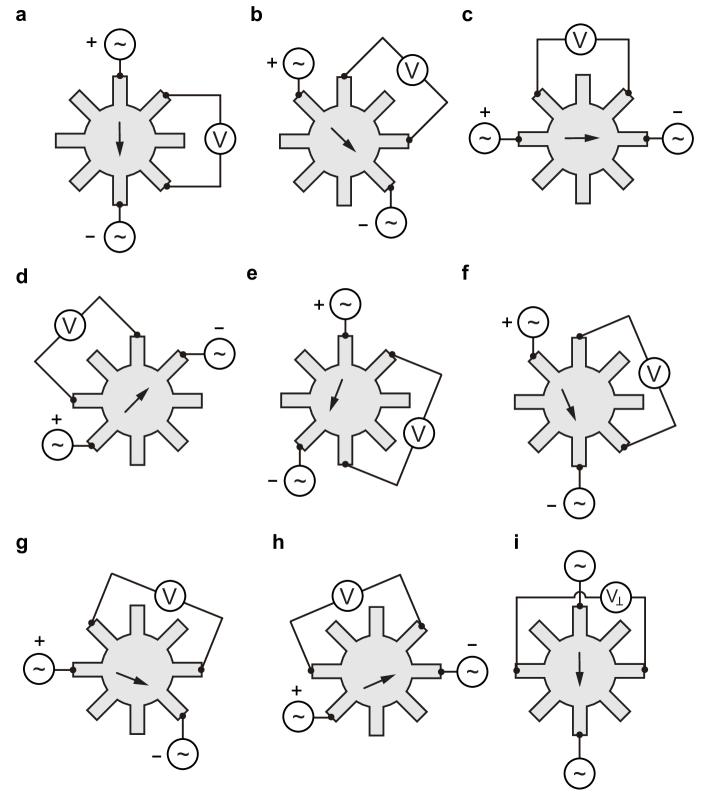
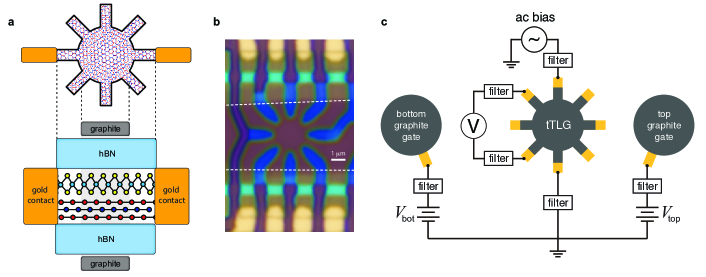
In this work, we investigate the angular dependence of transport nonreciprocity in mirror-symmetric twisted trilayer graphene (tTLG), which sheds new light on the nature of spontaneous symmetry breaking in a moiré flat band. To perform the angle-resolved transport measurement, we shape tTLG samples into the “sunflower” geometry, as shown in Fig. 1g. By using different contact pairs as source and drain, the “sunflower” geometry allows us to flow current is azimuth directions in the range of (see Fig. M1 for different measurement configurations). This provides the necessary resolution to identify angular oscillations with a period of and . When current flows along the azimuth direction , voltage responses and are measured between contact leads that are aligned parallel and perpendicular to the current flow direction, as shown in Fig. 1g. Longitudinal and transverse resistance are extracted as and , whereas nonreciprocity is defined as , .
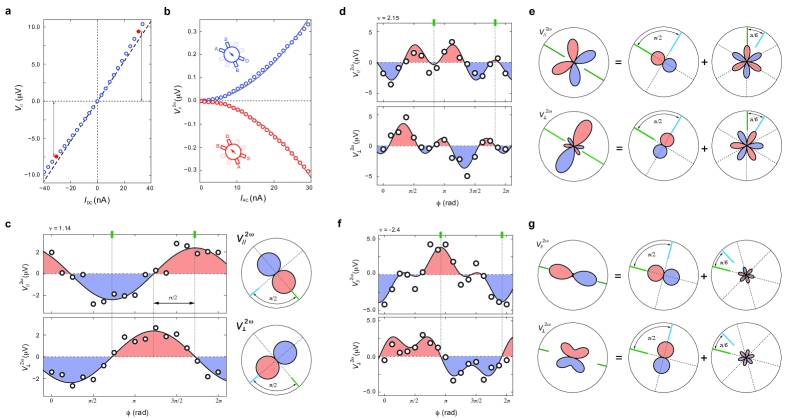
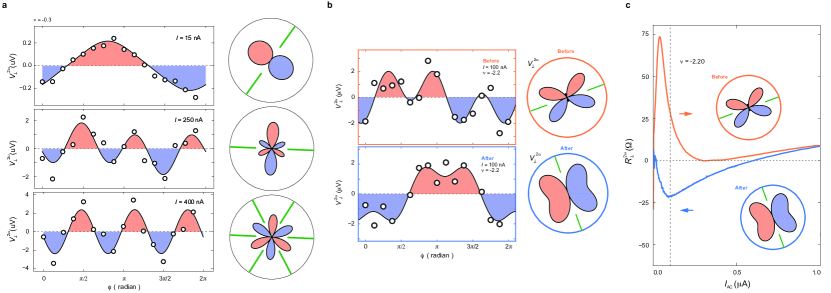
The presence of transport nonreciprocity is demonstrated by the current-voltage (I-V) characteristics in Fig. 2a, where the voltage response at large current deviates from the linear component (the black dashed line). The nonreciprocity, extracted by subtracting the linear component, exhibits a quadratic current dependence (see Fig. M4). In the presence of an AC current bias with frequency , the nonreciprocal response is proportional to . As such, can be conveniently probed as the amplitude of the AC response at the second-harmonic frequency . Fig. 2b plots the second-harmonic voltage response, , which exhibits the quadratic dependence on the AC current bias. A rotation of in the measurement configuration induces a sign reversal in . Since the sample geometry respects the rotation, the sign reversal offers a strong indication of two-fold rotational symmetry breaking. We note that nonreciprocity extracted from the DC I-V curve is equivalent to the second-harmonic nonlinear response (Fig. M5).
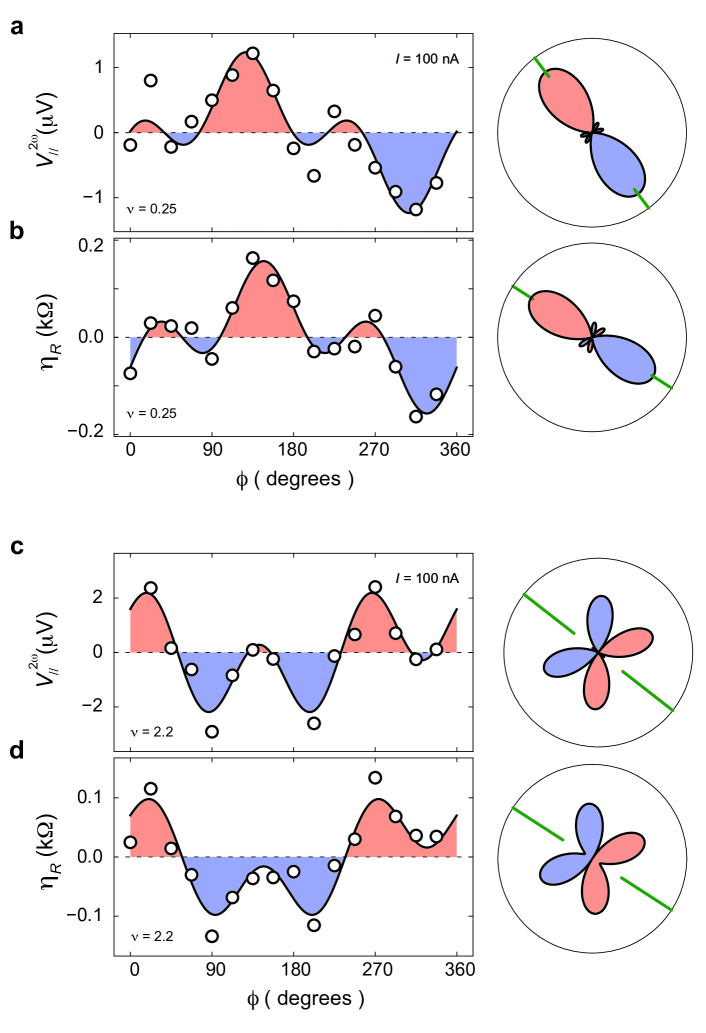
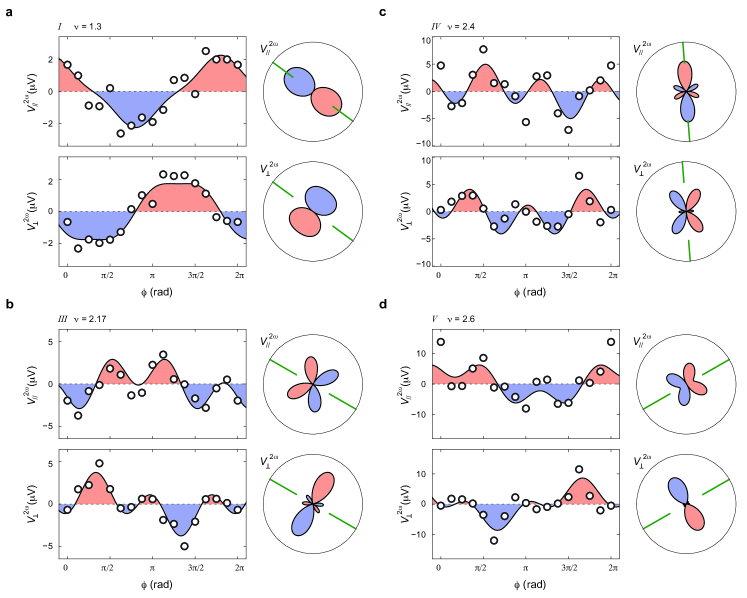
Fig. 2c-g plots the angular dependence of nonreciprocity measured at different moiré band fillings. At , both and are captured by cosine functions with a period of . Fig. 2c also displays a relative phase shift of across two channels. This is consistent with the presence of one mirror axis, which is marked by the green solid line in Fig. 2c. In comparison, the angular dependence in Fig. 2d and f exhibits a more complex functional form, which reveals a unique connection between longitudinal and transverse channels. Fig. 2e and g plots the polar-coordinate plot of the best angular fit for Fig. 2d and f (left panel), which is a linear combination of the one-fold (middle panel) and three-fold (right panel) components. Green and blue solid lines mark the phases of the longitudinal and transverse channels. Between these two channels, the one-fold components display a phase shift of whereas the phases of three-fold components are offset by .
The unique connection between longitudinal and transverse channels provides a strong constraint for identifying the functional form for the angular dependence of nonreciprocity. Both channels of nonreciprocity can be simultaneously captured by a rather simple expression,
| (1) |
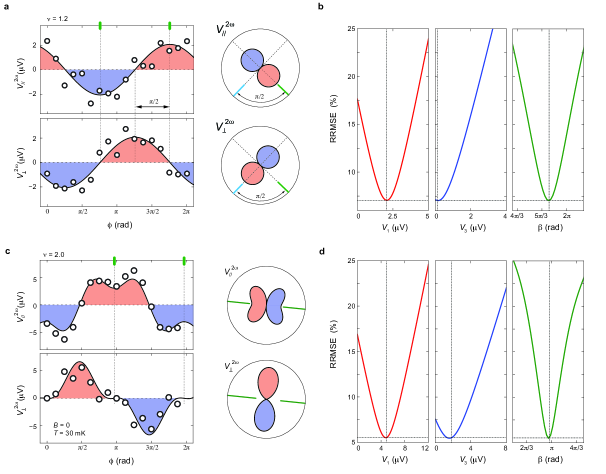
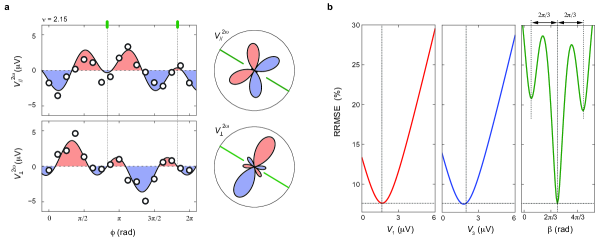
Here defines the azimuth orientation of the mirror axis. () denotes the amplitude of the one-fold (three-fold) component of the angular oscillation, whereas the phase shift between longitudinal and transverse channels is naturally captured by cosine and sine. Eq. 1 resembles a Fourier expansion around a mirror axis, where the longitudinal (transverse) nonreciprocity is expressed by the linear combination of (). While an expansion allows any odd integer values of , only and are observed in our measurement. Fig. M9 shows nonreciprocity measured with a higher angular resolution, which confirms that the dominating role of the and components.
The quality of the angular fit can be gauged based on the relative root mean square error (RRMSE), as shown in Fig. M6 and Fig. M7. RRMSE exhibits sharp minima around the optimal fitting parameter, suggesting that , and are uniquely determined. RRMSE of the best fit is around for the angular dependence in Fig. 2. This is a strong indication that Eq. 1 offers a good description for the angular dependence of nonreciprocity. The “sunflower” geometry also enables measurement and analysis schemes beyond the simple angle-resolved transport. These schemes offer direct assessment for the uniformity of the sample. Theoretically, the potential distribution across the circumference of the sample is solely determined by the conductivity matrix Vafek (2022). This distribution can be mapped through the linear transport response from an extensive series of measurement configurations, as shown in Fig. M8 Zhang et al. (2022). By fitting the potential distribution, a single conductivity matrix is extracted with a RRMSE of . The excellent fit quality points towards a uniform transport response across the entire sample, which indicates that the impact from moiré disorder and inhomogeneity is negligible.
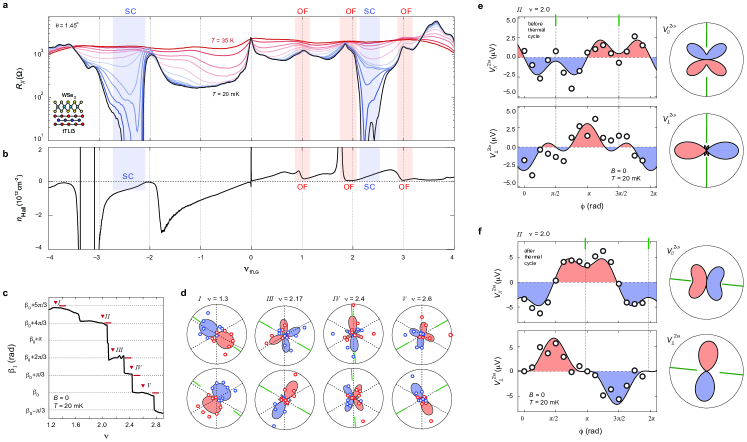
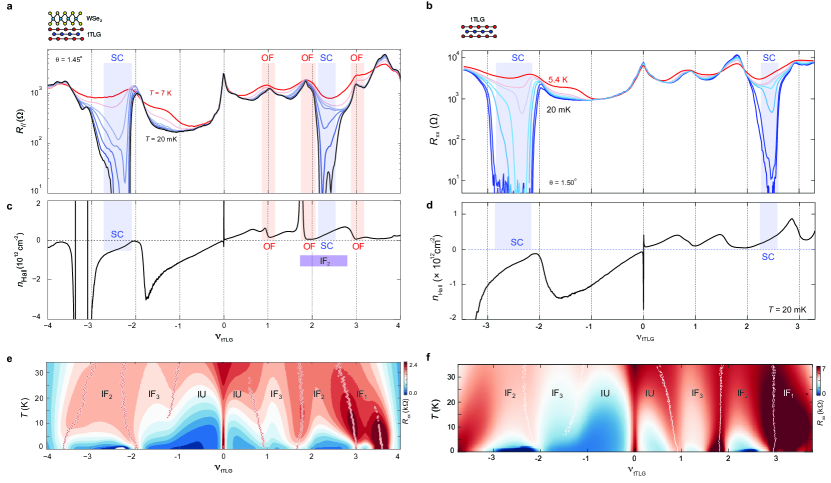
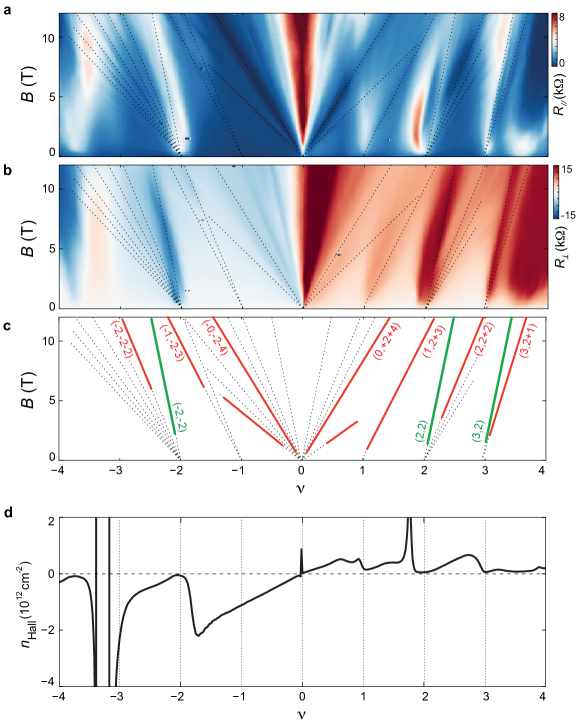
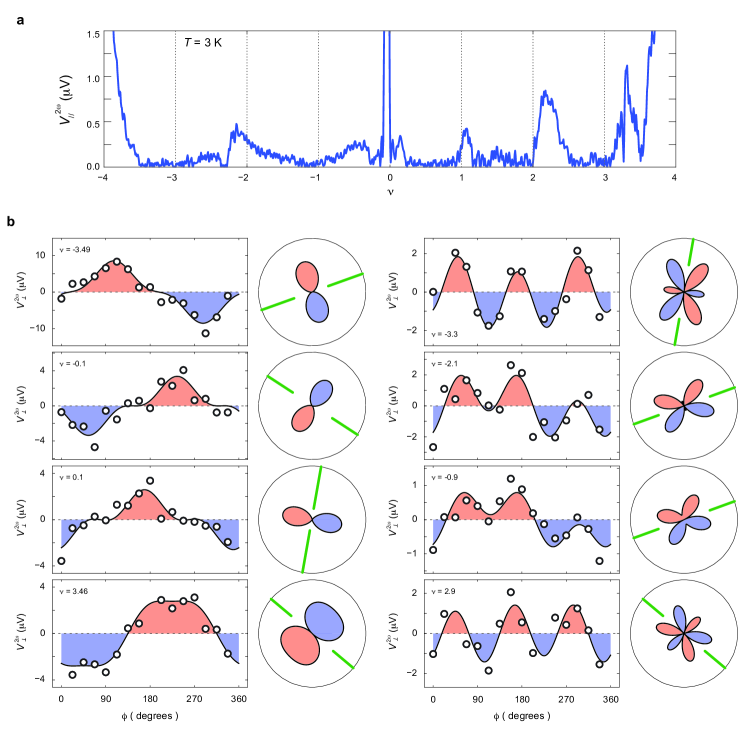
Next, we will examine the linear transport response of tTLG. As shown in Fig. 3a-b, the tTLG sample exhibits a series of hallmark signature of a moiré flat band. For instance, resistance peaks in is observed near , , , and (Fig. 3a), which coincides with resets in the Hall density (Fig. 3b). This is consistent with previous observations from magic-angle twisted graphene bilayer and trilayer, where valley and spin degeneracy is spontaneously lifted near integer band filling, giving rise to a cascade of Fermi surface reconstructions Zondiner et al. (2020); Park et al. (2021a); Xie and MacDonald (2021); Kang et al. (2021); Liu et al. (2022). As shown in the inset of Fig. 3a, the tTLG is proximitized with a WSe2 crystal. Fig. S3 investigates the influence of the proximity effect through comparison with another tTLG sample without the WSe2 crystal. In both samples, Fermi surface reconstruction, evidenced by resistance peak and Hall density reset, occurs at the same band fillings. Superconductivity in both samples emerges near half-filling of electron- and hole-doped bands. Moreover, the band-filling-temperature () maps from both samples reveal the same resistance oscillation at high temperature. Combined, these observations suggest that the nature of isospin degeneracy lifting is unaffected by the proximity effect. The orbital ferromagnetic order, however, is only observed in the tTLG sample with the proximity effect. This is consistent with previous observations of proximity-induced anomalous Hall effect in magic-angle twisted bilayer graphene Lin et al. (2022a).
Beyond the sequence of Fermi surface reconstructions, angle-resolved nonreciprocity measurement reveals a new type of cascade phenomenon. Fig. 3c and d shows the angular dependence of and in the density regime of . The orientation of the mirror axis, marked by the green solid line, is determined by the best angular fit based on Eq. 1. As a function of band filling, exhibits a series of plateaus (black solid line in Fig. 3c), which point towards a cascade of rotations in the mirror axis. The values of between adjacent plateaus, marked as I through V, are offset by integer multiple of . This defines six characteristic directions, highlighting a possible link to the crystallographic axes of the underlying moiré lattice.
According to the angular dependence of nonreciprocity in Fig. 3d, the underlying electronic order features a single mirror axis, which is indicative of broken three-fold rotational symmetry . That the mirror axis rotates with varying moiré band filling stipulates that the breaking cannot be accounted for by the influence of hetero-strain alone. In addition, we show that a hysteretic rotation in the mirror axis can be induced by thermal cycling the sample, or the application of a large current bias. Fig. 3e-f compares the angular dependence of nonreciprocity measured at the same moiré filling from two consecutive cool down cycles. The best angular fit with Eq. 1 reveals a prominent rotation in the mirror axis before (Fig. 3e) and after the thermal cycle (Fig. 3f). Similarly, the application of a large current bias also enables a prominent rotation in the mirror axis, as shown in (Fig. M2b. Such hysteretic transition is associated with a hysteresis loop in the second-harmonic nonlinear response as current bias is swept back and forth (Fig. M2c). These hysteretic transitions point towards nearly degenerate electronic orders with different mirror axis orientations. The degeneracy is lifted by the process of spontaneous rotational symmetry breaking.
The foremost question is the microscopic origin underlying the rotational symmetry breaking. To address this question, we first consider the requirements of symmetry breaking in association with time-reversal symmetry . There are two possible scenarios (see detailed discussion in SI): (i) is broken and is preserved. This scenario can be enabled by Berry curvature dipole and skew scattering Ma et al. (2019); Kang et al. (2019); He et al. (2022); Sinha et al. (2022); (ii) and breaking occurs simultaneously. Owing to the influence of trigonal warping in tTLG Khalaf et al. (2019); Hao et al. (2021), and breaking are naturally realized by the presence of valley polarization, which describes an imbalanced charge carrier occupation of Fermi surface across different corners of the Brillouin zone Novoselov et al. (2004, 2005); Geim and Grigorieva (2013); Novoselov et al. (2016); Ajayan et al. (2016). In the presence of sublattice polarization, valley polarization is directly linked to an orbital ferromagnetic order, which is identifiable through the hysteretic transitions of the anomalous Hall effect Sharpe et al. (2019); Serlin et al. (2020); Lin et al. (2022a).
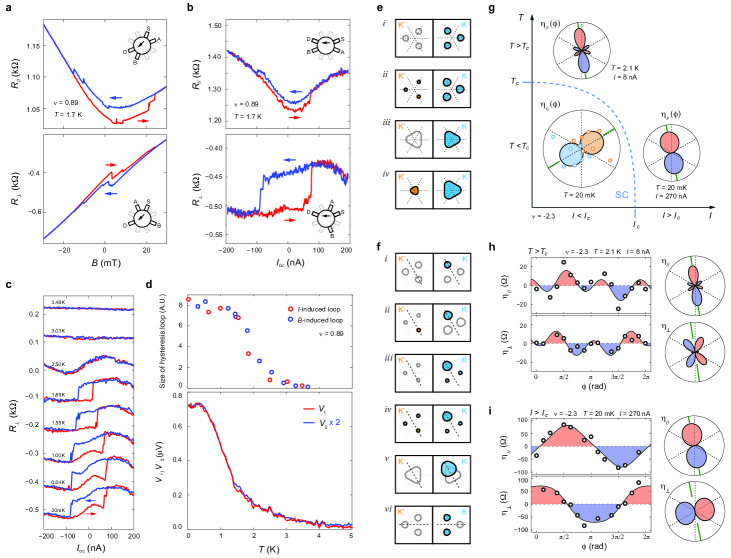
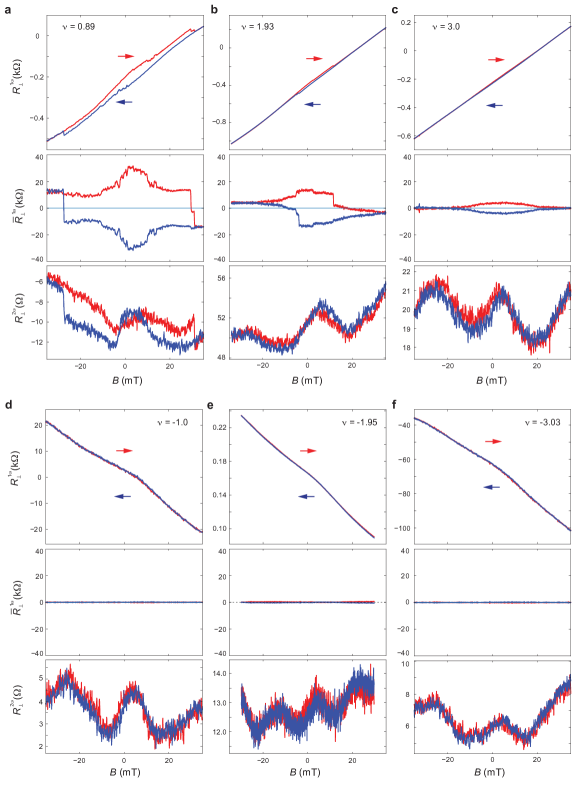
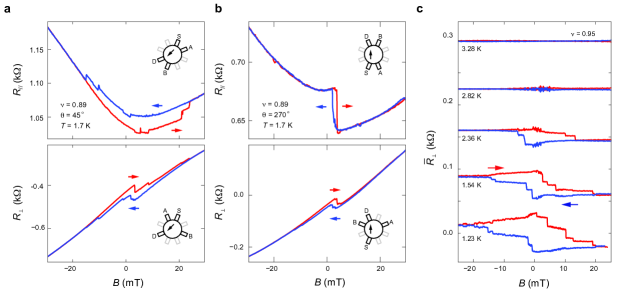
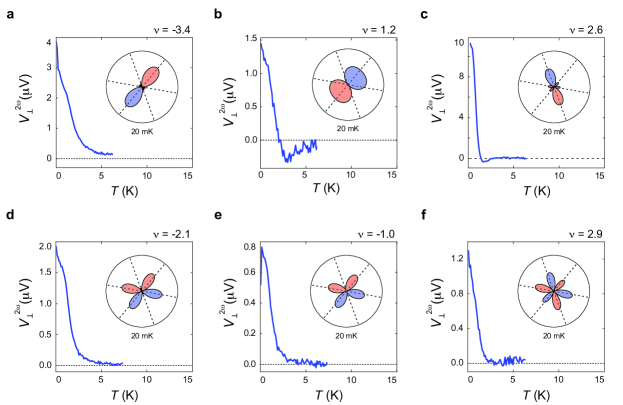
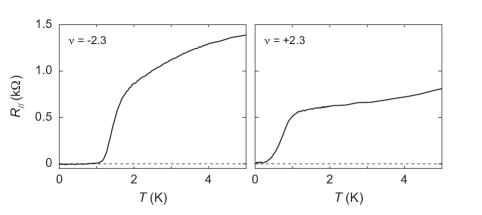
Given the hysteretic rotation in the mirror axis and the evolution with moiré band filling, the angular dependence of nonreciprocity likely cannot be accounted for by Berry curvature dipole or skew scattering. Therefore, we examine the potential role of valley polarization and orbital ferromagnetism. In the tTLG sample, orbital ferromagnetic order is observed near integer fillings of the electron-doped band. Fig. 4a-b plots transport response measured at as a function of magnetic field and DC current bias . As and are swept back and forth, hysteretic transitions are observed in both (top panels) and (bottom panels). This is in excellent agreement with the anomalous Hall effect observed in other multilayer graphene heterostructures Serlin et al. (2020); Chen et al. (2021); Polshyn et al. (2020); Lin et al. (2022a). Owing to the presence of a Dirac-like band, tTLG sample is always metallic, even when the moiré flat band develops an energy gap with the emergence of orbital ferromagnetism. The metallic sample gives rise to a -dependent background in the Hall resistance, making it challenging to observe the magnetic hysteresis loop. However, the -induced hysteresis is clearly detectable in both and , since the Hall resistance background is unaffected by the current bias. Both the magnetic and current-induced hysteresis exhibits a sharp onset with decreasing temperature (Fig. 4c and Fig. S7), which defines the emergence of the orbital ferromagnetic order.
The area of the hysteresis loop, and , offers a gauge for the strength of the orbital ferromagnetic order. With decreasing temperature, the sharp onset in and (top panel of Fig. 4d) coincides with the onset of transport nonreciprocity, which is shown as the temperature dependence of and (bottom panel of Fig. 4d), extracted from the angular oscillation of nonreciprocity. The temperature dependence points towards a direct link between transport nonreciprocity, valley polarization, and the orbital ferromagnetism.
It should be noted that valley polarization breaks and , but it preserves their product . Since the realization of an orbital ferromagnetic order requires breaking, valley polarization in tTLG is distinct from orbital ferromagnetism. We propose that breaking is not a necessary ingredient for transport nonreciprocity. This is further supported by the fact that nonreciprocity is observed universally across the moiré band (Fig. S10), even in the absence of the anomalous Hall effect. The strength of nonreciprocity, reflected by the angular oscillation amplitude , exhibits a density-modulation with the cascade of Fermi surface reconstructions (see Fig. S10a). This highlights the direct link between nonreciprocity and a valley-imbalanced charge carrier occupation.
Fig. 4e shows schematic diagram of valley-imbalanced Fermi surface occupation, which includes scenarios with three Fermi pockets (Panel i and ii) or one large Fermi surface per valley (Panel iii and iv). A valley-imbalance could also arise from a partial polarization, where carriers occupy both valleys (Panel ii and iv). Regardless of the detail, a valley-imbalanced Fermi surface occupation has three mirror axes (black dashed lines in Fig. 4e). The angular dependence of nonreciprocity with non-zero , therefore, requires an additional symmetry breaking ingredient. This symmetry requirement is naturally satisfied by the exchange-driven instability in the momentum space, which breaks by inducing charge carrier condensation into a sub-set of Fermi pockets Dong et al. (2023); Jung et al. (2015); Huang et al. (2022); Cheung et al. (2018). Fig. 4f shows a series of Fermi surface occupations with one mirror axis (black dashed line). Panel i displays a state with full momentum polarization, where all carriers condense into one Fermi pocket. Whereas panel iv represents a partial momentum polarization, with one Fermi pocket being slightly larger compared to the other five. It should be noted that nonreciprocity diminishes for a valley balanced carrier occupation. This allows valley and momentum polarization to be detected through nonreciprocity with high sensitivity. As a result, the observed nonreciprocity could arise from an extremely subtle imbalance in carrier occupation across Fermi pockets and valleys. This allows the momentum-space instability to emerge as a perturbation to other types of electronic order, such as orthorhombic anisotropy, while still accounts for the observed angular dependence in nonreciprocity.
Next, we discuss the potential influence of certain scattering mechanism, such as skew scattering and Berry curvature dipole Ma et al. (2019); Kang et al. (2019); He et al. (2022); Sinha et al. (2022). Apart from the hysteretic rotation in the mirror axis, we note that nonreciprocity in tTLG is observed only at K (Fig. 4d and Fig. S11), which is much lower compared to the typical onset temperature of scattering around hundreds of Kelvin Ma et al. (2019); Kang et al. (2019); He et al. (2022); Sinha et al. (2022). Nevertheless, the presence of scattering could influence transport nonreciprocity indirectly. The exact role of scattering will certainly attract future efforts aiming to better understand the microscopic origin of the transport nonreciprocity.
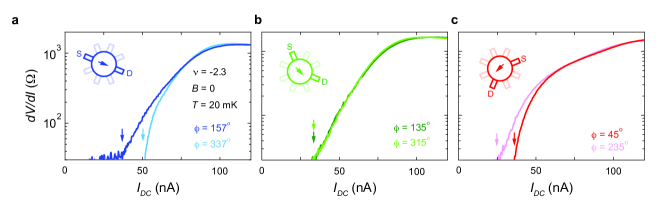
Despite the lack of a microscopic understanding, it is instructive to examine the phenomenological behavior of the superconducting diode effect. Nonreciprocity in the superconducting transport is defined as an inequality in the critical supercurrent between forward and reversed current bias, Lin et al. (2022b); Scammell et al. (2022). To minimize the potential influence of the normal state at large current, we operationally define the critical current as the current bias where the measured differential resistance becomes larger than the noise floor Benyamini et al. (2019), which is marked by vertical arrows in Fig. S8. At the optimal density of the superconducting phase, the angular dependence of , shown as the bottom left inset in Fig. 4g, is best fit by a cosine function with a period of . This defines a single mirror axis, which indicates symmetry breaking. Since the superconducting diode effect also requires simultaneously breaking and , the angular dependence of superconducting nonreciprocity points towards the same symmetry requirement as the momentum-space instability.
Fig. 4g-h plots the angular dependence of nonreciprocity measured from the normal state at (Fig. 4g) and (Fig. 4h). The angular dependence points towards a single mirror axis that breaks and symmetry simultaneously. The similarity between the normal and superconducting phases raises the possibility that superconductivity inherits the broken symmetries of the normal state. In this scenario, the momentum-space instability offers a mechanistic explanation for the zero-field superconducting diode effect Lin et al. (2022b).
References
- Fradkin et al. (2010) E. Fradkin, S. A. Kivelson, M. J. Lawler, J. P. Eisenstein, and A. P. Mackenzie, The Annual Review of Condensed Matter Physics is 1, 153 (2010).
- Oganesyan et al. (2001) V. Oganesyan, S. A. Kivelson, and E. Fradkin, Physical Review B 64, 195109 (2001).
- Kivelson et al. (1998) S. A. Kivelson, E. Fradkin, and V. J. Emery, Nature 393, 550 (1998).
- Wu et al. (2017) J. Wu, A. Bollinger, X. He, and I. Božović, Nature 547, 432 (2017).
- Wu et al. (2020) J. Wu, H. P. Nair, A. T. Bollinger, X. He, I. Robinson, N. J. Schreiber, K. M. Shen, D. G. Schlom, and I. Božović, Proceedings of the National Academy of Sciences 117, 10654 (2020).
- Ando et al. (2002) Y. Ando, K. Segawa, S. Komiya, and A. N. Lavrov, Phys. Rev. Lett. 88, 137005 (2002).
- Hinkov et al. (2008) V. Hinkov, D. Haug, B. Fauqué, P. Bourges, Y. Sidis, A. Ivanov, C. Bernhard, C. Lin, and B. Keimer, Science 319, 597 (2008).
- Jiang et al. (2019) Y. Jiang, X. Lai, K. Watanabe, T. Taniguchi, K. Haule, J. Mao, and E. Y. Andrei, Nature 573, 91 (2019).
- Choi et al. (2019) Y. Choi, J. Kemmer, Y. Peng, A. Thomson, H. Arora, R. Polski, Y. Zhang, H. Ren, J. Alicea, G. Refael, et al., Nature Physics 15, 1174 (2019).
- Kerelsky et al. (2019) A. Kerelsky, L. J. McGilly, D. M. Kennes, L. Xian, M. Yankowitz, S. Chen, K. Watanabe, T. Taniguchi, J. Hone, C. Dean, et al., Nature 572, 95 (2019).
- Cao et al. (2021) Y. Cao, D. Rodan-Legrain, J. M. Park, N. F. Yuan, K. Watanabe, T. Taniguchi, R. M. Fernandes, L. Fu, and P. Jarillo-Herrero, Science 372, 264 (2021).
- Rubio-Verdú et al. (2022) C. Rubio-Verdú, S. Turkel, Y. Song, L. Klebl, R. Samajdar, M. S. Scheurer, J. W. Venderbos, K. Watanabe, T. Taniguchi, H. Ochoa, et al., Nature Physics 18, 196 (2022).
- Zhang et al. (2022) N. J. Zhang, K. Watanabe, T. Taniguchi, O. Vafek, and J. I. A. Li, arXiv preprint (2022), arXiv:2211.01352 .
- Lin et al. (2023) J.-X. Lin, Y. Wang, N. J. Zhang, K. Watanabe, T. Taniguchi, L. Fu, and J. Li, arXiv preprint arXiv:2302.04261 (2023).
- Dong et al. (2023) Z. Dong, M. Davydova, O. Ogunnaike, and L. Levitov, Phys. Rev. B 107, 075108 (2023).
- Jung et al. (2015) J. Jung, M. Polini, and A. H. MacDonald, Physical Review B 91, 155423 (2015).
- Huang et al. (2022) C. Huang, T. Wolf, W. Qin, N. Wei, I. Blinov, and A. MacDonald, arXiv preprint arXiv:2203.12723 (2022).
- Vafek (2022) O. Vafek, arXiv preprint arXiv:2209.08208 (2022).
- Zondiner et al. (2020) U. Zondiner, A. Rozen, D. Rodan-Legrain, Y. Cao, R. Queiroz, T. Taniguchi, K. Watanabe, Y. Oreg, F. von Oppen, A. Stern, et al., Nature 582, 203 (2020).
- Park et al. (2021a) J. M. Park, Y. Cao, K. Watanabe, T. Taniguchi, and P. Jarillo-Herrero, Nature 592, 43 (2021a).
- Xie and MacDonald (2021) M. Xie and A. H. MacDonald, Phys. Rev. Lett. 127, 196401 (2021).
- Kang et al. (2021) J. Kang, B. A. Bernevig, and O. Vafek, Physical review letters 127, 266402 (2021).
- Liu et al. (2022) X. Liu, N. Zhang, K. Watanabe, T. Taniguchi, and J. Li, Nature Physics 18, 522 (2022).
- Lin et al. (2022a) J.-X. Lin, Y.-H. Zhang, E. Morissette, Z. Wang, S. Liu, D. Rhodes, K. Watanabe, T. Taniguchi, J. Hone, and J. Li, Science 375, 437 (2022a).
- Ma et al. (2019) Q. Ma, S.-Y. Xu, H. Shen, D. MacNeill, V. Fatemi, T.-R. Chang, A. M. Mier Valdivia, S. Wu, Z. Du, C.-H. Hsu, et al., Nature 565, 337 (2019).
- Kang et al. (2019) K. Kang, T. Li, E. Sohn, J. Shan, and K. F. Mak, Nature materials 18, 324 (2019).
- He et al. (2022) P. He, G. K. W. Koon, H. Isobe, J. Y. Tan, J. Hu, A. H. C. Neto, L. Fu, and H. Yang, Nature Nanotechnology 17, 378 (2022).
- Sinha et al. (2022) S. Sinha, P. C. Adak, A. Chakraborty, K. Das, K. Debnath, L. Sangani, K. Watanabe, T. Taniguchi, U. V. Waghmare, A. Agarwal, et al., Nature Physics 18, 765 (2022).
- Khalaf et al. (2019) E. Khalaf, A. J. Kruchkov, G. Tarnopolsky, and A. Vishwanath, Phys. Rev. B 100, 085109 (2019).
- Hao et al. (2021) Z. Hao, A. Zimmerman, P. Ledwith, E. Khalaf, D. H. Najafabadi, K. Watanabe, T. Taniguchi, A. Vishwanath, and P. Kim, Science 371, 1133 (2021).
- Novoselov et al. (2004) K. S. Novoselov, A. K. Geim, S. V. Morozov, D. Jiang, Y. Zhang, S. V. Dubonos, I. V. Grigorieva, and A. A. Firsov, Science 306, 666 (2004).
- Novoselov et al. (2005) K. S. Novoselov, A. K. Geim, S. V. B. Morozov, D. Jiang, M. Katsnelson, I. Grigorieva, S. Dubonos, and A. Firsov, nature 438, 197 (2005).
- Geim and Grigorieva (2013) A. K. Geim and I. V. Grigorieva, Nature 499, 419 (2013).
- Novoselov et al. (2016) K. Novoselov, A. Mishchenko, A. Carvalho, and A. C. Neto, Science 353, aac9439 (2016).
- Ajayan et al. (2016) P. Ajayan, P. Kim, and K. Banerjee, Physics Today 69, 9 (2016).
- Sharpe et al. (2019) A. L. Sharpe, E. J. Fox, A. W. Barnard, J. Finney, K. Watanabe, T. Taniguchi, M. Kastner, and D. Goldhaber-Gordon, Science 365, 605 (2019).
- Serlin et al. (2020) M. Serlin, C. Tschirhart, H. Polshyn, Y. Zhang, J. Zhu, K. Watanabe, T. Taniguchi, L. Balents, and A. Young, Science 367, 900 (2020).
- Chen et al. (2021) S. Chen, M. He, Y.-H. Zhang, V. Hsieh, Z. Fei, K. Watanabe, T. Taniguchi, D. H. Cobden, X. Xu, C. R. Dean, and M. Yankowitz, Nature Physics 17, 374 (2021).
- Polshyn et al. (2020) H. Polshyn, J. Zhu, M. Kumar, Y. Zhang, F. Yang, C. Tschirhart, M. Serlin, K. Watanabe, T. Taniguchi, A. MacDonald, and A. F. Young, Nature 588, 66 (2020).
- Cheung et al. (2018) P. Cheung, Z.-q. Bao, and F. Zhang, arXiv preprint arXiv:1805.06493 (2018).
- Lin et al. (2022b) J.-X. Lin, P. Siriviboon, H. D. Scammell, S. Liu, D. Rhodes, K. Watanabe, T. Taniguchi, J. Hone, M. S. Scheurer, and J. Li, Nature Physics (2022b), 10.1038/s41567-022-01700-1.
- Scammell et al. (2022) H. D. Scammell, J. Li, and M. S. Scheurer, 2D Materials 9, 025027 (2022).
- Benyamini et al. (2019) A. Benyamini, E. Telford, D. Kennes, D. Wang, A. Williams, K. Watanabe, T. Taniguchi, D. Shahar, J. Hone, C. Dean, et al., Nature Physics 15, 947 (2019).
- Saito et al. (2021a) Y. Saito, F. Yang, J. Ge, X. Liu, T. Taniguchi, K. Watanabe, J. Li, E. Berg, and A. F. Young, Nature 592, 220 (2021a).
- Xie et al. (2021) Y. Xie, A. T. Pierce, J. M. Park, D. E. Parker, E. Khalaf, P. Ledwith, Y. Cao, S. H. Lee, S. Chen, P. R. Forrester, et al., Nature 600, 439 (2021).
- Spanton et al. (2018) E. M. Spanton, A. A. Zibrov, H. Zhou, T. Taniguchi, K. Watanabe, M. P. Zaletel, and A. F. Young, Science 360, 62 (2018).
- Das et al. (2021) I. Das, X. Lu, J. Herzog-Arbeitman, Z.-D. Song, K. Watanabe, T. Taniguchi, B. A. Bernevig, and D. K. Efetov, Nature Physics 17, 710 (2021).
- Saito et al. (2021b) Y. Saito, J. Ge, L. Rademaker, K. Watanabe, T. Taniguchi, D. A. Abanin, and A. F. Young, Nature Physics 17, 478 (2021b).
- Park et al. (2021b) J. M. Park, Y. Cao, K. Watanabe, T. Taniguchi, and P. Jarillo-Herrero, Nature 590, 249 (2021b).
Method
.1 Hysteresis in the Mirror Axis Orientation
Apart from thermal cycle, hysteretic rotation in the mirror axis can also be induced by a large current bias.
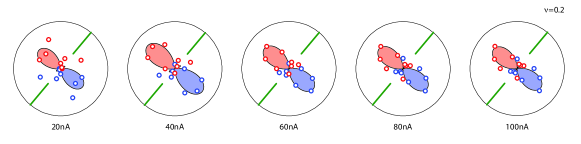
Fig. M2 demonstrates the current-induced tunability in the angular dependence of nonreciprocity. Fig. M2a plots the angular dependence of measured at the same carrier density with different current bias. The angular dependence behaves like a cosine function with a period of at low current bias. It changes to a linear combination of and as current bias is increased to nA. At nA, the angular dependence becomes largely three-fold symmetric, albeit the quality of the angular fit becomes poorer at this large current.
The current-induced change in the angular dependence of nonreciprocity can be hysteretic, i.e. the angular dependence of nonreciprocity, measured with a small current bias, is different before and after a large current bias. The hysteretic behavior is shown in Fig. M2b. Before (after) applying a large current bias at A, the angular dependence measured at is highlighted by the orange (blue) box. In both cases, the angular dependence is a linear combination of and . However, the mirror axis, marked by green solid lines, exhibits a prominent rotation before and after the current bias.
The hysteretic rotation gives rise to a hysteresis loop in the second harmonic nonlinear response (Fig. M2c), which is defined as . The insets in Fig. M2c are schematic of the angular dependence measured before and after sweeping the current up and down.
Furthermore, we note that current-induced hysteresis usually occurs at large current bias. Fig. M3 shows the angular dependence of nonreciprocity measured with different DC current bias. Up to nA, the angular dependence of nonreciprocity, along with its associated mirror axis orientation, remain the same. As such, the angular dependence reported in this work is mostly carried out at nA, unless otherwise specified.
.2 Nonreciprocity and nonlinearity
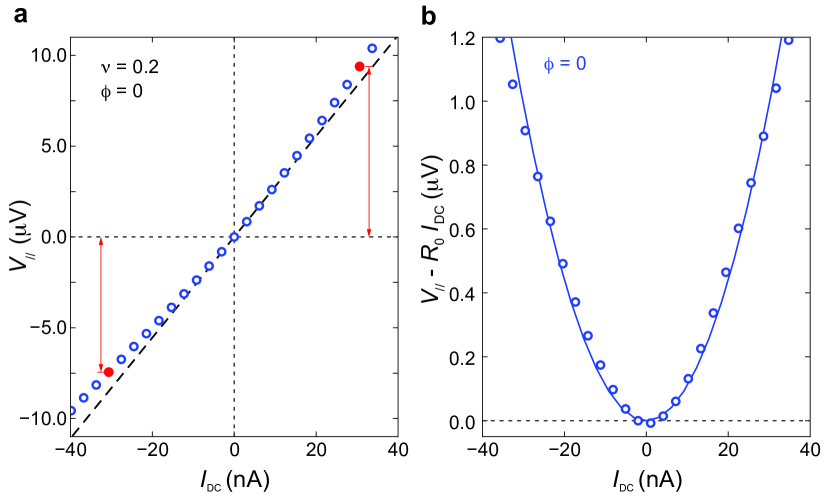
Transport nonreciprocity can be extracted from the I-V curve measured with a DC current bias. As shown in Fig. M4a, the IV curve deviates from the linear response (black dashed line) at large current bias. As a result of the deviation, longitudinal resistance , defined as , is larger at the positive current bias compared to the negative bias (red circles in Fig. M4a). Subtracting the linear component reveals the nonreciprocal response, , where denotes the slope of the IV curve at . The nonreciprocal component is shown to have a quadratic current dependence, (the black solid line in Fig. M4b is a quadratic fit to the data).
Given the quadratic current dependence in , nonreciprocity can be expressed as in the presence of an AC current bias with frequency . As such, is equivalent to the nonlinear transport response measured at the second harmonic frequency of an AC current bias.
Fig. M4c-d shows the a.c. current dependence of the second-harmonic nonlinear response in the longitudinal and transverse channel, and . The nonlinear response in both channels exhibit a sign reversal upon reversing the current flow direction, even though the measurement configurations respect chiral symmetry. Such a sign reversal provides a strong indication for symmetry breaking.
Fig. M5 compares the angular dependence of transport nonreciprocity with the nonlinear response at the second harmonic frequency. The azimuth angle defines the direction of current flow across the sunflower-shaped sample. Different is realized using the measurement configurations shown in Fig. M1.
Fig. M5b and d plots the angular dependence of , which are extracted from d.c. transport IV curves with current flowing in different azimuth directions. The value of along is defined as the difference in between current flowing in the azimuth direction of and ,
| (M1) |
Here is the transport response at a fixed d.c. current value nA. By definition, displays a sign reversal between forward and reversed current bias.
Fig. M5a and c plots the angular dependence of the second-harmonic nonlinear transport response , which is measured at the same band fillings as panel b and d. The value of along is simply defined as the voltage response at the second-harmonic frequency as an a.c. current is biased along azimuth direction of . Based on this comparison, we make a few important observations: (i) the angular dependence of shows excellent agreement with that of the second-harmonic nonlinear response ; (ii) the angular dependence can be captured by a linear combination of one-fold and three-fold symmetric components; (iii) the one-fold symmetric component of the angular dependence is aligned along the corner of the Brillouin zone. The azimuth directions of all six corners are marked by dashed lines in the polar-coordinate plots of Fig. M5. Combined, the angular dependence of transport nonreciprocity and the second-harmonic nonlinear response offers further confirmation for the exchange-driven instability in the valley and momentum space.
.3 Mean-square Error in the angular fit
The procedure for determining the best angular fit for transport nonreciprocity is demonstrated in Fig. M6. In general, the best angular fit is obtained by minimizing the relative root-mean-squared error (RRMSE), which is defined as
| (M2) |
where is the th point of the measurement results and is the value of the best fit at the corresponding azimuth direction. denotes the number of points. for the angular fit for longitudinal and transverse responses, since there are angles for each transport channel. Fig. M6b and d shows the evolution of the RRMSE as one of the fit parameters deviates from the parameter of the best angular fit, while the other two fit parameters are fixed at the value of the best fit. According to Eq. 1, the fit parameter , , and creates a three-dimensional phase space for identifying the best angular fit. For the angular dependence in Fig. M6 a and c, RRMSE is around for the best fit. This indicates that the angular dependence of nonreciprocity is well-captured by Eq. 1.
Fig. M7 examines the best fit for the angular dependence at , where the best fit features a strong 3-fold symmetric component. The RRMSE of the best fit is around . While slightly larger compared to Fig. M6, a RRMSE below is considered a good angular fit. That a predominantly three-fold symmetric behavior has slightly higher error is understandable, since the angular oscillation is approaching the resolution of the sunflower geometry. We note that the right panel of Fig. M7b exhibits two extra local minima in RRMSE, which are located away from the optimal value of . These two local minima provides a strong indication for the three-fold symmetric component in the angular dependence of nonreciprocity.
.4 The potential impact of moiré disorder, sample uniformity and ballistic transport
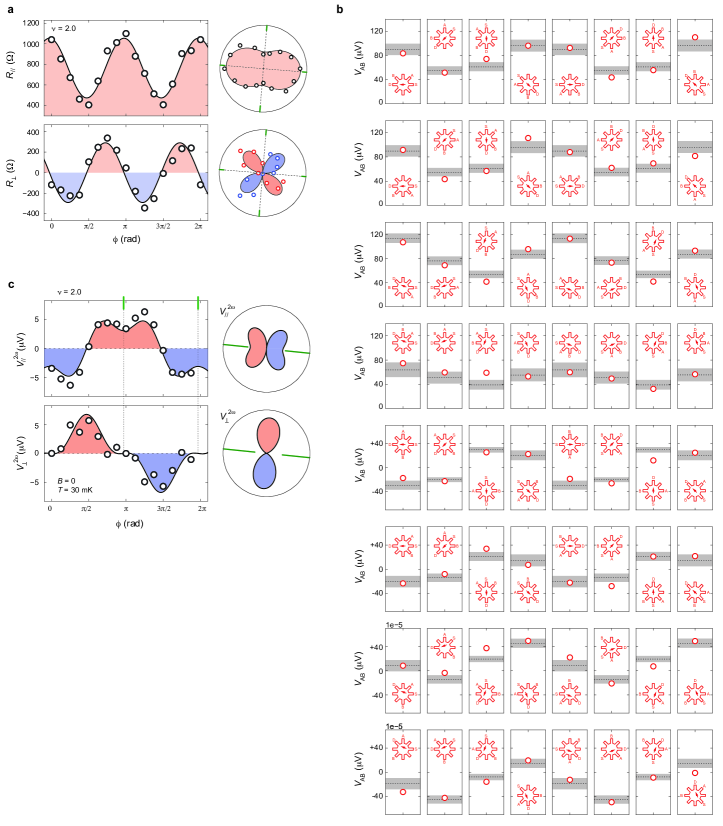
Fig. M8a plots the angular dependence of the linear transport response, and . The angular dependence is in excellent agreement with the expected behavior of an orthorhombic anisotropy, as shown in Fig. 1d. The angular oscillation points towards two orthogonal mirror axes. The sample exhibits different conductivity as current flows along each mirror axis. The angular dependence in Fig. M8a can be captured by a conductivity matrix. According to Ref. Vafek (2022), knowledge of the conductivity matrix allows us to compute the potential distribution across the entire sample, as long as electrons move through the sample diffusively, i.e. electron transport is non-ballistic.
The “sunflower” sample geometry features eight electrical contacts (petals) attached to the circumference of a circular sample channel. The geometry allows more than independent measurement configurations: picking any two contacts as source and drain, a voltage measurement can be performed across any two of the remaining contacts. While configurations appear redundant, they allow us to fully map the potential distribution across the circumference of the sample. By fitting these measurements with a single conductivity matrix with the “sunflower” model, we can gain insight into the uniformity of transport response across the sample.
Fig. M8b plots results from a sub-set of all independent measurement configurations. Red circles denote the measured value, insets show schematic diagrams of each measurement configuration. The horizontal gray stripe in Fig. M8b is the expected value predicted by the “sunflower” model based on a single conductivity matrix Vafek (2022). The width of the gray stripe arises from the non-zero width of each electrical contact, which gives rise to a range of possible electrical potential.
Noticeably, measurement configurations from the same row are associated with an in-plane rotation. In the absence of electronic anisotropy, we anticipate the same measurement results from different configurations of the same row. That is to say, variations in the transport response across each row arises directly from the presence of electronic anisotropy. Different measurement configurations probe slightly different parts of the sample. For example, configurations in the fourth row from the top probe the transport response close to the circumference the sample. Results from all measurement configurations are reasonably captured by a single conductivity matrix. The RRMSE of this fit is around , which points towards an excellent agreement between the measurement and the model. The excellent fit provides a strong indication that the transport response is uniform across the entire sample.
As a by-product, the fit in Fig. M8b suggests that electron transport through the sample in a non-ballistic.
Fig. M8c displays the angular dependence of transport nonreciprocity measured at the same band filling. Green solid lines mark the orientation of the mirror axis. At this band filling, the mirror axis extracted from nonreciprocity is close to being aligned with the principle axis of the linear component of the transport response. In the SI section titled “Nematicity and momentum polarization”, we offer more detailed discussion regarding the relationship between the mirror axis of nonreciprocity and the principle axis of the linear transport.
Acknowledgments
J.I.A.L. wishes to thank Oskar Vafek and Dima Feldman for stimulating discussions. L.F. thanks the organizers of the workshop “Superconducting diode effects” on Virtual Science Forum, which ignited the collaboration. N.J.Z. acknowledge support from the Jun-Qi fellowship. J.I.A.L. acknowledge funding from NSF DMR-2143384. Device fabrication was performed in the Institute for Molecular and Nanoscale Innovation at Brown University. D.V.C. acknowledges financial support from the National High Magnetic Field Laboratory through a Dirac Fellowship, which is funded by the National Science Foundation (Grant No. DMR-1644779) and the State of Florida. K.W. and T.T. acknowledge support from the Elemental Strategy Initiative conducted by the MEXT, Japan (Grant Number JPMXP0112101001) and JSPS KAKENHI (Grant Numbers 19H05790, 20H00354 and 21H05233). The work at Massachusetts Institute of Technology was supported by a Simons Investigator Award from the Simons Foundation.
I Supplementary Materials
Angle-resolved transport nonreciprocity and spontaneous symmetry breaking in twisted trilayer graphene
Naiyuan James Zhang, Jiang-Xiazi Lin, Dmitry V. Chichinadze, Yibang Wang, Kenji Watanabe, Takashi Taniguchi, Liang Fu, and J.I.A. Li†
† Corresponding author. Email: jiali @brown.edu
This PDF file includes:
Figs. S1 to S13
Supplementary Text
Supplementary Data
Materials and Methods
II Supplementary Text
II.1 Nematicity and momentum polarization
There are several possible scenarios regarding the connection between momentum polarization and nematicity.
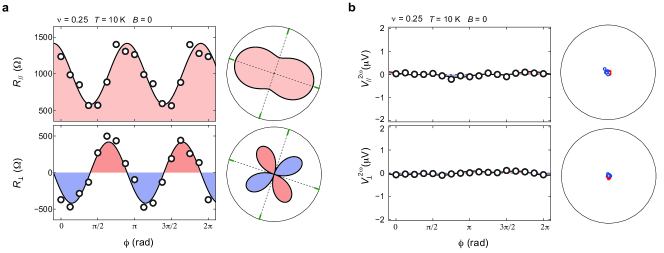
First, an electronic order with rotational symmetry breaking could still preserves the two-fold inplane rotation symmetry . For example, a quadruple distortion in the Fermi surface will give rise to an orthorhombic anisotropy, but it does not generate a nonreciprocal response. Such a situation is demonstrated by Fig. S1. At high temperature K, nonreciprocity is suppressed, whereas the orthorhombic anisotropy persists.
Secondly, the momentum space instability could be the only source of rotational symmetry breaking. In this case, the mirror axis of the nonreciprocal response would align with that of the linear transport. This scenario is consistent with the angular dependence of linear and nonlinear response in Fig. M8a and c.
While a momentum polarized Fermi surface occupation, as shown in Fig. 4f, induces an angular oscillation in the sample conductivity, the oscillation amplitude may be much smaller compared to the overall sample conductivity . As such, the angular dependence in is almost undetectable and the observed linear transport response is mostly isotropic. On the other hand, a symmetric order generates zero background in transport nonreciprocity. As a result, transport nonreciprocity is sensitive to an arbitrarily weak imbalance in the Fermi surface occupation across opposite valleys and different Fermi pockets.
Lastly, different types of Fermi surface distortions could occur simultaneously. In the scenario where the quadruple distortion is more prominent, the momentum space instability can be treated as a perturbation, which is mostly independent of the orthorhombic anisotropy. In this scenario, the mirror axis of the orthorhombic anisotropy can be misaligned from that of momentum polarization. As a result, the angular dependence of the linear transport response could exhibits a different mirror axis orientation compared to that of nonreciprocity. This scenario offers a possible explanation for the data shown in Fig. S2.
II.2 The proximity effect with WSe2
Fig. S3 directly compares two tTLG samples with and without the proximity effect from a crystal of WSe2. Fermi surface reconstructions are observed in both samples near the same band fillings at , , and (Fig. S3a-d). In both samples, superconductivity emerges near half-filling of both electron- and hole-doped bands (Fig. S3a-b). Moreover, the maps from both samples reveal the same phase diagram for isospin polarized phases, which are identified based on the oscillation in the longitudinal resistance. This is a strong confirmation that the influence of the proximity effect is not essential in realizing the angular dependence of nonreciprocity.
The orbital ferromagnetic (OF) order, however, is only observed in the tTLG sample with the proximity effect with WSe2. First of all, the observation of the OF in tTLG/WSe2 is consistent with previous observations in magic-angle twisted bilayer graphene, where anomalous Hall effect is enhanced by the proximity with WSe2 Lin et al. (2022a). The OF order requires simultaneously polarization in valley isospin and sublattice Serlin et al. (2020); Sharpe et al. (2019). In the tTLG/WSe2 sample, we propose that sublattice symmetry breaking is induced by the presence of WSe2, which accounts for the observation of the OF order in tTLG/WSe2 heterostructure.
II.3 Fermi surface contour and nonreciprocity
In the presence of two-fold inplane rotational symmetry breaking, the Fermi surface is distorted, giving rise to a contour as shown in Fig. 1b-c, as well as Fig. S4a-b.
For a circular Fermi surface that preserves , the band dispersion is symmetric with regard to for any azimuth direction, as shown in Fig. S4c. In this case, the same transport response is expected between forward and reversed current bias. On the other hand, a distorted Fermi surface with one or three mirror axis features asymmetric band dispersion (Fig. S4d) along the direction of the mirror axis (marked by black solid arrows in Fig. S4a-b). When current flows along these directions, the transport response is expected to be highly nonreciprocal.
Noticeably, along certain directions, even the distorted Fermi surface exhibits symmetric dispersion. These directions are marked by gray arrows in Fig. S4b-c. When current flows along these directions, nonreciprocity is expected to diminish to zero. This gives rise to the angular oscillation in nonreciprocity.
The broken symmetries of a Fermi surface can be characterized by the azimuth directions where the energy band structure is symmetric, or asymmetric. As shown in Fig. S4b and c, the azimuth directions with symmetric and asymmetric band dispersion are marked with grey and black arrows, respectively. For instance, the one-fold symmetric Fermi surface exhibits an asymmetric band dispersion along azimuth direction of and , whereas the band structure is symmetric along and . This Fermi surface contour can be identified based on the angular dependence of transport nonreciprocity. Maximum positive and negative nonreciprocity is expected when current flows along and , whereas the transport behavior should be reciprocal along and . On the other hand, the three-fold symmetric Fermi surface in Fig. S4c will give rise to a different angular dependence. There are three pairs of azimuth direction where prominent transport nonreciprocity is expected (black arrows). Transport nonreciprocity diminishes when current flows along the azimuth directions marked by grey arrows. Taken together, the ARNTM provides a direct tool to probe and characterize the shape of Fermi surface contour.
If charge carriers equally occupy three trigonal-warping-induced Fermi pockets in one of the valley, the symmetry of the resulting Fermi surface is equivalent to Fig. S4c. In this case, we expect to observe a three-fold symmetric angular dependence in the transport nonreciprocity. The exchange-driven instability in the momentum space induces charge carriers to condense into one of the Fermi pocket. The resulting Fermi surface contour shares the same broken symmetries as Fig. S4b, which can be identified based on a one-fold symmetric angular dependence in the transport nonreciprocity.
II.4 Cascade of isospin transitions
Fig. S5 shows a cascade of Fermi surface reconstructions at integer fillings of the moiré band. These reconstructions are evidenced by quantum oscillations emanating from integer fillings of the moiré bands (Fig. S5a-c), as well as resets in (Fig. S5d). The reconstruction gives rise energy gaps in the moiré band. Owing to the presence of a Dirac-like band in tTLG, gapped state in the moiré flatband exhibits a slope of in the map, which are marked with solid green lines in Fig. S5c.
The isospin degeneracy underlying the reconstructed Fermi surface can be determined based on the slope of the quantum oscillation in the fundamental sequence emanating from each integer moiré filling. The lowest order state of each fundamental sequence is marked by the solid red lines in Fig. S5c. The trajectory of each incompressible state is described by a pair of quantum numbers () from the Diophantine equation , where corresponds to the slope and the intercept in the map. The isospin degeneracy of the Fermi surface equals the difference between slope of the Coulomb-driven energy gap in the moiré band, which is , and that of the lowest order quantum oscillation. For instance, the moiré energy gap at traces a slope of , whereas the fundamental sequence of quantum oscillation has a slope of . This points to a degeneracy of for the reconstructed Fermi surface at half moiré filling. Similarly, the reconstructed Fermi surface at quarter and three-quarter fillings have and fold degeneracy. This hierarchy of isospin degeneracy is in excellent agreement with previous report in magic-angle twisted bilayer graphene Das et al. (2021); Saito et al. (2021b), suggesting that the underlying moiré band of twisted trilayer graphene that is directly comparable to the flatband physics studied in MATBG.
The Landau fan diagram in Fig. S5 provides an identification for the twist angle at . While the twist angle is slightly detuned from the magic angle of , the emergence of Landau fan at each integer filling, along with Hall density reset, exhibit the same characteristic as magic-angle twisted trilayer graphene in previous observations Park et al. (2021b); Hao et al. (2021); Liu et al. (2022).
III Supplementary Data
IV Materials and Method
IV.1 Device Fabrication
The doubly encapsulated tTLG is assembled using the “cut-and-stack” technique. All components of the structure are assembled from top to bottom using the same poly(bisphenol A carbonate) (PC)/polydimethylsiloxane (PDMS) stamp mounted on a glass slide. The sequence of stacking is: graphite as top gate electrode, 24 nm thick hBN as top dielectric, bilayer WSe2, tTLG, 24 nm thick hBN as bottom dielectric, bottom graphite as bottom gate electrode. The entire structure is deposited onto a doped Si/SiO2 substrate, as shown in Fig. S13a. Electrical contacts to tTLG are made by CHF3/O2 etching and deposition of the Cr/Au (2/100 nm) metal edge contacts. The sample is shaped into an sunflower geometry with an inner radius of 1.9 m for the circular part of the sample. In this geometry, the electrical contacts are separated by an azimuth angle of , allowing an increment in the azimuth angle that is (Fig. M1).
IV.2 Transport measurement
The carrier density in tTLG is tuned by applying a DC voltage bias to the bottom gate electrode. The electrical potential of the top gate electrode is held at zero. As a result, the tTLG sample experience a non-zero displacement field at large carrier density, which induces hybridization between the monolayer band and the moiré flatband. We note that the dependence of Hall density on moiré band filling is in excellent agreement with behavior from previous observations. This indicates that the influence of on the moiré flatband is not substantial. This is further confirmed by the Landau fan diagram in Fig. S5, which is also consistent with the expected behavior at .
Transport measurement is performed in a BlueFors LD400 dilution refrigerator with a base temperature of 20 mK. Temperature is measured using a resistance thermometer located on the cold finger connecting the mixing chamber and the sample. An external multi-stage low-pass filter is installed on the mixing chamber of the dilution unit. The filter contains two filter banks, one with RC circuits and one with LC circuits. The radio frequency low-pass filter bank (RF) attenuates above 80 MHz, whereas the low frequency low-pass filter bank (RC) attenuates from 50 kHz. The filter is commercially available from QDevil.