Candidate cosmic filament in the GJ526 field, mapped with the NIKA2 camera
Distinctive large-scale structures have been identified in the spatial distribution of optical galaxies up to redshift . In the more distant universe, the relationship between the dust-obscured population of star-forming galaxies observed at millimetre wavelengths and the network of cosmic filaments of dark matter apparent in all cosmological hydrodynamical simulations is still under study. Using the NIKA2 dual-band millimetre camera, we mapped a field of arcminutes2 in the direction of the star GJ526 simultaneously in its 1.15-mm and 2.0-mm continuum wavebands to investigate the nature of the quasi-alignment of five sources found ten years earlier with the MAMBO camera at 1.2 mm. We find that these sources are not clumps of a circumstellar debris disc around this star as initially hypothesized. Rather, they must be dust-obscured star-forming galaxies, or sub-millimetre galaxies (SMGs), in the distant background. The new NIKA2 map at 1.15 mm reveals a total of seven SMGs distributed in projection on the sky along a filament-like structure crossing the whole observed field. Furthermore, we show that the NIKA2 and supplemental Herschel photometric data are compatible with a model of the spectral energy distributions (SEDs) of these sources when a common redshift of 2.5 and typical values of the dust parameters for SMGs are adopted. Hence, we speculate that these SMGs might be located in a filament of the distant ‘cosmic web’. The length of this candidate cosmic filament crossing the whole map is at least 4 cMpc (comoving), and the separations between sources are between 0.25 cMpc and 1.25 cMpc at this redshift, in line with expectations from cosmological simulations. Nonetheless, further observations to determine the precise spectroscopic redshifts of these sources are required to definitively support this hypothesis of SMGs embedded in a cosmic filament of dark matter.
Key Words.:
galaxies: evolution – Galaxy: formation – galaxies: groups – large-scale structure of Universe – galaxies: clusters: intracluster medium1 Introduction
Sub-millimetre Galaxies (SMGs) found in submillimetre- and millimetre-wavelength surveys are forming stars at prodigious rates, sometimes exceeding 1000 /yr, and are enshrouded in dust with bright far-infrared luminosities (Hodge & da Cunha, 2020, e.g.). Thus, SMGs have only faint or undetectable optical counterparts but probe the most active cosmic epoch of galaxy formation at .
Theory predicts that galaxy formation preferentially occurs along large-scale dark matter filamentary or sheetlike overdense regions that are related to initial fluctuations of the density field in the primordial universe (Bond et al., 1996) and formed the ‘cosmic web’ as depicted by cosmological hydrodynamical simulations. It is thought that galaxy growth and high star formation at an early stage of cosmic evolution is critically tied to massive haloes of dark matter at the knots of this network of filaments (Béthermin et al., 2013). A large fraction of the neutral hydrogen from the inter galactic medium falls into these filaments and constantly replenishes the gas reservoirs of galaxies through cold gas accretion; the cold gas streams along the filaments, survives the shocks at the virial radii of the dark matter haloes and infalls onto the galaxies to fuel their star formation and growth (Kereš et al., 2005; Dekel et al., 2009).
Definitive observational confirmation of this mechanism cold gas accretion along filaments of the cosmic web is actively sought. Photoionized Lyman- nebulae around quasars have been observed with morphologies and kinematics suggestive of intergalactic gas filaments and gas infall (Cantalupo et al., 2014; Hennawi et al., 2015; Martin et al., 2015, 2019) but alternative scenarios based on outflows cannot be ruled out. Recently, extended Ly- emission plausibly powered by collisional ionization along filamentary structures has been observed. Umehata et al. (2019) have discovered two Ly- filaments more than 1 Mpc in extent within the protocluster SSA22 at and, remarkably, also detected embedded SMGs and X-ray sources that are distributed all along these two filaments. Bacon et al. (2021) report the discovery of diffuse extended Ly- emission from redshift 3.1 to 4.5, tracing cosmic web filaments on scales of Mpc in the MUSE Extremely Deep Field, which partially overlaps the Hubble Ultra Deep Field. Also, Daddi et al. (2021) report on a plausible observation of cold gas accretion streams towards the massive potential well of the protocluster RO-1001 at and on the detection of three filaments apparently connecting to the associated 300 kpc-wide Ly- nebula. In cosmological simulations, the relationship between SMGs and the network of cosmic filaments of dark matter is debated (Miller et al., 2015).
Nowadays, a region of the sky several hundreds of arcseconds in size, corresponding to several cMpc (comoving) at redshift , can be efficiently mapped at millimetre wavelengths using a modern camera such as NIKA2 installed on the IRAM 30-metre telescope (Adam et al., 2018). In maps covering such a scale, the spatial distribution of SMGs can be compared to the cosmic web in cosmological simulations. We present NIKA2 data that are a serendipitous contribution to this endeavour.
In 2007, as part of a survey designed to search for new circumstellar discs around 50 stars, the field in the direction of the nearby star GJ526 was mapped in the 1.2-mm continuum waveband using the MAMBO camera installed on the IRAM 30-metre telescope and a quasi-alignment of five sources along with this star was found in projection on the sky. At the time, it was not possible to conclude whether these sources were background SMGs or part of a large, clumpy circumstellar disc seen edge-on and centred on this star (Lestrade et al., 2009). In 2017, we again observed the same field with the NIKA2 camera to test whether these sources had remained fixed and were in the background, or whether they had moved at the same rate and in the same direction as the star, and were clumps in a circumstellar disc. Based on the proper motion of the star, this possible displacement was estimated to be as large as in the south-west direction after ten years.
In this paper, we report our finding with NIKA2 that the MAMBO sources did not move over this ten-year period and so they must be SMGs in the distant background. In Sect. 2 we present the NIKA2 observations, and in Sect. 3 we present the NIKA2 maps at 1.15 mm and 2.0 mm, and discuss the overdensity of sources in the field. In Sect. 4 we discuss the nature of the sources characterized by their spectral energy distributions (SEDs) constrained with our NIKA2 photometry and Herschel supplemental data. Finally, in Sect. 5 we discuss the remarkable spatial distribution of these sources in the 1.15-mm NIKA2 map along a filament-like structure and a possible association with the cosmic web of the cosmological simulations.
2 Observations
The observations were conducted with the NIKA2 dual-band millimetre camera installed on the IRAM 30-metre telescope at Pico Veleta (altitude 2850m) in Spain (Monfardini et al., 2011; Catalano et al., 2014; Calvo et al., 2016; Bourrion et al., 2016; Adam et al., 2018; Perotto et al., 2020). NIKA2 operates with kinetic inductance detectors (KID) arranged into three arrays : two with a maximum transmission around 260 GHz (1.15 mm) with 1140 detectors in each polarization, and one at 150 GHz (2.0 mm) with 616 detectors at a single polarization. The transmission bands of the detectors are broad with a GHz full width at half maximum (FWHM) transmission at both wavelengths. The combination of its large field of view (6.5 arcminutes) and high sensitivity provides the NIKA2 camera with a high mapping speed (111 and 1388 arcminutes2 mJy-2 h-1 at 260 GHz and 150 GHz, respectively, at zero atmospheric opacity ; Perotto et al., 2020). The angular resolutions (main beam FWHM) are 17.7 and 11.2 arcseconds at 150 and 260 GHz, respectively.
The data presented in this study were obtained during the science verification observations of the NIKA2 camera on 24 April 2017, on 14, 17, 18, 19, and 20 February 2018, and on 14 March 2018, in average weather conditions (atmospheric opacity between 0.10 and 0.25 at 2 mm, and between 0.20 and 0.45 at 1 mm) and at elevations between 33∘ and 67∘. The observing strategy consisted of a series of on-the-fly scans with a scanning speed of 40”/sec along two orthogonal orientations (, ) in the AZ-EL coordinate system of the telescope to minimize residual stripping patterns in the maps. We defined the map centre at the J2000 coordinates of the star GJ526 as in the initial MAMBO map (RA : 13h45m44.52s and DEC : ). These observations are split in 167 scans that correspond to a total of 9.3 hours of observations on source. For calibration purposes, skydips were conducted to determine the coupling of each KID to the sky emission. An opacity correction could then be computed along the line of sight of each observation scan.
The time-ordered information (TOI) of each detector was processed in order to remove the contribution of atmospheric and electronic correlated noises and to obtain the maps at both wavelengths following the procedure initially described in Adam et al. (2014), and modified in Ponthieu et al. (in preparation). In short, an iterative process between maps and TOI was carried out until the maps did not change anymore (less than ) after three iterations. For each sub-scan, the first four harmonics at 2 mm (five at 1 mm), each made of one sine and one cosine, were fit to the TOI with a least-square method and removed. In more detail, there was no masking of the source but rather a downweighting of large signal-to-noise excursions. This downweighting becomes more accurate when the map is close to the final map after three iterations. On the first iteration, the initial map was set to zero. The process includes some inhomogeneous weighing of the data samples and so leads to some large spatial scale filtering. Thus, the procedure is designed for optimized detection of point-sources and not extended sources. Nonetheless, the more aggressive filtering and the avoidance of masks in this procedure induce a filtering effect that has to be determined by simulations of point sources injected into the data. Thus, we established that a photometric correction of 25 % that is constant for the range of S/Ns displayed by the detected sources in our study must be applied. It should be noted that this iterative part of the pipeline used to process the data is an addition to the standard pipeline used by Perotto et al. (2020). Finally, we add that the noise of each sample was propagated to the map of each scan with a standard inverse variance weighing. A global rescaling of the noise for each map was done to make the standard deviation of S/Ns in noise map unity (see Sect. 3), in order to measure an accurate S/N for point sources.
Point sources were detected by fitting the map with a Gaussian point spread function, in other words effectively applying a noise-weighted matched-filtering of the map with a fixed width Gaussian. Position accuracy is better than 3 arcseconds (for each coordinate) for sources detected above . The photometric correction of 25 % described above was applied to the fit amplitude. The flux density scale was based on specific observations of the primary calibrator Uranus to calibrate all individual detectors of each array and on frequent standard observations of the secondary calibrator MWC349 to check the stability of this calibration over a NIKA2 run of several days. The resulting absolute photometric accuracy is of the order of 15 %. Although the weather conditions were not optimal, the expected NIKA2 sensitivity at zero opacity ( and mJy at 1.15 mm and 2.0 mm, respectively ; Perotto et al., 2020) was recovered once the opacity was taken into account.
3 NIKA2 maps
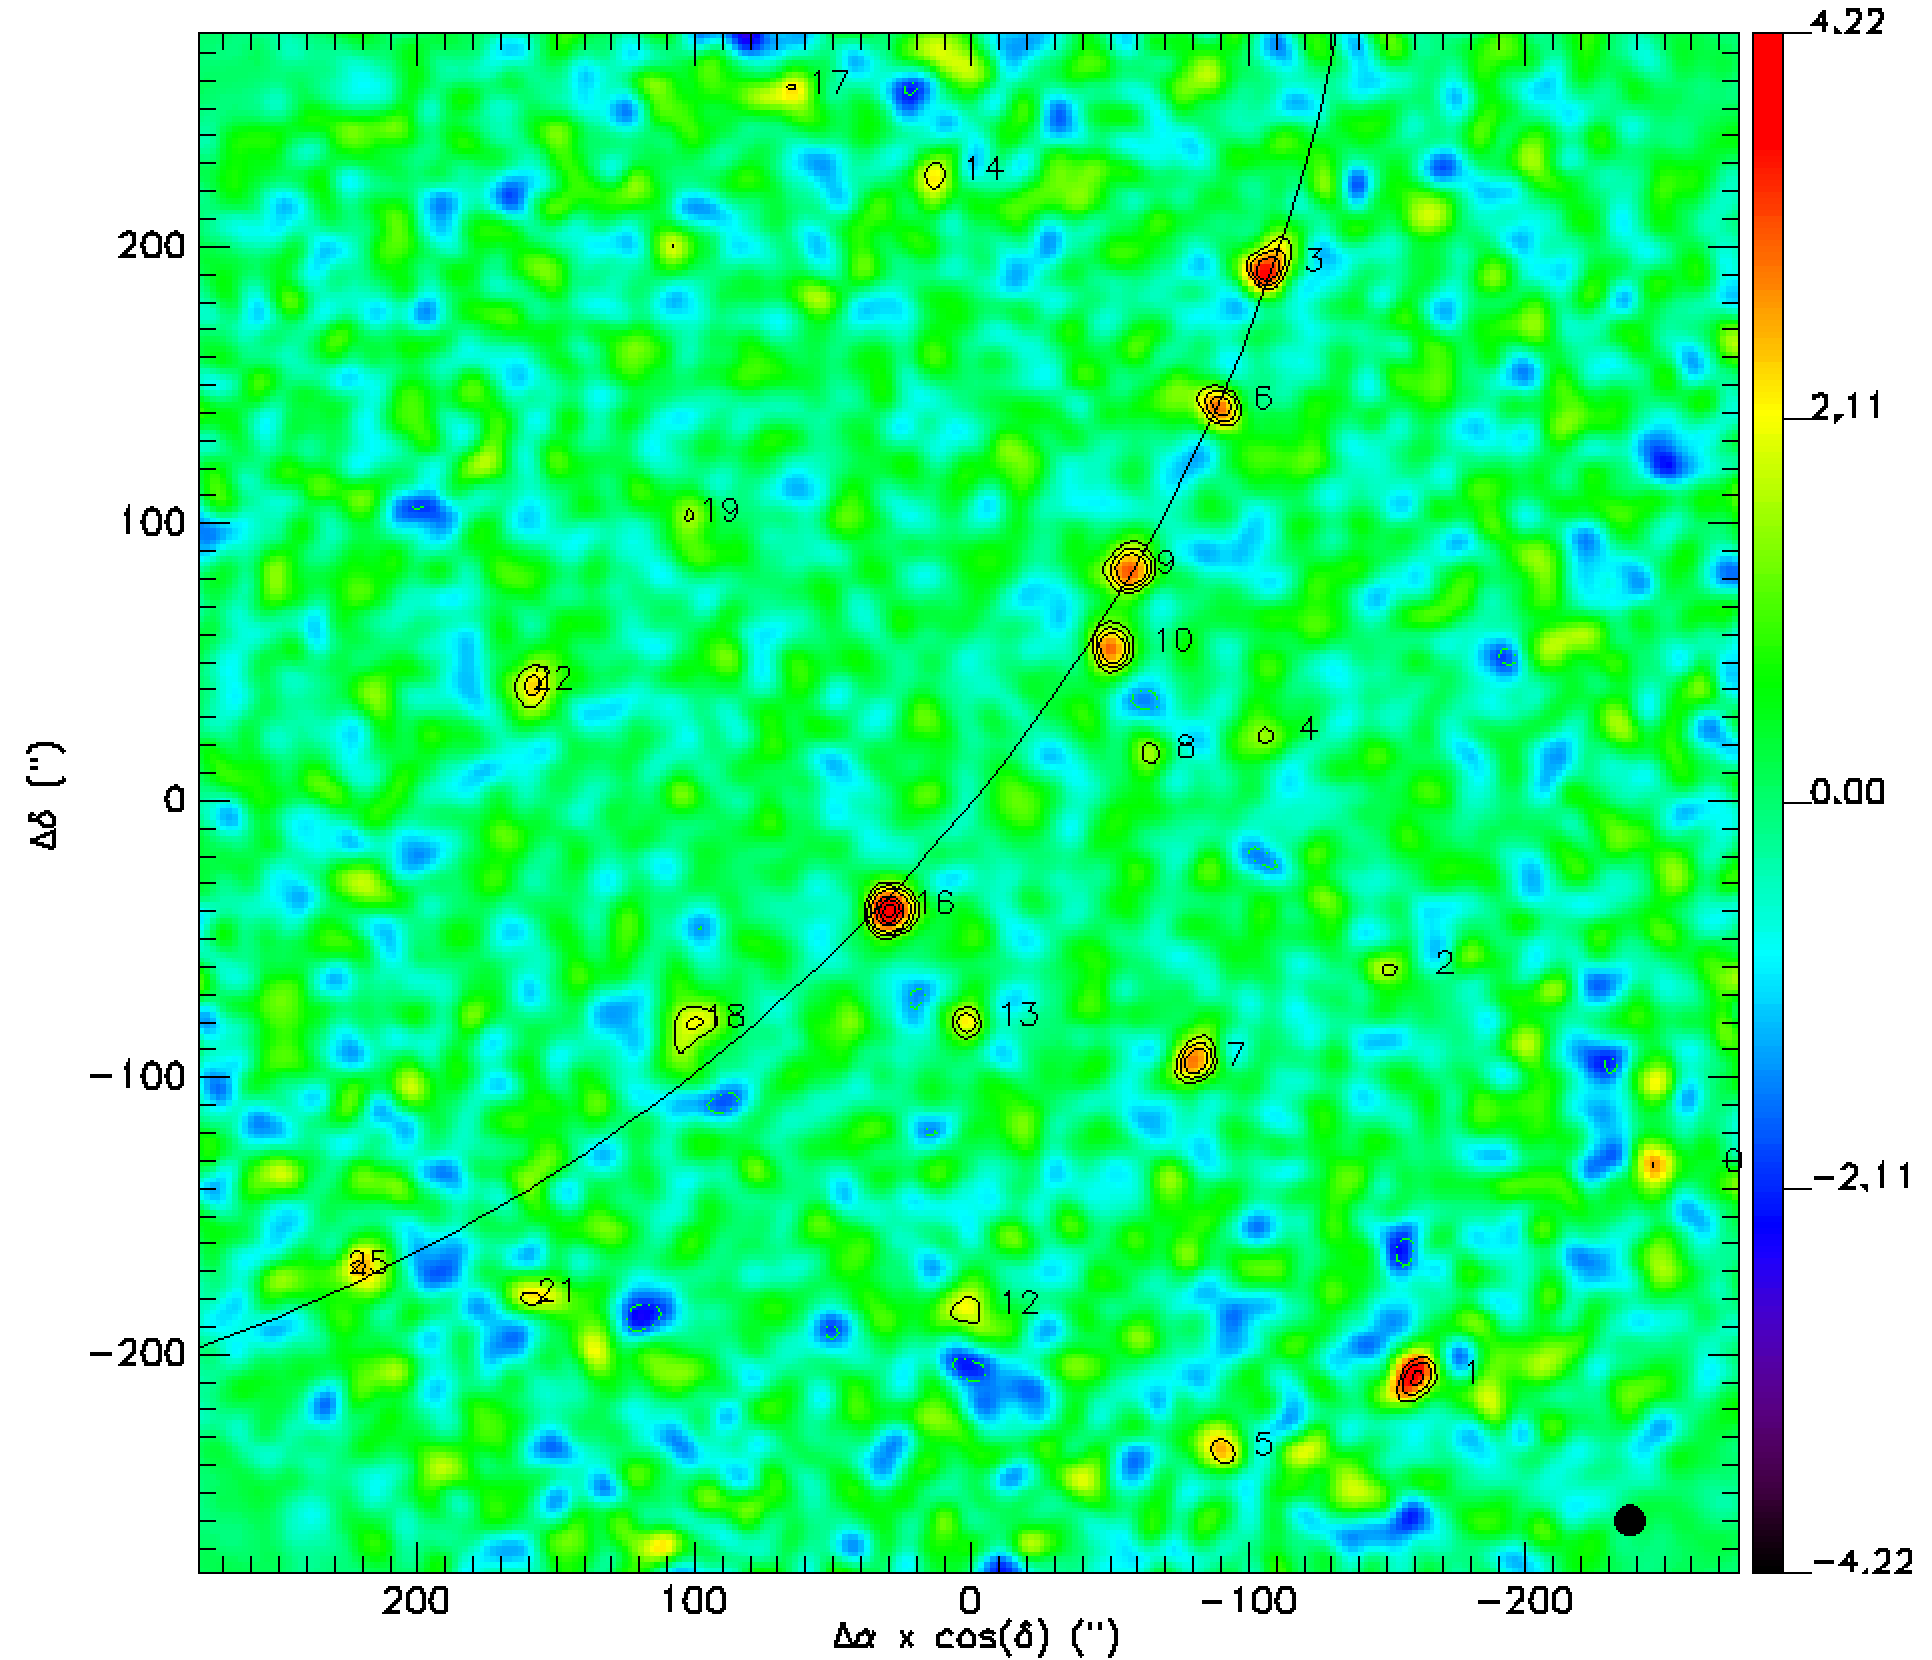
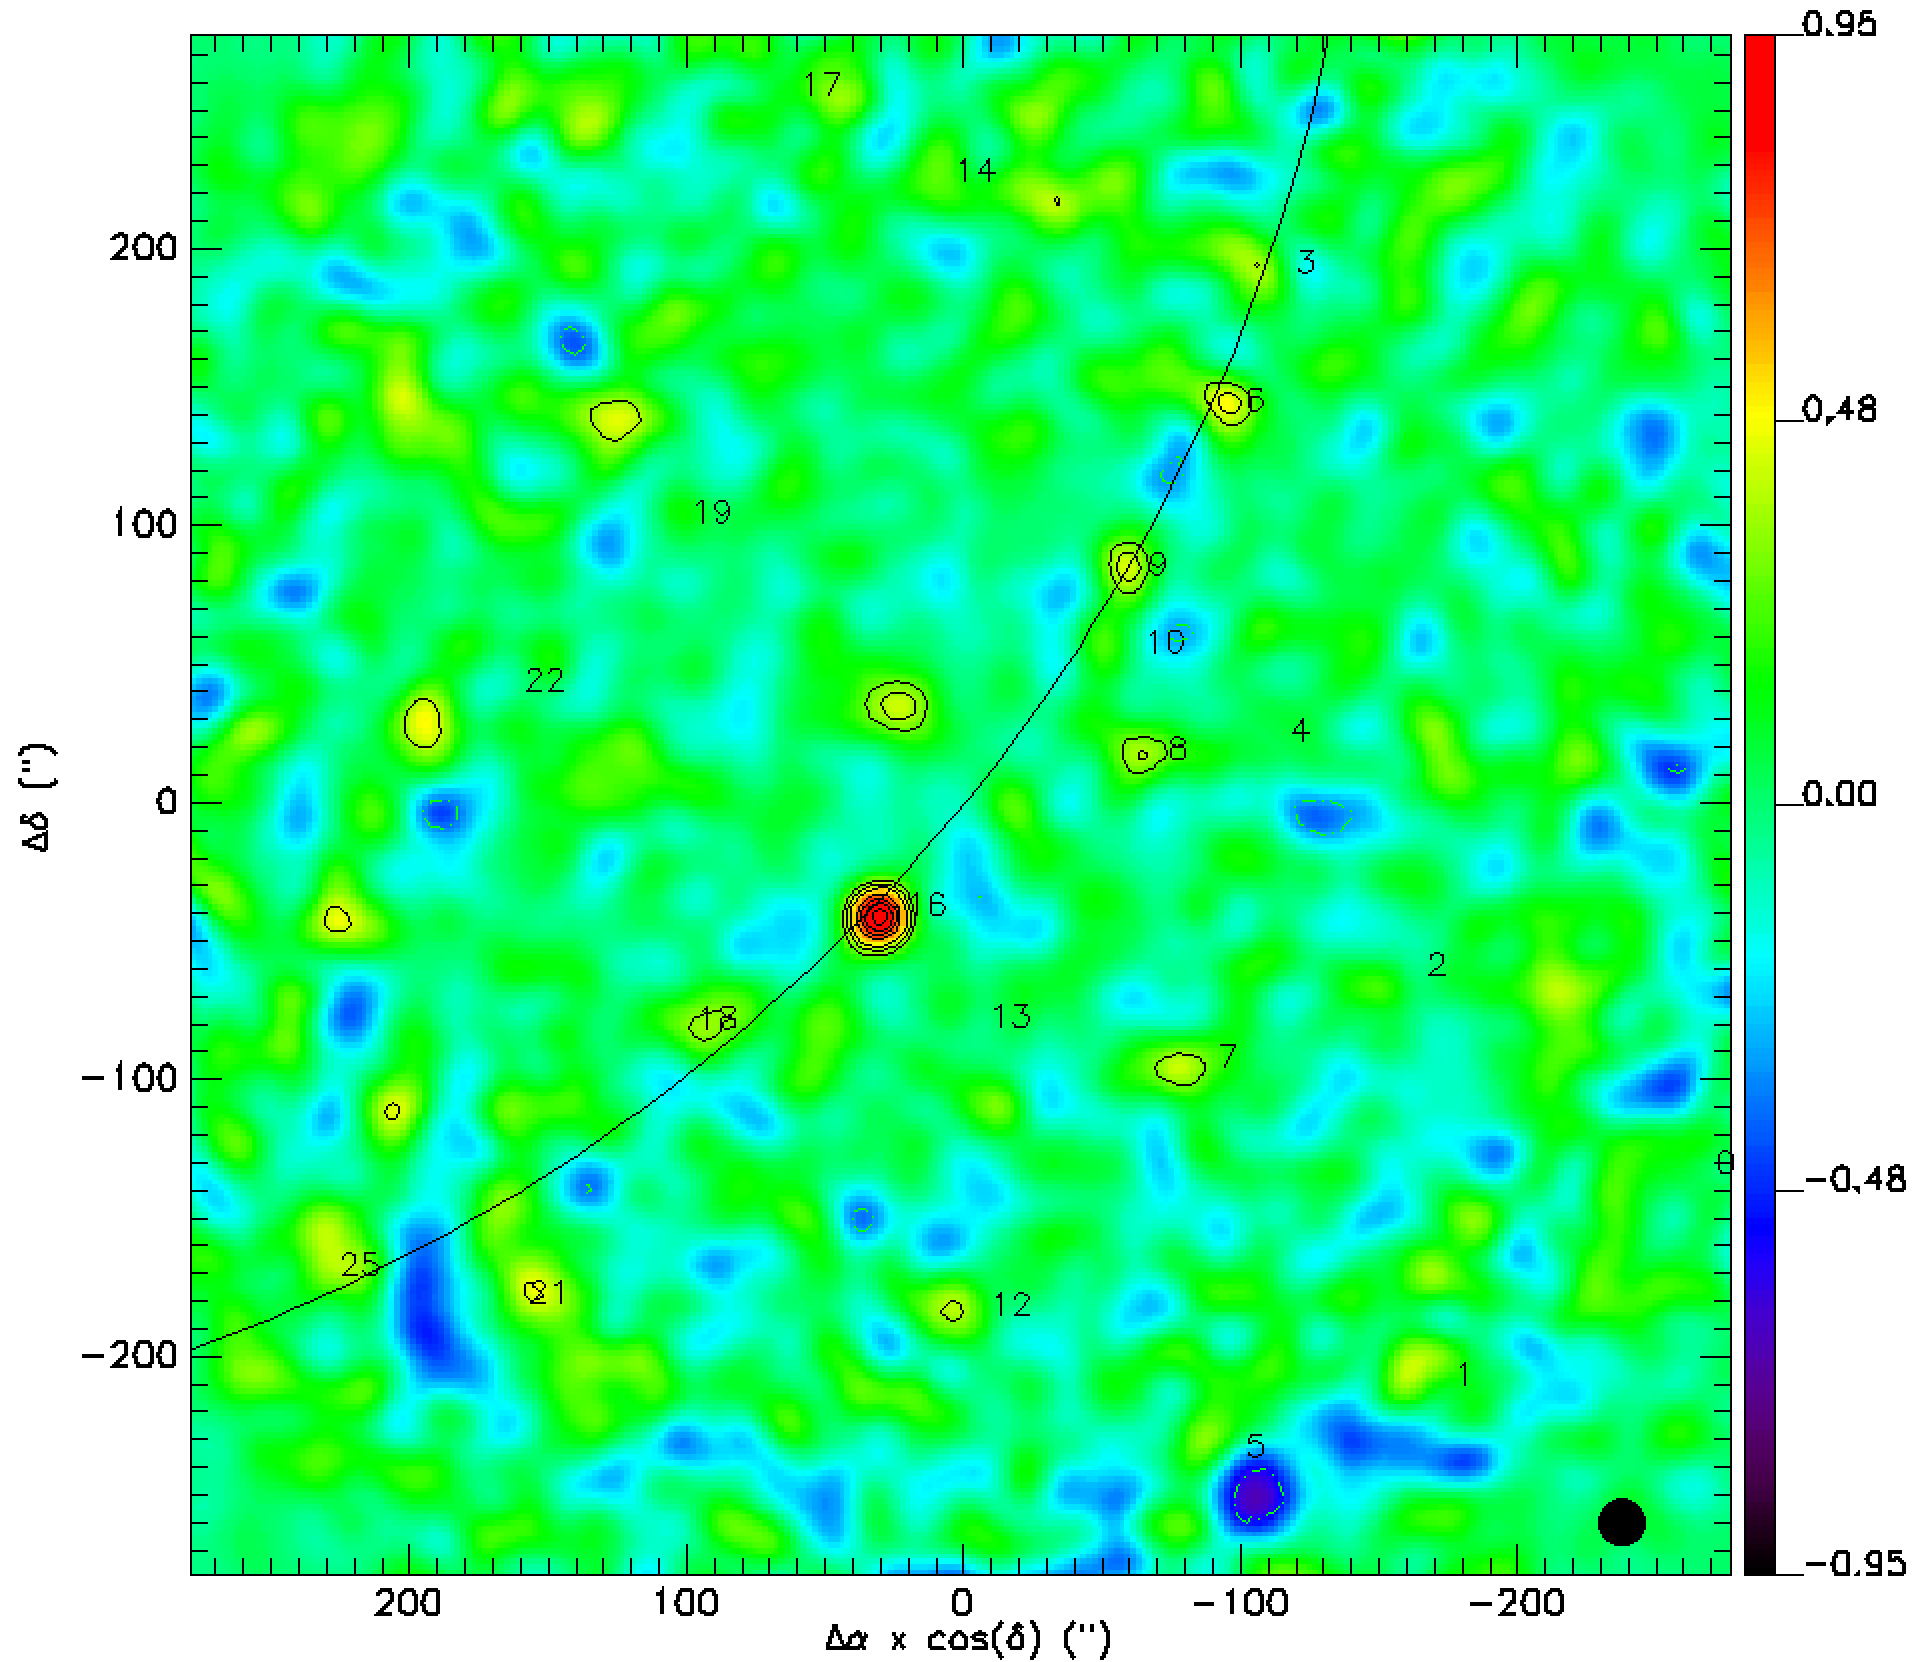
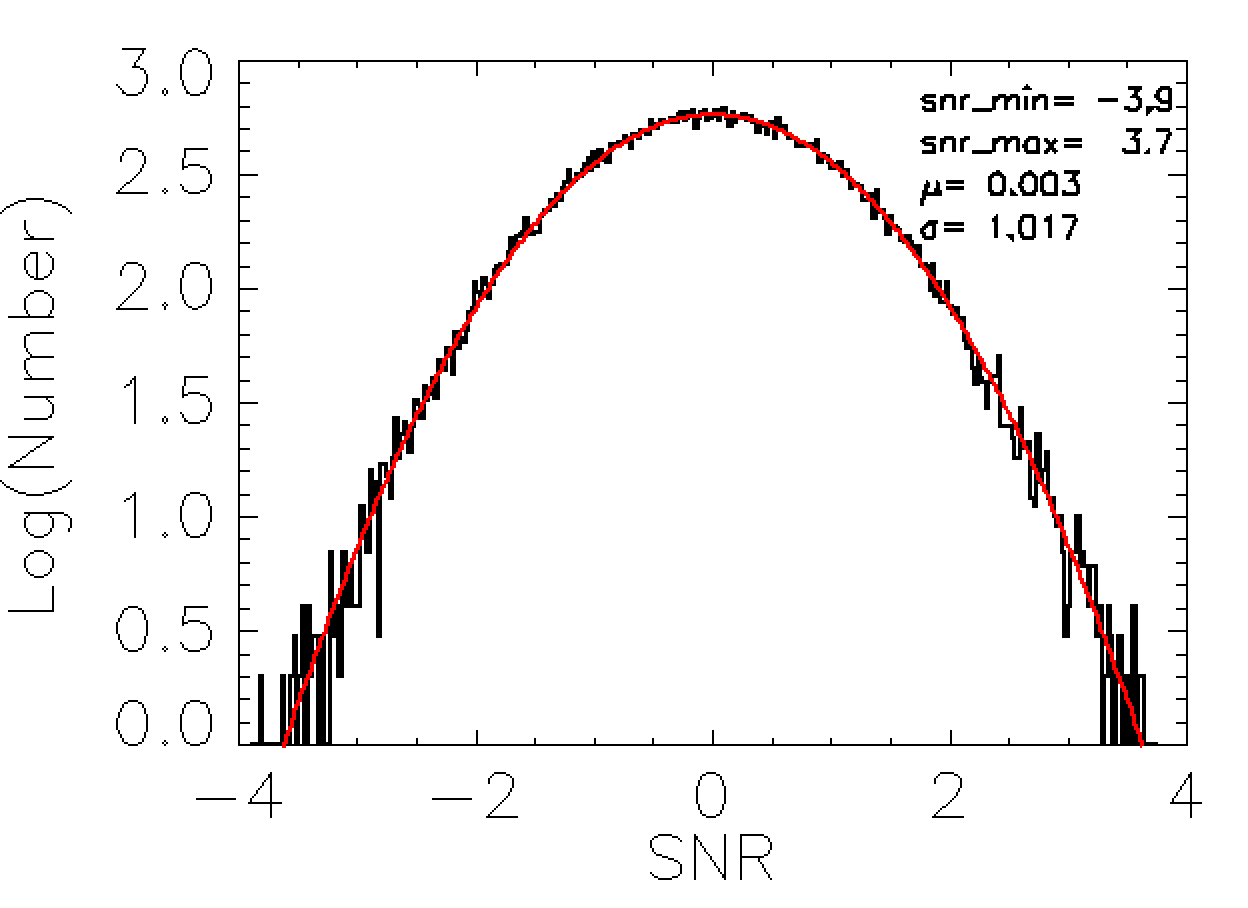
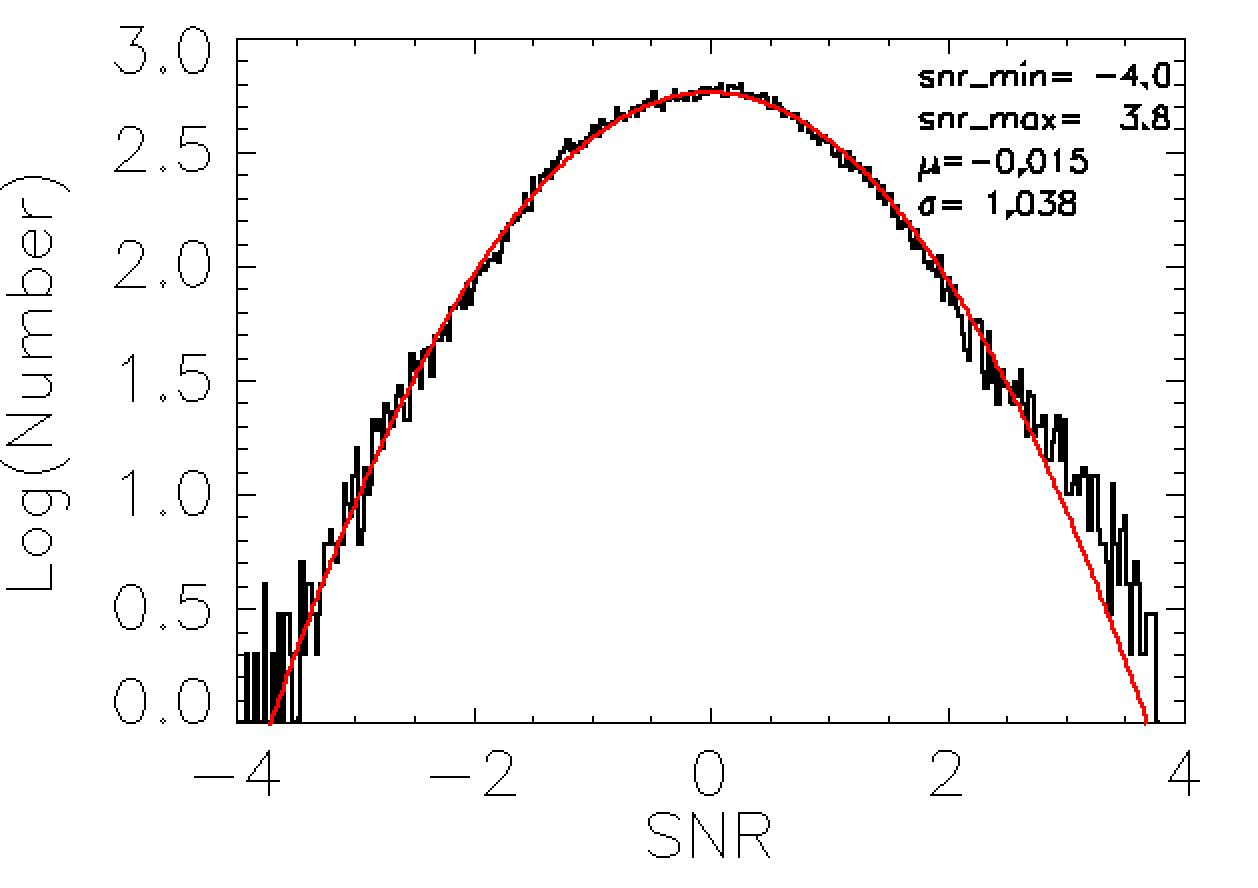
The NIKA2 maps of the GJ526 field in size are shown in Fig. 2 at 1.15 mm and in Fig. 2 at 2.0 mm. Millijansky point-like sources are apparent at both wavelengths. In order to determine the detection threshold, we analysed the noise distribution in computing S/Ns at all pixels of the jack-knifed map at each wavelength. In such a map of the noise, the sources were eliminated after subtraction between individual maps of consecutive pairs of scans with the two orthogonal scanning orientations and finally the co-addition of all pairs. At 1.15 mm, we found that the S/N distribution is Gaussian, centred almost on zero and has a standard deviation of almost unity, as expected for normally distributed noise (see Fig. 5). However, at 2 mm, although the distribution is also centred close to zero and has a standard deviation close to unity, there is an excess at the positive tail that makes it deviate slightly from Gaussian, despite careful reprocessing (see Fig. 5). This was unexpected since the atmospheric fluctuations are less severe at this wavelength. Close inspection of the data showed that electronic correlated noise in the 2.0 mm sampling modules of the instrument was higher than usual during the observations. With this caveat in mind, source extraction and photometry were carried out with caution.
To set the source detection threshold, we searched for any possible detections in the jack-knifed maps using the same fitting procedure of a Gaussian point spread function as described in Sect. 2. Clearly, any statistically significant detection in this noise-only map would be spurious. At 1.15 mm, we find that there are nine spurious detections with S/N and ten with S/N , evenly distributed over the jack-knifed map, and none with —S/N— . Similarly, at 2.0 mm, there are eight spurious detections with S/N and nine with S/N , and none with —S/N— . We conclude that the threshold S/N = 4 is a reliable criterion for a robust source detection at both wavelengths.
In Table 1 we list the 21 sources with S/N found in the 1.15-mm NIKA2 map, among which ten are unambiguously detected according to our criterion (S/N ) and have flux densities between 2 and 5 mJy. Statistically, about two additional sources should be real among the remaining eleven sources () since only nine positive detections are expected to be spurious above , as explained above. Evidently, these potential sources at 1.15 mm cannot be identified unless additional inputs are included. For instance, ID 8 is a source in the 1.15-mm NIKA2 map but can also be identified in the MAMBO map at slightly above (see map in Fig. 1 of Lestrade et al., 2009) ; thus ID 8 is likely a real source at the level of 4.7 in quadratically combining the two S/Ns. Among the unambiguously detected sources at 1.15 mm, only two are also unambiguously detected at 2 mm (ID 16 and ID 9), and four additional sources have S/Ns of between 3 and 4 at 2.0 mm (see Table 1). This deficit of detections at 2 mm can be explained by the dust emissivity index of SMGs that is between 1 and 2, or sometimes steeper (see also Sect. 4). Finally, there is a source which is slightly above at 2.0 mm (north-east of map and see Table 1) but has surprisingly no 1.15 mm counterpart. As already mentioned, electronic correlated noise higher than standard during the observations must explain this deviation from normal statistics in the 2.0 mm map, which we consider not as reliable as the 1.15-mm map.
Finally, we address flux boosting that alters the measured flux densities provided in Table 1. In a flux-limited survey, it is well known that sources with a low S/N are detected at flux densities systematically higher than their true flux densities and this effect is exacerbated when the source population increases in number with decreasing flux (e.g. Coppin et al., 2005). We estimated flux boosting with 1000 simulations of the sky in our NIKA2 maps following the prescriptions by Scott et al. (2008) with their semi-Bayesian approach. We find that it is statistically less than 15% for a S/N above 4, and steadly increases up to 50% for a S/N of 3, similarly at 1 mm and 2 mm. We chose not to correct downwards the quoted flux densities in Table 1.
| ID | Name | ||||||
|---|---|---|---|---|---|---|---|
| (mJy) | 260GHz | (mJy) | 150GHz | ||||
| Unambiguously detected NIKA2 sources (S/N 4 at 1.15 mm) | |||||||
| 16 | NIKA2J134546.6+145239 | 13:45:46.63 | 14:52:39.7 | 4.11 0.43 | 9.6 | 0.98 0.09 | 10.3 |
| 1 | NIKA2J134533.4+144950 | 13:45:33.48 | 14:49:50.5 | 3.96 0.75 | 5.3 | 0.41 0.17 | 2.4 |
| 3 | NIKA2J134537.1+145631 | 13:45:37.18 | 14:56:31.9 | 3.67 0.60 | 6.1 | 0.39 0.13 | 3.0 |
| 9 | NIKA2J134540.6+145442 | 13:45:40.61 | 14:54:42.8 | 3.13 0.45 | 6.9 | 0.42 0.10 | 4.3 |
| 10 | NIKA2J134541.0+145414 | 13:45:41.09 | 14:54:14.8 | 2.97 0.44 | 6.8 | 0.23 0.09 | 2.4 |
| 6 | NIKA2J134538.3+145542 | 13:45:38.36 | 14:55:42.2 | 2.95 0.52 | 5.7 | 0.37 0.11 | 3.3 |
| 7 | NIKA2J134538.9+145145 | 13:45:38.97 | 14:51:45.4 | 2.87 0.47 | 6.1 | 0.41 0.11 | 3.9 |
| 22 | NIKA2J134555.5+145401 | 13:45:55.51 | 14:54: 1.1 | 2.40 0.52 | 4.6 | 0.02 0.11 | 0.2 |
| 18 | NIKA2J134551.5+145159 | 13:45:51.51 | 14:51:59.0 | 2.15 0.48 | 4.5 | 0.34 0.11 | 3.1 |
| 13 | NIKA2J134544.6+145159 | 13:45:44.69 | 14:51:59.4 | 2.08 0.44 | 4.7 | 0.06 0.10 | 0.6 |
| Possibly detected NIKA2 sources (3 S/N 4 at 1.15 mm) | |||||||
| 0 | 13:45:27.41 | 14:51: 6.8 | 2.68 0.79 | 3.4 | 0.20 0.18 | 1.1 | |
| 25 | 13:45:59.81 | 14:50:29.8 | 2.61 0.79 | 3.3 | 0.38 0.18 | 2.1 | |
| 5 | 13:45:38.33 | 14:49:24.6 | 2.57 0.71 | 3.6 | 0.28 0.16 | 1.7 | |
| 17 | 13:45:49.08 | 14:57:36.4 | 2.25 0.72 | 3.1 | 0.14 0.15 | 0.9 | |
| 14 | 13:45:45.51 | 14:57: 5.0 | 2.20 0.61 | 3.6 | 0.27 0.13 | 2.0 | |
| 21 | 13:45:55.42 | 14:50:19.7 | 2.20 0.67 | 3.3 | 0.48 0.15 | 3.1 | |
| 12 | 13:45:44.66 | 14:50:15.4 | 2.15 0.56 | 3.8 | 0.41 0.13 | 3.2 | |
| 2 | 13:45:34.13 | 14:52:18.1 | 1.67 0.52 | 3.2 | 0.16 0.11 | 1.4 | |
| 19 | 13:45:51.63 | 14:55: 1.6 | 1.57 0.49 | 3.2 | 0.15 0.11 | 1.4 | |
| 4 | 13:45:37.30 | 14:53:43.1 | 1.55 0.45 | 3.4 | 0.08 0.10 | 0.8 | |
| 8 | 13:45:40.15 | 14:53:36.2 | 1.52 0.43 | 3.6 | 0.39 0.09 | 4.1 | |
| ID | Differences | |||
|---|---|---|---|---|
| (mJy) | (mJy) | |||
| 7 | 2.87 0.47 | 3.20.7 | ||
| 9 | 3.13 0.45 | 4.30.8 | ||
| 10 | 2.97 0.45 | 6.31.0 | ||
| 16 | 4.11 0.43 | 5.60.7 | ||
| MM134543+145317 | 1.3 0.45 | 3.00.7 | ||
3.1 Nature of the MAMBO sources
As already mentioned, the field around GJ526 was mapped in 2007 with MAMBO. Five sources were found quasi-aligned and within from the star GJ526 coordinates, and they were reported in Table 2 of Lestrade et al. (2009). They were hypothesized to be the clumps of a large, broken disc seen almost edge-on surrounding this star. With our new NIKA2 observations, four of these five MAMBO sources were detected anew in the NIKA2 map at 1.15 mm, and are IDs 7, 9, 10, and 16 in Table 1 herein. The fifth MAMBO source MM134543+145317, a 4.3 MAMBO detection in Table 2 of Lestrade et al. (2009) was also identified in the 1.15-mm NIKA2 map but only at the level of 2.8 and so was not retained in our final NIKA2 source list. Such a difference in detection levels would arise from a S/N underestimate and overestimate of by NIKA2 and MAMBO, respectively.
Astrometric and photometric comparisons between the MAMBO map and the NIKA2 map, which is 40% deeper, are given in Table 2 herein. The coordinate differences between the four MAMBO sources at epoch 2007 (Table 2 of Lestrade et al. 2009) and their NIKA2 counterparts at epoch 2017 in Table 1 herein are only a few arcseconds, and so much less than the displacement of in the south-east direction inferred from the star motion. Rather, these coordinates differences are consistent with telescope pointing errors (rms, see Table 18 of Perotto et al., 2020) combined with astrometric errors for sources with low S/Ns. Thus, we conclude that the MAMBO sources have not moved in concert with the star and are not clumps of a disc associated with GJ526. They must instead be SMGs in the background, probably unlensed owing to their low flux density level.
The MAMBO flux densities in Table 2 of Lestrade et al. (2009) are comparable with the NIKA2 flux densities at 1.15 mm in Table 1 herein to better than 1.5 times the quadratically combined uncertainties of the two measurements, except for source ID 10 for which the difference is 3.1 times the combined uncertainty. This source would have faded from mJy at epoch 2007 to mJy ten years later if this difference were real. This is physically unrealistic for an SMG and we favour calibration difficulties with MAMBO and/or NIKA2, inherent to low S/N sources. It should be noted that the differences in flux densities due to differences in reference frequencies of the two cameras, 250 GHz for MAMBO and 260 GHz for NIKA2, are negligible.
3.2 Counterparts in the optical, infrared and radio domains
To search for counterparts to the NIKA2 sources in the optical, mid-infrared, far-infrared, and radio domains, we inspected images of the Sloan Digital Sky Survey (SDSS), the Wide-field Infrared Survey Explorer (WISE) (Wright et al., 2010), the Herschel Observatory (Griffin et al., 2010; Poglitsch et al., 2010) and the NRAO VLA Sky Survey (NVSS) (Condon et al., 1998). Owing to the NIKA2 position uncertainties, we found no convincing counterpart in SDSS, WISE, or NVSS. In NVSS, with a 3 limit of 1.5 mJy at 1.4 GHz, this is not surprising unless it is from an AGN
More interesting were our findings in the Herschel archive. Seven NIKA2 sources have supplemental photometric data from SPIRE (250 m, 350 m and 500 m) and two sources have PACS data (100 m and 160 m). For SPIRE, the flux densities of three sources (IDs 7, 10, and 18) are taken from the Herschel/SPIRE Point Source Catalogue (HSPSC) (Schulz et al., 2017) 111https://irsa.ipac.caltech.edu/Missions/herschel.html and are reported in Table 3 herein, along with their HSPSC identifiers. We also uploaded the SPIRE observation IDobs 1342234791 of the Herschel Open-Time Key project DEBRIS (Matthews et al., 2010) to determine the flux densities of three additional sources in Table 3 (IDs 14, 17, and 21). Their coordinate differences between SPIRE and NIKA2 are, at most, 1.5 times the quadratically combined astrometric uncertainties of the two instruments (). Additionally, we determined SPIRE upper limits for the other NIKA2 sources since they are within the SPIRE maps of this programme and not close to the map border of lesser quality. We measured a representative rms in an area where there is no apparent source in the maps to estimate the SPIRE upper limits of 34 mJy, 33 mJy, and 31 mJy at m, m, and m, respectively. For PACS, we uploaded the observation IDobs 1342213079 of the same Open-Time Key project and found that ID 7 is detected and ID 10 is not. We estimated the flux densities of ID 7 using aperture photometry (radius=30′′) and found mJy at 100 m and mJy at 160 m. The upper limits of ID 10 from this observation are 6 mJy at 100 m and 9 mJy at 160 m. The other NIKA2 sources are not part of the PACS maps (ID 18 is at the border of the maps and the data are unusable).
| ID | ||||
|---|---|---|---|---|
| 250m | 350m | 500m | HSPSC ID | |
| (mJy) | (mJy) | (mJy) | ||
| 7 | 65.67.0 | 59.97.4 | 30.96.9 | J1345.65+1451.7 |
| 10 | 32.36.0 | 35.87.8 | 31.67.6 | J1345.68+1454.3 |
| 14 | 49.49.3 | 40.59.1 | 27.46.5 | |
| 17 | 33.16.5 | 29.85.4 | ||
| 18 | 77.96.9 | 62.27.2 | 29.17.5 | J1345.85+1451.9 |
| 21 | 45.89.6 | 31.27.2 | ||
3.3 Background source number count in the GJ526 field
In Sect. 3.1, we concluded that there are ten sources unambiguously detected in the 1.15-mm NIKA2 map with flux densities larger than 2 mJy. This can be usefully compared to the cumulative source number counts in other fields at a similar wavelength. The COSMOS field and the Lockman Hole North field have been surveyed at 1.2 mm with MAMBO/IRAM 30m (Greve et al., 2004; Bertoldi et al., 2007; Lindner et al., 2011) and at 1.1 mm with AzTEC/ASTE (Scott et al., 2010; Hatsukade et al., 2011). Also, part of the GOODS field has been surveyed at 1.1mm with ALMA (Franco et al., 2018).
The noise rms in the NIKA2 maps is not uniform, and increases radially from the centre, as shown in Fig. 5, because of the scanning strategy used for the observations. However, as it can be seen in this figure, the noise rms increases by less than 10% within a radial distance of from the map centre and so we first consider this central part of the map as the region of interest with a quasi-uniform noise rms. Practically, the statistical uncertainty of the flux density of a source in this central region is mJy/beam at 1.15 mm. Thus, the detection threshold of corresponds to a flux density of 2 mJy at this wavelength. Lindner et al. (2011) combined their observations with other single dish studies to report the cumulative source number count sources/deg2. Franco et al. (2018) report the lower formal value sources/deg2 with ALMA at a similar wavelength. It is known that the number counts derived from interferometric data are lower than the number counts derived from single-dish data because of source blending (Karim et al., 2013; Béthermin et al., 2017). Therefore, consistently with our NIKA2 observations, we adopted the single dish count of Lindner et al. (2011) for our probability calculation. There are six sources (IDs 7, 9, 10, 13, 16, and 18) that are unambiguously detected (S/N 4) in the central region of the 1.15-mm map with quasi-uniform rms (), while 2.7 sources are expected with the density 500 sources/deg2. The Poisson probability of exactly six sources with mJy being found in this region, given this mean surface density, is as low as 3.7%. It may be argued that the likelihood of finding an excess of sources in the GJ526 field is actually enhanced because this field is one in a collection of 50 other similar-sized fields that were mapped in the initial MAMBO survey (Lestrade et al., 2006, 2009). Although it is relevant to recall this context, a clear-cut conclusion cannot be drawn because the other fields were observed with significantly less integration times than GJ526, and so are less deep. We discuss now the more intriguing spatial distribution of the sources of this overdensity along a filament-like structure.
3.4 Filament-like structure
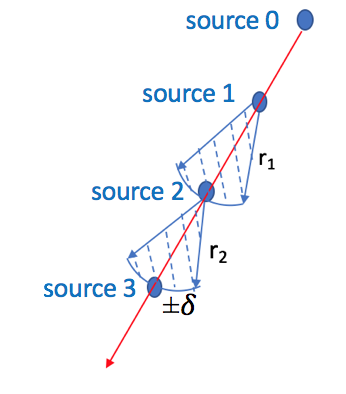
Now using the whole map, it is remarkable that seven sources (IDs 3, 6, 9, 10, 16, 18, and 25) are spatially distributed along an arc in projection on the sky across the whole map, as highlighted in Fig. 2. The first six sources are unambiguously detected with flux densities larger than 2 mJy at 1.15 mm, while the last one (ID 25) is a possible detection with a flux density of mJy at this wavelength (Table 1). We can estimate the probability that such a quasi-alignment of sources occurs by chance using small, consecutive sectors all along the arc with the small opening angle , as sketched in Fig. 6, and in which the averaged source number surface density is mJy) sources/degree2, as referenced in Sect. 3.3. For any triplet of sources along the arc, the probability that the third source does not deviate more than in degrees from alignment with the first two sources is the Poisson probability that exactly one source is found within the sector centred on the second source, and having a radius , which is the distance between the second and third sources. In applying this formula for the first triplet in the NIKA2 map (source IDs 3, 6, and 9), the probability of a chance occurrence of quasi-alignment within is with for the distance between source IDs 6 and 9. Similarly, the probability is 0.6% for the second triplet (IDs 6, 9, and 10) with between source IDs 9 and 10, it is 10.1% for the third triplet (IDs 9, 10, and 16) with , it is 4.1% for the fourth triplet (IDs 10, 16, and 18) with , and it is 13.0% for the fifth triplet (IDs 16, 18, and 25) with . These triplets defined five consecutive sectors (only two are represented in Fig. 6) that are independant, and so the resulting probability is the product of the five probabilities estimated above, that is (the exponential is approximatively unity in our application), and this combined probability is as low as . Therefore, it is very unlikely that this filament-like structure has occurred by chance. This is true whatever is our concern that 50 similar-sized fields have been observed in the initial MAMBO survey. In fact, to account for this, the probability can be boosted 50 times and is (i.e. still very low).
4 Spectral energy distribution
Physical quantities of an SMG can be estimated from a model of its SED fit to photometric data. In an SMG, copious amounts of diffuse small dust grains absorb the intense UV radiation field of massive stars and re-radiate in the far-infrared. Its intrinsic SED peaks at a wavelength corresponding to dust temperature typically between 20 K and 60 K, and has a slope steeper than the Rayleigh-Jeans regime because of the dust emissivity in the (sub-)millimetre domain. For an SMG with bolometric luminosity at redshift , its intrinsic SED is shifted towards longer wavelengths and the detectable flux density at an observed frequency is (Blain et al., 2002, eq. 3) :
| (1) |
where is the luminosity distance to redshift (Weinberg, 1972, eq. 15.3.24) and can be computed using the on-line calculator by Wright (2006) 222https://ned.ipac.caltech.edu/help/cosmology-calc.html in standard CDM cosmology 333km/s/Mpc and . In this equation, the intrinsic SED is from a modified black-body to account for dust emissivity in the far-infrared and sub-millimetre. In other words, it is a Planck function at dust temperature multiplied by the attenuation factor with the critical frequency at which the dust opacity reaches unity. In our study, we fixed to the standard value 3000 GHz (100 m) (Blain et al., 2003).
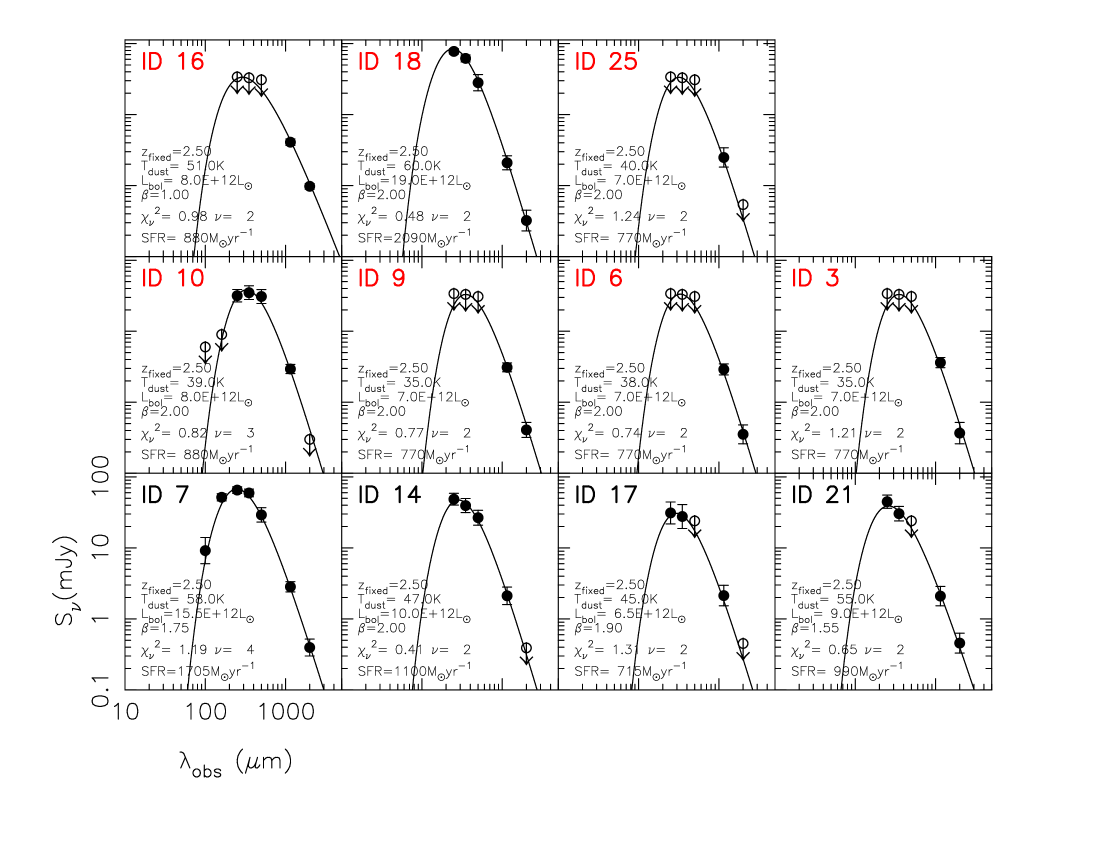
For our sources, photometry data were limited to the flux densities from NIKA2 and Herschel in Tables 1 and 3, and only to the SPIRE upper limits for some of them. Fitting the SED of each source to such a limited amount of data cannot yield a reliable photometric redshift because of the known degeneracy between redshift and dust temperature when only far-infrared and sub-millimetre data are available (e.g. Sect. 2.10.1 in Blain et al. (2002)). Instead, we made the most of the data at our disposal in testing whether or not they are compatible with the hypothesis that all sources are at the same redshift. To this end, we constrained to the range from 20 K to 60 K (e.g. Chapman et al., 2005; Strandet et al., 2016), and constrained all sources to be at the same median redshift of the phenomenological model of SMGs by Béthermin et al. (2015) for a survey depth similar to our NIKA2 observations at 1.15 mm. Figure 7 shows that the photometric data are compatible with the hypothesis that all sources are at the same redshift, and thus are in the same cosmic structure. This remains true whether or not flux boosting is applied. Evidently, it is only when their spectroscopic redshifts are measured that this hypothesis could be confirmed. As far as the three parameters varied in the model, we provide their acceptable ranges for each source in Fig. 7 ; it is from 26 K to 60 K for (keeping in mind our initial constraint), it is from L⊙ to L⊙ for , and it is from 1.0 to 2.0 for . These luminosities are in the upper range of star-forming ultra-luminous infrared galaxies (ULIRG) in the local universe ( L⊙). The brightest source, ID 18, is even formally in the range of hyper-luminous infrared galaxies (HyLIG). In addition, in Fig. 7 we provide the star formation rates (SFRs) between 330 and 2255 M⊙/yr, as derived from the luminosity Lbol using SFR(M⊙/yr)= Lbol(L⊙) (Hayward et al., 2014).
5 Discussion
The distinctive quasi-alignment of the seven sources, IDs 3, 6, 9, 10, 16, 18, and 25, across the 1.15-mm NIKA2 map is qualitatively reminiscent of the imprint of a cosmic filament in cosmological hydrodynamical simulations (e.g. Illustris (Springel et al., 2018), SIMBA (Davé et al., 2019), NewHorizon (Dubois et al., 2021), and Uchuu (Ishiyama et al., 2021)). Quantitatively, these simulations provide spatial gauges that characterize the distribution of dark matter haloes that host galaxies. These gauges can be usefully compared to our observations. First, it is noticeable that the candidate filament stretches across the whole NIKA2 maps in size and so extends at least over 4 Mpc (comoving) using the scaling factor of 8.3”/kpc, which depends only weakly on redshift for 444https://ned.ipac.caltech.edu/help/cosmology-calc.html. Such an observed extent is larger than the size of a typical cluster of galaxies and is comparable to cosmic filaments in cosmological simulations where they extend from 3 Mpc to 15 Mpc (see e.g. NewHorizon snapshot at in Figure 1 of Dubois et al. (2021)). Second, it is noticeable that the five angular separations between our NIKA2 sources given in Sect. 3.4 (completing with between IDs 3 and 8) correspond to linear separations between 0.25 Mpc and 1.25 Mpc, using the same scaling factor. Such observed separations are also comparable to cosmological simulations where haloes hosting galaxies are typically separated by 0.1 to 1.5 Mpc (see e.g. the NewHorizon snapshot mentioned above). This match of spatial gauges between our NIKA2 observations and cosmological simulations supports our suggestion that the seven SMGs, which are quasi-aligned, bright (LL⊙) , and possibly at the same redshift, may trace a cosmic filament.
A more detailed comparison between our observations and cosmological simulations is not an easy task. The first simulation that has been specifically motivated to study SMGs is the Gadget-2 simulation by Davé et al. (2010) based on a scenario of gas-rich satellite infall rather than intergalactic gas infall along cosmic filaments. However, the spatial distribution of SMGs of this simulation is not presented. In a more recent study derived from the SIMBA simulation (Davé et al., 2019), Lovell et al. (2021) also focus on SMGs and in their Fig. 4, they provide a 140 cMpc sized map of the sky projection of all simulated galaxies with SFR 20 M⊙/yr and within . This simulated map is as deep as 0.25 mJy at 850 m (corresponding to SFR 20 M⊙/yr) and is convolved with the SCUBA2 beam. Their resulting spatial distribution of SMGs is clearly non-uniform and structured along filaments. Further comparison will require a simulation zoomed to match the smaller scale of our NIKA2 maps ( 5cMpc) and evolved to match our NIKA2 source redshift, when measured.
6 Conclusions
With the NIKA2 dual-band camera at the 30-metre IRAM telescope, we made two deep maps of a relatively large field of 90 arcminutes2 in the direction of the star GJ526, simultaneously in its 1.15-mm and 2.0-mm continuum wavebands with a sensitivity of 0.45 mJy/beam and 0.15 mJy/beam, respectively, and with 9.3 hours of on-source observations owing to the high mapping speed of the NIKA2/IRAM 30-metre system. In total, ten background millijansky sources are unambiguously detected with and must be SMGs.
In projection on the sky, the spatial distribution of seven of these SMGs along a filamentary structure that completely crosses both maps is remarkable and has only a low probability of chance occurrence (). We show that all available photometric data, though limited, are compatible with a model of their SEDs in which they are at the same redshift . Of course, this must be confirmed with spectroscopic redshift measurements. At this stage, we can only speculate that this structure could trace a cosmic filament of dark matter, as is predicted by theory and apparent in cosmological hydrodynamical simulations. In assuming the scaling factor of 8.3 kpc at high redshift with standard cosmology for our maps, the extent of this candidate cosmic filament is at least 4 Mpc and the separations between SMGs are a fraction of Mpc comparable to distances between dark matter haloes in high-resolution cosmological simulations. Again, our interpretation is speculative at this stage and a full assessment requires measurements of the spectroscopic redshifts of the SMGs in this candidate filament. Deep spectroscopic follow-up observations of their molecular (CO) or atomic (CI) lines redshifted into the ALMA or NOEMA bands can be envisioned (Inoue et al., 2016; Hashimoto et al., 2018; Solimano et al., 2021; Bing et al., 2022; Birkin et al., 2021). An attempt to optically identify them would require both deeper optical observations and interferometric millimetre-wavelength continuum observations to improve their positions to sub-arcsecond accuracy Finally, the NIKA2 Cosmology Legacy Survey underway at the IRAM 30-metre telescope (Bing et al., 2022), designed to map fields more than 30 times larger than the GJ526 field, will be of great interest to further probe the spatial distribution of SMGs in the millimetre-wavelength domain and address their relationship with the network of cosmic filaments of dark matter in simulations. In particular, establishing this relationship would support the cold gas accretion mechanism to fuel galaxy growth. This endeavour is also pursued with imaging of diffuse Ly emission along filamentary structures (e.g Umehata et al. (2019)).
Acknowledgements.
This work is based on observations carried out under project number 133-17 with the IRAM 30m telescope. IRAM is supported by INSU/CNRS (France), MPG (Germany) and IGN (Spain). We would like to thank the IRAM staff for their support during the campaigns. The NIKA2 dilution cryostat has been designed and built at the Institut Néel. In particular, we acknowledge the crucial contribution of the Cryogenics Group, and in particular Gregory Garde, Henri Rodenas, Jean Paul Leggeri, Philippe Camus. This work has been partially funded by the Foundation Nanoscience Grenoble and the LabEx FOCUS ANR-11-LABX-0013. This work is supported by the French National Research Agency under the contracts “MKIDS”, “NIKA” and ANR-15-CE31-0017 and in the framework of the “Investissements d’avenir” program (ANR-15-IDEX-02). This work has benefited from the support of the European Research Council Advanced Grant ORISTARS under the European Union’s Seventh Framework Program (Grant Agreement no. 291294). This research has made use of Herschel data ; Herschel is an ESA space observatory with science instruments provided by European-led Principal Investigator consortia and with important participation from NASA. This research has made use of the SIMBAD database, operated at CDS, Strasbourg, France. This research has made use of the NASA/IPAC Extragalactic Database (NED), which is operated by the Jet Propulsion Laboratory, California Institute of Technology, under contract with the National Aeronautics and Space Administration.References
- Adam et al. (2018) Adam, R., Adane, A., Ade, P. A. R., et al. 2018, A&A, 609, A115
- Adam et al. (2014) Adam, R., Comis, B., Macías-Pérez, J. F., et al. 2014, A&A, 569, A66
- Bacon et al. (2021) Bacon, R., Mary, D., Garel, T., et al. 2021, A&A, 647, A107
- Bertoldi et al. (2007) Bertoldi, F., Carilli, C., Aravena, M., et al. 2007, ApJS, 172, 132
- Béthermin et al. (2015) Béthermin, M., De Breuck, C., Sargent, M., & Daddi, E. 2015, A&A, 576, L9
- Béthermin et al. (2013) Béthermin, M., Wang, L., Doré, O., et al. 2013, A&A, 557, A66
- Béthermin et al. (2017) Béthermin, M., Wu, H.-Y., Lagache, G., et al. 2017, A&A, 607, A89
- Bing et al. (2022) Bing, L., Adam, R., Ade, P., et al. 2022, in European Physical Journal Web of Conferences, Vol. 257, European Physical Journal Web of Conferences, 00006
- Birkin et al. (2021) Birkin, J. E., Weiss, A., Wardlow, J. L., et al. 2021, MNRAS, 501, 3926
- Blain et al. (2003) Blain, A. W., Barnard, V. E., & Chapman, S. C. 2003, MNRAS, 338, 733
- Blain et al. (2002) Blain, A. W., Smail, I., Ivison, R. J., Kneib, J. P., & Frayer, D. T. 2002, Phys. Rep, 369, 111
- Bond et al. (1996) Bond, J. R., Kofman, L., & Pogosyan, D. 1996, Nature, 380, 603
- Bourrion et al. (2016) Bourrion, O., Benoit, A., Bouly, J. L., et al. 2016, Journal of Instrumentation, 11, P11001
- Calvo et al. (2016) Calvo, M., Benoît, A., Catalano, A., et al. 2016, Journal of Low Temperature Physics, 184, 816
- Cantalupo et al. (2014) Cantalupo, S., Arrigoni-Battaia, F., Prochaska, J. X., Hennawi, J. F., & Madau, P. 2014, Nature, 506, 63
- Catalano et al. (2014) Catalano, A., Calvo, M., Ponthieu, N., et al. 2014, A&A, 569, A9
- Chapman et al. (2005) Chapman, S. C., Blain, A. W., Smail, I., & Ivison, R. J. 2005, ApJ, 622, 772
- Condon et al. (1998) Condon, J. J., Cotton, W. D., Greisen, E. W., et al. 1998, AJ, 115, 1693
- Coppin et al. (2005) Coppin, K., Halpern, M., Scott, D., Borys, C., & Chapman, S. 2005, MNRAS, 357, 1022
- Daddi et al. (2021) Daddi, E., Valentino, F., Rich, R. M., et al. 2021, A&A, 649, A78
- Davé et al. (2019) Davé, R., Anglés-Alcázar, D., Narayanan, D., et al. 2019, MNRAS, 486, 2827
- Davé et al. (2010) Davé, R., Oppenheimer, B. D., Katz, N., Kollmeier, J. A., & Weinberg, D. H. 2010, MNRAS, 408, 2051
- Dekel et al. (2009) Dekel, A., Birnboim, Y., Engel, G., et al. 2009, Nature, 457, 451
- Dubois et al. (2021) Dubois, Y., Beckmann, R., Bournaud, F., et al. 2021, A&A, 651, A109
- Franco et al. (2018) Franco, M., Elbaz, D., Béthermin, M., et al. 2018, A&A, 620, A152
- Greve et al. (2004) Greve, T. R., Ivison, R. J., Bertoldi, F., et al. 2004, MNRAS, 354, 779
- Griffin et al. (2010) Griffin, M. J., Abergel, A., Abreu, A., et al. 2010, A&A, 518, L3
- Hashimoto et al. (2018) Hashimoto, T., Laporte, N., Mawatari, K., et al. 2018, Nature, 557, 392
- Hatsukade et al. (2011) Hatsukade, B., Kohno, K., Aretxaga, I., et al. 2011, MNRAS, 411, 102
- Hayward et al. (2014) Hayward, C. C., Lanz, L., Ashby, M. L. N., et al. 2014, MNRAS, 445, 1598
- Hennawi et al. (2015) Hennawi, J. F., Prochaska, J. X., Cantalupo, S., & Arrigoni-Battaia, F. 2015, Science, 348, 779
- Hodge & da Cunha (2020) Hodge, J. A. & da Cunha, E. 2020, Royal Society Open Science, 7, 200556
- Inoue et al. (2016) Inoue, A. K., Tamura, Y., Matsuo, H., et al. 2016, Science, 352, 1559
- Ishiyama et al. (2021) Ishiyama, T., Prada, F., Klypin, A. A., et al. 2021, MNRAS, 506, 4210
- Karim et al. (2013) Karim, A., Swinbank, A. M., Hodge, J. A., et al. 2013, MNRAS, 432, 2
- Kereš et al. (2005) Kereš, D., Katz, N., Weinberg, D. H., & Davé, R. 2005, MNRAS, 363, 2
- Lestrade et al. (2006) Lestrade, J. F., Wyatt, M. C., Bertoldi, F., Dent, W. R. F., & Menten, K. M. 2006, A&A, 460, 733
- Lestrade et al. (2009) Lestrade, J. F., Wyatt, M. C., Bertoldi, F., Menten, K. M., & Labaigt, G. 2009, A&A, 506, 1455
- Lindner et al. (2011) Lindner, R. R., Baker, A. J., Omont, A., et al. 2011, ApJ, 737, 83
- Lovell et al. (2021) Lovell, C. C., Geach, J. E., Davé, R., Narayanan, D., & Li, Q. 2021, MNRAS, 502, 772
- Martin et al. (2015) Martin, D. C., Matuszewski, M., Morrissey, P., et al. 2015, Nature, 524, 192
- Martin et al. (2019) Martin, D. C., O’Sullivan, D., Matuszewski, M., et al. 2019, Nature Astronomy, 3, 822
- Matthews et al. (2010) Matthews, B. C., Sibthorpe, B., Kennedy, G., et al. 2010, A&A, 518, L135
- Miller et al. (2015) Miller, T. B., Hayward, C. C., Chapman, S. C., & Behroozi, P. S. 2015, MNRAS, 452, 878
- Monfardini et al. (2011) Monfardini, A., Benoit, A., Bideaud, A., et al. 2011, ApJS, 194, 24
- Perotto et al. (2020) Perotto, L., Ponthieu, N., Macías-Pérez, J. F., et al. 2020, A&A, 637, A71
- Poglitsch et al. (2010) Poglitsch, A., Waelkens, C., Geis, N., et al. 2010, A&A, 518, L2
- Schulz et al. (2017) Schulz, B., Marton, G., Valtchanov, I., et al. 2017, arXiv e-prints, arXiv:1706.00448
- Scott et al. (2008) Scott, K. S., Austermann, J. E., Perera, T. A., et al. 2008, MNRAS, 385, 2225
- Scott et al. (2010) Scott, K. S., Yun, M. S., Wilson, G. W., et al. 2010, MNRAS, 405, 2260
- Solimano et al. (2021) Solimano, M., González-López, J., Barrientos, L. F., et al. 2021, A&A, 655, A42
- Springel et al. (2018) Springel, V., Pakmor, R., Pillepich, A., et al. 2018, MNRAS, 475, 676
- Strandet et al. (2016) Strandet, M. L., Weiss, A., Vieira, J. D., et al. 2016, ApJ, 822, 80
- Umehata et al. (2019) Umehata, H., Fumagalli, M., Smail, I., et al. 2019, Science, 366, 97
- Weinberg (1972) Weinberg, S. 1972, Gravitation and Cosmology: Principles and Applications of the General Theory of Relativity
- Wright (2006) Wright, E. L. 2006, PASP, 118, 1711
- Wright et al. (2010) Wright, E. L., Eisenhardt, P. R. M., Mainzer, A. K., et al. 2010, AJ, 140, 1868