Crosslinker mobility governs fracture behavior of catch-bonded networks
Abstract
While most chemical bonds weaken under the action of mechanical force (called slip bond behavior), nature has developed bonds that do the opposite: their lifetime increases as force is applied. While such catch bonds have been studied quite extensively at the single molecule level and in adhesive contacts, recent work has shown that they are also abundantly present as crosslinkers in the actin cytoskeleton. However, their role and the mechanism by which they operate in these networks have remained unclear. Here, we present computer simulations that show how polymer networks crosslinked with either slip or catch bonds respond to mechanical stress. Our results reveal that catch bonding may be required to protect dynamic networks against fracture, in particular for mobile linkers that can diffuse freely after unbinding. While mobile slip bonds lead to networks that are very weak at high stresses, mobile catch bonds accumulate in high stress regions and thereby stabilize cracks, leading to a more ductile fracture behavior. This allows cells to combine structural adaptivity at low stresses with mechanical stability at high stresses.
Many natural and engineering materials need to combine mechanical stability with structural adaptivity. Such seemingly contradictory properties can be realized in transient polymer networks: networks that are connected by dynamic, reversible bonds. The short-lived character of individual bonds allows for rearrangements and plasticity, while the mechanical integrity of the whole network can be maintained by distributing mechanical stresses over many bonds. This leads to viscoelastic behaviour, and the possibility for stresses to relax and for damage to spontaneously heal skrzeszewska2010fracture . Biological examples of transient networks can be found in the cytoskekeleton, where long actin filaments are linked together by a large variety of dynamic crosslinkers lieleg2009cytoskeletal ; huber2015cytoskeletal , and in the extracellular matrix, where protein fibrils and polysaccharides are crosslinked into a complex network by non-covalent interactions mak2020impact . Synthetic examples of transient networks are associative polymers that carry hydrophobic sticky groups mayumi2016fracture , hydrogen-bonding groups lewis2014influence , or ionic interactions henderson2010ionically ; lemmers2010multiresponsive .
The mechanical stability of transient networks relies on a balance between bond breaking and reformation events. However, because forces acting on the linkers influence their binding and unbinding rates, this balance is shifted by mechanical stress. Local unbinding events can lead to small defects or microcracks in the material, which tend to concentrate stresses. Most crosslinkers unbind faster when force is applied, so that bond rupture is enhanced near defects, destabilizing these regions even further. This cascade of force-induced bond rupture ultimately leads to crack initiation and fracture, thereby compromising the resistance of transient networks against mechanical stress skrzeszewska2010fracture ; van2018laser .
Recent findings suggest that nature may have found a way to avoid this catastrophic cascade of bond disruption, by making use of so-called catch bonds. Instead of weakening under force (called slip bond behaviour), catch bonds first become stronger when they are stressed and weaken only at higher forces (see Fig. 1(a)). This counter-intuitive behavior emerges from a conformational rearrangement within the molecule upon the application of a mechanical force. First discovered in adhesion proteins marshall2003direct ; liu2020high ; liu2014accumulation ; luca2017notch ; thomas2002bacterial , catch bonding has recently also been demonstrated in several crosslinking proteins in the cytoskeleton huang2017vinculin ; laakso2008myosin ; yao2013stress ; mulla2020weak ; doss2020cell . Since catch bonds become more stable at moderate forces, they may be able to stabilize networks against fracture by accumulating in regions of high stress, and thereby mitigate the vulnerability of transient networks to defects and cracks.
As suggested by recent simulations, the mechanical stability of transient networks depends sensitively on the mobility of the crosslinkers. Mobile linkers, such as actin-binding proteins that can diffuse freely after unbinding, can rebind in new locations of the network, and so redistribute rapidly. Immobile crosslinkers, however, such as pendant sticky groups attached to the polymer backbone, can only rebind in the same location. For slip bonds, crosslinker mobility is expected to accelerate fracture, because dissociated bonds can diffuse away from the crack tip and rebind in regions of lower stress mulla2018crosslinker . By contrast, mobile catch bonds may be able to stabilize networks more efficiently than immobile catch bonds, because they can accumulate more efficiently in regions of high stress mulla2020weak .
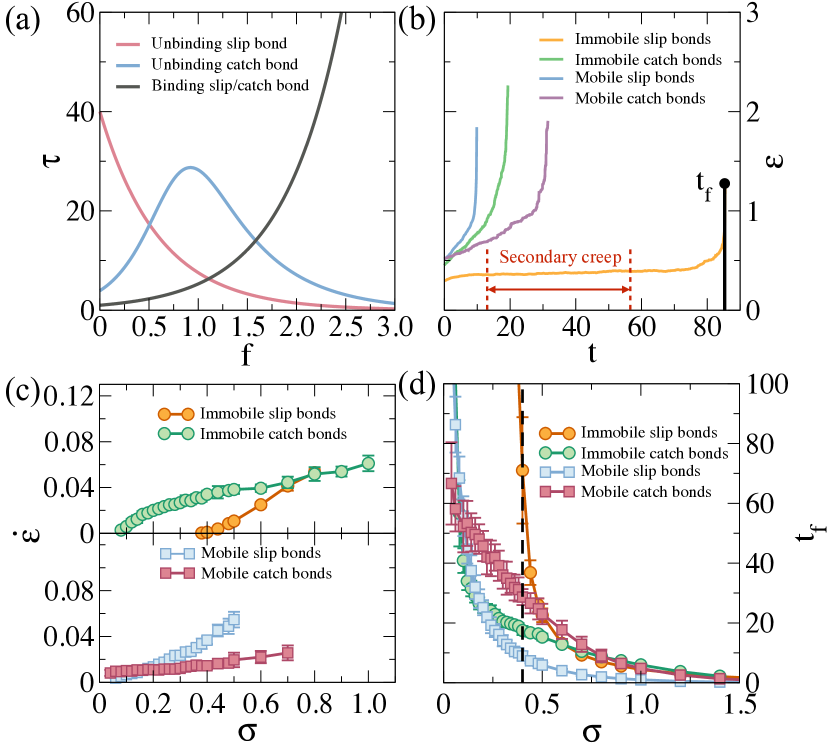
To test this hypothesized stabilization mechanism of catch bonds, and to investigate how the binding and unbinding kinetics of transient slip and catch bonds and their mobility couple to the distribution of stress in the network, we perform computer simulations. Biological polymer networks are highly disordered and heterogeneous, which leads to very heterogeneous stress distributions and strongly non-affine deformation fields arevalo2015stress ; liang2016heterogeneous ; shivers2019normal ; ruiz2022force ; zhang2017fiber ; dussi2020athermal . We therefore use a network model in which the connectivity and topology are explicitly accounted for and in which non-affine deformations and inhomogeneous stresses arise naturally. We consider a 2D network consisting of nodes that can be connected by linear Hookean springs with force-extension relation . We set the stiffness and rest length to unity for all springs, so that all forces are expressed in units of and all length scales in units of . The transient nature of the network is accounted for by allowing bonds between nodes to bind and unbind stochastically, using a kinetic Monte Carlo scheme gillespie1976general . Slip bond behavior is described using Bell’s model, which assumes an exponential increase of the unbinding rate with force bell1978models , while catch bond behavior is described using the two-pathway model pereverzev2005two . As natural catch bonds tend to be weaker than slip bonds mulla2020weak , we choose parameters for which the lifetime of catch bonds at rest is much shorter than for slip bonds, as shown in Fig. 1(a), which shows the bond lifetimes as a function of force for both types. We furthermore assume that the rebinding rate decreases with increasing distance between the nodes, and take this to be the same for both types of bonds, as also shown in Fig. 1(a). All times are expressed in units of the binding time at zero force, . To study how linker diffusion affects the mechanics of the network, we compare mobile and immobile bonds. While the binding and unbinding of immobile bonds always involve the same pair of nodes, mobile bonds are allowed to rebind at any location in the network, which corresponds to the limit of rapid diffusion after unbinding. To enable mobile bonds to redistribute, we allow new bonds to form between nodes that are already connected, i.e. we allow the formation of double bonds. The number of actually bound linkers can never exceed the total number of linkers , which we take to be equal to the number of bonds in a network that is fully connected by single bonds. To study network failure under mechanical loading, we subject the networks to uniaxial deformation by applying a constant macroscopic stress at the top and bottom boundaries, while we use periodic boundary conditions in the -direction. We assume that the network is athermal, and use the FIRE algorithm bitzek2006structural to minimize the potential energy after every binding or unbinding event, by adjusting the positions of the nodes in the network. Thus, mechanical stress relaxation in the networks is significantly faster than the binding/rebinding events. While our model ignores the contribution of thermal fluctuations to the mechanical response, it has been shown previously that 2D athermal network models give a very good description of biological networks of semiflexible fibrils broedersz2016modeling . In all cases, we start with a fully (single-)connected triangular network and perform an equilibration process during Monte Carlo steps with , before starting the deformation. A detailed description of the model is presented in the Supplemental Material. All quantities reported are averaged over independent configurations for each stress value.
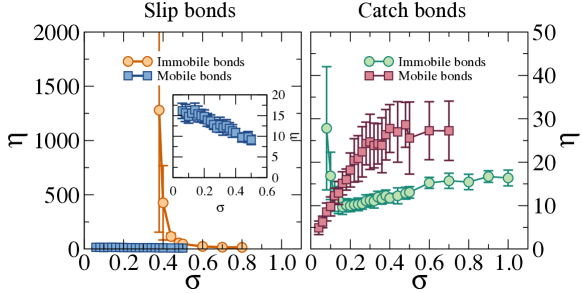
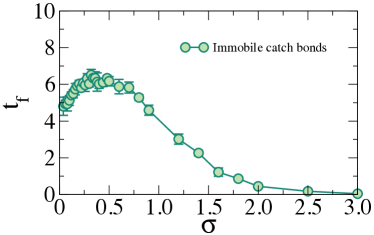
Throughout this paper, we will compare networks with four different types of crosslinkers: immobile and mobile slip bonds, and immobile and mobile catch bonds. In Fig. 1(b) we show how the four different networks deform after applying stress (), by plotting the macroscopic strain as a function of time. In all cases, we observe an initial elastic response, followed by a stage in which the network gradually deforms at more or less constant strain rate (denoted secondary creep), until it finally fractures into two disconnected pieces. We compute the creep rate in the secondary creep stage and the time to fracture , and plot these as a function of in Fig. 1(c) and (d). We first discuss the case of immobile bonds. Clearly, the creep rate is much larger for immobile catch bonds than for immobile slip bonds. This is a consequence of the larger intrinsic unbinding rate of catch bonds compared to slip bonds, making catch-bonded networks more dynamic. While the creep rate increases almost linearly with increasing stress for slip bonds, it levels off at intermediate stresses for catch bonds. We can further interpret these data by calculating the effective creep viscosity as . As shown in Fig. S1, the force-enhanced unbinding kinetics for slip bonds gives rise to strain thinning behavior (i.e. a viscosity that decreases with increasing stress), while for catch bonds, the strain thinning behavior at small forces is followed by strengthening of bound linkers at larger forces, giving rise to very pronounced strain thickening (a viscosity that increases with increasing stress). When considering the network lifetime , we find that for all stresses, immobile slip bonds are more efficient in postponing fracture than immobile catch bonds. In particular, for slip bonds we find a metastable region for (highlighted by the dashed line in Fig. 1(d)), for which no fracture is observed during our simulations and the creep rate vanishes. This metastable shifts to much lower stresses for catch bonds. These findings show that, although immobile catch bonds can qualitatively change the response of the network to stress, they are not very efficient in protecting networks against fracture: even though the lifetime of individual catch bonds is significantly larger than that of slip bonds at moderate forces (Fig. 1(a)), this does not lead to an increase in network lifetime at higher stresses. Furthermore, we note that the characteristic peak at intermediate forces in the lifetime of individual catch bonds is not visible in the lifetime of the networks, indicating that collective effects effectively screen the catch bond behaviour. As we show in Fig. S2, this screening is related to the transient nature of the bonds, as a peak in network lifetime does appear in the absence of rebinding (i.e. for ).
The picture changes dramatically, however, when the bonds are mobile, so that they can redistribute within the network. As shown in Fig. 1(c), crosslinker mobility strongly enhances the creep rate for slip-bonded networks. This enhanced creep significantly accelerates fracture, and removes the metastable regime that was observed for immobile slip bonds (Fig. 1(d)). Such an adverse effect of mobility on the stability of slip bonded materials was also observed in 1D simulations of adhesive patches, mulla2018crosslinker . Interestingly, for catch bonds mobility has the opposite effect: it reduces the rate of creep and delays fracture. Catch bonding thus provides a mechanism to stabilize networks with dynamic, diffusable linkers, such as those in the cytoskeleton. In particular, mobile catch bonds can combine deformability and adaptivity at low stresses (note that for the creep rate significantly exceeds that of slip bond networks), with rigidification and stabilization at higher stresses.
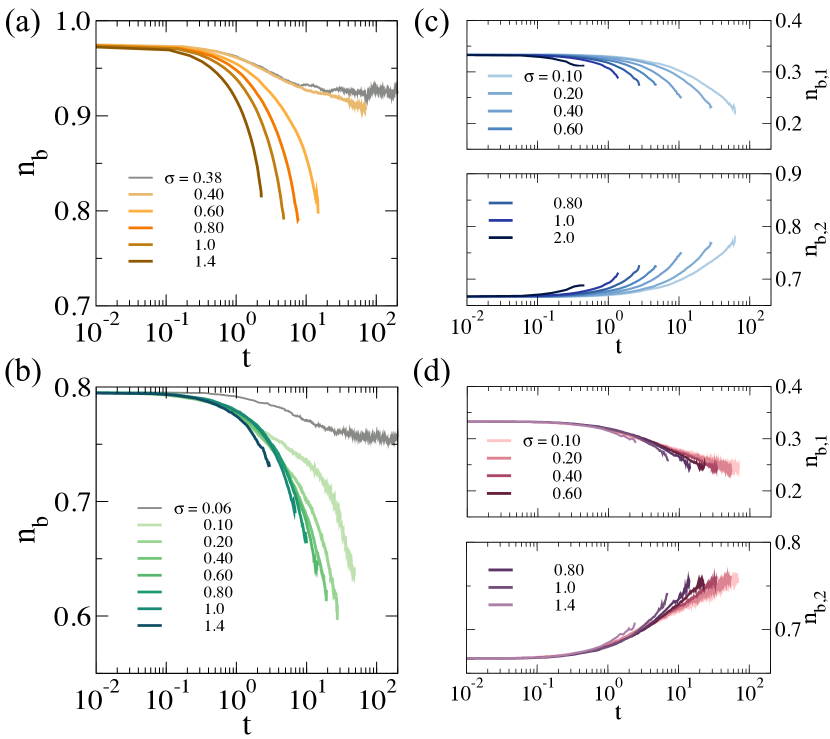
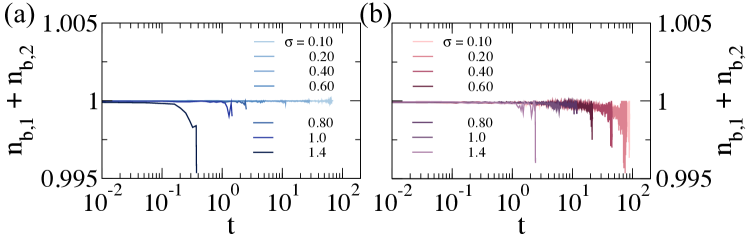
To obtain microscopic insight in the underlying crosslinker dynamics, we consider the evolution of the number of bonds in the network as a function of time. For immobile slip bonds, shown in Fig. 2(a), decays gradually after applying stress, and, as expected based on the lifetime-force relation of the bonds, this decay is faster when the stress increases. The accumulation of ruptured bonds gradually weakens the network, which makes it more stretchable and causes the secondary creep observed in Fig. 1(b). The metastable state for low stresses corresponds to a plateau in (grey curve in 2(a)), in which bond rupture is balanced by rebinding, so that small cracks can be repaired before they start to propagate. For immobile catch bonds, we see a similar behaviour as for slip bonds, although the decay rate is less dependent on the stress Fig. 2(b)). While this shows that the catch mechanism is indeed activated in these networks, it does not work very efficiently, because the lifetime of the network remains smaller than that of slip-bonded networks (Fig. 1(d)). The scenario changes for the case of mobile bonds. As shown in the upper panels of Fig. 2(c) and (d), the number of single bonds decreases similarly as for immobile bonds. However, this decrease is now accompanied by an increase in the number of double bonds (shown in the lower panels). This increase of indicates that the dissociated bonds rebind in other regions of the network. The total number of bonds, , remains more or less constant (Fig. S3), but their distribution over the network is strongly affected by the applied stress. For slip bonds, this bond redistribution destabilizes the network, in particular for higher stresses, since the network ruptures already after a small change in and . For catch bonds, however, this is not so, indicating that the new bonds are placed in regions where they stabilize the network, i.e. in regions where the stress is higher. This can also be seen by looking at the probability distribution of the forces at which the bonds break and reform, shown in Fig. S5. While the distribution for rebinding is very similar for the two different bonds, slip bonds that are more stretched break much more rapidly than stretched catch bonds.
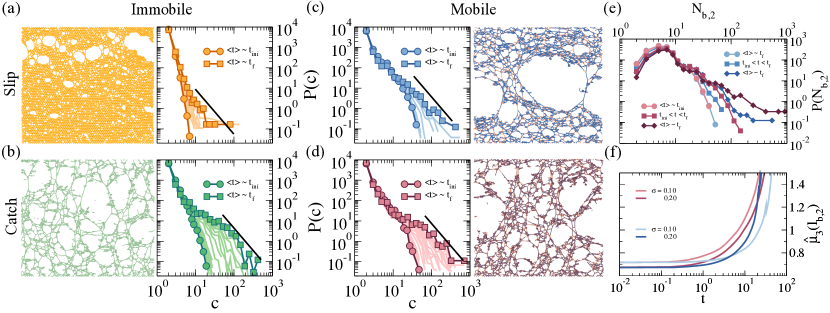
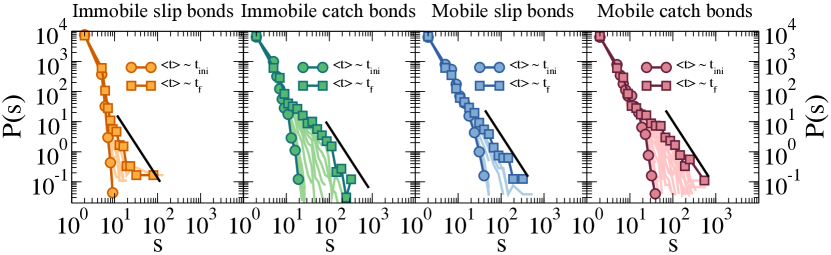
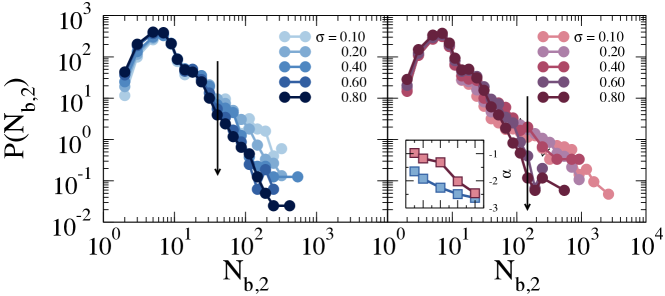
Next, we study how the binding and unbinding events affect the evolution of the structure of the network. Representative snapshots of the networks just before macroscopic fracture are shown in Fig. 3(a)-(d) for the four different crosslinkers at . How these networks evolve in time, starting from an initially homogeneous network, is shown in Figs. S10 and S11. In all networks, we see the formation of cracks that open up due to the applied tensile force. We calculate the distribution of crack sizes from these snapshots, as explained in detail in the Supplemental Information. The results are shown in Fig. 3 next to the snapshots. Both the snapshots and the crack size distributions reveal different fracture scenarios for slip and catch bonds. For networks with slip bonds, the crack size distribution remains narrow, and the damage is localized in a few large cracks that will eventually merge, leading to macroscopic failure (Fig. 3(a) and (c)). For catch bonds, the crack size distribution is much wider and it develops a power law tail with an exponent , which is close to the value expected for random percolation sciortino2005one . These findings suggest that the fracture process proceeds in a different manner for the different types of bonds. For slip bonds, stress concentration destabilizes especially the larger cracks, because the stress is largest at the tip of the largest cracks Inglis1913stresses and, as a consequence, the rupture rate is highest there. This leads to a scenario of crack nucleation and propagation. By contrast, catch bonds stabilize these high stress regions, and thereby prevent crack propagation. This leads to a broader crack size distribution and a fracture scenario that looks more like damage percolation Shekhawat2013from . As our previous findings indicate, this stabilizing effect is much more effective for mobile bonds, because mobility allows these bonds to accumulate near the crack tips. To verify this, we calculate the distribution of double bonds located on the surface of the cracks, . As shown in Fig. 3(e), this distribution is initially similar for slip and catch bonds, but as the damage process proceeds and stresses increase, the distribution develops a much longer tail for the catch bonds. This shows that the increase in the number of double bonds observed in Fig. 2(d) is caused by an accumulation of catch bonds at the crack surface, where the local stress is highest. This accumulation of catch bonds in high stress-regions is further confirmed by looking at the skewness of the bond length distribution . A larger positive skewness indicates a more asymmetric distribution with a longer tail of strongly stretched bonds. As shown in Fig. 3(f), indeed increases much more steeply for catch bonds than for slip bonds, again indicating their accumulation in high stress regions. In Figs. S8 and S9, we show that similar results are obtained at smaller stress levels.
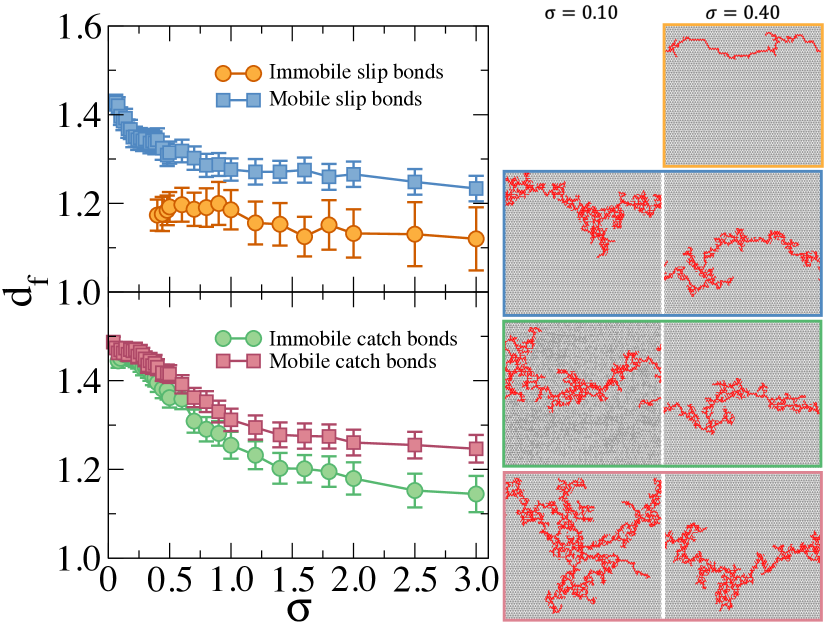
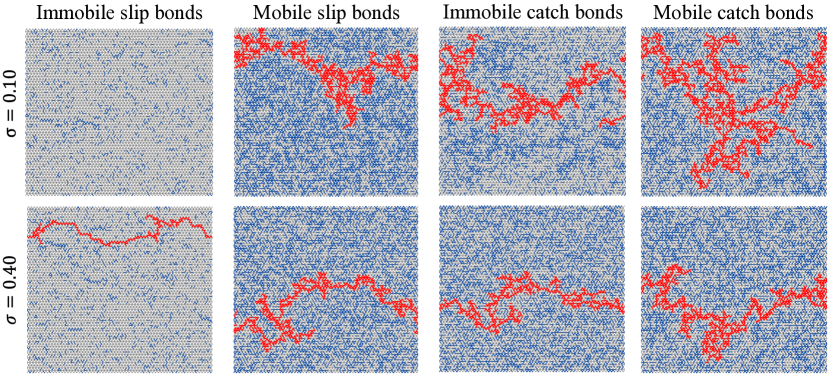
As discussed above, the fracture process appears to proceed differently for the different types of bonds. To investigate this in more detail, we calculate the fractal dimension of the final percolating crack, using the box-counting method gagnepain1986fractal ; ruiz2020tuning . In Fig. 4(a) we show how varies with the stress for the different bonds. Snapshots of the final fracture patterns for two different stresses are shown in Fig. 4(b), with the percolating crack shown in red. For immobile slip bonds, depends only weakly on the stress and has a values close to 1, which is the value expected for linear crack propagation. This can be seen also in the snapshot in Fig. 4(b), and corresponds to brittle fracture behaviour moreira2012fracturing ; dussi2020athermal . We note that for small stresses there appears to be a weak maximum in the fractal dimension. Such a maximum is also seen in the total number of broken bonds at the moment of fracture (Fig. S4). We speculate that this maximum is related to the vicinity of the metastable regime and due to a transition in the fracture mechanism, from a subcritical regime at small stresses, where fracture occurs only after nucleation of a sufficiently large defect to a rapid crack propagation regime at high stresses. For both immobile and mobile catch bonds, the fractal dimension is much larger than for the corresponding slip bonds, in particular at low stresses. This is in accordance with a scenario of damage percolation, and can also be seen by considering the total number of broken bonds at the moment of fracture, which is larger for catch bonds than for slip bonds (Figs. S4 and S12). As the stress increases, the fractal dimension decreases for the catch bond networks and becomes similar to that of slip bond networks, while the number of broken bonds decreases. This indicates a more brittle fracture at higher stress and can be explained by the fact that at high forces the catch bonds return to slip behaviour (Fig. 1(a)).
In conclusion, our results highlight how crosslinker dynamics affect the stability and fracture of transient networks. Many biological materials, such as the actin cytoskeleton, are crosslinked by dynamic and mobile linkers, probably because this allows for fast dynamic control of the network properties. Our simulations show that for slip bonds, linker mobility seriously decreases the resistance of the networks to stress, while catch bonded networks become more stable when the bonds are mobile. This suggests that mobile biological catch bonds have evolved as a strategy to realize flexibility and dynamics without compromising the resistance to mechanical stress. Most probably, cells use a combination of slip and catch bonds to tailor the mechanical response and dynamics of the cytoskeleton at various stress levels. We hope that our results will help to shed light on the complex dynamic behavior of biological networks, and that it can also inspire the design of novel synthetic materials with mechanical properties that cannot be realized with simple transient bonds.
Acknowledgements.
This work is part of the SOFTBREAK project funded by the European Research Council (Consolidator grant Softbreak, grant agreement 682782). The authors acknowledge Simone Dussi, Frans Leermakers and Martijn van Galen for useful discussions.Supplemental Material for
“Crosslinker mobility governs fracture behavior of catch-bonded networks”
I Simulation Methods
I.1 Network model
We perform simulations of 2D triangular networks of nodes interconnected by one-dimensional Hookean springs with stretching modulus and rest length . Thus, the Hamiltonian of the system is
| (1) |
where the sum is taken over all bonds with the bond length. All bonds are harmonic springs with unit stiffness and unit rest length (so and ). We use periodic boundary conditions in the -direction, while nodes on the top and bottom boundaries are fixed. After each deformation step or binding/unbinding event, the energy of the system is minimized by adjusting the positions of the nodes, using the FIRE algorithm bitzek2006structural . The maximum tolerance corresponds to the system root-mean-square force and it is set to be . Since we only consider potential energy, our system is under athermal conditions. Node pairs that have no bond connected do not interact at all. Uniaxial deformation of the network in the -direction leads to a macroscopic stress in the network . The stress is computed by the virial stress tensor defined as
| (2) |
where and are the Cartesian axes. The sum runs over all the bonded pairs of nodes , is the force acting on the node due to in the direction, is the distance between the two nodes in the direction, and is the instantaneous area. We evaluate the tensor component. In our simulations, we maintain a constant uniaxial stress by adjusting the strain.
All quantities are expressed in reduced units, i.e. length scales are expressed in terms of , forces in terms of , and stresses in terms of . Time is expressed in units of the rebinding time (which is the same for slip and catch bonds, see below).
I.2 Unbinding and binding bonds
Structural changes in the network due to binding and unbinding events are simulated by using a kinetic Monte Carlo scheme due to Gillespie gillespie1976general . At every step, we make a list of all possible unbinding and binding events. Based on the list we calculate the total reaction propensity , where is the transition rate of a spring corresponding to an unbinding or binding event, as defined below. Which event is the next reaction to occur is drawn randomly, witch each event weighed with its actual reaction rate. The time interval to the next event is drawn also randomly, assuming exponentially distributed events, i.e. , with the dimensionless time then given by .
All bonds in our networks are transient, reversible bonds with kinetics of binding and unbinding that depend on the force acting on the bond, . For the slip bonds, we assume an unbinding rate that decreases exponentially with the force, as predicted by the Bell model bell1978models :
| (3) |
where is the unforced unbinding rate, and is the force where the off rate has fallen with a factor . This is related to the activation length of the bond, as . By contrast, catch bond behavior is described by the two path-way model as pereverzev2005two
| (4) |
The first term, characterized by and , captures the dissociation along a slip-like path at large pulling force , while the second term, characterized by and describes dissociation along a catch-path decreasing the unbinding rate (and thus, increasing the lifetime) with force for small forces . To mimic catch-bond behavior, it is necessary that and pereverzev2005two ; van2020chemical . In Fig. 1(a) in the main text, we show the bond lifetime as a function of for both slip and catch bonds. In particular, we decide to fix for slip bonds, and and for catch bonds. Finally, we consider that the binding rate is also load-dependent and the same for both types of bonds, being expressed as:
| (5) |
Thus, we assume that the binding rate between a pair becomes smaller with increasing distance between the two nodes. Fig. 1(a) in the main text shows the binding lifetime for the set of values .
I.3 Immobile and mobile bonds
Immobile bonds rebind between the same pair of nodes from which they are unbound, providing memory to the system of its initial structure. By contrast, mobile bonds can form in random new locations, involving thus any two nodes. To allow bonds to redistribute, we allow a new bond to form between a pair of nodes that is already linked by one bond, so that double bonds can form. This implies that, while for immobile bonds the maximum local connectivity is , for mobile bonds this is . In all our simulations, we impose a maximum number of bonds that can be formed , which is equal to the number of bonds that is present in a network where every pair of neighbouring bonds is connected with exactly one bond. This means that new bonds can only form if there are unbound linkers available.
II Additional results
II.1 Effective viscosity
Fig. S1 shows the effective elongational viscosity computed as for networks with slip and catch bonds. For networks with slip bonds, Fig. S1(a), we observe that decreases with increasing stress, indicating strain thinning. For immobile bonds is larger than for mobile bonds, which is in line with our finding that the network lifetime is larger for immobile bonds. In particular, for immobile bonds we observe that the viscosity diverges for low stress, which corresponds to the metastable regime.
By contrast, networks with catch bonds manifest strain thickening, Fig. S1(b). Furthermore, unlike what happens for slips bonds, is considerably larger when catch bonds are mobile. This opposite behavior between bonds as a function of mobility strongly suggests that mobility is needed to take advantage of the nature of catch bonds.
II.2 Catch bond behaviour on the network
The lifetime of a network with catch bonds without rebinding transitions, i.e. , is shown as a function of stress in Fig. S2. We observe how a peak in develops at . The presence of this peak resembles the characteristic peak of an individual catch bond. However, it is less pronounced, probably because the stress distribution in the network is heterogeneous. Since rebinding events promote bond formation at low stress, the echo from the catch bond behavior is shielded in transient networks with reversible bonds.
II.3 Evolution of the total number of mobile bonds
As mentioned in the main text, the total number of bonds for both mobile slip and catch bonds remains more or less constant, except close to the moment of fracture, when the network is destabilized and no more bonds can be bound close the cracks to postpone their propagation.
II.4 Fraction of final bonds
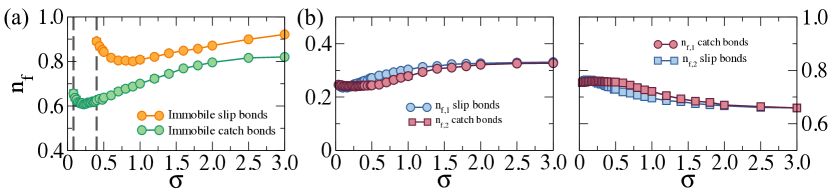
In Fig. S4(a) we report the fraction of bonds at the moment of fracture, as a function of stress for immobile bond networks. In particular, for slip bonds, we see a minimum at , i.e. close to the metastability. The presence of this minimum hints at a change in fracture scenario, from fracture at subcritical stress at low , to fracture dominated by gradual degradation of the network at high . This minimum is shifted to for immobile catch bonds, leading to a metatable state at lower stress, and is a monotonic function of , indicating that the fracture becomes more brittle as the stress increases. We note furthermore that the fraction of bonds remaining in the network is much smaller for catch than for slip bonds, indicating much more diffuse damage in the case of catch bonds.
Fig. S4(b) shows the fraction of single and double bonds for networks with mobile slip and catch bonds. We observe that for intermediate stresses, is higher for catch bonds, indicating that the redistribution of bonds by the accumulation of double bonds proceeds more efficiently for catch bonds. This is caused by the fact that catch bond networks are stabilized by relocalizing bonds, while slip bond networks are destabilized,
II.5 Unbinding and binding probability distribution
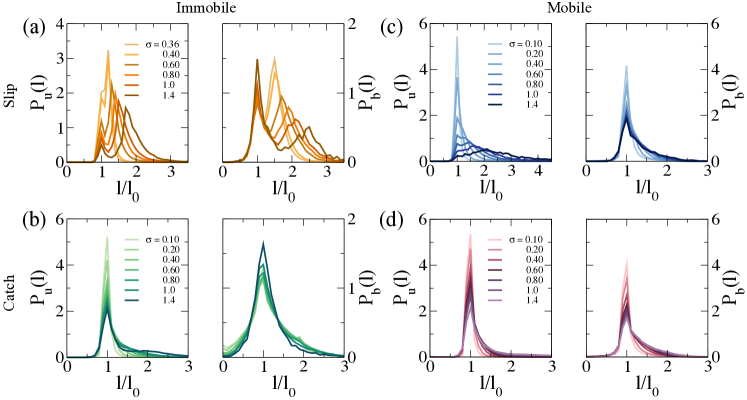
We record the bond length associated to each binding/unbinding event during the simulation, and build the probability distribution that a bond will unbind or bind with length . This information is shown in Fig. S5 for the four different types of networks we have simulated here, for different . While the mobility of bonds strongly influences the probability distributions for slip bonds, for catch bonds they are quite similar. Indeed, we observe that both and for immobile slip bonds develop a double peak; the first placed at the bond rest length, whereas the second one shifts to higher bond length with . Because immobility limits the places where bonds can be formed, it is expected that slip bonds are forced to bind with . However, these strongly stretched bonds will also break rapidly due to their slip behaviour. When slip bonds are mobile, the second peak in disappears, and the distribution develops a long tail. Now, slip bonds can form wherever they want, and, since their lifetime is maximum at they will preferentially want to accumulate in regions with lower local stress, as we have also observed in Fig. 3(e) in the main text where the distribution of double bonds around cracks is discussed. This has a direct impact on , where the second peak at large bond length is reduced. As we have indicated above, the binding probability distribution for immobile and mobile catch bonds are similar. The unbinding probabilities at higher force are much smaller for catch bonds than for slip bonds, clearly showing that catch bonds are stabilized in high stress regions.
II.6 Crack identification
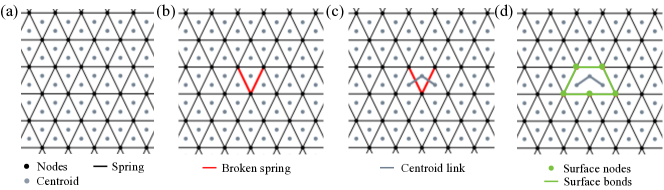
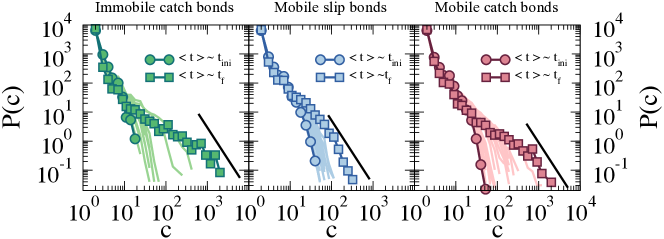
To identify crack and study crack propagation, we define on the undeformed network, i.e. the fully connected triangular lattice, centroid points of each triangular cell as shown in Fig. S6(a). Unbinding and binding events are mapped on the undeformed network, schematically shown in Fig. S6(b). Then, two centroid points are linked defining a crack when, during the deformation, the bond that splits them is broken (see Fig. S6(c)). Furthermore, we define the crack surface as the lattice nodes or bonds around each crack, as we represent in Fig. S6(d). Thus, we compute the crack size distribution , which we discuss in the main text, as well as the crack surface size distribution shown in Fig. S7(a), exhibiting both the same trend. We also compute the distribution of double bonds around the cracks for different , represented in Fig. 3(e) in the main text.
II.7 Network evolution
II.7.1 Surface size distribution
The crack surface area distribution , shown in Fig. S7(a) exhibits the same behaviour as the the crack size distribution represented in Fig. 3 in the main text. Indeed, shows a power-law dependence at large crack sizes with an exponent just before the network fractures for networks with immobile slip, immobile catch and mobile catch bonds. This value is consistent with the random percolation value torquato2002random ; sciortino2005one . In addition, both and evolve in the same way as a function of .
II.7.2 Network evolution at low stress
In Fig. S8 we show at for networks with immobile slip bonds, immobile catch bonds and mobile catch bonds (note that networks with immobile slip bonds do not break at this stress). The distributions look similar to those at higher stress in Fig. 3 in the main text, albeit it that the distributions for catch bonds are even wider at this lower stress.
II.7.3 Double bond distribution
In Fig. S9 we show the distribution of double bonds computed on the crack surface for different for networks with mobile slip and mobile catch bonds. In particular, for mobile slip bonds we can see that the distribution decays faster by increasing , revealing that bonds are less stable due to the high local stress on the crack surface. By contrast, the effect of stress on is smaller for networks with catch bonds. We fit the tail of these distributions by considering . Te inset of Fig. S9 clearly shows that the accumulation of catch bonds is more pronounced than for slip bonds. Thus, crack propagation is hindered more efficiently, postponing the fracture because there is an accumulation of bonds around the cracks.
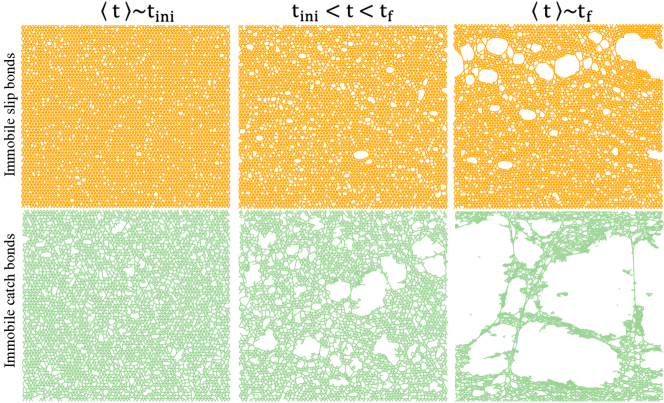
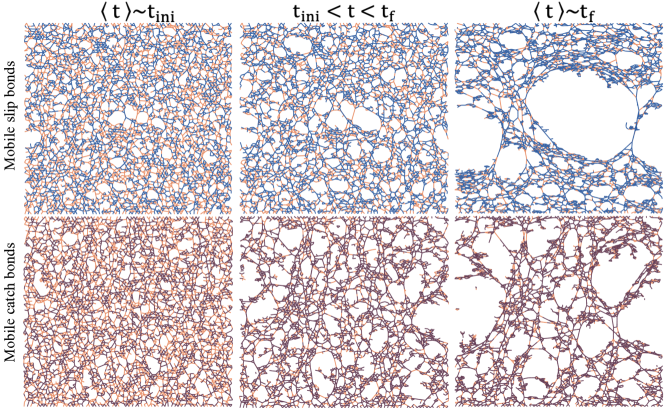
II.7.4 Damage visualization
The evolution discussed by computing at is represented by snapshots taken at different times for networks with immobile bonds in Fig. S10 and for networks with mobile bonds in Fig. S11, where single bonds are shown in orange, and double slip and catch bonds are shown in blue and purple, respectively. Likewise, we also visualize the damage propagation on the network once the fracture has taken place, i.e. .
References
- [1] Paulina J Skrzeszewska, Joris Sprakel, Frits A de Wolf, Remco Fokkink, Martien A Cohen Stuart, and Jasper van der Gucht. Fracture and self-healing in a well-defined self-assembled polymer network. Macromolecules, 43(7):3542–3548, 2010.
- [2] O Lieleg, KM Schmoller, Mireille Maria Anna Elisabeth Claessens, and Andreas R Bausch. Cytoskeletal polymer networks: viscoelastic properties are determined by the microscopic interaction potential of cross-links. Biophysical journal, 96(11):4725–4732, 2009.
- [3] Florian Huber, Adeline Boire, Magdalena Preciado López, and Gijsje H Koenderink. Cytoskeletal crosstalk: when three different personalities team up. Current opinion in cell biology, 32:39–47, 2015.
- [4] Michael Mak. Impact of crosslink heterogeneity on extracellular matrix mechanics and remodeling. Computational and structural biotechnology journal, 18:3969–3976, 2020.
- [5] Koichi Mayumi, Jingyi Guo, Tetsuharu Narita, Chung Yuen Hui, and Costantino Creton. Fracture of dual crosslink gels with permanent and transient crosslinks. Extreme Mechanics Letters, 6:52–59, 2016.
- [6] Christopher L Lewis, Kathleen Stewart, and Mitchell Anthamatten. The influence of hydrogen bonding side-groups on viscoelastic behavior of linear and network polymers. Macromolecules, 47(2):729–740, 2014.
- [7] Kevin J Henderson, Tian C Zhou, Kathryn J Otim, and Kenneth R Shull. Ionically cross-linked triblock copolymer hydrogels with high strength. Macromolecules, 43(14):6193–6201, 2010.
- [8] M. Lemmers, J. Sprakel, I.K. Voets, J. van der Gucht, and M.C. Cohen Stuart. Multiresponsive reversible gels based on charge-driven assembly. Angewandte Chemie, 49:708–711, 2010.
- [9] Hanne M van der Kooij, Simone Dussi, Gea T van de Kerkhof, Raoul AM Frijns, Jasper van der Gucht, and Joris Sprakel. Laser speckle strain imaging reveals the origin of delayed fracture in a soft solid. Science advances, 4(5):eaar1926, 2018.
- [10] Bryan T Marshall, Mian Long, James W Piper, Tadayuki Yago, Rodger P McEver, and Cheng Zhu. Direct observation of catch bonds involving cell-adhesion molecules. Nature, 423(6936):190–193, 2003.
- [11] Zhaowei Liu, Haipei Liu, Andrés M Vera, Rafael C Bernardi, Philip Tinnefeld, and Michael A Nash. High force catch bond mechanism of bacterial adhesion in the human gut. Nature communications, 11(1):1–12, 2020.
- [12] Baoyu Liu, Wei Chen, Brian D Evavold, and Cheng Zhu. Accumulation of dynamic catch bonds between tcr and agonist peptide-mhc triggers t cell signaling. Cell, 157(2):357–368, 2014.
- [13] Vincent C Luca, Byoung Choul Kim, Chenghao Ge, Shinako Kakuda, Di Wu, Mehdi Roein-Peikar, Robert S Haltiwanger, Cheng Zhu, Taekjip Ha, and K Christopher Garcia. Notch-jagged complex structure implicates a catch bond in tuning ligand sensitivity. Science, 355(6331):1320–1324, 2017.
- [14] Wendy E Thomas, Elena Trintchina, Manu Forero, Viola Vogel, and Evgeni V Sokurenko. Bacterial adhesion to target cells enhanced by shear force. Cell, 109(7):913–923, 2002.
- [15] Derek L Huang, Nicolas A Bax, Craig D Buckley, William I Weis, and Alexander R Dunn. Vinculin forms a directionally asymmetric catch bond with f-actin. Science, 357(6352):703–706, 2017.
- [16] Joseph M Laakso, John H Lewis, Henry Shuman, and E Michael Ostap. Myosin i can act as a molecular force sensor. Science, 321(5885):133–136, 2008.
- [17] Norman Y Yao, Chase P Broedersz, Martin Depken, Daniel J Becker, Martin R Pollak, Frederick C MacKintosh, and David A Weitz. Stress-enhanced gelation: A dynamic nonlinearity of elasticity. Physical review letters, 110(1):018103, 2013.
- [18] Yuval Mulla, Mario J Avellaneda, Antoine Roland, Lucia Baldauf, Sander J Tans, and Gijsje H Koenderink. Weak catch bonds make strong networks. bioRxiv, 2020.
- [19] Bryant L Doss, Meng Pan, Mukund Gupta, Gianluca Grenci, René-Marc Mège, Chwee Teck Lim, Michael P Sheetz, Raphaël Voituriez, and Benoît Ladoux. Cell response to substrate rigidity is regulated by active and passive cytoskeletal stress. Proceedings of the National Academy of Sciences, 117(23):12817–12825, 2020.
- [20] Yuval Mulla and Gijsje H Koenderink. Crosslinker mobility weakens transient polymer networks. Physical Review E, 98(6):062503, 2018.
- [21] Richard C Arevalo, Pramukta Kumar, Jeffrey S Urbach, and Daniel L Blair. Stress heterogeneities in sheared type-i collagen networks revealed by boundary stress microscopy. PloS one, 10(3):e0118021, 2015.
- [22] Long Liang, Christopher Jones, Shaohua Chen, Bo Sun, and Yang Jiao. Heterogeneous force network in 3d cellularized collagen networks. Physical biology, 13(6):066001, 2016.
- [23] Jordan L Shivers, Jingchen Feng, Abhinav Sharma, and Fred C MacKintosh. Normal stress anisotropy and marginal stability in athermal elastic networks. Soft Matter, 15(7):1666–1675, 2019.
- [24] José Ruiz-Franco and Jasper van Der Gucht. Force transmission in disordered fibre networks. Frontiers in Cell and Developmental Biology, 10, 2022.
- [25] Leyou Zhang, D Zeb Rocklin, Leonard M Sander, and Xiaoming Mao. Fiber networks below the isostatic point: Fracture without stress concentration. Physical Review Materials, 1(5):052602, 2017.
- [26] Simone Dussi, Justin Tauber, and Jasper Van Der Gucht. Athermal fracture of elastic networks: How rigidity challenges the unavoidable size-induced brittleness. Physical Review Letters, 124(1):018002, 2020.
- [27] Daniel T Gillespie. A general method for numerically simulating the stochastic time evolution of coupled chemical reactions. Journal of computational physics, 22(4):403–434, 1976.
- [28] G. Bell. Models for the specific adhesion of cells to cells,. Science, 200:618, 1978.
- [29] Yuriy V Pereverzev, Oleg V Prezhdo, Manu Forero, Evgeni V Sokurenko, and Wendy E Thomas. The two-pathway model for the catch-slip transition in biological adhesion. Biophysical journal, 89(3):1446–1454, 2005.
- [30] Erik Bitzek, Pekka Koskinen, Franz Gähler, Michael Moseler, and Peter Gumbsch. Structural relaxation made simple. Physical review letters, 97(17):170201, 2006.
- [31] Chase P Broedersz and Frederick MacKintosh. Modeling semiflexible polymer networks. Reviews in modern physics, 86:955, 2016.
- [32] Francesco Sciortino, Piero Tartaglia, and Emanuela Zaccarelli. One-dimensional cluster growth and branching gels in colloidal systems with short-range depletion attraction and screened electrostatic repulsion. The Journal of Physical Chemistry B, 109(46):21942–21953, 2005.
- [33] C.E. Inglis. Stresses in plates due to the presence of cracks and sharp corners. Transactions of the Institute of Naval Architects,, 55:219–241, 1913.
- [34] A. Shekhawat, S. Zapperi, and J.P. Sethna. From damage percolation to crack nucleation through finite size criticality. Physical Review Letters, 110:185505, 2013.
- [35] JJ Gagnepain and C Roques-Carmes. Fractal approach to two-dimensional and three-dimensional surface roughness. wear, 109(1-4):119–126, 1986.
- [36] José Ruiz-Franco, Fabrizio Camerin, Nicoletta Gnan, and Emanuela Zaccarelli. Tuning the rheological behavior of colloidal gels through competing interactions. Physical Review Materials, 4(4):045601, 2020.
- [37] AA Moreira, CLN Oliveira, A Hansen, NAM Araújo, HJ Herrmann, and JS Andrade Jr. Fracturing highly disordered materials. Physical review letters, 109(25):255701, 2012.
- [38] Martijn van Galen, Jasper van der Gucht, and Joris Sprakel. Chemical design model for emergent synthetic catch bonds. Frontiers in Physics, 8, 2020.
- [39] Salvatore Torquato and HW Haslach Jr. Random heterogeneous materials: microstructure and macroscopic properties. Appl. Mech. Rev., 55(4):B62–B63, 2002.