Comparing the Super-Eddington accretion of SMC X-3 and RX J0209.6-7427 with Swift J0243.6+6124
Abstract
We study the giant outbursts of SMC X-3 and RX J0209.6-7427 to compare their super-Eddington accretion regime with that of Swift J0243.6+6124. The high double-peak profile of SMC X-3 is found to be 0.25 phase offset from that below erg s-1, which is similar to Swift J0243 (happened around erg s-1). The profile of RX J0209 shows a similar 0.25 phase offset between high double-peak and low double-peak around erg s-1. The 0.25 phase offset corresponds to a 90 degree angle change of the emission beam and strongly supports for a transition from a fan beam to a pencil beam. Their critical luminosities imply a surface magnetic field G and G for SMC X-3 and RX J0209, respectively, based on the recently measured cyclotron line of Swift J0243. The spin-up rate and luminosity of SMC X-3 follows a relation of , while that of RX J0209 follows , which are similar to Swift J0243 and consistent with the prediction of a radiation-pressure-dominated (RPD) disk. These results indicate that accretion columns are indeed formed above Eddington luminosity, and the population of ULXPs likely corresponds to X-ray pulsars of highest magnetic field.
keywords:
Accretion –pulsars: individual: SMC X-3, RX J0209.6-7427, Swift J0243.6+6124 – X-rays: binaries1 Introduction
The discovery of ultra-luminous X-ray pulsars (ULXPs) revealed the existence of super-Eddington accretion onto magnetized neutron stars with luminosity around erg s-1 (e.g. Bachetti et al., 2014; Frst et al., 2016; Israel et al., 2017a, b; Carpano et al., 2018). At such a high luminosity, an accretion column will be formed below a radiation shock around the magnetic pole. The accretion disk is most likely geometrically thick, and an outflow driven by the strong radiation field is expected (Shakura & Sunyaev, 1973). The process of super-Eddington accretion is relatively poorly studied compared with the sub-Eddington accretion, due to the rareness of targets and limited availability of good data since most ULXPs are located in other galaxies (for a recent review on the topic, please refer to Fabrika et al., 2021; Mushtukov & Tsygankov, 2022).
The discovery of the Galactic ULXP of Swift J0243.6+6124 (J0243 hereafter) during its 2017 giant outburst, which reached a luminosity above erg s-1, has enabled a detailed study of super-Eddington process around its outburst peak(e.g. Tsygankov et al., 2018; Wilson-Hodge et al., 2018; Tao et al., 2019; Zhang et al., 2019; Doroshenko et al., 2020). The detailed temporal study (Liu et al., 2022) showed that the formation of accretion column was evidenced by a 0.25 phase offset, between the double-peak profiles at luminosities below erg s-1 and above erg s-1. The 0.25 phase offset corresponds to a 90 degree angle change of the emission beam, which is just the transition angle between a pencil beam and a fan beam. The luminosity range within erg s-1 corresponds to an intermediate formation stage of accretion column from appearance to fully dominating the emission beam.
| parameters | This work | GBM teama | This work | GBM teama |
|---|---|---|---|---|
| SMC X-3 | SMC X-3 | RX J0209 | RX J0209 | |
| Orbital period (days) | 45.383 | 47.4 | ||
| Time of periastron (MJD) | 57677 | 58782.56 | ||
| asin (light-sec) | 196.2 | 169.8 | ||
| Long. of periastron (deg) | 208.77 | 65.7 | ||
| eccentricity | 0.22 | 0.32 | ||
| - | - |
-
a https://gammaray.msfc.nasa.gov/gbm/science/pulsars
A detailed model of radiation-pressure-dominated (RPD) disk (Chashkina et al., 2017, 2019) indicated that an increasing accretion rate leads to an increased disk thickness, and the pressure balance can be satisfied at a similar radius for different accretion rate. As a result, the magnetosphere size of a RPD disk is almost independent on the mass accretion rate and a linear-like relation of is expected. Indeed, the spin-up rate of Swift J0243 due to accreted material is found to be linearly correlated with luminosity within erg s-1 (Liu et al., 2022). However, above erg s-1, the relation of Swift J0243 becomes flattened, coincident with a flattening of spectral hardness and a saturation of the faint peak of the pulse profile. These anomalous behaviors above erg s-1 could be related with a geometry change of accretion disk due to the illumination by the strong radiation of accretion column (Liu et al., 2022). We note that the luminosity of Swift J0243 mentioned above would be reduced by a factor of 0.6 if adopting a distance of 5.2 kpc measured from Gaia data 3 (see §4).
It is interesting to check the temporal behavior of other ULXP to see whether the behavior of Swift J0243 is a general feature of super-Eddington process. In this paper, we study the two ULXPs around Small Magellanic Cloud, SMC X-3 and RX J0209.6-7427 (hereafter J0209), the giant outbursts of which reached a peak luminosity around erg s-1, and they are close enough to allow detailed studies.
The 2016 giant outburst of SMC X-3 was initially reported by MAXI on August 8, 2016 (MJD 57609) (Negoro et al., 2016) and was identified by Swift/XRT (Kennea et al., 2016). It was regularly monitored by Swift/XRT, the data of which had been reported in the literature (Weng et al., 2017; Townsend et al., 2017; Tsygankov et al., 2017). Two NuSTAR observations and one XMM-Newton observation were also performed for SMC X-3 during the outburst (Tsygankov et al., 2017; Zhao et al., 2018; Koliopanos & Vasilopoulos, 2018). The 2019 giant outburst of RX J0209 was detected by MAXI on November 20, 2019 (MJD 58807) (Negoro et al., 2019) and was localized by Swift/XRT (Kennea et al., 2019), and it was regularly monitored by Nicer (Iwakiri et al., 2019; Vasilopoulos et al., 2020). It was also observed once by NuSTAR during the rising stage and several times by Astrosat (Chandra et al., 2020) and Insight-HXMT (Hou et al., 2022) during the peak stage. A distance of 62 kpc and 55 kpc is adopted for SMC X-3 and RX J0209, respectively.
2 Light curves and orbital parameters
2.1 SMC X-3
The binary orbital motion of SMC X-3 has an apparent effect on the observed spin frequency and has to be taken into account to obtain the intrinsic spin frequency. A classical relation of accreting torque of was generally assumed when fitting the orbital solution. Townsend et al. (2017) had found that such a relation can not provide a reasonable fit to the observed spin frequency of SMC X-3. They noted that if the super-Eddington part of the giant outburst is excluded, a much improved fit is resulted. If the super-Eddington accretion of the giant outburst of SMC X-3 is similar to that of Swift J0243, a linear-like relation of is expected during the peak period, and the general usage of relation would be improper.
On the other hand, Townsend et al. (2017) used the luminosity only within the XRT band (0.5-10 keV), and Tsygankov et al. (2017) noted that if correcting the 0.5-10 keV luminosity with a bolometric factor, they could obtain a much better fit. Therefore, to obtain a reasonable fitting of the orbital parameters, a bolometric luminosity and a limited time range of the giant outburst period should be used, since the relation is expected to change at different accretion luminosity.
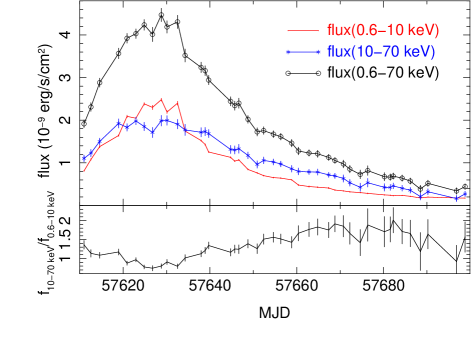
Tsygankov et al. (2017) estimated the bolometric correction of SMC X-3 based on the flux ratio in the 0.5-10 keV (Swift/XRT) plus 15-50 keV (Swift/BAT) bands to that in the 0.5-10 keV band, which is scaled to match two NuSTAR observations (on MJD 57613 and 57704). We note that when converting the Swift/BAT rate to flux, they adopted a default converting factor suitable only for a power-law model with index of (for Crab, Krimm et al., 2013), which is quite different from the index of SMC X-3 (). So we estimate a broadband flux as the sum of the flux in 0.6-10 keV and in 10-70 keV bands. To estimate the unabsorbed flux in 0.6-10 keV, we fit the XRT spectrum with a model of power-law plus black-body subjecting to a fixed absorption column of cm-2 (Zhao et al., 2018) and infer the unabsorbed flux by setting the model absorption to zero.
To estimate the flux in 10-70 keV band, we convert the BAT 15-50 keV rate to 10-70 keV flux based on NuSTAR spectra. The NuSTAR flux on MJD 57613 is erg cm-2 s-1 within 10-70 keV band, while the BAT rate at this time is about 0.0149 counts cm-2 s-1 () estimated from a two-days-binned BAT light curve. So a converting factor of erg/counts is resulted. This is 1.65 times larger than the default converting factor mentioned above ( erg/counts). For the second NuSTAR observation on MJD 57705, the NuSTAR flux and BAT rate are erg cm-2 s-1 and 0.0026 counts cm-2 s-1 (), respectively, and a factor of erg/counts is resulted. As the rate is relatively low on MJD 57705, we adopt the factor of erg/counts to convert the BAT rate to the flux within 10-70 keV.
The obtained bolometric fluxes, together with those in 0.6-10 keV (XRT) and 10-70 keV (BAT) bands and their ratio, are plotted in Figure 1. The soft band fluxes are a little higher than those in the hard band during the outburst peak between MJD 57620 and 57633, while during other time, the soft band fluxes were lower than the hard band fluxes. This reflects the softening of the spectrum near the outburst peak. The hard-to-soft ratio reached a level of 2 around MJD 57670-57680.
The spin frequencies of SMC X-3 had been measured with both Fermi/GBM and Swift/XRT data. In principle, the GBM measurements are more accurate as the GBM daily coverage is longer than those for Swift/XRT, which generally has only a few snapshots for one observation. Nevertheless, the XRT spin measurements are helpful supplement because the regular GBM measurements only extended to MJD 57673. To measure the spin frequencies from barycenter-corrected XRT light curve, we first estimate a spin period for one XRT observation with epoch folding method, and then we employ a phase connection between the snapshots to obtain a more accurate estimation.
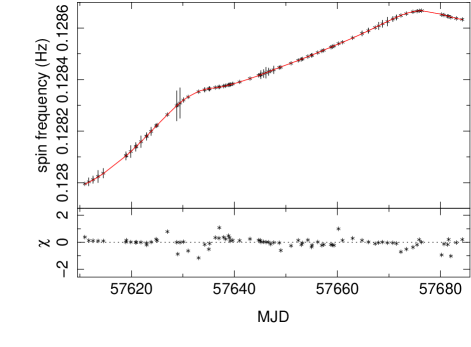
To fit the orbital parameters, we adopt a torque model of . We use both the GBM and XRT barycenter-corrected spin frequency measurements. For the GBM data, we neglected those data before MJD 57616, which showed some fluctuations. We limit the fitting time range to MJD 57610-57685, which includes the outburst peak and two turn-over of measured spin frequencies. The fitting is performed for frequency vs time with as input. The fitted results are listed in Table 1 and plotted in Figure 2. In general, the fitted orbital parameters are consistent with those reported in previous studies. Compared with that obtained by Fermi/GBM pulsar team, the most different parameter is the eccentricity: we got , while their value is 0.22. An eccentricity of is also obtained by Weng et al. (2017), who used a high-order polynomial to follow the evolution of the intrinsic spin instead of a torque model. We note that a different will change the intrinsic apparently near periastron. The fitted index of is larger than the standard index of 6/7, similar as Swift J0243.
2.2 RX J0209
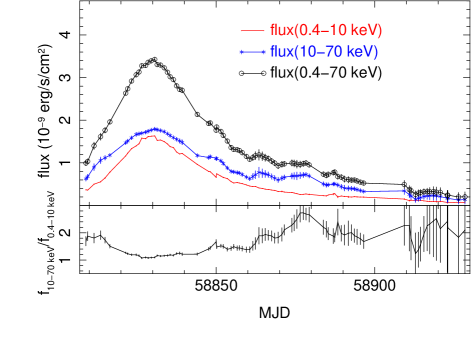
We did a similar fitting to the observed spin frequencies of RX J0209 measured with Nicer data (Hou et al., 2022). The NuSTAR observation of RX J0209 on MJD 58813 provides a conversion factor (BAT rate to flux) erg/counts for a BAT rate of counts cm-2 s-1. The HXMT observations near the outburst peak around MJD 58828 provides erg/counts for a BAT rate of counts cm-2 s-1. The differences of and reflect the spectral softening above 10 keV at higher fluxes, which was also found for Swift J0243. So we adopt a conversion factor linearly interpolated over BAT rate : . As the public BAT light curve of RX J0209 only started after MJD 58818, we use a BAT light curve kindly produced by Amy Lien. We note that the bolometric correction is different from that in Hou et al. (2022), who did not use the BAT light curve. To estimate the Nicer fluxes, we used the nibackgen3C50 tool to extract background and source spectra. The corresponding light curves are plotted in the right panel of Figure 1. The 0.4-10 keV fluxes of RX J0209 do not exceed the level of the 10-70 keV fluxes even during the outburst peak.
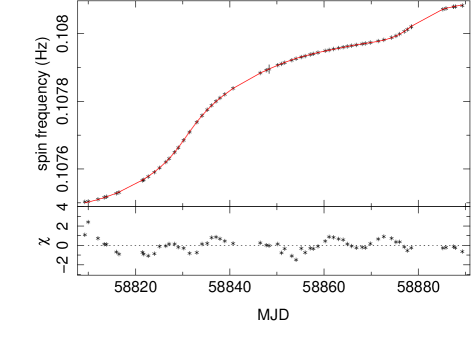
The fitting time range for RX J0209 is limited to MJD 58808-58890. The fitting results are presented in the right panel of Figure 2 and listed in Table 1. Compared with the orbital parameters by Fermi/GBM pulsar team, we obtain a smaller asin and also a larger eccentricity, similar to that of SMC X-3. The fitted torque model index of is also larger than the standard value of 6/7.
3 Evolution of the pulse profile
3.1 SMC X-3
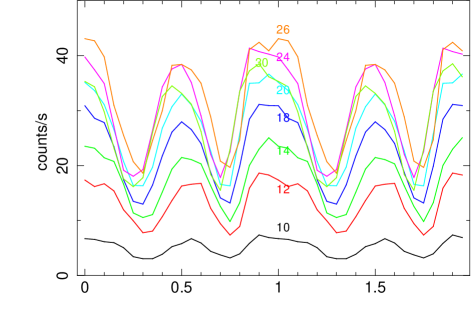
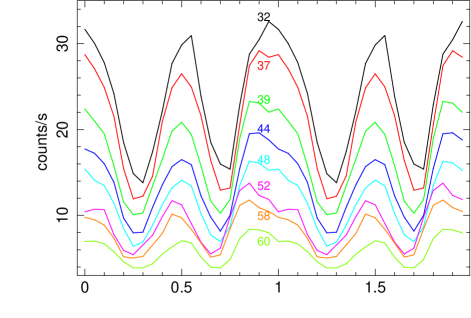
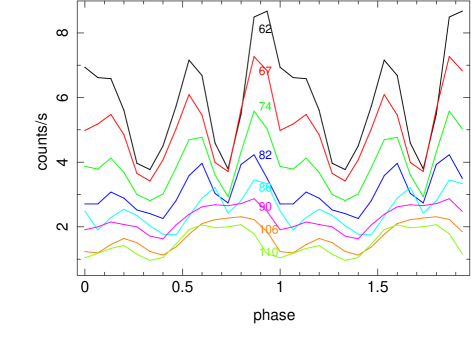
The XRT pulse profiles of SMC X-3 had been presented in Weng et al. (2017), in a normalized sense, which is not sensitive to the growth/decline detail of the absolute fluxes. Here we present a phase-coherent XRT profile study, as did for Swift J0243 in Liu et al. (2022). We assign a pulse phase to the event time as , where is the pulse frequency interpolated from measurements using a cubic spline function. The event arrival time is barycenter corrected and binary corrected with the orbital parameters obtained in previous section. The GBM-measured spin frequencies showed some fluctuations before MJD 57616, so we use the GBM-measured spin frequencies within MJD 57616-57673 and XRT-measured values in other time. On MJD 57618, 57634, 57664, and 57667, the obtained pulse profiles show apparent phase offsets, and we modify the measured spin frequencies a little bit around these times to make the profiles aligned. The resulted pulse profiles within 0.6-10 keV are plotted in Figure 3.
As can be seen, during the peak period of the outburst, the profiles are dominated by two peaks around phase 1 and 0.5. After MJD 57652 (the second panel), the main peak becomes more left-tilted, and the phase separation between the two peaks is about 0.35. Around MJD 57667 (the third panel), a minor peak appeared about 0.25 phase right to the main peak. Around MJD 57680-57682, the phase separation of the original two peaks reduced to about 0.25. Finally, around MJD 57690, the original two peaks merged together and became a broad bump around phase 0.7, and the profiles looked double-peaked again. Note that the two low peaks after MJD 57690 are about 0.25 phase offset from those during the outburst peak period, a phenomena just as that for Swift J0243.
Taken the high double peaks as from a fan beam, the low double peaks would be from a pencil beam. The transition of the fan beam to the pencil beam, that is, the disappearance of accretion column, happened around MJD 57686-57690, when the two peaks of the fan beam merged into one. The corresponding luminosity is around erg s-1. The high double peaks (the fan beam) take their full shape before MJD 57662, corresponding to a luminosity of erg s-1. In between, the fan beam gradually changes to the pencil beam.
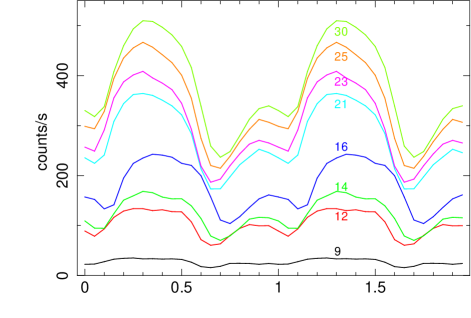
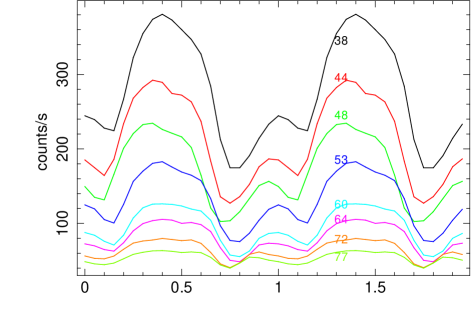
3.2 RX J0209
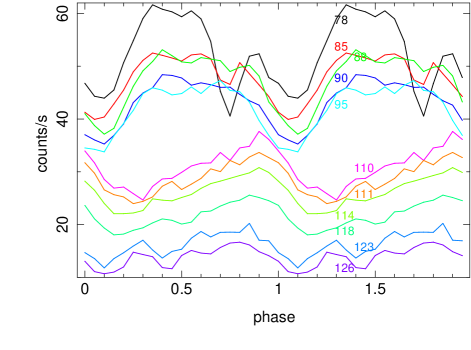
The corresponding Nicer pulse profiles within 0.4-10 keV of RX J0209 are presented in the right panels of Figure 3. (The Nicer profile of RX J0209 was studied in a normalized sense in Hou et al. (2022).) During the outburst peak, the profiles are also composed of two peaks, although the minor peak is relatively fainter compared with the main peak. Around MJD 58871-58872 (the second panel), the previous left-tilted main peak becomes more symmetric, and the minor peak becomes more left-titled. Around MJD 58885-58888, the minor peak merged with the main peak and the profile became a broad bump.
Due to the lack of data within MJD 58896-58909, we can not align well the pulse profiles after MJD 58909 to those before MJD 58896. Nevertheless, it is clear that the broad bump on MJD 58895 evolved to an right-tilted peak around MJD 58910. A likely evolution path is that the intensity of the left part of the bump (the main peak of the high double peak) decreased, and that produced a right-tilted peak, if assuming the valley phase of the profile is not changed much within MJD 58896-58909. This would make the peak on MJD 58910 located near the valley of the high double peak. The profiles show two peaks again after MJD 58923. We note that there seems already a feature of minor peak around MJD 58911-58918, although not as apparent as those after MJD 58923. Thus, we can see that the high double peaks changed to one bump around MJD 58888, and then changed to low double peaks after MJD 58911, which is also likely 0.25 phase offset from the high double peaks. The corresponding critical luminosity (around MJD 58911-58918) is about erg s-1.
4 The - relation
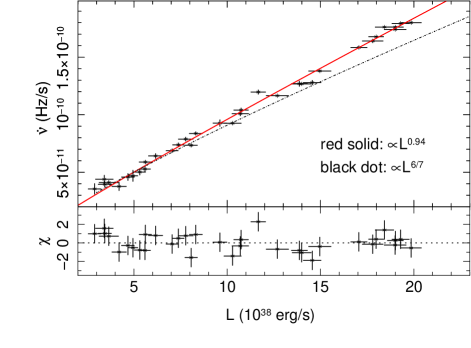
For the super-Eddington regime of Swift J0243, we found a linear relation of within erg s-1. A linear-like - relation is also implied during the fitting process of the orbital parameters of SMC X-3 and RX J0209. To obtain the - relation of SMC X-3, we convert the GBM measured spin frequencies with the fitted orbital parameters listed in Table 1. We calculate an averaged bolometric fluxes between two successive XRT observations, and calculate at the intermediate times. The calculated spin-up rate against the bolometric flux is plotted in Figure 4. The data is limited to MJD 57681, beyond which the high two peaks started to merge together and the inferred showed larger fluctuations.
The - relation of SMC X-3 can be fitted with a power-law model of , consistent with that obtained during the fitting process of the orbital parameters. On the other hand, the relation of Swift J0243 shows a flattening at the highest luminosity. The relation of SMC X-3 shows no such a flattening.
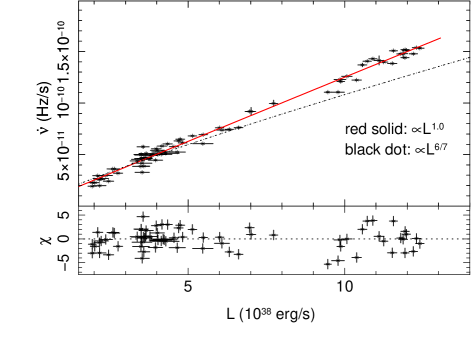
The - relation of RX J0209 is presented in the right panel of Figure 4. It can be fitted with a power-law model of . The maximum luminosity of RX J0209 is about erg s-1, about half of that of SMC X-3.
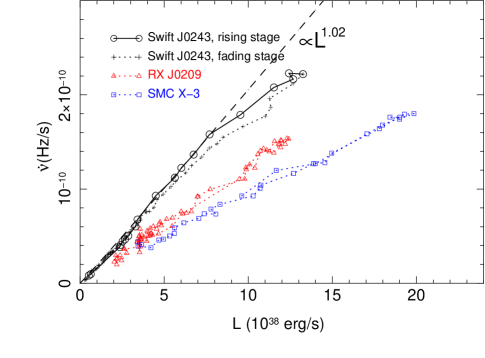
To compare the - relation for all three sources, the observed - data for Swift J0243, SMC X-3, and RX J0209 are plotted together in Figure 5. The luminosity of Swift J0243 is within 0.5-150 keV band, a little broader than the 70 keV limit for SMC X-3 and RX J0209. We note that the previous estimation of the luminosity of Swift J0243 assumed a distance of 6.8 kpc from Gaia data release 2 (Bailer-Jones et al., 2018), while the Gaia early data release 3 provided a distance of 5.2 kpc for Swift J0243 (Bailer-Jones et al., 2021). If taking this new distance, the luminosity of Swift J0243 would be 0.6 times smaller than previous estimation. We have applied this reduction of the luminosity of Swift J0243 in Figure 5. (If not applying this reduction, the data points of Swift J0243 will locate among those of RX J0209.) As can be seen, the data points of SMC X-3 are lying below those of RX J0209, which are below those of Swift J0243. That is, for a given observed luminosity, the spin-up rate of the neutron star of Swift J0243 is higher than that of SMC X-3 and RX J0209.
5 Discussion and conclusion
We analyzed the 2016 giant outburst of SMC X-3 and 2019 giant outburst of RX J0209, with the aim to compare their super-Eddington accretion regime with that of Swift J0243 in 2017. To find the orbital parameters of SMC X-3 and RX J0209, we estimated their bolometric fluxes based on Swift/BAT fluxes in 15-50 keV and Swift/XRT and Nicer fluxes below 10 keV. We have limited the fitting time range of observed spin frequencies to the outburst period, as the accretion torque is dependent on the accretion luminosity. The high double-peak profile of SMC X-3 is found to be 0.25 phase offset from that below erg s-1. The profile of RX J0243 shows a similar high double-peak to low double-peak transition around erg s-1, although the profile phase at low luminosity is not well aligned. These pulse profile behaviors are just the same as that for Swift J0243, the high double peak of which showed a 0.25 phase offset from that below erg s-1, if assuming a distance of 5.2 kpc for Swift J0243.
In the standard accretion scenario of magnetized neutron star (e.g. Gnedin & Sunyaev, 1973; Davidson, 1973; Basko & Sunyaev, 1976), at low accretion rates, X-ray radiation is emitted in a pencil beam along the magnetic pole; above a critical luminosity, an accretion column formed below a radiation-dominated shock, and X-ray photons are emitted mainly from the sidewall of the column in a fan beam. The angle difference betwwen a pencil beam and a fan beam is 90 degree. Therefore, the 0.25 phase offset between the high and low double-peak profiles, which corresponds to a 90 degree change of the emission beam, is a strong evidence for a transition from a high fan beam to a low pencil beam and for the existence of accretion column during the high double-peak regime. The critical luminosity depends on the accretion geometry and the magnetic field. Above erg/s, the critical luminosity grows with the magnetic field because of the drop of the effective cross-section below the cyclotron energy. It roughly increases linearly with the filed strength (Mushtukov et al., 2015; Becker et al., 2012). Recently, a measurement of cyclotron line around 130 keV was reported during the main pulse at the outburst peak of Swift J0243 with HXMT observations, which corresponds to a surface field above G (Kong et al., 2022). Taken it as the face value and a distance of 5.2 kpc for Swift J0243, the surface magnetic field strength of SMC X-3 and RX J0209 would be around and G, respectively.
Above the profile transition (critical) luminosity, the profiles are not dominated by the fan beam immediately, but there is an intermediate stage for the fan beam to grow up and to dominate the emission pattern. During this intermediate stage, the profile could look like one-peaked (Swift J0243), broad-bump (RX J0243), or three-peaked (SMC X-3) shape. Such intermediate profile shapes would depend on our viewing angle towards the emission beam and the bending of light near the neutron star, and may also depend on the magnetic field. Detailed investigations are needed to see what kind of constraints these intermediate profiles may provide. In principle, the pulse profile could also be affected by the growth of accretion column, and a sudden change may be expected when the column exceeds a height and the column can not be eclipsed by the neutron star anymore (Mushtukov et al., 2018). Nevertheless, the predicted dip structure of the eclipse is not observed for both SMC X-3 and RX J0209, and there also seems no a characteristic 0.25 phase offset that was expected by a sudden appearance of eclipsed column.
The observed relation of SMC X-3 follows as , while that of RX J0209 follows as . Such a relation is similar to that of Swift J0243 within erg s-1. In the RPD regime as modeled by Chashkina et al. (2019, 2017), the magnetosphere radius is almost independent of the accretion rate. As a result, a linear-like relation of is predicted, which is consistent with the observed relation. Note that a larger magnetosphere radius is expected for a stronger field: in the model of Chashkina et al. (2019). If this is true, one would expect a larger at similar luminosity (, neglecting the braking torque) for a stronger magnetic field. In contrast, the observed of SMC X-3, with the highest critical luminosity (magnetic field), lies below those of Swift J0243 and RX J0209.
One possibility is that the dipole component of SMC X-3 is much weaker than the multi-pole component in the vicinity of the neutron star, as proposed by Tsygankov et al. (2017). Such an idea has also been proposed for other ULXPs (Israel et al., 2017a, b), and also for Swift J0243 (Kong et al., 2022) and RX J0209 (Hou et al., 2022). If this is true, SMC X-3 would have the largest multi-pole field, but with a smallest accretion torque among all three sources. We note that a multipolar magnetic structure might increase the accreting area of the neutron star and affect the critical luminosity as discussed recently for Her X-1 (Mnkknen et al., 2022).
On the other hand, we noted that the co-rotation radius of SMC X-3 is about cm, which is comparable with the predicted magnetosphere radius ( cm) of a source with a magnetic moment G cm3 around erg s-1 (Chashkina et al., 2019) (their Figure 13). If we take the braking torque as on the order of (e.g. Lipunov, 1992), it is indeed similar to the accreting torque with a luminosity of erg s-1. Thus, one needs to take into account the braking torque in the situation of SMC X-3. Chashkina et al. (2019) has assumed that the disk-magnetosphere interaction is confined to a narrow region near the inner radius of the disk. Adopting a wide interaction/threading region might modify the prediction of a RPD disk, and further modelling is needed to check whether a smaller torque would be resulted for accretion through a RPD disk with a strong dipolar field.
Above erg s-1 (with a distance of 5.2 kpc), the minor peak of Swift J0243 showed a reduced intensity compared with the main peak, and the relation becomes flattened (Liu et al., 2022). The peak luminosity of RX J0209 reached a level of erg s-1, while that of SMC X-3 reached erg s-1. It is interesting to see that neither flattening of relation, nor the reduction of faint peak were observed for SMC X-3 and RX J0209. On the one hand, this is consistent with the assumption that these two phenomena of Swift J0243 are connected somehow, like through irradiation of the accretion disk by the accretion column (Liu et al., 2022). On the other hand, it indicates no apparent irradiation (feedback) from the accretion column of SMC X-3 at its highest luminosity. In principle, the irradiation of the disk depends on the geometry of the accretion column relative to the accretion disk, which is hardly constrained. If taking , the magnetosphere radius of SMC X-3 during the RPD regime is estimated to be about 1.5 times larger than that of Swift J0243. This will make the irradiation flux per unit area on the inner region of the disk relatively fainter for SMC X-3, reduced by a factor . If the disk and column configuration of SMC X-3 is similar to that of Swift J0243, one would expect some changing of the pulse profile and relation above erg s-1, which is just reached by the peak luminosity of SMC X-3. It seems a luminosity higher than erg s-1 is needed to probe the irradiation effect in SMC X-3. While for RX J0209, a luminosity higher than erg s-1 is needed.
We note that there are some uncertainties not accounted for when estimating the observed relation. For example, we have included all the soft band fluxes when calculating the bolometric luminosity. In reality, part of the soft emission could come from the accretion disk (although the fraction should be small as the disk is truncated far away), and one may only use the luminosity from the accretion column to estimate mass accretion rate. This would likely make the index of relation a little larger. For sources of relatively lower luminosity (below erg s-1), indexes of relation around 1 had been reported in the literature (e.g. Bildsten et al., 1997; Filippova et al., 2017). If this is true, it would be interesting to compare the origin of linear-like relation below and above Eddington luminosity. We noted that the bolometric correction is critical to estimate the index, and a broadband spectroscopy is necessary to check and calibrate the correction. The intense broadband monitoring of Galactic X-ray pulsars by HXMT provides a chance to study these less-luminous sources, and we plan to study them in a future work.
In summary, the high double peaks of SMC X-3 are found to be 0.25 phase offset from the low double peaks, just as that for Swift J0243, and It seems also the case for RX J0209. These results support for the formation of an accretion column during the high luminosity state in these three sources. Among them, SMC X-3 has a highest critical luminosity around erg s-1, which leads to an estimation of a highest magnetic field G. Such a high magnetic field is strong enough to support electron-position annihilation and may produce a neutrino pulsar (Mushtukov et al., 2019). These results indicate that the population of ULXPs likely corresponds to X-ray pulsars of highest magnetic field. The relation of all three sources follows a linear-like relation, consistent with accretion through a RPD disk. Among all sources, only Swift J0243 showed a flattening of relation and reduction of the faint peak at the highest luminosity. Nevertheless, it does not mean these anomalous behaviors are unique to Swift J0243, because the peak luminosity of SMC X-3 and RX J0209 may be not high enough to probe this behavior. One should be cautionary when dealing with the relation of ULXPs.
Acknowledgements
We thank our referee for helpful comments, Amy Lien for help of producing a BAT light curve of RX J0209. This work made use of data from Swift, Fermi, Nicer, and HXMT . We acknowledge the support by National Natural Science Foundation of China (U1938113, U1938103, U2038103, 11733009, 12173103 and U2038101), and the Scholar Program of Beijing Academy of Science and Technology (DZ BS202002).
Data Availability
The data underlying this article are publicly available at https://swift.gsfc.nasa.gov/, https://heasarc.gsfc.nasa.gov/docs/nicer/index.html, and http://archive.hxmt.cn/.
References
- Bachetti et al. (2014) Bachetti, M.; Harrison, F. A.; Walton, D. J. et al. 2014, Nature, 514, 202
- Bailer-Jones et al. (2018) Bailer-Jones, C. A. L.; Rybizki, J.; Fouesneau, M.; Mantelet, G.; Andrae, R. 2018, AJ, 156, 58
- Bailer-Jones et al. (2021) Bailer-Jones, C. A. L.; Rybizki, J.; Fouesneau, M.; Demleitner, M.; Andrae, R. 2021, AJ, 161, 147
- Basko & Sunyaev (1976) Basko, M. M. & Sunyaev, R. A. 1976, MNRAS, 175, 395
- Becker et al. (2012) Becker, P. A. et al. 2012, A&A, 544, 123
- Bildsten et al. (1997) Bildsten, L. et al. 1997, ApJS, 113 367
- Carpano et al. (2018) Carpano, S.; Haberl, F.; Maitra, C.; Vasilopoulos, G., 2018, MNRAS, 476, L45
- Chashkina et al. (2017) Chashkina, A.; Abolmasov, P.; Poutanen, J. 2017, MNRAS, 470, 2799
- Chashkina et al. (2019) Chashkina, A.; Lipunova, G.; Abolmasov, P.; Poutanen, J. 2019, A&A, 626, 18
- Chandra et al. (2020) Chandra, A. D.; Roy, J.; Agrawal, P. C.; Choudhury, M. 2020, MNRAS, 495, 2664
- Davidson (1973) Davidson, K. 1973, NPhS, 246, 1
- Doroshenko et al. (2020) Doroshenko, V.;Zhang, S. N.; Santangelo, A. et al. 2020, MNRAS, 491, 1857
- Fabrika et al. (2021) Fabrika, S. N.; Atapin, K. E.; Vinokurov, A. S.; Sholukhova, O. N. 2021, Astrophysical Bulletin, 76, 6
- Filippova et al. (2017) Filippova, E. V.; Mereminskiy, I. A.; Lutovinov, A. A.; Molkov, S. V.; Tsygankov, S. S. 2017, AstL, 43, 706
- Frst et al. (2016) Frst, F.; Walton, D. J.; Harrison, F. A. et al. 2016, ApJ, 831, L14
- Ghosh & Lamb (1979) Ghosh, P. & Lamb, F. K. 1979, ApJ, 234, 296
- Gnedin & Sunyaev (1973) Gnedin, Y. N. & Sunyaev, R. A. 1973, A&A, 25, 233
- Hou et al. (2022) Hou, X.; Ge, M. Y.; Ji, L.; Zhang, S. N.; You, Y.; Tao, L.; Zhang, S.; Soria, R.; Feng, H.; Zhou, M.; Tuo, Y. L.; Song, L. M.; Wang, J. C., 2022, arXiv:2208.14785
- Iwakiri et al. (2019) Iwakiri, W.; Wolff, M. T.; Vasilopoulos, G.; Gendreau, K.; Arzoumanian, Z.; Markwardt, C.; Strohmayer, T. E.; Ray, P. S. 2019, The Astronomer’s Telegram, No. 13309
- Israel et al. (2017a) Israel, G. L.; Belfiore, A.; Stella, L. et al., 2017, Sci, 355, 817
- Israel et al. (2017b) Israel, G. L.; Papitto, A.; Esposito, P. et al., 2017, MNRAS, 466, L48
- Kennea et al. (2016) Kennea, J. A.; Coe, M. J.; Evans, P. A.; Beardmore, A. P.; Krimm, H. A.; Romano, P.; Yamaoka, K.; Serino, M.; Negoro,H., 2016, Astronomer’s Telegram, No. 9362
- Kennea et al. (2019) Kennea, J. A.; Bahramian, A.; Evans, P. A.; Beardmore, A. P.; Krimm, H. A.; Romano, P.; Yamaoka, K.; Serino, M.; Negoro, H. 2019, Astronomer’s Telegram, No. 13303
- Koliopanos & Vasilopoulos (2018) Koliopanos, F. & Vasilopoulos, G. 2018, A&A, 614, 23
- Kong et al. (2020) Kong, L. D.; Zhang, S.; Chen, Y. P. et al. 2020, ApJ, 902, 18
- Kong et al. (2022) Kong, L. D.; Zhang, S.; Zhang, S. N.; Ji, L.; Doroshenko, V.; Santangelo, A.; Chen, Y. P.; Lu, F. J. et al. 2022, ApJ, 933, L3
- Krimm et al. (2013) Krimm, H. A. et al. 2013, ApJS, 209, 14
- Lyubarskii & Sunyaev (1988) Lyubarskii, Y. E.; Syunyaev, R. A. 1988, SvAL, 14, 390
- Liu et al. (2022) Liu, J.; Jenke, P. A.; Ji, L.; Zhang, S.-N.; Zhang, S.; Ge, M.; Liao, J.; Li, X.; Song, L. 2022, MNRAS, 512, 5686
- Lipunov (1992) Lipunov, V. M. 1992, Astrophysics of neutron stars, Springer-Verlag
- Mnkknen et al. (2022) Mnkknen, J.; Tsygankov, S. S.; Mushtukov, A. A.; Doroshenko, V.; Suleimanov, V. F.; Poutanen, J. 2022, MNRAS, 515, 571
- Mushtukov & Tsygankov (2022) Mushtukov, A. & Tsygankov, S. 2022, Handbook of X-ray and Gamma-ray Astrophysics, Eds. C. Bambi and A. Santangelo, Springer Singapore, arXiv:2204.14185
- Mushtukov et al. (2021) Mushtukov, A. A.; Portegies Zwart, S.; Tsygankov, S. S.; Nagirner, D. I.; Poutanen, J. 2021, MNRAS, 501, 2424
- Mushtukov et al. (2019) Mushtukov, A. A.; Ingram, A.; Middleton, M.; Nagirner, D. I.; van der Klis, M., 2019, MNRAS, 484, 687
- Mushtukov et al. (2018) Mushtukov, A. A.; Verhagen, P. A.; Tsygankov, S. S.; van der Klis, M.; Lutovinov, A. A.; Larchenkova, T. I. 2018, MNRAS, 474, 5425
- Mushtukov et al. (2015) Mushtukov, A. A.; Suleimanov, V. F.; Tsygankov, S. S.; Poutanen, J. 2015, MNRAS, 447, 1847
- Negoro et al. (2016) Negoro, H.; Nakajima, M.; Kawai, N.; Ueno, S.; Tomida, H.; Nakahira, S.; Ishikawa, M.; Sugawara, Y. et al., 2016, Astronomer’s Telegram, No. 9348
- Negoro et al. (2019) Negoro, H.; Kawai, N.; Mihara, T.; Nakajima, M.; Maruyama, W.; Aoki, M.; Kobayashi, K.; Takagi, R. et al. 2019, Astronomer’s Telegram, No. 13300
- Rappaport & Joss (1977) Rappaport, S. & Joss, P. C. 1977, Nature, 266, 683
- Tsygankov et al. (2018) Tsygankov, S. S.; Doroshenko, V.; Mushtukov, A. A.; Lutovinov, A. A.; Poutanen, J. 2018, MNRAS, 479, L134
- Tsygankov et al. (2017) Tsygankov, S. S.; Doroshenko, V.; Lutovinov, A. A.; Mushtukov, A. A.; Poutanen, J. 2017, A&A…605A..39T
- Tao et al. (2019) Tao, L.; Feng, H.; Zhang, S.; Bu, Q.; Zhang, S.; Qu, J.; Zhang, Y. 2019, ApJ, 873, 19
- Townsend et al. (2017) Townsend, L. J.; Kennea, J. A.; Coe, M. J.; McBride, V. A.; Buckley, D. A. H.; Evans, P. A.; Udalski, A. 2017, MNRAS, 471, 3878
- Shakura & Sunyaev (1973) Shakura, N. I. & Sunyaev, R. A. 1973, A&A, 24, 337
- Sugizaki et al. (2020) Sugizaki, M.; Oeda, M.; Kawai, N. et al. 2020, ApJ, 896, 124
- Vasilopoulos et al. (2020) Vasilopoulos, G.; Ray, P. S.; Gendreau, K. C.; Jenke, P. A.; Jaisawal, G. K.; Wilson-Hodge, C. A.; Strohmayer, T. E.; Altamirano, D.; Iwakiri, W. B.; Wolff, M. T.; Guillot, S.; Malacaria, C.; Stevens, A. L. 2020, MNRAS, 494, 5350
- Wang et al. (2020) Wang, P. J.; Kong, L. D.; Zhang, S. et al. 2020, MNRAS, 497, 5498
- Wang et al. (2022) Wang, P. J.; Kong, L. D.; Zhang, S. et al. 2022, …
- Weng et al. (2017) Weng, S.-S.; Ge, M.-Y.; Zhao, H.-H.; Wang, W.; Zhang, S.-N.; Bian, W.-H.; Yuan, Q.-R. 2017,ApJ, 843, 69
- Wilson-Hodge et al. (2018) Wilson-Hodge, C. A.; Malacaria, C.; Jenke, P. A. et al. 2018, ApJ, 863, 9
- Zhang et al. (2019) Zhang, Y.; Ge, M.; Song, L. et al. 2019, ApJ, 879, 61
- Zhao et al. (2018) Zhao, H. H.; Weng, S. S.; Ge, M. Y.; Bian, W. H.; Yuan, Q. R., 2018, Ap&SS, 363, 21