Segmentation-based Information Extraction and Amalgamation in Fundus Images for Glaucoma Detection
Abstract
Glaucoma is a severe blinding disease, for which automatic detection methods are urgently needed to alleviate the scarcity of ophthalmologists. Many works have proposed to employ deep learning methods that involve the segmentation of optic disc and cup for glaucoma detection, in which the segmentation process is often considered merely as an upstream sub-task. The relationship between fundus images and segmentation masks in terms of joint decision-making in glaucoma assessment is rarely explored. We propose a novel segmentation-based information extraction and amalgamation method for the task of glaucoma detection, which leverages the robustness of segmentation masks without disregarding the rich information in the original fundus images. Experimental results on both private and public datasets demonstrate that our proposed method outperforms all models that utilize solely either fundus images or masks.
Keywords Glaucoma detection Color fundus Segmentation mask
1 Introduction
Glaucoma is the leading cause of global irreversible blindness, and the number of people with glaucoma worldwide is projected to reach 111.8 million in 2040 [1]. However, glaucoma can remain asymptomatic through the early stage, leaving a large number of possibly affected people undiagnosed [2], which if unattended, could lead to a larger population with severe glaucoma and irreversibly damaged vision in the future. Thus, early treatment or intervention is of great importance. However, due to the lack of highly experienced experts for large-scale glaucoma screening, effective automatic glaucoma detection methods are urgently needed.
Color fundus photography is a cost effective imaging modality for clinical diagnosis of glaucoma, but it is not easy even for trained ophthalmologists to reliably identify glaucoma in fundus. Moreover, assessment of glaucomatous structural damge in fundus photographs suffers from low reproducibility [5].
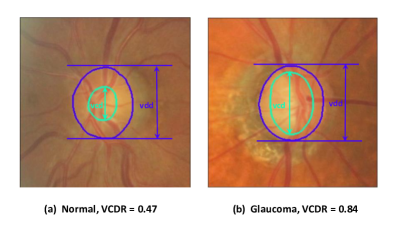
To improve reproducibility and interpretability, and to assist clinicians with diagnosing glaucoma, various clinical measurements are explored [6, 7], among which the vertical cup to disc ratio (VCDR) is well accepted and widely adopted [6]. As a risk factor, a larger VCDR generally indicates a higher possibility of glaucomatous damage [8]. Due to the fact that VCDR is highly correlated with glaucoma, accurate segmentation of optic disc and cup becomes a crucial task for glaucoma detection, since the segmentation masks are indispensable for the calculation of VCDR, as illustrated in Fig. 1.
In recent decades, advances in artificial intelligence algorithms, notably deep learning neural networks, have fueled remarkable progress in medical image analysis [9, 10, 11] and have led to exciting prospects in automating the assessment of glaucoma in color fundus images [12]. Many previous works have proposed to employ deep learning methods for glaucoma detection in fundus photographs, but the segmentation of optic disc and cup is often singled out as an independent task, and the relationship between fundus and segmentation masks in terms of joint decision-making in glaucoma assessment is rarely explored. In most works, the segmentation of optic disc and cup is generally regarded as an standalone upstream task rather than a source of complementary information to fundus images in performing glaucoma classification. Various works have suggested utilizing only the segmentation results to achieve the assessment of glaucoma, regardless of the original information that the color fundus images contain [13, 14]. Though glaucoma classification based solely on disc and cup segmentation results exhibits good generalization ability, there is still considerable room left for improvement, for even VCDRs calculated using ground truth masks only result in baseline level performance [15].
Plenty researches have explored the automatic detection of glaucoma in fundus images using machine learning methods [16, 5, 17, 18, 19]. Li et al. [16] suggest training a deep learning model based solely on fundus images with labels that multiple graders agree on. Medeiros et al. [5] propose a deep learning algorithm trained on fundus images that are labeled with the corresponding global retinal nerve fiber layer thickness measurements from spectral-domain optical coherence tomography (SDOCT). Yu et al. [17] propose to leverage the multi-rater consensus information for the glaucoma classification task. Ghamdi et al. employ semi-supervised transfer learning for glaucoma detection in fundus images. Zhao et al. [18] propose a weakly-supervised method to achieve evidence identification, optic disc segmentation, and glaucoma diagnosis simultaneously, which only requires weak-label fundus images as training input.
The segmentation of Optic Disc and Cup is also a well established research field, since vertical cup to disc ratio (VCDR) is considered an indicator of great significance for glaucoma diagnosis [6]. There have been a great number of works which employ machine learning methods to segment optic disc and cup [13, 20, 21, 22].
However, in some works, the segmentation of optic disc and cup is singled out as an independent task rather than a source of complementary information for glaucoma detection [18, 21]. And to another extreme, some works have suggested utilizing only the segmentation results to perform the downstream task of glaucoma assessment, regardless of the rich original information that the color fundus images contain. R. Ali et al. [13] propose a method for glaucoma screening based on the computed VCDR from the segmentation result, which is obtained through a fuzzy broad learning system. Sevastopolsky proposes a modified U-Net neural network for disc and cup segmentation [20], based on which glaucoma detection is performed.
In this work, we propose to leverage the optic disc and cup segmentation results while exploiting the rich original information in fundus images for glaucoma detection. Not only do we take into consideration the spatial information provided by the segmentation masks, but we also manage to incorporate the VCDR values into the classification pipeline. The main contributions of our work can be described as follows:
-
•
We propose a simple yet effective method to adaptively compute rough vessel maps, which can serve as a source of complementary information, based on spatial indication provided by the disc and cup segmentation masks.
-
•
We design an approach to performing complexity reduction by thresholding the values in the fundus images into a small set, but at the same time still retaining the relevant characteristics.
-
•
We propose an easy-to-implement method to fuse VCDR values into our deep learning network to improve robustness, fully utilizing relevant ophthalmologic prior knowledge.
-
•
For the task of glaucoma classification, we manage to leverage the robustness of segmentation-based methods without disregarding the rich information in the original fundus images, resulting in a better performance as well as generalization abilities. Experimental results reveal that our method provides great improvements on both fundus-based and mask-based methods.
2 Methods
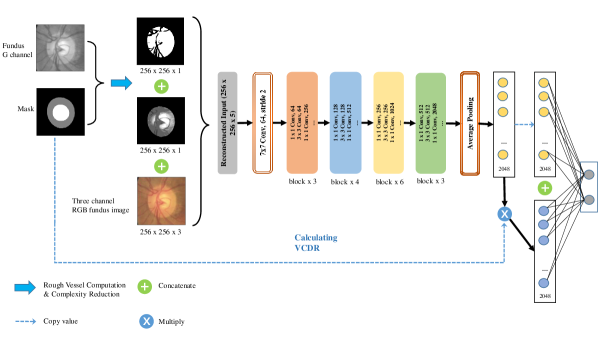
In this section, we give a detailed description of our proposed method, the overall structure of which is illustrated in Fig. 2. Based on the fundus images and segmentation masks (We employ the HANet method proposed in [23] to obtain segmentation results beforehand.), we firstly perform rough vessel map computation and complexity reduction to acquire two new channels of input, which are subsequently concatenated to the original RGB channels of fundus images. The reconstructed 5-channel input then goes through a partially modified Resnet50 structure [3] pretrained on ImageNet [4]. Meanwhile, VCDR values are calculated based on the masks and passed along the network, eventually incorporated into the decision-making pipeline.
Rough Vessel Map Computation
We propose a simple yet effective method to adaptively compute rough vessel maps, which can serve as a source of complementary information, based on spatial indication provided by the disc and cup segmentation results.
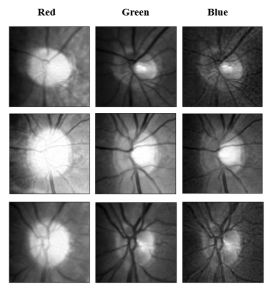
We choose to utilize only the green channels of color fundus images as the source information to compute rough vessel maps, since the vessel boundaries are visibly more clear and obvious on the green channel than on the red and blue channels of fundus images, as can be observed in Fig. 3, and thus more suitable for thresholding to obtain the rough vessel maps.
We denote the set of coordinates in the background of the segmentation mask, where it belongs to neither cup nor disc region, and is the size of the set. We define a function that translates the coordinate into its pixel value in the green channel of the color fundus image. We calculate the mean pixel value of the background region (suggested by the segmentation results) in the green channel and name it . Similarly, we define as the mean pixel value of the rim region in the green channel, the set of coordinates in which is denoted as , where represents the size of the set.
| (1) |
| (2) |
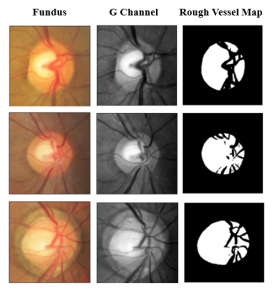
To obtain the rough vessel maps, we adaptively calculate threshold values, denoted as in Eq. (3), to perform global thresholding on the green channels of color fundus images. To reduce irrelevant noise, in the rough vessel maps, we paint the background region (suggested by the segmentation results) black, as shown in Fig. 4.
| (3) |
Complexity Reduction
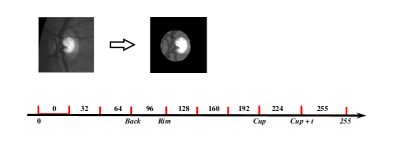
We perform complexity reduction by thresholding the green channels of color fundus images into a small set of pixel values, during which the ranges for thresholding are computed adaptively using the indication provided by the segmentation results. On top of and , we further compute by the same token, which is defined as follows:
| (4) |
where the set of coordinates in the cup area is denoted as , and the size of the set . Moreover, we define a parameter , and we set it to 20 during our experiments.
As shown in Fig. 5, we set multiple milestone values based on the calculated , , , and for the green channels of fundus images. Then we constrain pixel values within the ranges of adjacent milestones into certain fixed values, which are roughly evenly distributed across 0 to 255. To reduce irrelevant noise, we paint the background region (suggested by the segmentation results) black.
VCDR Incorporation
To fuse the VCDR into the deep learning network, we construct an additional branch of 2048 neurons by multiplying the existing neuron values before the fully connected layer of a Resnet50 backbone by VCDR. And then we concatenate the reconstructed branch of neurons to the original ones, resulting in a total of 4096 neurons before the fully connected layer, as illustrated in the right corner of Fig. 2.
Datasets
-
•
SY
We construct a private dataset named SY for our experiments. The SY dataset consists of a total of 11470 color fundus images. As shown in Table. 1, there are far fewer glaucoma cases than non-glaucoma cases in SY, which makes it an imbalanced dataset. Meanwhile, although SY is a large dataset, not all images in it are of good quality due to complicated clinical circumstances under which the images were collected. Thus, SY can well represent the problem of long-tail distribution as well as relatively low image quality in the wild.
-
•
REFUGE
REFUGE is a public dataset released during the Retinal Fundus Glaucoma Challenge [15]. It contains a total of 1200 fundus images with ground truth segmentations and clinical glaucoma labels. The ratio of glaucoma cases to non-glaucoma is 1:9, as shown in Table. 2. All images in the training set contains all the images acquired with the Zeiss Visucam 500 camera. In contrast, the validation and test sets include lower resolution images captured with the Canon CR-2 device.
| Subset | Glaucoma | Normal | Total |
|---|---|---|---|
| Train | 946 | 8222 | 9168 |
| Val | 119 | 1027 | 1146 |
| Test | 119 | 1037 | 1156 |
| Subset | Glaucoma | Normal | Total |
|---|---|---|---|
| Train | 40 | 360 | 400 |
| Val | 40 | 360 | 400 |
| Test | 40 | 360 | 400 |
Results and Discussion
In this section, we demonstrate our experimental details as well as our results on a private dataset and a public dataset.
Evaluation Metrics
Receiver operating characteristic curve (ROC) and area under ROC (AUC) are adopted as the primary metrics for evaluating the performance of our glaucoma classification method compared to other baselines.
TP, TN, FP, and FN are the numbers of the true positive glaucoma, true negative glaucoma, false positive glaucoma and false negative glaucoma respectively. Sensitivity and specificity are defined as follows:
| (5) |
| (6) |
Since sensitivity and specificity are more relevant from a medical standpoint, we employ the harmonic mean of sensitivity and specificity as our F1-score, defined as follows:
| (7) |
F1-score, sensitivity, and specificity are considered as our secondary metrics.
Implementation Details
We implement our network with PyTorch on TITAN Xp GPU. Firstly, we crop the disc regions from fundus images and obtain regions of interests (ROIs) of 256256. We employ the HANet method proposed in [23] to obtain segmentation results of these ROIs. The augmentation strategies we adopt include random horizontal flip and random Gaussian blur. Moreover, we employ a Resnet50 [3] structure that is pretrained on ImageNet [4]. We train the SY dataset for 50 epoches and REFUGE for 100, during which the models with the best AUCs are saved.
Baseline Models
To verify the effectiveness of different modules of our method, we adopt multiple baselines in comparison with our proposed model. Namely, stands for the model that utilizes the three-channel RGB fundus images as input and also incorporates our proposed VCDR module. stands for only using fundus images without involving VCDR. By the same token, employs three channels of repeated masks as well as the VCDR module, and does not involve VCDR. Moreover, the models in the last row of Table. 3 and Table. 4 are logistic regression models trained, validated, and tested solely with the calculated VCDR values. Except for the , all other deep learning models adopt the same Resnet50 backbone.
| Method | Auc | F1-score | Sensitivity | Specificity |
|---|---|---|---|---|
| 0.9405 | 0.8555 | 0.8655 | 0.8457 | |
| 0.9318 | 0.8425 | 0.7899 | 0.9026 | |
| 0.9219 | 0.816 | 0.7647 | 0.8746 | |
| 0.9042 | 0.8185 | 0.7647 | 0.8804 | |
| 0.8916 | 0.8335 | 0.8067 | 0.8621 | |
| 0.8949 | 0.8222 | 0.7983 | 0.8476 |
| Method | Auc | F1-score | Sensitivity | Specificity |
|---|---|---|---|---|
| 0.9711 | 0.9094 | 0.95 | 0.8722 | |
| 0.9667 | 0.9032 | 0.875 | 0.9333 | |
| 0.8908 | 0.8055 | 0.8 | 0.8111 | |
| 0.9602 | 0.8916 | 0.9 | 0.8833 | |
| 0.9566 | 0.9065 | 0.925 | 0.8889 | |
| 0.9675 | 0.8993 | 0.875 | 0.925 |
Experiment On Private Dataset
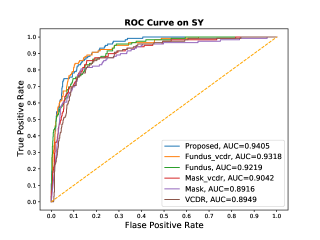
Table. 3 shows our experimental results of all the methods on the SY dataset, and the ROC curve can be observed in Fig. 6. As we select the model with the best AUC on the validation set for each method, we also optimize the threshold values for sensitivity, specificity, and F1-score on the validation set and select the values that maximize the F1-score and assure that the specificity is greater than 0.8.
As can be observed in Table. 3, our proposed method achieves the best Auc, F1-score, and sensitivity on SY. SY is a relatively large dataset, and our results on it shows the superiority of our method. SY can well represent the problem of long-tail distribution as well as relatively low image quality in the wild, and thus our results also reveal that the proposed method have great robustness.
On SY, segmentation-based methods like , , and show limited performance, but combined with the rich information in fundus images, and demonstrate better results than both segmentation-based models and the purely RGB-image-based model of . Besides, the method also betters in overall performance, indicating that the two channels of new input that we construct contain information relevant to glaucoma detection. Moreover, also shows better performance than , which verifies the effectiveness of our module.
Experiment On Public Dataset
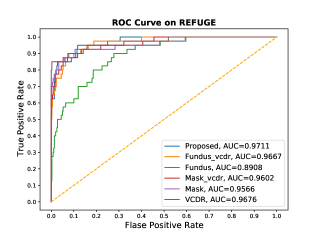
Table. 4 shows our experimental results of all the methods on the REFUGE dataset, and the ROC curve can be observed in Fig. 7. Regarding the sensitivity, specificity, and F1-score, we adopt the same optimization method as that of SY, selecting threshold values using the same strategy for each method on the validation set of REFUGE.
Similar to SY, our proposed method also achieves the best Auc, F1-score, and sensitivity on REFUGE. We can observe that segmentation-based methods like , , and show much better performance than on REFUGE, which is different from what we observe on SY. Considering that REFUGE is a much smaller dataset than SY, it is safe to speculate that segmentation-based methods are especially needed for small training sets, and more so than large ones. It can be seen that compared to , demonstrates significant improvement, which reveals that our proposed module has been especially helpful on this small dataset of REFUGE, where training on a limited number of fundus images alone cannot result in good performance. Moreover, similar to what we see on SY, the method betters in overall performance, which shows the effectiveness of our rough vessel computation and complexity reduction modules.
Conclusion
In this paper, we propose a novel segmentation-based information extraction and amalgamation method in fundus images for the task of glaucoma detection. We manage to leverage the robustness of segmentation masks without disregarding the rich information in the original fundus images, resulting in better performances, better generalization abilities as well as image processing methods with potential for researchers in the medical field to tap into. Experimental results reveal that our method provides great improvements on both fundus-based and mask-based methods.
Acknowledgments
This work is supported by the Fundamental Research Funds for the Central Universities, and the Research Funds of Renmin University of China (20XNA031).
References
- [1] Yih-Chung Tham, Xiang Li, Tien Y. Wong, Harry A. Quigley, Tin Aung, and Ching-Yu Cheng. Global prevalence of glaucoma and projections of glaucoma burden through 2040: A systematic review and meta-analysis. Ophthalmology, 121(11):2081–2090, 2014.
- [2] Robert N Weinreb, Tin Aung, and Felipe A Medeiros. The pathophysiology and treatment of glaucoma: a review. Jama, 311(18):1901–1911, 2014.
- [3] Kaiming He, Xiangyu Zhang, Shaoqing Ren, and Jian Sun. Deep residual learning for image recognition. In Proceedings of the IEEE conference on computer vision and pattern recognition, pages 770–778, 2016.
- [4] Jia Deng, Wei Dong, Richard Socher, Li-Jia Li, Kai Li, and Li Fei-Fei. Imagenet: A large-scale hierarchical image database. In 2009 IEEE conference on computer vision and pattern recognition, pages 248–255. Ieee, 2009.
- [5] Felipe A Medeiros, Alessandro A Jammal, and Atalie C Thompson. From machine to machine: an oct-trained deep learning algorithm for objective quantification of glaucomatous damage in fundus photographs. Ophthalmology, 126(4):513–521, 2019.
- [6] Jost B Jonas, Antonio Bergua, Paul Schmitz-Valckenberg, Konstantinos I Papastathopoulos, and Wido M Budde. Ranking of optic disc variables for detection of glaucomatous optic nerve damage. Investigative Ophthalmology & Visual Science, 41(7):1764–1773, 2000.
- [7] Shu-Hao Lu, Ka Yue Lee, Jones Iok Tong Chong, Andrew KC Lam, Jimmy SM Lai, and David CC Lam. Comparison of ocular biomechanical machine learning classifiers for glaucoma diagnosis. In 2018 IEEE International Conference on Bioinformatics and Biomedicine (BIBM), pages 2539–2543. IEEE, 2018.
- [8] M Cristina Leske, Anders Heijl, Mohamed Hussein, Bo Bengtsson, Leslie Hyman, Eugene Komaroff, Early Manifest Glaucoma Trial Group, et al. Factors for glaucoma progression and the effect of treatment: the early manifest glaucoma trial. Archives of ophthalmology, 121(1):48–56, 2003.
- [9] Olaf Ronneberger, Philipp Fischer, and Thomas Brox. U-net: Convolutional networks for biomedical image segmentation. In International Conference on Medical image computing and computer-assisted intervention, pages 234–241. Springer, 2015.
- [10] Ozan Oktay, Jo Schlemper, Loic Le Folgoc, Matthew Lee, Mattias Heinrich, Kazunari Misawa, Kensaku Mori, Steven McDonagh, Nils Y Hammerla, Bernhard Kainz, et al. Attention u-net: Learning where to look for the pancreas. arXiv preprint arXiv:1804.03999, 2018.
- [11] Huimin Huang, Lanfen Lin, Ruofeng Tong, Hongjie Hu, Qiaowei Zhang, Yutaro Iwamoto, Xianhua Han, Yen-Wei Chen, and Jian Wu. Unet 3+: A full-scale connected unet for medical image segmentation. In ICASSP 2020-2020 IEEE International Conference on Acoustics, Speech and Signal Processing (ICASSP), pages 1055–1059. IEEE, 2020.
- [12] Atalie C Thompson, Alessandro A Jammal, and Felipe A Medeiros. A review of deep learning for screening, diagnosis, and detection of glaucoma progression. Translational Vision Science & Technology, 9(2):42–42, 2020.
- [13] Riaz Ali, Bin Sheng, Ping Li, Yan Chen, Huating Li, Po Yang, Younhyun Jung, Jinman Kim, and CL Philip Chen. Optic disk and cup segmentation through fuzzy broad learning system for glaucoma screening. IEEE Transactions on Industrial Informatics, 17(4):2476–2487, 2020.
- [14] Huazhu Fu, Jun Cheng, Yanwu Xu, Damon Wing Kee Wong, Jiang Liu, and Xiaochun Cao. Joint optic disc and cup segmentation based on multi-label deep network and polar transformation. IEEE transactions on medical imaging, 37(7):1597–1605, 2018.
- [15] José Ignacio Orlando, Huazhu Fu, João Barbosa Breda, Karel van Keer, Deepti R Bathula, Andrés Diaz-Pinto, Ruogu Fang, Pheng-Ann Heng, Jeyoung Kim, JoonHo Lee, et al. Refuge challenge: A unified framework for evaluating automated methods for glaucoma assessment from fundus photographs. Medical image analysis, 59:101570, 2020.
- [16] Zhixi Li, Yifan He, Stuart Keel, Wei Meng, Robert T Chang, and Mingguang He. Efficacy of a deep learning system for detecting glaucomatous optic neuropathy based on color fundus photographs. Ophthalmology, 125(8):1199–1206, 2018.
- [17] Shuang Yu, Hong-Yu Zhou, Kai Ma, Cheng Bian, Chunyan Chu, Hanruo Liu, and Yefeng Zheng. Difficulty-aware glaucoma classification with multi-rater consensus modeling. In International Conference on Medical Image Computing and Computer-Assisted Intervention, pages 741–750. Springer, 2020.
- [18] Rongchang Zhao, Wangmin Liao, Beiji Zou, Zailiang Chen, and Shuo Li. Weakly-supervised simultaneous evidence identification and segmentation for automated glaucoma diagnosis. In Proceedings of the AAAI Conference on Artificial Intelligence, volume 33, pages 809–816, 2019.
- [19] Mijung Kim, Ho-min Park, Jasper Zuallaert, Olivier Janssens, Sofie Van Hoecke, and Wesley De Neve. Computer-aided diagnosis and localization of glaucoma using deep learning. In 2018 IEEE International Conference on Bioinformatics and Biomedicine (BIBM), pages 2357–2362, 2018.
- [20] Artem Sevastopolsky. Optic disc and cup segmentation methods for glaucoma detection with modification of u-net convolutional neural network. Pattern Recognition and Image Analysis, 27(3):618–624, 2017.
- [21] Manal Al Ghamdi, Mingqi Li, Mohamed Abdel-Mottaleb, and Mohamed Abou Shousha. Semi-supervised transfer learning for convolutional neural networks for glaucoma detection. In ICASSP 2019-2019 IEEE International Conference on Acoustics, Speech and Signal Processing (ICASSP), pages 3812–3816. IEEE, 2019.
- [22] Yang Wen, Leiting Chen, Lifeng Qiao, Chuan Zhou, Shuo Xi, Rui Guo, and Yu Deng. An efficient weakly-supervised learning method for optic disc segmentation. In 2020 IEEE International Conference on Bioinformatics and Biomedicine (BIBM), pages 835–842. IEEE, 2020.
- [23] Fei Ding, Gang Yang, Jinlu Liu, Jun Wu, Dayong Ding, Jie Xv, Gangwei Cheng, and Xirong Li. Hierarchical attention networks for medical image segmentation. arXiv preprint arXiv:1911.08777, 2019.