11email: Jing.Wang@UTSouthwestern.edu
https://labs.utsouthwestern.edu/advanced-imaging-and-informatics-radiation-therapy-airt-lab
Recurrence-free Survival Prediction under the Guidance of Automatic Gross Tumor Volume Segmentation for Head and Neck Cancers
Abstract
For Head and Neck Cancers (HNC) patient management, automatic gross tumor volume (GTV) segmentation and accurate pre-treatment cancer recurrence prediction are of great importance to assist physicians in designing personalized management plans, which have the potential to improve the treatment outcome and quality of life for HNC patients. In this paper, we developed an automated primary tumor (GTVp) and lymph nodes (GTVn) segmentation method based on combined pre-treatment positron emission tomography/computed tomography (PET/CT) scans of HNC patients. We extracted radiomics features from the segmented tumor volume and constructed a multi-modality tumor recurrence-free survival (RFS) prediction model, which fused the prediction results from separate CT radiomics, PET radiomics, and clinical models. We performed 5-fold cross-validation to train and evaluate our methods on the MICCAI 2022 HEad and neCK TumOR segmentation and outcome prediction challenge (HECKTOR) dataset. The ensemble prediction results on the testing cohort achieved Dice scores of 0.77 and 0.73 for GTVp and GTVn segmentation, respectively, and a C-index value of 0.67 for RFS prediction. The code is publicly available (https://github.com/wangkaiwan/HECKTOR-2022-AIRT). Our team’s name is AIRT.
Keywords:
Head and neck cancer Automatic segmentation Recurrence-free survival prediction1 Introduction
Head and Neck cancer (HNC) is one of the most common cancers worldwide [1]. With the development of HNC radiotherapy and chemo-radiotherapy, HNC patients can be successfully treated in many cases. However, even treated with curative intent, there are still more than 15% patients will experience cancer recurrence, of which locoregional failures occur in up to 40% of patients in the first two years after the treatment [2]. Therefore, a strategy that can accurately identify HNC patients at high risk of recurrence at diagnosis would be helpful in assisting physicians in making personalized treatment plans, which have the potential to improve patient treatment outcomes.
Positron Emission Tomography (PET) and Computed Tomography (CT) imaging (PET/CT) play an important role in the management of HNC patients [3]. At initial staging, PET/CT plays the central role in characterizing local, regional and distant disease, while during therapy and after therapy, it is routinely used to assess the treatment response and detect recurrence and/or metastases. Recently, using PET/CT scans of HNC patients, several radiomics and deep learning studies were proposed to better predict the treatment outcomes, including locoregional recurrence, distant recurrence, and recurrence-free survival (RFS) [4, 5, 6, 7, 8]. Besides, as deep learning-based image segmentation has achieved comparable performance to humans in many tasks, several organs at risk (OAR) and gross tumor volume (GTV) automatic segmentation methods were proposed to help in the management of HNC patients [9, 10, 11]. These segmentation methods not only have the potential to ease the workload of healthcare workers but also assist in the workflow of radiomics or deep learning-based treatment outcome prediction models, which can heavily rely on the accuracy of the region of interest (ROI) delineation.
Although the promising performance was reported in some of the automatic segmentation and outcome prediction studies, their reliability, robustness, and reproducibility are still of concern for clinical translation. Aiming to further study the automatic segmentation and RFS survival prediction method for HNC tumors and exam their cross-institutional performance objectively, the MICCAI 2022 Head and NeCK TumOR segmentation and outcome prediction challenge (HECKTOR) offered researchers the opportunity to build and evaluate their auto-segmentation and RFS prediction models with a very large dataset collected from multiple institutions [12, 13]. In the present work, we built an auto-segmentation framework for precise segmentation of HNC primary tumor (GTVp) and lymph nodes (GTVn) with HECKTOR 2022 dataset, and we introduced a multi-modality HNC RFS prediction framework that ensembles the predicted risk scores from separate clinical feature model, PET radiomics model, and CT radiomics model. The deep auto-segmentation model is used to identify the ROIs for radiomics feature extraction.
2 Material and Methods
2.1 Head and NeCK TumOR 2022 (HECKTOR 2022) Dataset
The dataset provided in HECKTOR 2022 consisted of PET/CT scans, clinical features, and follow-up information of 845 HNC patients from 7 centers. The total number of training cohorts is 524 and 489 for tasks 1 (GTVp and GTVn segmentation) and 2 (RFS prediction), respectively. Training and test cohorts are representative of the distribution of the real-world population of patients accepted for initial staging of oropharyngeal cancer (with around 21% of recurrence and a median RFS of 14 months in the training set). For the PET images, computation of the Standardized Uptake Value (SUV) is already done by the challenge organizer. Missing patient weight was estimated as 75Kg to compute SUV for a small subset of patients (8 of 845). All the PET/CT files conversed from the DICOM file format to NIfTI format. More detailed description of the dataset can be found [12, 13]. The provided clinical features are gender, age, tobacco and alcohol consumption, performance status (Zubrod), HPV status, treatment (surgery and/or chemotherapy in addition to the radiotherapy that all patients underwent). There is some clinical information missing (tobacco, alcohol, performance status, HPV status), and we encoded the missing feature with value 0, known as negative status as -1. Five-fold cross-validation strategy was used to train and validate our method for both two tasks. And we fused the prediction results of 5-fold models for the testing cohort to generate the ensemble result for the challenge submission.
2.2 Overall Architecture
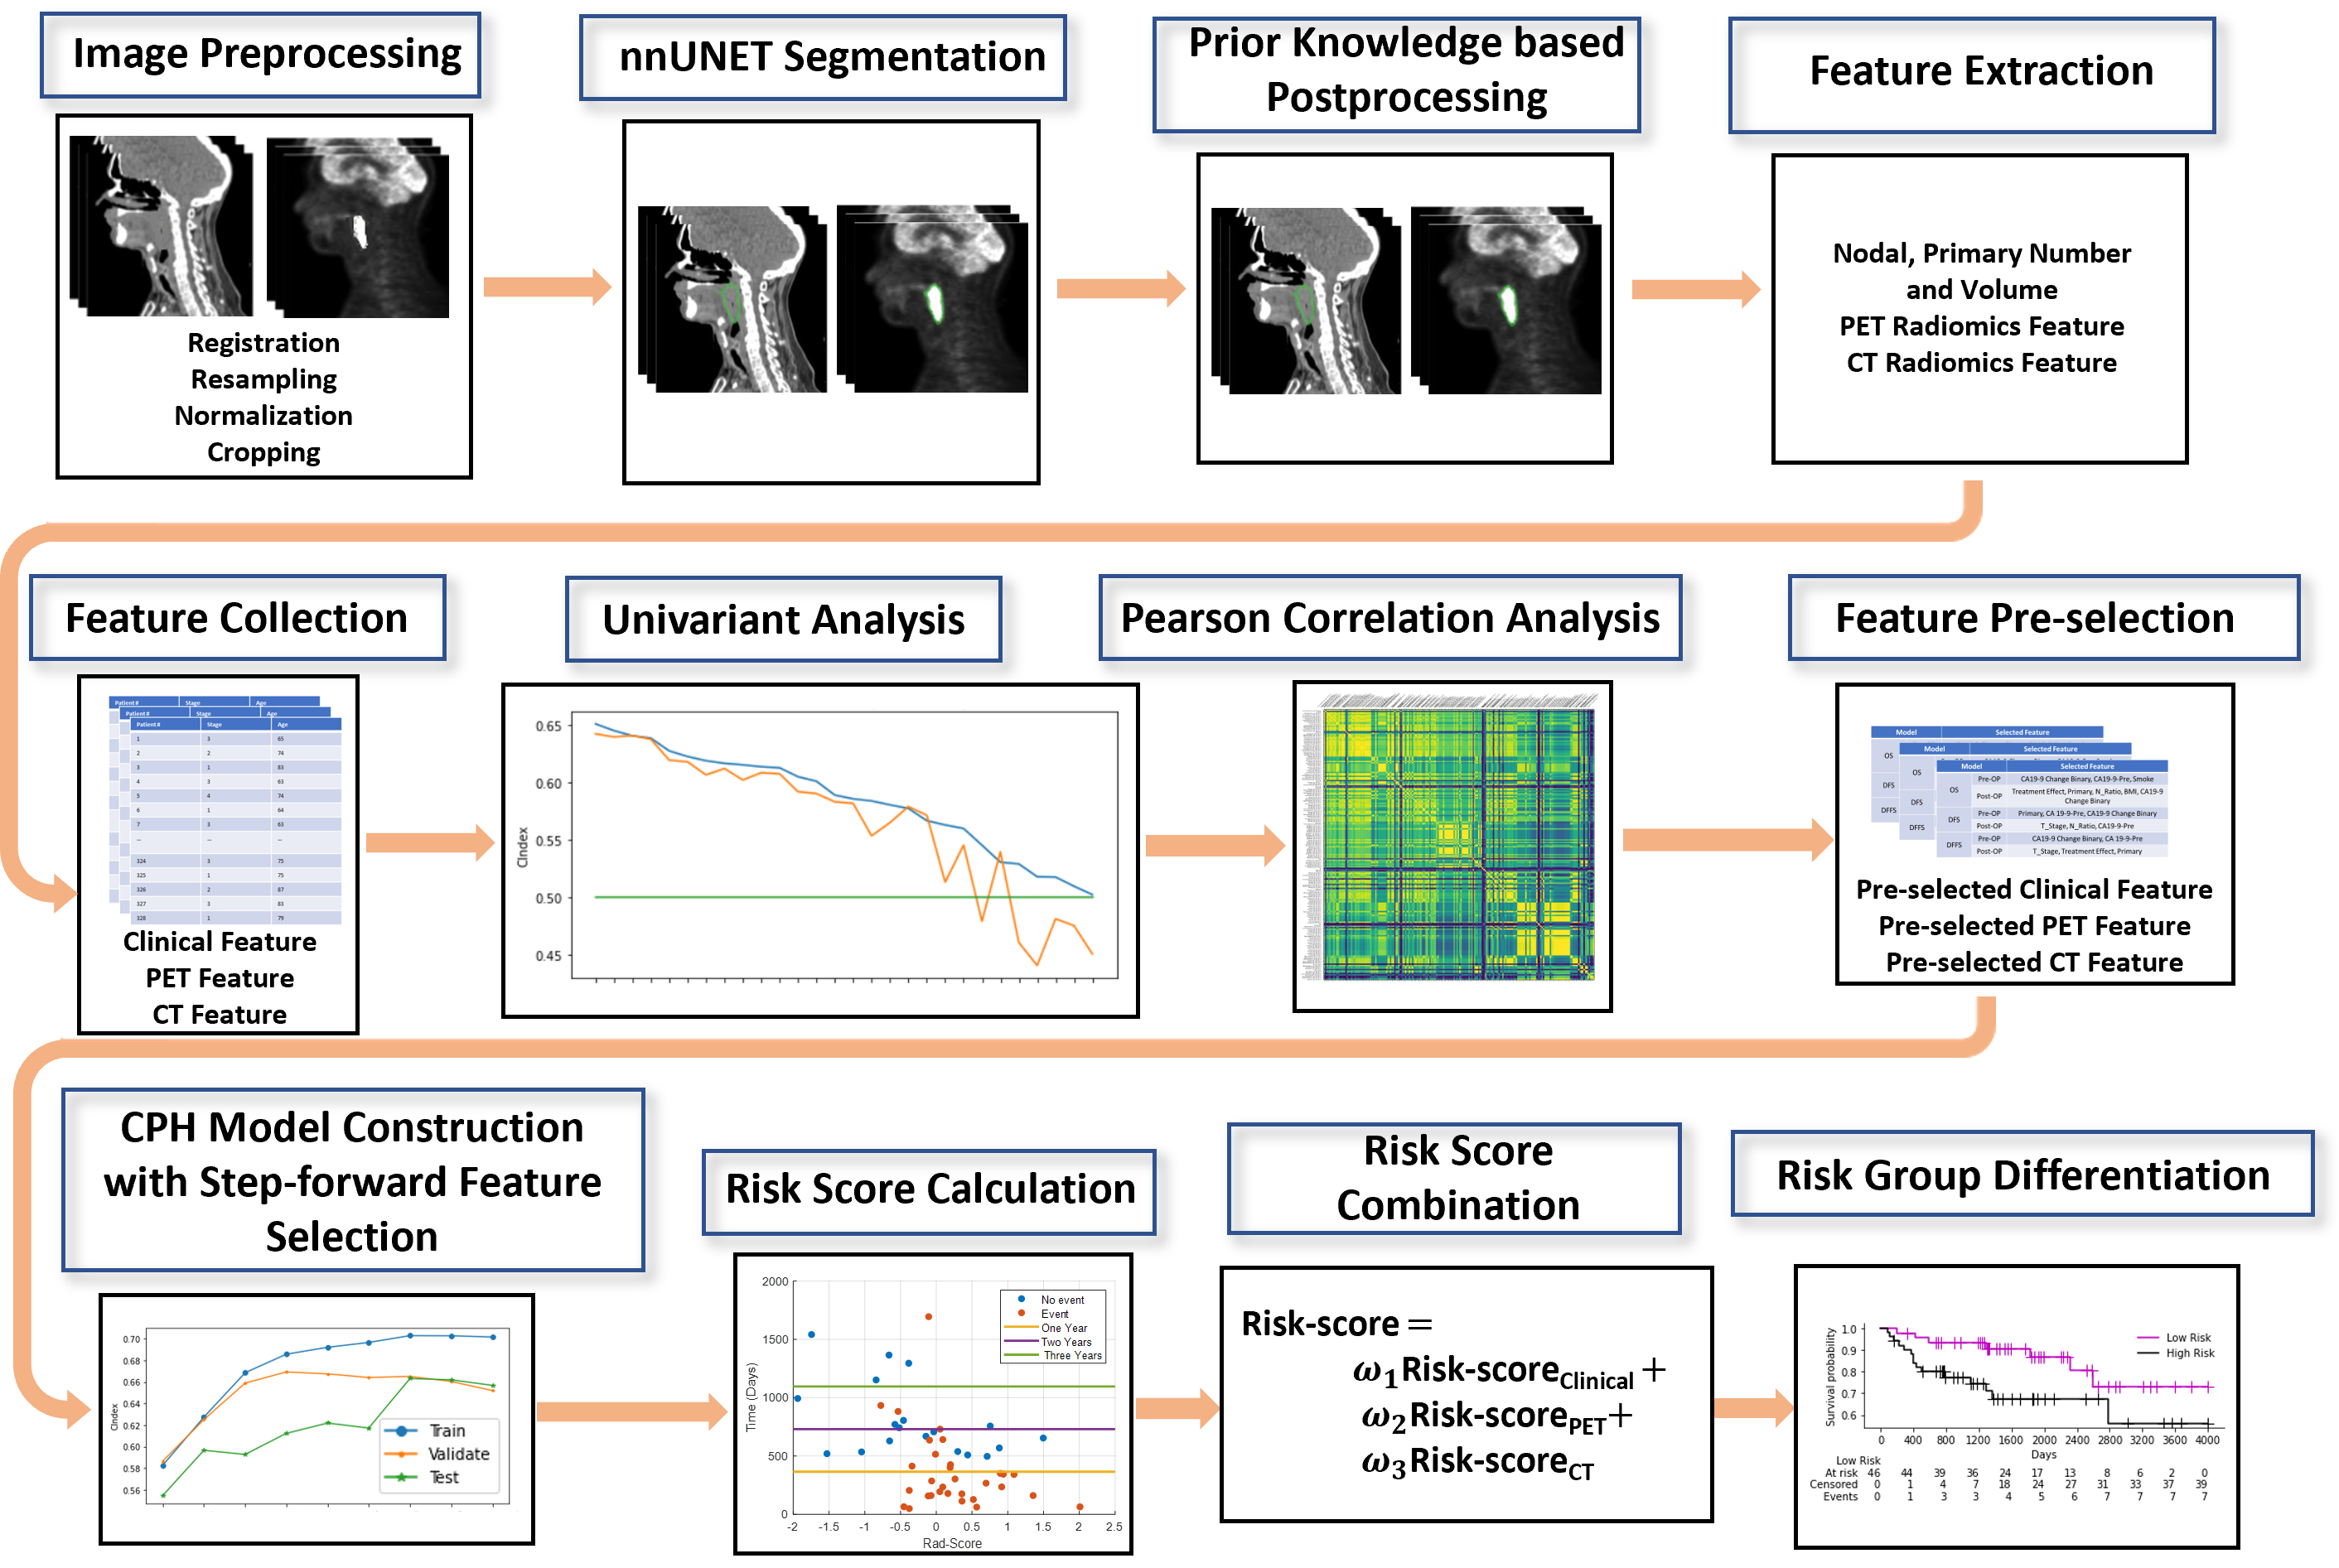
The workflow of our proposed method is shown in Fig. 1. After PET/CT image processing, we trained a nnUNET model with concatenated PET/CT image as the input, and the output is GTVp and GTVn masks. Then we calculated the predicted GTVp and GTVn number and volume as additional clinical features. Within the predicted GTVp volume, we extracted PET, and CT radiomics feature separately. After univariate analysis and feature correlation analysis, we removed the low-predictive features and redundant features. The remaining features would go through a step-forward feature selection with Cox Proportional Hazards (CPH) model, and the best model and feature set was determined by the validation performance. Then the risk score of testing patients can be calculated. We trained the clinical feature model, CT radiomics model, and PET radiomics model separately. Their predicted risk score for testing data was fused together as the multi-modality RFS model prediction results to predict patients’ RFS and identify high- or low-risk patients.
2.3 Gross Tumor Volume Segmentation (Task 1)
2.3.1 nnUNet for Segmentation
We used the nnUNet [14] 3D full-resolution pipeline as the basis segmentation backbone. Considering each patient image had a different voxel size, the original PET/CT images were resampled to 2 mm × 2 mm × 2 mm pixel spacing with trilinear interpolation. The labels were resampled to the same size spacing. Besides, the PET/CT images were cropped into 2 × 128 × 128 × 128 patches with overlaps. Each image was standardized using z-scores. To avoid overfitting, image augmentation was used with random rotation in all directions between [-30, 30] degrees and random scaling between [0.7, 1.4]. All 524 patients were randomly divided into five groups for the five-fold cross-validation, each time leaving out one group of patients for validation and the others for training.
The training protocol is listed in Table. 1.
| Parameter | Setting |
|---|---|
| Patch size | 128 × 128 × 128 |
| Batch size | 2 |
| weight_decay | 3e-05 |
| Optimizer SGD | SGD |
| Initial learning rate 0.01 | 0.01 |
| Learning rate decay schedule | polyLR |
| Nesterov momentum | 0.99 |
| Epoch | 1000 |
2.3.2 Post-processing
It is known a priori from anatomical knowledge that the distances between the primary tumor (GTVp) and lymph nodes (GTVn) are often under certain thresholds. In order to remove unreasonable segmentation results, we first calculate the center-of-mass coordinates of GTVp and GTVn. Assume the center-of-mass coordinates of GTVp and GTVn are and , separately. The distance between GTVp and GTVn can be calculate via Eq. (1).
| (1) |
Based on the clinician’s empirical judgment, we set as the threshold value for distance. Then, we remove the lymph nodes whose distance is greater than .
2.4 Recurrence-Free Survival Prediction (Task 2)
With the nnUNET predicted the GTVp and GTVn volume on the resampled PET/CT image, we extract PET and CT radiomics feature separately with the pyradiomics package [15]. Default feature extraction settings were used for both PET and CT feature extraction. As the number and volume of GTVp and GTVn are reported to be predictive for HNC treatment outcome prediction, and they are not as complex features as radiomics features, we added them to clinical feature set. For the missing value in clinical feature, comprising 293 tobacco consumption, 326 alcohol consumption, 268 performance status, and 167 missing HPV status, we coded the positive status (1 in the original file) to 1, negative status (0 in the original file) to -1, and missing value to 0.
For training and validating our method with training cohort data, we followed the same splitting as what we did for training the nnUNET. For each training fold in the 5-fold cross-validation procedure, we first performed 100 times internal 5-fold cross-validation on the training fold for clinical feature, CT radiomcis feature, PET radiomics feature pre-selection separately. The partition of the internal training and validation is random each time. Univariant cox regression models were built with each feature for RFS prediction. The average C-index of univariant RFS prediction models validation data was recorded, and the order of features was sorted based on the validation performance. To avoid the low-predictive-ability features, the feature that has a lower than 0.5 average C-index was removed from the feature set. To reduce redundancy in the feature sets for different prediction targets, we performed Pearson correlation analysis for all the features. A feature that has an absolute correlation coefficient higher than 0.9 to any of its previous features was removed from the feature set.
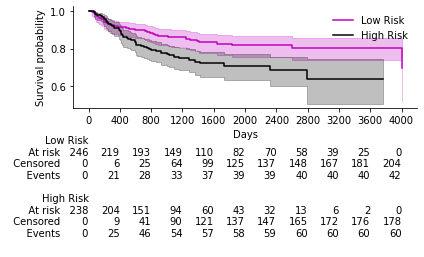
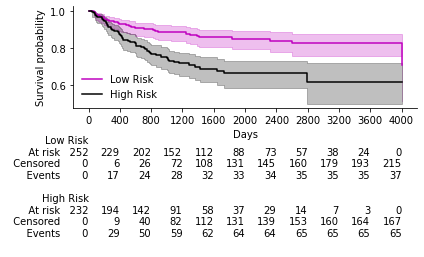
Then, we performed multivariate CPH regression with the step forward feature selection strategy to further select predictive features and construct the RFS prediction models. C-index was the criteria for the step forward feature selection in this step, 5 was set as the maximum number of selected clinical features, 10 was set as the maximum number of selected radiomics features. Another internal 100 times 5-fold cross-validation was conducted to mitigate the impact of random patient partition. The risk scores of training samples and validation samples in each time of 5-fold cross-validation were recorded. The combination of the 5-fold risk scores was used as the final survival prediction on the training cohort of each single-modality model, and the C-index was used to evaluate our models. We then calculated the average risk scores of the three single-modality models for testing patients and used them as our final prediction (multi-modality RFS prediction model results). Of note, for patients who were predicted to have no GTVp volume, their final prediction results are the same as clinical feature-based models, as they don’t have GTVp radiomics features. We also used the multi-modality risk score to differentiate between high- and low-risk patient groups. The threshold was set as 0. We performed Kaplan–Meier analysis and log-rank test to evaluate the RFS difference of the identified patient groups, a P-value was considered significant. Lifelines python package was used to construct the model and perform statistic analysis.
3 Results
3.1 Gross Tumor Volume Segmentation (Task 1)
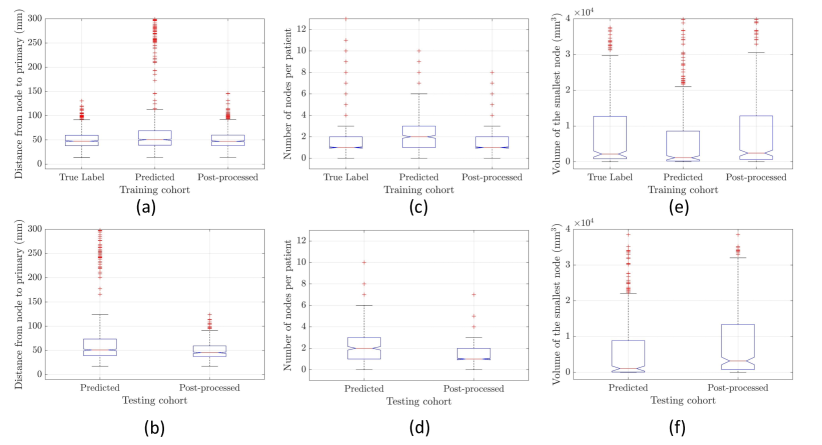
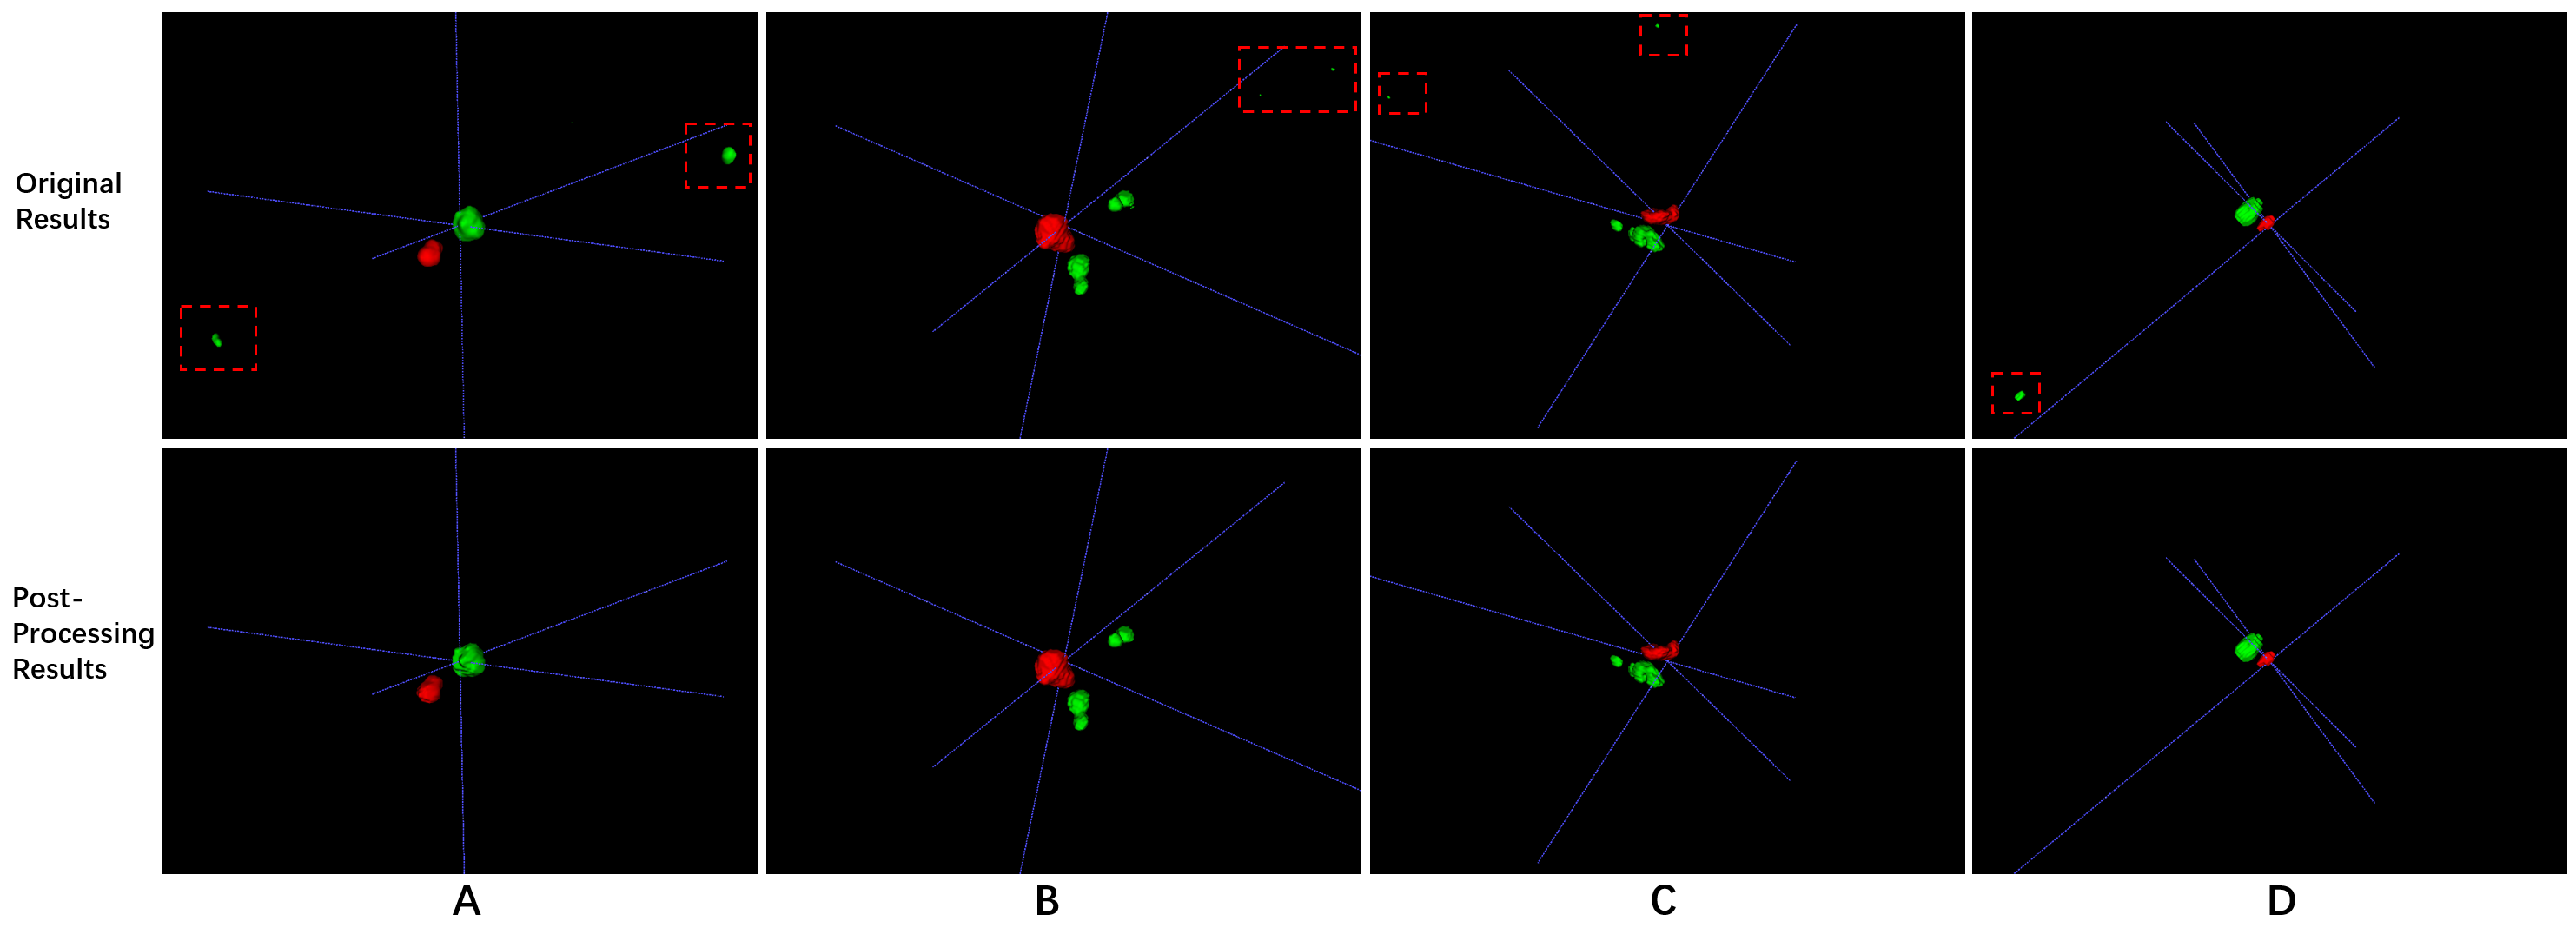
This may be due to the fact that the data contains most of the body parts and the lymph nodes are only distributed in small locations, and other parts of the body to be easily misidentified, which is illustrated in Fig. 3. Our method is capable of identifying the segmentation result of other parts as unreliable results and excluding it. Besides, as shown in Fig. 2, the data distribution of several metrics becomes closer to the manual label, including the number of nodes, volume of the smallest node, and distance from the node to the primary. As shown in Table. 2, we quantitatively compare the segmentation results before and after post-processing, and we can see that our DICE has some improvement after processing.
| GTVn DICE | GTVp DICE | mean DICE | |
|---|---|---|---|
| Original | 0.73276 | 0.76689 | 0.74983 |
| Post-process | 0.73392 | 0.76689 | 0.75040 |
3.2 Recurrence-Free Survival Prediction (Task 2)
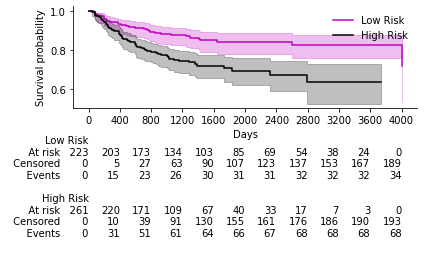
The RFS prediction performance evaluated with C-index on training and testing cohort is shown in Fig. 3. The Kaplan–Meier analysis and log-rank test results of the RFS difference of different patient risk groups identified by single-modality and multi-modality RFS models are shown in Fig. 4. To our surprise, although there are a lot of missing data in the clinical feature set, the clinical feature-based model is still very predictive (C-index=0.68 on training cohort), and the top predictive clinical features are GTVp volume, Node volume, HPV status, and tobacco consumption. The CT-radiomics model is the most predictive single-modality model, and its C-index on the training cohort is 0.69. The fused multi-modality RFS prediction model has the best prediction performance in the training cohort, with a prediction C-index value of 0.72. On the testing cohort, our submitted multi-modality RFS risk score got a C-index value of 0.67, which ranked No.3 on the challenge leaderboard.
| Modality | Clinical | CT Radiomics | PET Radiomics | Multi-Modality |
|---|---|---|---|---|
| C-index (Training) | 0.68253 | 0.68927 | 0.62535 | 0.72036 |
| C-index (Testing) | — | — | — | 0.67257 |

4 Discussion and Conclusion
In this paper, we presented a multi-modality HNC RFS prediction method guided by auto-segmentation GTV segmentation, which achieved a 0.67 C-index for RFS prediction and 0.75 DSC for GTV segmentation. Although the results got good rankings in the challenge, there are still some limitations to our work. Firstly, our segmentation-guided RFS prediction model is not optimized end-to-end, current separate training strategy might not yield the best performance. Secondly, as radiomics method heavily relies on accurate ROI delineation, it’s important to evaluate the performance difference between the model built with features extracted from human expert delineation and features extracted from auto-segmented volume. Thirdly, as RFS prediction is a medical task, irresponsible prediction can be costly if a RFS prediction model is used in the clinic. However, our current RFS model can only give a one-value risk prediction without reporting any uncertainty about the corresponding prediction. It’s hard to tell whether the prediction is based on learning or just random guessing [16]. Uncertainty analysis would be one of our future work, especially with a large dataset as HECKTOR 2022.
Acknowledgements. This work was supported in part by National Institutes of Health (Grant No. R01CA251792, R01CA240808 and R01CA258987)
References
- [1] Ahmedin Jemal, Freddie Bray, Melissa M Center, Jacques Ferlay, Elizabeth Ward, and David Forman. Global cancer statistics. CA: a cancer journal for clinicians, 61(2):69–90, 2011.
- [2] Nerina Denaro, Marco Carlo Merlano, and Elvio Grazioso Russi. Follow-up in head and neck cancer: do more does it mean do better? a systematic review and our proposal based on our experience. Clinical and experimental otorhinolaryngology, 9(4):287–297, 2016.
- [3] Reema Goel, William Moore, Baran Sumer, Saad Khan, David Sher, and Rathan M Subramaniam. Clinical practice in pet/ct for the management of head and neck squamous cell cancer. American Journal of Roentgenology, 209(2):289–303, 2017.
- [4] Martin Vallieres, Emily Kay-Rivest, Léo Jean Perrin, Xavier Liem, Christophe Furstoss, Hugo JWL Aerts, Nader Khaouam, Phuc Felix Nguyen-Tan, Chang-Shu Wang, Khalil Sultanem, et al. Radiomics strategies for risk assessment of tumour failure in head-and-neck cancer. Scientific reports, 7(1):1–14, 2017.
- [5] André Diamant, Avishek Chatterjee, Martin Vallières, George Shenouda, and Jan Seuntjens. Deep learning in head & neck cancer outcome prediction. Scientific reports, 9(1):1–10, 2019.
- [6] Kai Wang, Zhiguo Zhou, Rongfang Wang, Liyuan Chen, Qiongwen Zhang, David Sher, and Jing Wang. A multi-objective radiomics model for the prediction of locoregional recurrence in head and neck squamous cell cancer. Medical physics, 47(10):5392–5400, 2020.
- [7] Liyuan Chen, Michael Dohopolski, Zhiguo Zhou, Kai Wang, Rongfang Wang, David Sher, and Jing Wang. Attention guided lymph node malignancy prediction in head and neck cancer. International Journal of Radiation Oncology* Biology* Physics, 110(4):1171–1179, 2021.
- [8] Rongfang Wang, Jinkun Guo, Zhiguo Zhou, Kai Wang, Shuiping Gou, Rongbin Xu, David Sher, and Jing Wang. Locoregional recurrence prediction in head and neck cancer based on multi-modality and multi-view feature expansion. Physics in Medicine & Biology, 67(12):125004, 2022.
- [9] Ward van Rooij, Max Dahele, Hugo Ribeiro Brandao, Alexander R Delaney, Berend J Slotman, and Wilko F Verbakel. Deep learning-based delineation of head and neck organs at risk: geometric and dosimetric evaluation. International Journal of Radiation Oncology* Biology* Physics, 104(3):677–684, 2019.
- [10] Wentao Zhu, Yufang Huang, Liang Zeng, Xuming Chen, Yong Liu, Zhen Qian, Nan Du, Wei Fan, and Xiaohui Xie. Anatomynet: deep learning for fast and fully automated whole-volume segmentation of head and neck anatomy. Medical physics, 46(2):576–589, 2019.
- [11] Stanislav Nikolov, Sam Blackwell, Alexei Zverovitch, Ruheena Mendes, Michelle Livne, Jeffrey De Fauw, Yojan Patel, Clemens Meyer, Harry Askham, Bernardino Romera-Paredes, et al. Deep learning to achieve clinically applicable segmentation of head and neck anatomy for radiotherapy. arXiv preprint arXiv:1809.04430, 2018.
- [12] Valentin Oreiller, Vincent Andrearczyk, Mario Jreige, Sarah Boughdad, Hesham Elhalawani, Joel Castelli, Martin Vallières, Simeng Zhu, Juanying Xie, Ying Peng, et al. Head and neck tumor segmentation in pet/ct: the hecktor challenge. Medical image analysis, 77:102336, 2022.
- [13] Vincent Andrearczyk et al. Overview of the hecktor challenge at miccai 2022: Automatic head and neck tumor segmentation and outcome prediction in pet/ct. In Head and Neck Tumor Segmentation and Outcome Prediction, 2023.
- [14] Fabian Isensee, Paul F Jaeger, Simon AA Kohl, Jens Petersen, and Klaus H Maier-Hein. nnu-net: a self-configuring method for deep learning-based biomedical image segmentation. Nature methods, 18(2):203–211, 2021.
- [15] Joost JM Van Griethuysen, Andriy Fedorov, Chintan Parmar, Ahmed Hosny, Nicole Aucoin, Vivek Narayan, Regina GH Beets-Tan, Jean-Christophe Fillion-Robin, Steve Pieper, and Hugo JWL Aerts. Computational radiomics system to decode the radiographic phenotype. Cancer research, 77(21):e104–e107, 2017.
- [16] Kai Wang, Michael Dohopolski, Qiongwen Zhang, David Sher, and Jing Wang. Towards reliable head and neck cancers locoregional recurrence prediction using delta-radiomics and learning with rejection option, 2022.