Neutron Depolarization due to Ferromagnetism and Spin Freezing in CePd1-xRhx
Abstract
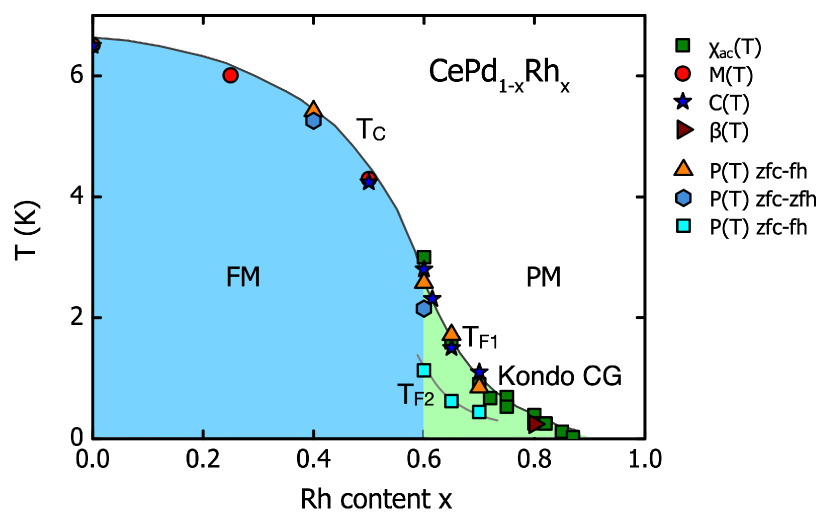
We report neutron depolarization measurements of the suppression of long-range ferromagnetism and the emergence of magnetic irreversibilities and spin freezing in CePd1-xRhx around . Tracking the temperature versus field history of the neutron depolarization, we find clear signatures of long-range Ising ferromagnetism below a Curie temperature for and a spin freezing of tiny ferromagnetic clusters below a freezing temperature for . Under zero-field-cooling/field-heating and for a reentrant temperature dependence of the neutron depolarization between and is microscopically consistent with a thermally activated growth of the cluster size. The evolution of the depolarization as well as the reentrant temperature dependence as a function of Rh content are consistent with the formation of a Kondo-cluster glass below adjacent to a ferromagnetic quantum phase transition at .
I Motivation and Outline
Quantum phase transitions (QPTs), defined as zero temperature phase transitions, represent a well-established roadmap in the search for new properties of correlated electron systemsLöhneysen et al. (2007); Senthil et al. (2004); Si and Steglich (2010); Vojta (2003, 2018). The perhaps simplest example of a magnetic QPT is associated with the suppression or the emergence of long-range ferromagnetic orderBrando et al. (2016) as a function of a non-thermal control parameter such as hydrostatic pressurePfleiderer et al. (2001); Grosche et al. (1995); Uhlarz et al. (2004); Saxena et al. (2000), an applied magnetic fieldThessieu et al. (1997); Perry et al. (2001); Paglione et al. (2003); Gegenwart et al. (2002), or chemical compositionFuchs et al. (2014); van der Marel et al. (2003). In clean materials a variety of escape routes to ferromagnetic quantum criticality have been identifiedBrando et al. (2016). For instance, the coupling of the magnetization to electronic soft modes may generically lead to a first-order QPTs Belitz et al. (2005); Brando et al. (2016); Pfleiderer (2005), or new forms of order masking the QPT such as spin density wave orderBrando et al. (2008); Abdul-Jabbar et al. (2015); Friedemann et al. (2018) or superconductivitySaxena et al. (2000); Aoki et al. (2001); Huy et al. (2007); Aoki et al. (2019); Pfleiderer (2009); Haslbeck et al. (2019). In systems featuring defects and disorder, a ferromagnetic QPT may drive the appearance of intermediate phases such as frustrated magnetism or the formation of magnetic clustersMiranda and Dobrosavljević (2005); Vojta (2010), as well as electronic phase segregationPfleiderer et al. (2010); Uemura et al. (2007); Schmakat et al. (2015); Benka et al. (2022).
An increasing number of studies suggest an intricate interplay of microscopic (atomic) and mesoscopic scales at QPTs. For instance, the temperature dependence of the electrical resistivity at the pressure-tuned quantum phase transition of pure itinerant-electron ferromagnets such as Ni3Al or ZrZn2, for unexplained reasons, is characteristic of disordered ferromagnets Niklowitz et al. (2005); Grosche et al. (1995). Related high-pressure studies in the itinerant helimagnet MnSi, connect the anomalous temperature dependence of the resistivity empirically with the presence of strongly fluctuating topological spin textures Ritz et al. (2013a, b). Moreover, microscopic studies of the ferromagnetic QPT in LaCrGe3 suggest the formation of short-range order as an escape route of ferromagnetic quantum criticality Gati et al. (2021); Rana et al. (2021). Perhaps most specific so far, recent studies of the transverse field Ising transition in LiHoF4 under small tilted magnetic fields revealed the presence of a line of mesoscale quantum criticality, i.e., purely due to magnetic domainsWendl et al. (2022). The additional presence of defects and disorder at QPT, due to the strongly enhanced (or even singular) response functions may readily generate the formation of clusters in the sub-micrometer region or strongly fluctuating ferromagnetically correlated patches akin superparamagnetism. In turn, the interplay of disorder and defects with QPT has attracted considerable theoretical interest as the cause of novel forms of quantum correlations such as quantum Griffiths phases Vojta (2010).
While it may be intuitive that mesocale textures may be important in the surroundings of QPTs, it is experimentally difficult to prove their existence and to determine their character. Namely, in bulk materials processes on mesoscopic length scales imply correlation lengths that require ultra-small angle scattering. Also, the size of such textures implies large characteristic time-scales that are difficult to determine experimentally in bulk systems. Taken together, this raises the question for experimental methods capable to provide such information. In the study reported here we explore the potential of neutron depolarization measurements to provide such information for the ferromagnetic to intermediate valent transition in the compositional series CePd1-xRhx.
Since the seminal work of Halpern and Holstein in the early 1940s Halpern and Holstein (1941), it has been known that the polarization of a neutron beam decreases rapidly when traversing a bulk material with ferromagnetic domains. Numerous studies have demonstrated a great sensitivity of the polarization to the existence of ferromagnetic domains and superconducting flux lines Rauch and Weber (1968); Drabkin et al. (1969); Maleev and Ruban (1970); Weber (1974); Rekveldt and van Schaik (1979); van der Valk and Rekveldt (1982); Mitsuda and Endoh (1985); Mirebeau et al. (1986); Rosman and Rekveldt (1990); Mirebeau et al. (1992); Rekveldt (1999); Yusuf et al. (2000); Sato et al. (2004); De Teresa et al. (2006); Rekveldt et al. (2006); Pfleiderer et al. (2010); Treimer et al. (2012a, b, 2013); Seifert et al. (2017); Deepak et al. (2021). Likewise, it is also long known that slow ferromagnetic fluctuations in the paramagnetic state can cause a depolarization of a neutron beam as wellBakker et al. (1968); Drabkin et al. (1968); Takahashi et al. (1995). Moreover, combining neutron depolarization measurements with neutron imaging, spatially resolved information may be obtained Schulz et al. (2010); Schulz (2010); Schulz et al. (2016); Jorba et al. (2019). This technique known as neutron depolarization imaging (NDI) has been used, e.g., to map out magnetic stray fields Kardjilov et al. (2008). Developing a three-dimensional reconstruction of NDI, neutron depolarization tomography has also been used to determine ferromagnetically polarized regimes Schulz et al. (2010). It is thereby important to note that the spatial resolution of the imaging and tomography is currently limited to a few hundred mikro-meters at best due to beam divergence and detector resolution. Thus, neutron depolarization measurements offer a probe that allows to distinguish the existence of ferromagnetically correlated regimes on microscopic scales (neutron depolarization) from metallurgical inhomogeneities on macroscopic scales (NDI).
The depolarization of a neutron beam depends on the spatial extent and the average magnetization of the magnetic domains generating the Larmor precession along the trajectory of the neutron beam. Given the wavelength (and hence velocity) of the neutrons this implicitly yields a characteristic time-scale, notably the time required for traversing individual domains, at which the polarization of the neutron beam is affected. In other words, a depolarization is expected when magnetized patches are (i) sufficiently large, and (ii) sufficiently long-lived, and (iii) the uniform magnetization is sufficiently large. As compared to conventional bulk and transport properties, neutron depolarization measurements provide microscopic information as inferred from the threshold of the depolarization process. This has long been appreciated, though material-specific and experimental set-up-specific details have neither been reported nor exploited.
To explore the potential of neutron depolarization measurements in studies of ferromagnetic QPTs we decided to study CePd1-xRhx Kappler et al. (1988); Kappler (1991); Sereni et al. (1993, 2005); Deppe et al. (2006); Pikul et al. (2006); Sereni et al. (2006, 2007); Westerkamp et al. (2009); Brando et al. (2010); Schmakat (2015). The rare earth compound CePd1-xRhx undergoes a ferromagnetic QPT as a function of Rh content , where ferromagnetism is continuously suppressed above Deppe et al. (2006); Pikul et al. (2006); Sereni et al. (2005, 2006, 2007). In the vicinity of the QPT an exponentially decreasing tail of the onset of ferromagnetic correlations has been observed suggestive of disorder-induced smearing. At high values of and high temperatures the magnetic properties are characteristic of strong fluctuations that gradually freeze with decreasing temperaturesWesterkamp et al. (2009). To determine the inherent length and time-scales of this freezing process and to assess the metallurgical homogeneity of CePd1-xRhx we performed neutron depolarization measurements in several compositions of intermediate Rh content. Furthermore, we investigated the effect of the magneto-crystalline anisotropy on the neutron depolarization of ferromagnetic CePd1-xRhx (), where we find well-behaved properties of an easy ferromagnetic axis.
Summarized in Fig. 1 are our main results. For all compositions studied, the onset of neutron depolarzation we observe as a function of temperature is in good agreement with data inferred from the magnetization, ac susceptibility, and specific heat in the same samples as reported previouslyWesterkamp (2008). For a Rh content up to all data consistently exhibit the characteristics of long-range ferromagnetic order. This is shown in blue shading in Fig. 1, where the Curie temperature is denoted as . In comparison, for CePd1-xRhx with all properties consistently exhibit the onset of a spin frozen state below a temperature denoted , as shown in green shading in Fig. 1. The absence of depolarization above is characteristic of a freezing of small, rapidly fluctuating clusters. The temperature and magnetic field history of the neutron depolarization reveals the absence of depolarization below a temperature under zero-field-cooling/field-heating, where roughly tracks for increasing . The pronounced reentrance of the depolarization between and under zero-field-cooling/field-heating reveals a thermally activated increase of the cluster size in the spin-frozen state. Taking into account the rapidly increasing Kondo screening for increasing , our depolarization data of the spin-frozen state reveal microscopic signatures consistent with a Kondo cluster glass (KCG) as proposed before based on the bulk propertiesWesterkamp (2008); Westerkamp et al. (2009).
The presentation of our paper is organized as follows. We begin with a pedagogical introduction to neutron depolarization measurements in Sec. III. Starting with the theory of neutron depolarization in Sec. III.1, we report estimates of the sensitivity of neutron depolarization on the length and time scales at which ferromagnetic regions begin to generate a noticeable depolarization in Sec. III.2. This is followed by key methodological aspects in Sec. III.3, where we report an experimental set up that permits to record the neutron depolarization under bipolar field sweeps needed for measurements of different temperature and field histories. In addition, we used spherical neutron polarimetry to discriminate a precessional rotation of the neutron polarization from a generic depolarization in ferromagnetic samples.
The presentation of our experimental results in Sec. IV proceeds in two subsections. We begin with the dependence of the neutron depolarization on the temperature and field history in Sec. IV.1. This is followed by the evidence for a precessional rotation of the polarization in the ferromagnetic state of a single crystal sample in Sec. IV.2, where we consider the role of the combination of magnetic anisotropy, temperature and small applied magnetic fields. In Sec. V we discuss our observations in the context of previous studies of the bulk properties and present our arguments in support of a Kondo cluster glass. Our paper closes with a summary of the main conclusions in Sec. VI.
II Introduction to
CePd and CeRh represent isotructural siblings that crystallize in the orthorhombic CrB structure. Whereas pure CePd orders ferromagnetically at Thornton et al. (1998), CeRh shows the key characteristics of a non-magnetic intermediate valent system down to the lowest temperatures studied. It has long been recognized that the substitutional series CePd1-xRhx permits to explore the evolution from ferromagnetic order to intermediate valent behavior under isostructural conditions Kappler et al. (1988); Kappler (1991); Sereni et al. (1993) in the additional presence of strong disorder Sereni et al. (2005); Deppe et al. (2006); Pikul et al. (2006); Sereni et al. (2007). Information on the spontaneous magnetic moment as extrapolated to zero temperature is, however, incomplete. In polycrystalline samples ordered moments of 0.87, 0.8 and 0.47 for , 0.25 and 0.5, respectively, have been reportedNieva et al. (1988); Sereni et al. (1993). This compares with easy axis moments along the c-axis of 1.54 and 0.5 in single crystals for and 0.6Deppe et al. (2006); Schmakat (2015), respectively, where the bulk properties are characteristic of an unchanged easy-axis anisotropy up to large Deppe et al. (2006); Brando et al. (2010).
Seminal studies have established that the evolution of the properties of CePd1-xRhx as a function of share two unusual characteristics with respect to a composition Kappler et al. (1988); Kappler (1991); Sereni et al. (1993, 2005); Deppe et al. (2006); Pikul et al. (2006); Sereni et al. (2006, 2007); Westerkamp et al. (2009); Brando et al. (2010); Schmakat (2015). On the one hand, with increasing the lattice constant decreases linearly up to , consistent with Vegard’s law, followed by a fast superlinear decrease for . On the other hand, the Weiss temperature, , as inferred from the inverse susceptibility above is negative for all . It decreases weakly up to followed by a steep decrease between and .
In the light of the intermediate valent properties of CeRh, it has been argued that the Weiss temperature reflects a mean-value of the Kondo temperature Koelling et al. (1985). Thus, above the Kondo temperature appears to increase rapidly such that it exceeds the temperature scales on which ferromagnetism is observed. This suggests that the magnetic properties for originate from a combination of intermediate valent fluctuations, Kondo screening and disorder.
As a function of increasing the suppression of ferromagnetism in CePd1-xRhx, notably the transition temperature as inferred from the bulk properties, crosses the increase of the average value of in the regime of Sereni et al. (2007); Westerkamp et al. (2009). A more detailed inspection reveals an unusual concentration dependence of the signatures of ferromagnetism for intermediate values of Pikul et al. (2006); Westerkamp et al. (2009). Namely, with increasing the curvature of is initially negative such that may be extrapolated to zero approximately around . However, as the composition approaches a change of curvature is observed at the onset of ferromagnetic correlations as inferred from pronounced maxima in . These maxima in may be discerned up to . The absence of a maximum in down to 20 mK for suggests the suppression of ferromagnetic correlations for a critical composition close to .
Associated with the change of curvature at the onset of ferromagnetic correlations is a change of the character of the processes underlying the maximum in the susceptibility around . For the bulk properties are consistent with a transition to long-range ferromagnetism. In contrast, for the maxima in the susceptibility exhibit a pronounced frequency dependence characteristic of a freezing process similar to that observed in spin glasses Westerkamp et al. (2009). We therefore denote the onset of ferromagnetism and spin freezing with and , respectively. Interestingly, in the regime of the freezing process at the relative temperature shift between 3 % an 10 % per decade of the excitation frequency overlaps with the behaviour of canonical metallic spin glasses and superparamagnets, where shifts between and are observed. In addition to the freezing seen in the susceptibility, the magnetization exhibits a small hysteresis already above , where the hysteresis is seen between zero-field-cooled/field-heated and field-cooled/field-heated temperature sweeps. In turn, the hysteresis has been attributed to the formation of ferromagnetic clusters, which freeze at .
The suppression of ferromagnetic order as well as the suppression of the underlying spontaneous magnetic moment as a function of increasing in CePd1-xRhx reflect the hybridization of the Ce 4f electrons with the valence electrons of the surrounding ligands. Consistent with the evolution of inferred from , Rh ligands in Ce compounds are known to result in much larger Kondo temperatures than observed for Pd ligands.Koelling et al. (1985) This is accompanied by strong local variations of due to the random distribution of Rh and Pd atoms. Both aspects are consistent with the entropy and the slope of at 2 K, which are suggestive of unscreened magnetic moments even when the average of exceeds several ten K.
Taken together, CePd1-xRhx differs distinctly from other strongly disordered Ce-based systems such as CeNi1-xCux, in which the Ce valence remains nearly trivalent and in which a percolative cluster scenario was proposedMarcano et al. (2007). In recognition of the broad distribution of Kondo temperatures on local scales, which are believed to be responsible for the cluster formation, the low-temperature state in CePd1-xRhx has been denoted a Kondo-cluster glass (KCG). However, this interpretation was so far empirical, without evidence of specific microscopic signatures expected of a Kondo screening.
Last but not least, the possible role of quantum correlations in CePd1-xRhx has been addressed in several studies. Namely, putative evidence of a power-law dependence in the specific heat, , with and 0.67 for and 0.9, respectively Sereni et al. (2005); Pikul et al. (2006); Sereni et al. (2007), as well as the ac susceptibility, raise the question whether near is somehow connected with an additional form of ferromagnetic quantum criticality. This is contrasted by the Grüneisen ratio , which displays a log-divergence, , as opposed to a power-law divergence expected for quantum criticality ( where represents the volume thermal expansion coefficient and the specific heat). Moreover, a power-law form of the magnetic-field dependence of the magnetization at 50 mK was reported for very large , also consistent with the absence of quantum criticality. Rather, it has been pointed out that these properties are consistent with the scenario of a quantum-Griffiths-phase. However, whereas theory predicts that the values for inferred from the specific heat and susceptibility should be the same Vojta (2009), they are found to be different experimentally, posing an unresolved inconsistency.
The properties reported so far for CePd1-xRhx consistently point at an unusual interplay of strong correlations with disorder on multiple scales Kappler et al. (1988); Kappler (1991); Sereni et al. (1993, 2005); Deppe et al. (2006); Pikul et al. (2006); Sereni et al. (2006, 2007); Westerkamp et al. (2009); Brando et al. (2010); Schmakat (2015). Namely, the bulk properties and limited microscopic information suggest the formation of ferromagnetic clusters that undergo a complex freezing process subject to a distribution of Kondo screening and thermal activation. The properties of CePd1-xRhx reported so far raise questions for the actual size of the underlying microscopic length and time scales as well as the magnetic character of the clusters. In turn this raises the question of the role of the disorder and the distribution of Kondo scales and, last but not least, the relevance of the Kondo screening in the freezing process of the clusters.
III Neutron depolarization
Neutron depolarization measurements are based on the principle of neutron radiography by means of a polarized neutron beam. Since the neutron interacts with magnetic fields via its spin, neutron depolarization measurements allow to identify and determine, within limits, spatially resolved ferromagnetic correlations in bulk materials, i.e., ordered regions such as domains or spin clusters Schlenker and Shull (1973); Schulz et al. (2016). Due to the large penetration depth of neutrons, neutron depolarization measurements allow to use complex sample environment such as cryostats, electro magnets, and pressure cells.
Examples of neutron depolarization measurements include the three-dimensional imaging of ferromagnetic domains in bulk samples Schulz et al. (2010), as well as the detection of inhomogeneous field distributions Kardjilov et al. (2008); Piegsa et al. (2009); Sales et al. (2018) as generated, e.g., by screening currents in the vicinity of superconductors or due to the flux lines penetrating superconductors Weber (1974); Treimer et al. (2012a, b, 2013); Treimer (2014). By means of neutron depolarization measurements the metallurgical homogeneity of ferromagnetic materials can be characterized when the magnetic properties vary sensitively with chemical composition and internal stress/strain Jorba et al. (2019). Moreover, measurements as a function of temperature allow to map out the distribution of the Curie temperature spatially and hence to infer compositional inhomogeneities across larger sample volumesPfleiderer et al. (2010); Schmakat (2015); Jorba et al. (2019).
In the following the basic principles of neutron depolarization are reviewed in Sec. III.1, followed by material-specific estimates of the spatial and temporal threshold for depolarization to occur in Sec. III.2. In Sec. III.3 the experimental setups used in our study are described.
III.1 Neutron depolarization in a ferromagnet
We begin with a summary of the formal description of neutron depolarization measurements of a ferromagnet focussing on a few limiting cases which are required for the interpretation of our results. For the discussion presented in the following we consider a polarized neutron beam, the polarization of which is given as
| (1) |
where , represent the intensities with respect to the polarization axis. In the following we denote the polarization of the incident neutron beam by . The neutron beam is transmitted through a ferromagnetic sample, in which it traverses a series of magnetic domains labelled with intrinsic fields . We assume further that these intrinsic fields are oriented randomly. The classical equation of motion for the neutron spin that couples to the ferromagnetic domain is given by the Larmor equation
| (2) |
where is the gyromagnetic ratio of the neutron. For constant magnetic field Eq. 2 describes a precession of the spin with respect to the direction of the field at the Larmor frequency .
Assuming an average field per domain, an average domain length in the direction of flight and infinitesimally thin domain walls the polarization in the -direction may be written as Halpern and Holstein (1941); Mitsuda et al. (1992)
| (3) |
where is perpendicular to the beam direction and parallel to the guide field (representing the quantization axis). Further, and represent the components of the magnetic field in each domain parallel and perpendicular to the direction of travel. represents the average number of magnetic domains on a neutron path through the sample and is the neutron velocity. Here the brackets denote the average over the magnetic field or the average domain size as denoted by the subscript. The argument of the cosine function corresponds to the Larmor phase collected in each domain .
Eq. 3 may be expressed analytically for some limiting cases. First, as proposed by Halpern and HolsteinHalpern and Holstein (1941), averaging over the ensemble of randomly oriented domains for small spin rotations per domain results in
| (4) |
where is the sample thickness in the direction of flight of the neutron and the magnetic flux is assumed to be temperature-dependent. The second case, where , represents a large spin rotation per domain. Eq. 3 then yields for the polarization
| (5) |
Assuming that the average domain size is constant, the depolarization is then expected to be constant below the Curie temperature .
Based on the solutions described by Eqs. 4 and 5 it may be concluded that for temperatures below the domain configuration leads to a depolarization of the neutron beam, while in the paramagnetic state the polarization is not affected. For the evaluation of our data we assumed that the magnetic field in a single domain may be described using a temperature dependence as follows
| (6) |
where represents the spontaneous magnetization in each domain, is system specific exponent, is the vacuum permeability, and is a Heaviside function that serves to account for an idealized spontaneous symmetry breaking below . For Eq. 6 corresponds to the mean field approximation for ferromagnets. In real systems a smoothed version of the step function such as a Gaussian error function may be used to represent the transition and the emergence of a finite magnetization.
In case the data are recorded with a two-dimensional detector, spatially resolved information may be obtained using Eqs. 4 and 5. This provides spatially resolved information on the magnetic ordering temperature , referred to in the following as a map.
Another limit assumes a mono-domain ferromagnetic state, i.e., the sample supports a uniform magnetization without domainsMitsuda et al. (1992). It is important to note that such a state does not cause a depolarization of a monochromatic beam (a polychromatic beam featuring a distribution of wavelengths may depolarize somewhat). Denoting the angle between the polarization and the magnetization by , Eq. 3 yields
| (7) |
If the magnetization is neither parallel nor antiparallel to the polarization ( for ) the polarization vector precesses with respect to the direction of the internal field . A seeming decrease of the polarization would then be due to a rotation of the polarization away from the direction for which the polarization is analyzed. Moreover, a change of the magnetization caused, for example, by a variation of the temperature, , or an applied magnetic field, , may result in an oscillation of the polarization due to the cosine term. This has been observed in our study of the ferromagnetic single-crystal CePd1-xRhx () as described in Sec. IV.2.
III.2 Sensitivity of neutron depolarization
In this section we present an estimate of the length- and time-scales of multi-domain ferromagnetic order at which the setup we used for our neutron depolarization study described in Sec. III.3 was able to detect a depolarization. Several publications have addressed this questionRekveldt and van Schaik (1979); van der Valk and Rekveldt (1982); Mirebeau et al. (1986); Rosman and Rekveldt (1990); Mirebeau et al. (1992); Mitsuda et al. (1992); Takahashi et al. (1995); Rekveldt (1999); Sato et al. (2004); Rekveldt et al. (2006). However, to the best of our knowledge quantitative values have not been reported before.
We consider multi-domain ferromagnetic order with an average domain size . For decreasing the Larmor phase collected in each domain eventually will no longer be sufficient to depolarize the neutron beam at a level that exceeds the resolution of the setup. This case is described by Eq. 4. Solving this equation for and replacing yields
| (8) |
where is the minimal change of polarization that may be resolved. In our setup the resolution corresponded typically to as estimated from the scatter of the data points.
Shown in Fig. 2 is an evaluation of Eq. 8 for a typical sample thickness of and different neutron wavelengths. The minimum average domain length required for a depolarization of is shown as a function of the average field in each domain. The abscissa at the top of both panels of Fig. 2 displays in units of the magnetic moment for CePd1-xRhx using a unit cell volume of approximately .Sereni et al. (2007) For order of magnitude estimates, may be inferred from the magnetization at sufficiently large magnetic fields.
Depicted in green shading is the regime, where a notable depolarization is expected. The dashed lines depict the 1 % threshold for wavelengths of and , corresponding to the wavelengths at the beam-line ANTARES available for monochromatic depolarization measurements. In comparison, the solid black line represents a calculation for a polychromatic spectrum ranging from to as available at the beam-line ANTARES and used in the setup shown in Fig. 3 (a).
With increasing the average size of the domains, , that may be detected decreases as shown in Fig. 2 (a). The ordinate on the right hand side of Fig. 2 (a) represents the wave vector associated with . Remarkably, for strong ferromagnets the neutron depolarization is sensitive to ferromagnetic domains down to the sub-nm scale. For instance, the unscreened magnetic moment of CePd1-xRhx of Pikul et al. (2006) as marked in Fig.2 (a) by a vertical gray line, implies a spatial sensitivity of for the experimental setup shown in Fig. 3 (a). In turn, if the average size of ferromagnetic spin clusters exceeds a depolarization larger than is expected.
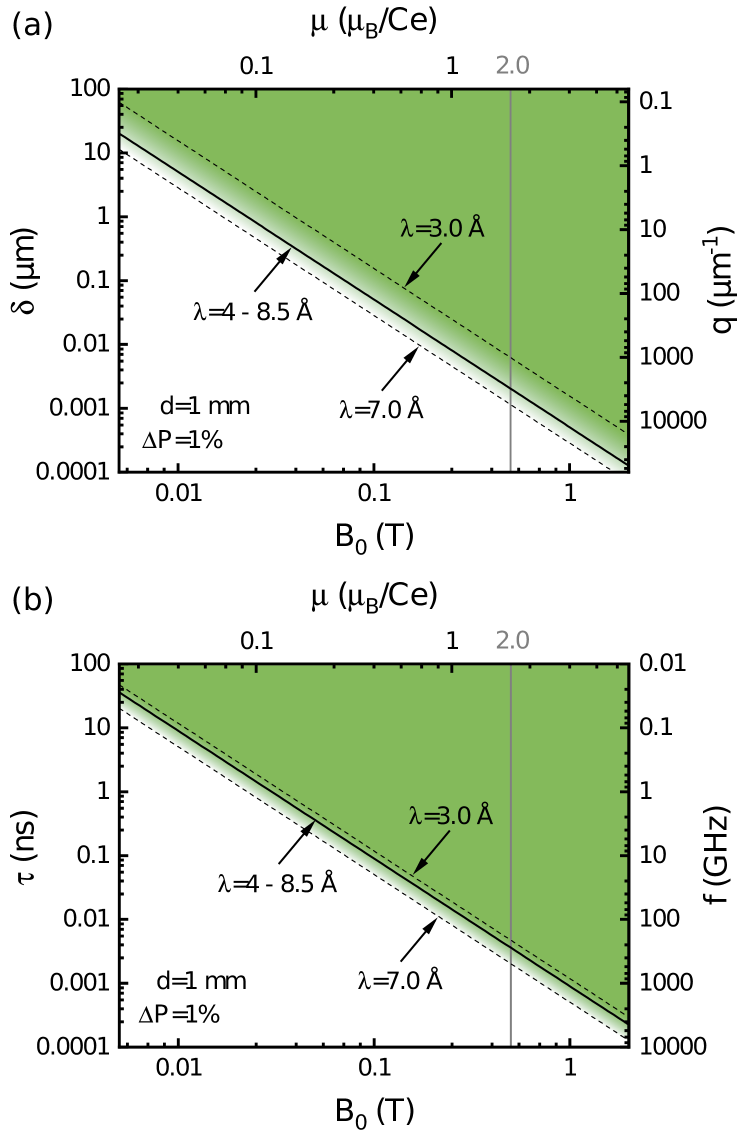
It is important to emphasize that the magnetic domains do not need to be static for a depolarization to occur. Rather, the lifetime of the domains must exceed the time, , needed by the neutron to travel across the domains given by , where is the neutron velocity. As shown in Fig. 2 (b) typical time scales are of the order of ns, which decreases rapidly with increasing . The ordinate on the right hand side of Fig. 2 (b) represents an associated frequency in the spirit of a fluctuation rate, say, in a superparamagnet. For large the neutron depolarization measurements are sensitive to ferromagnetically correlated regimes that fluctuate at a time-scale less than pico-seconds. Interestingly, in real materials this corresponds to the time scale of the movement of domain walls at distances that are typical of domain sizes. In turn, this implies that the effective field seen by the neutron does not need to be static on time scales exceeding .
Taken together, these considerations highlight the potential of neutron depolarization measurements as a probe of ferromagnetic textures that fluctuate on a nm scale in the sub-ns regime. The temporal resolution associated with the unscreened moment of CePd1-xRhx of Pikul et al. (2006) for the experimental setup shown in Fig. 3 (a) as marked by a gray line in Fig.2 (b) corresponds to .
III.3 Experimental setups
For our studies it proved to be essential to record data under different temperature versus field histories. Before turning to an account of the terminology used in our paper, we note that the expression ”zero-field” implies the nominal presence of a guide field of roughly 0.5 mT required to maintain the polarization of the neutron beam. Keeping this in mind, we distinguish the following temperature versus field histories, noting that all data were collected while heating the sample at the same constant rate in order to avoid systematic errors of the sample temperature recorded. First, data recorded after cooling in zero-field (zfc) while heating in zero-field are denoted zfc-zfh (zero-field-cooled - zero-field-heated). Second, data recorded after cooling in zero-field to base temperature and the application of a finite field while heating under this applied magnetic field are denoted zfc-fh (zero-field-cooled - field-heated). Third, after cooling the sample in the presence of a magnetic field applied at sufficiently high temperatures of several K, data were recorded while heating the sample in the same unchanged applied magnetic field. This is denoted fc-fh (field-cooled - field-heated).
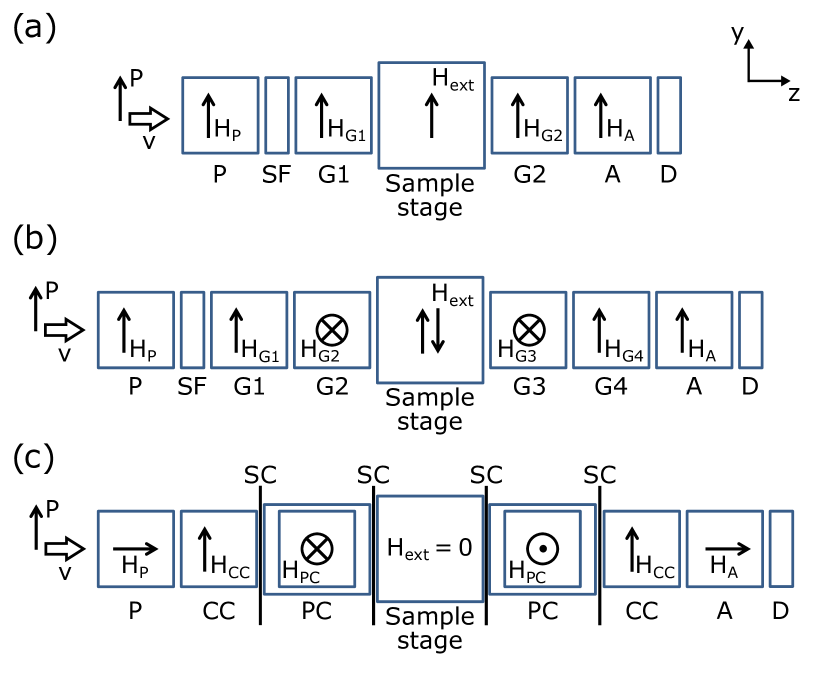
The neutron depolarization measurements were carried out at the beamline ANTARES at FRM IICalzada et al. (2009); Schulz and Schillinger (2015). A schematic depiction of the setup used initially at ANTARES is shown in Fig. 3 (a). Polarized 3He spin filter cells were used for polarizing and analyzing the neutron beam in the -direction which is perpendicular to the neutron beam denoted as -direction. A spin flipper located directly after the polarizer allowed to change the polarization direction from to . This was required for the polarization analysis. Tiny guide fields between the components prevented the loss of polarization, otherwise expected in low-field field regions, where parasitic external magnetic fields dominate. Coarse neutron wavelength selection was achieved by means of a Beryllium filter, resulting in a rather broad wavelength band from to . The neutron detector used was based on a LiF/ZnS scintillator, which converted the neutrons into visible light that was detected by a high resolution CCD camera. A large part of the data reported in Sec. IV were measured using this setup.
Following our first measurements we modified this setup to permit studies of different temperature versus field histories. This required a setup that permitted measurements under arbitrary positive or negative magnetic field strengths. As explained above, true zero-field conditions are very difficult to achive and even small stray fields will cause a severe depolarization of the neutron beam. Therefore, we used small guide fields around the sample position in order to stabilize the polarisation axis.
To satisfy these conditions we installed two additional guide fields pointing in the -direction. As indicated in Fig. 3 (b) these guide fields were placed immediately before and after the Helmholtz coils. This way an adiabatic rotation of the polarization into the horizontal plane was realized that allowed to apply magnetic fields along the positive and the negative -direction by means of the Helmholtz pair without an undefined zero-field transition along the neutron path that would cause a severe depolarization of the neutron beam. Moreover, a neutron velocity selector was installed and the 3He polarizers were replaced by polarizing V-cavities. In these experiments we used a neutron wavelength of with a wavelength spread of given by the velocity selector. Further details of this setup may be found elsewhereSeifert et al. (2017); Jorba et al. (2019); Schmakat (2015).
For all of our neutron depolarization measurements the samples were cooled to temperatures as low as by means of bespoke 3He/4He dilution insert as combined with a pulse tube cooler. Magnetic fields were generated with a pair of Helmholtz coils operated at room temperature.
In addition, spherical neutron polarimetry was carried out using CryoPAD at the beam-line POLI at FRM II Hutanu et al. (2016), where a schematic depiction of the setup is shown in Fig. 3 (c). The implementation of coupling coils, precession coils, and magnetic shielding of the sample position permitted a complete determination of the three-dimensional polarization matrix. However, it was not possible to obtain spatially resolved information across the sample because a 3He tube had to be used as a neutron detector. A detailed description of the setup may be found elsewhereHutanu et al. (2016).
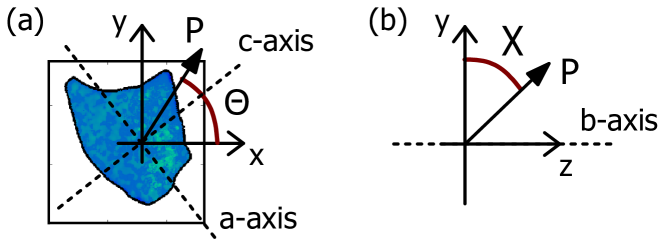
Shown schematically in Fig. 4 is the coordinate system as well as the outline and orientation of the CePd1-xRhx single crystal as investigated at POLI. In the following the direction of the neutron polarization is denoted by the polar angles and , where the angle was measured clock-wise in the -plane and corresponded to the -direction. The angle was measured in the -plane starting at in the -direction.
In our studies we adjusted and analyzed the polarization always in the same direction to be able to distinguish a generic depolarization from a spherical rotation of the direction of the polarization. Therefore, both nutator angles and both angles as determined by the precession coils were always kept the same. Finally, the single crystal sample was oriented such that the crystallographic -plane corresponded to the plane perpendicular to the neutron beam and thus the -plane in the coordinate system used to account for the polarization. The magnetic easy axis of the system, which corresponded to the crystallographic -axis, hence resided in this plane.
The resistivity, ac susceptibility, magnetization, and specific heat of the CePd1-xRhx samples we investigated in our neutron depolarization measurements were examined rather comprehensively prior to our study as reported elsewhere Deppe et al. (2006); Westerkamp (2008); Sereni et al. (2007). Details of the sample preparation may be found in these papers. All samples were poly-crystals with the exception of the sample with which was a single crystal.
IV Experimental results
The presentation of the experimental data is organized in two parts. It begins with the dependence of the neutron depolarization on the temperature and field history in Sec. IV.1 for a wide range of compositions. This is followed by the variation of the neutron depolarization due to the magnetic anisotropy in single-crystal CePd1-xRhx for the ferromagnetic composition in Sec. IV.2.
IV.1 Dependence of the neutron depolarization on temperature and field history
Data reported in the following were recorded at the beam-line ANTARES using the setups shown in Fig. 3 (a) and 3 (b). Shown in Figs. 5 (a1), (b1) and (c1) are maps across the sample cross-section of the samples with , , and as inferred from the temperature dependence of neutron depolarization imaging. As reported above, the expression zero-field refers to a very small field required as a guide field to maintain the neutron polarization. Color bars indicate the transition temperatures while the thin black lines denote the outline of the sample shape.
Shown in Figs. 5 (a2), (b2) and (c2) are the corresponding histograms of the distribution of ordering temperatures across the map. The distribution of transition temperatures was fitted with a Gaussian where the values shown in the histograms represented the average value of , and the asscoiated FWHM, . Namely, we found , , and .
With increasing , values of and decrease in excellent agreement with the properties inferred from the bulk properties reported in the literature as shown in Fig. 1. As and decrease with increasing the FWHM increases. This trend may be explained with an increase of the effects of disorder. Moreover, the sample with was a single-crystal as compared to the poly-crystalline nature of the samples with and . It might also reflect the vicinity to the QPT and the concomitant increase of the susceptibility to form ferromagnetic clusters.
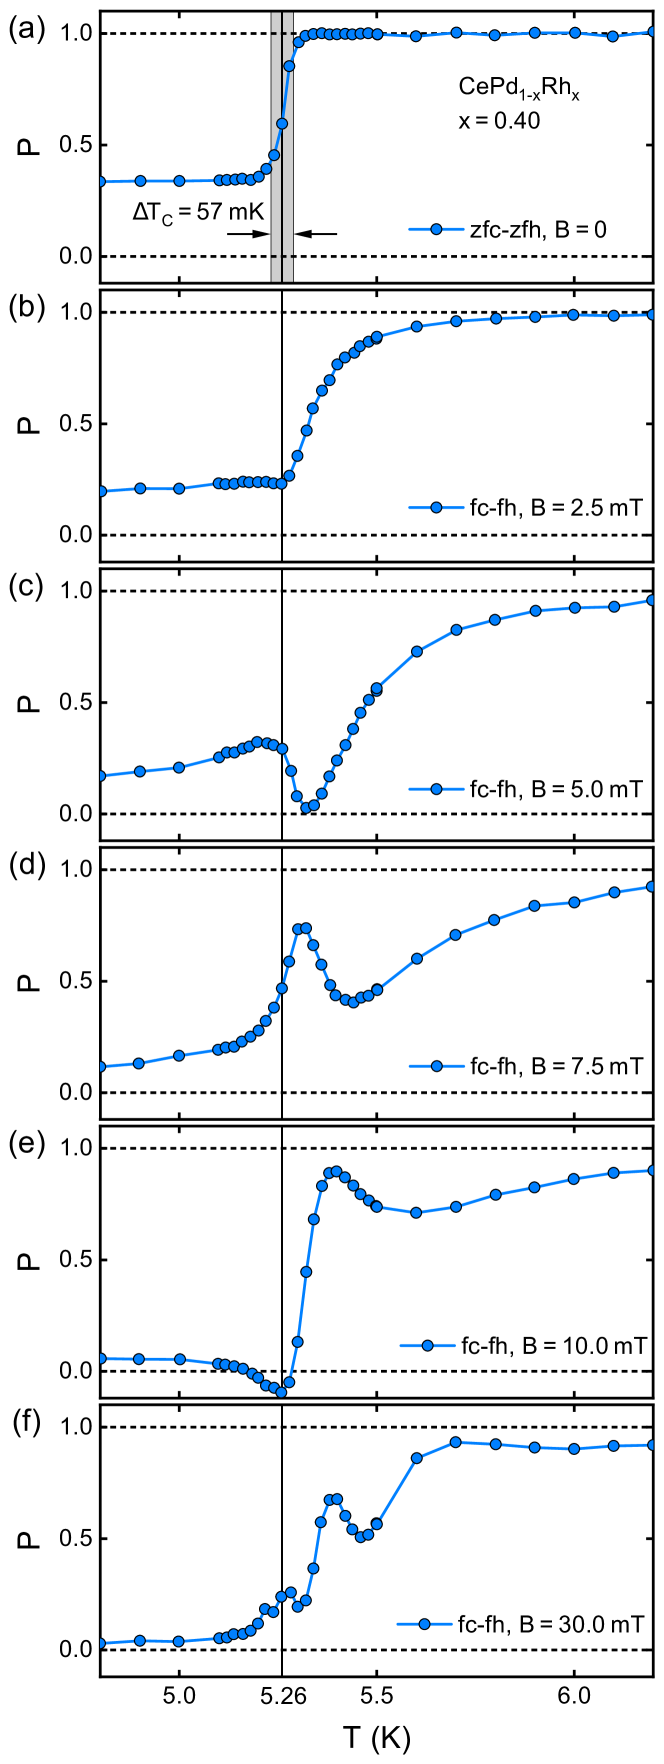
Shown in Fig. 6 is the polarization as a function of temperature for , , and as observed in different temperature versus field histories. The emphasis is here on the effects of the field strength, where the polarization represents an average of a pixel region in the center of each sample. Data under an applied field were recorded for , , and (zfc-fh and fc-fh). For comparison also shown are data recorded for zfc-zfh.
The zfc-zfh data recorded in the sample with shows a sharp drop of the polarization at consistent with spontaneous ferromagnetic order forming large domains in zero field or in the presence of small applied magnetic fields as described by Eq. 5. The spontaneous depolarization under zfc-zfh sets in at a well-defined transition temperature and saturates rapidly below . For increasing applied magnetic field a small broadening is observed at while the strength of the depolarization increases slightly.
In comparison to the sample with the temperature dependence under zfc-zfh for displays only a weak and gradual decrease just below consistent with small domains and/or weak internal fields as described by Eq. 4. Here the size of the depolarization increases remarkably under fc-fh in a small field of . When further increasing the magnetic field the temperature dependence qualitatively and quantitatively changes only slightly.
For the depolarization below almost vanishes under zfc-zfh. This suggests that spontaneous correlations are virtually suppressed for this Rh concentration on the scales sensitive to neutron depolarization, i.e., the magnetic properties must be featuring very small domains or clusters which are spatially separated from each other. Alternatively, the zfc-zfh data for may reflect a strongly fluctuating state. Yet, in the presence of a small applied magnetic field a noteable depolarization is observed consistent with a weak form of ferromagnetism. This suggests that a small applied field stabilizes a ferromagnetic character on length and time scales sensitive to neutron depolarization. We will return to this point in Sec. V.
The pronounced depolarization below a characteristic temperature observed under zfc-zfh and fc-fh is contrasted by a pronounced reentrance of the polarization observed under zfc-fh as illustrated in Fig. 7 for . For ease of comparison also shown in Fig. 7 are the data recorded under zfc-zfh and fc-fh at shown in Fig. 6. The key signature observed under zfc-fh at with decreasing temperature concerns a recovery of the polarization at a temperature well below . For the compositions exhibiting a well defined initial decrease of the polarization under fc-fh, the reentrant behaviour is only observed for and . For the reentrance is almost absent with a tiny recovery of polarization below .
Finally, above a critical concentration around no significant spontaneous depolarization is observed under zfc-zfh as a function of temperature. Nonetheless sizeable reentrant behaviour under zfc-fh is still observed, as shown in Fig. 7 for . Thus the reentrant behaviour under zfc-fh prevails as a key signature of the magnetic properties up to high Rh concentrations. Moreover, when taken together with the data recorded for and we observe a decrease of with increasing that roughly tracks the decreases of .
IV.2 Variation of the neutron polarization due to magnetic anisotropy
An important facet of the interpretation of the neutron polarization concerns the difference between a generic depolarization and a possible spherical rotation of the direction of the polarization. Such a rotation may be caused by the magnetic anisotropy of the material. Previous studies of the magnetization of CePd1-xRhx are consistent with an easy magnetic -axis Deppe et al. (2006). To follow up on the role of the magnetic anisotropies at zero magnetic field, we tracked the anisotropy of the depolarization as determined at the instrument POLI at FRM II using the 3D polarization analysis device CryoPAD.
Our measurements were performed on the single-crystalline sample with . This represents a composition for which the bulk properties provide unambiguous evidence of long-range ferromagnetism consistent with the neutron depolarization reported above. The orientation of the sample with respect to the coordinate system of the instrument is illustrated in Fig. 4. The ac-plane of the sample was oriented in the xy-plane of the coordinate system of the instrument, with an angle of approximately between the crystallographic c-axis and the y-axis of the set-up. The polarization as a function and are shown in Fig. 8 (a) and 8 (b), respectively. Both angular dependences confirm that the polarization was equal to one and constant above as expected for the paramagnetic state. Below the transition temperature a sinusoidal variation was observed as a function of and . The variation in was much weaker than the variation in which underlines the fact that the easy axis of the magnetization was almost perpendicular to this crystallographic plane.
In the angular scan of there was also a small additional oscillation which suggests that the surface at which the sample was attached to the sample holder, i.e., the crystallographic ac-plane, was not oriented perfectly perpendicular to the neutron beam. Two well-defined minima and maxima were observed for a complete angular scan of the polarization vector. The maxima correspond to the case where the easy axis of the magnetization (in this case the crystallographic c-axis) was almost parallel or anti-parallel to the polarization vector. The minima correspond to a maximum in depolarization where the polarization vector was almost perpendicular to the preferred magnetization axis.
The small amount of depolarization for the case when the polarization was parallel or antiparallel to the anisotropy axis suggests that the magnetic domains were dominantly aligned parallel or antiparallel to the c-axis. For such a regular pattern of domains a depolarizing effect may still be expected due to a finite beam divergence resulting in slightly different neutron path lengths across the sample.
It is in particular instructive to explore the interplay of an applied magnetic field with the effects of magnetic anisotropy, domain populations, neutron depolarisation and spherical precession of the polarization. Namely, the application of a magnetic field results in an effective internal magnetic field that changes the ratio of the domain populations. Moreover, for a small applied magnetic field the internal field will point along the easy axis, even if the easy axis is not parallel to the applied field.
As the Larmor phase collected by the neutrons depends on their wavelength, a polychromatic beam such as that used in the setup shown in Fig. 3 (a) naturally depolarizes when it precesses in a magnetic field. In contrast, for a monochromatic beam featuring a narrow wavelength band the polarization decreases by a few percent only even after several Larmor precessions. If, in addition, the strength of changes due to changes of the magnetization, the total Larmor phase will change also. This finally causes oscillations in the polarization when the magnetization varies monotonically as a function of temperature or the applied magnetic field. In summary, we expect oscillations in the polarization when three conditions are fulfilled: (i) The magnetization of the sample changes, (ii) a monochromatic neutron beam is used, and (iii) the easy axis is not parallel to the polarization.
The polarization observed at POLI in a single-crystalline sample suggests that the magnetic domains in CePd1-xRhx () dominantly support a magnetization along the easy magnetic c-axis of the material characteristic of a 3d Ising ferromagnet and consistent with the magnetization Deppe et al. (2006). At zero magnetic field the populations of up and down domains are equal such that the integrated internal field vanishes, . In the presence of an applied magnetic field this ratio changes according to the internal field. The precession of the polarization with respect to the internal field may then be described by Eq. 7 where is replaced by . If changes, e.g., due to changes of the applied magnetic field or changes of the magnetization as a function of temperature, and if the angle between the polarization and the internal field is finite, the cosine part of Eq. 7 causes oscillations in the polarization. These oscillations were observed both in temperature and field scans slightly above the Curie temperature . At lower temperatures the strong depolarization prevents the appearance of oscillations.
Mathematically this effect may be described by a multiplication of Eq. 5, recognizing that the sample is strongly ferromagnetic, and Eq. 7. To account for the finite distribution of Curie temperatures across the sample, the Heaviside function is replaced by an error function centred at
| (9) |
which varies between and 1. The parameter represents the slope at such that
| (10) |
represents the half-width, , of the distribution of . The polarization in the presence of a magnetic anisotropy, i.e., an angle between the easy axis and the crystallographic c-axis, is then given by
| (11) |
Experimental evidence for this behavior may be observed in the single-crystal with using the setup illustrated in Fig. 3 (b). Data were recorded at the beam-line ANTARES after a major instrument upgradeCalzada et al. (2009); Schulz and Schillinger (2015) in which an additional neutron velocity selector was installed to monochromatize the beam. For the measurements reported here the crystal was oriented with the crystallographic c-axis under an angle of approximately with respect to the polarization of the incident beam.
Shown in Fig. 9 is the polarization as a function of temperature across the phase transition at . Under zfc-zfh, shown in Fig. 9 (a), a sharp drop of the polarization was observed at in agreement with the data shown in Fig. 6. Also, the width of the transition of compares well with the maps shown in Fig. 5.
In comparison, the temperature dependence of the polarization became more complex under fc-fh as recored in various applied magnetic fields between and , shown in Figs. 9 (b) through 9 (f). In a small applied field of the onset of the decrease of the polarization shifted to higher temperatures and exhibited considerable broadening. Similar behavior was observed in several neutron depolarization measurements reported in the literature Bakker et al. (1968); Drabkin et al. (1968); Rauch and Weber (1968); Drabkin et al. (1969); Maleev and Ruban (1970); Mitsuda and Endoh (1985); Endoh and Ishikawa (1986), which were attributed to a change of the temperature dependence to the slowing down of ferromagnetic fluctuations close to , such that they satisfy the conditions for depolarizing the neutron beam.
Further, when increasing the applied magnetic field oscillations in the polarization as a function of temperature emerged close to . These oscillations may be explained by a precession of the polarization with respect to the effective internal field comprising the interplay of the magnetization under the applied magnetic field and the easy magnetic axis of the sample. This interpretation is corroborated by the observation of a polarization that is nominally negative for which cannot be accounted for by a depolarization alone.
Similar oscillations of the polarization were also observed in magnetic field sweeps. As explained above, the setup shown in Fig. 3 (b) allowed to measure the polarization in bipolar field cycles. Shown in Fig. 10 is the polarization as a function of applied field between and at various temperatures below and above for the single-crystal sample with . Rough fits of the data illustrating the frequency and amplitude of the oscillations were extracted using a gaussian-damped cosine function.
Already at , shown in Fig. 10 (a), a pronounced oscillation may be discerned, i.e., well above . The frequency of the oscillation increases with decreasing temperature, consistent with an increase of the internal field. The amplitude of the oscillation is damped for increasing magnitude of the applied field due to the finite wavelength spread of the neutron beam. This effect compares with similar behaviour seen, e.g., in neutron spin-echo measurements Franz et al. (2019). The oscillation is smeared out below where a small applied magnetic field of is already sufficient to completely depolarize the neutron beam, i.e., , as shown in Fig. 10 (e).
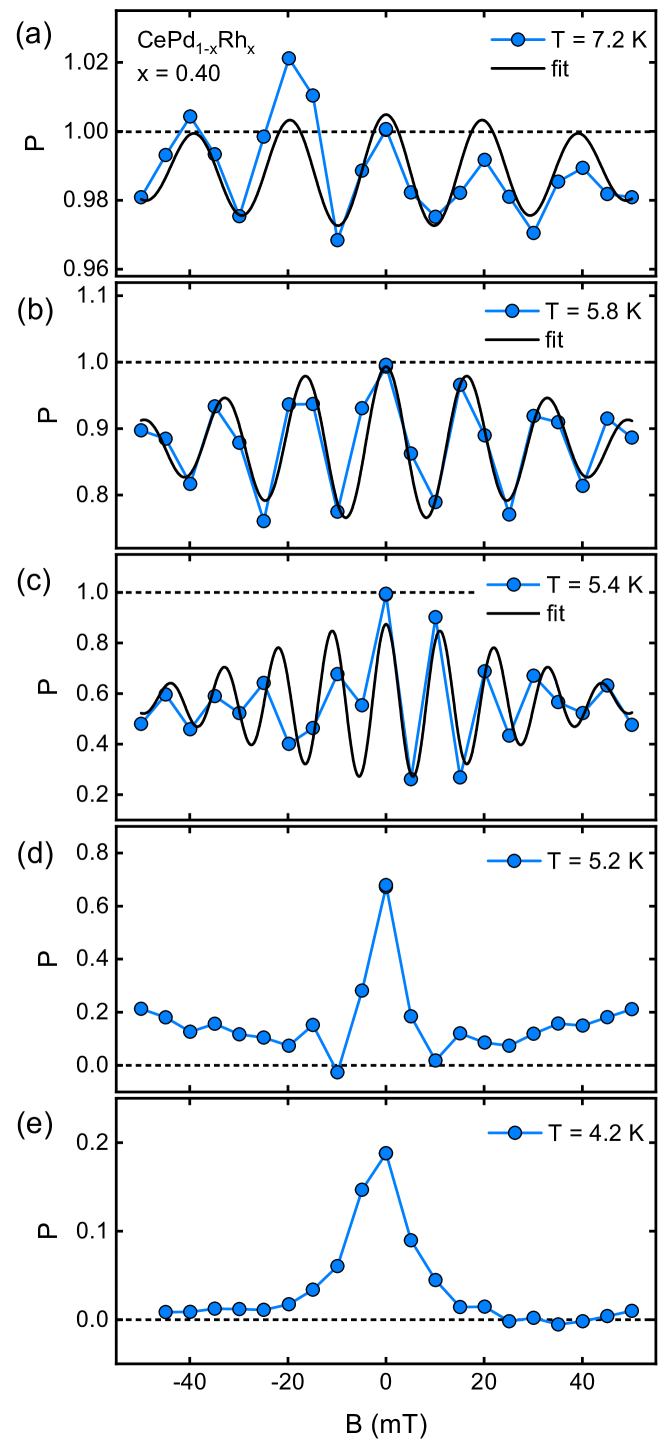
A direct comparison of Eq. 11 with the temperature dependence observed experimentally is not satisfactory due to the large number of parameters and the lack of information of the precise temperature dependence of the magnetization . In contrast, an evaluation of the magnetic field dependence is possible as the depolarization term stays constant and the field-dependence of the magnetization is roughly linear in small applied magnetic fields. In turn, this permits to infer the angle between and the polarization as a function of temperature as shown in Fig. 11.
With increasing temperature above the angle decreases. As the magnetic anisotropy inferred from the bulk properties is unchanged up to Westerkamp (2008) the temperature dependence may be attributed to the decrease of the easy-axis susceptibility and the associated decrease of the life-time of fluctuations in the paramagnetic state vis a vis with the time needed of a neutron to traverse the regime of a fluctuation. As depolarizing effects decrease with increasing temperature above , the combination of these time-scales may be effectively viewed in terms of a magnetic field causing dominantly a rotation of the polarization direction.

V Discussion
For the interpretation of our experimental results it is helpful to recall at first the notions and terminology used in conventional spin freezing processes starting from a paramagnetic state. In so-called canonical spin glasses the separation and interactions between the spins are sufficiently small, such that the frozen state is characterized by an ensemble of essentially randomly oriented, uncorrelated microscopic spins. In systems with a larger density of spins and larger interactions, clusters of correlated spins may form under decreasing temperature. The associated frozen state is commonly dubbed a cluster glass. Finally, in the limit of strongly interacting densely packed spins, correlated regimes may form that behave essentially like very large macroscopic spins and the behaviour is referred to as superparamagnetism. For completeness we note that spin-frozen states which emerge from long-range ordered states are referred to as a reentrant spin glass – a misleading expression as the long-range ordered state actually exhibits the reentrant temperature dependence.
Regardless of the precise character of the spin-frozen state, neutron depolarization is expected if the same threshold conditions are satisfied as in a multi-domain ferromagnet. To distinguish long-range ferromagnetism from a spin-frozen state is, in turn, not straight-forward and requires consideration of further information such as the bulk properties. In particular, apart from quantitative differences of the size of the depolarization, the onset of the depolarization will be insensitive to the precise magnetic field and temperature history. The former depends on the precise alignment of the domains, whereas the latter depends on the interactions and the size of the correlated regimes.
Further, it is also important to distinguish a generic depolarization from the rotation of the polarization axis. Both effects may be present simultaneously as reported in the literature, e.g., for Ni and observed in our study of CePd1-xRhx for . This compares with Fe1-xCrx Benka et al. (2022), where a pronounced depolarization was recently reported deep in the paramagnetic state far above the freezing temperature observed in the bulk properties. In this context we also wish to note that reentrant spin glasses may exhibit a depolarization for all temperatures below the onset of sufficiently strong ferromagnetic correlations. If the long range ordered state is ferromagnetic the depolarization may start below the Curie temperature and prevail unchanged into the spin glass regimeBenka et al. (2022). If, in contrast, the long-range ordered state is antiferromagnetic, a depolarization may only be expected below the spin-glass temperature.
We turn now to the evolution of the nature of ferromagnetic correlations in CePd1-xRhx as a function of increasing Rh content , which is the result of several microscopic interactions. Notably, magnetic moments develop with decreasing temperature that interact by virtue of an exchange coupling. Crystal electric fields and spin-orbit coupling partly quench the magnetic moments and introduce magnetic anisotropies. The Kondo effect results in an additional screening of these moments and changes of the concomitant interactions. As a function of increasing Rh content the spontaneous moment at zero temperature decreases from an almost unscreened large value for . Both the change of the lattice constant and the concomitant decrease of the density of states at the Fermi level, as well as the increase of the Kondo screening under increasing Rh content control the suppression of ferromagnetism.
For all CePd1-xRhx samples studied we observe neutron depolarization. Up to even a spontaneous depolarization under zfc-zfh conditions is observed. This provides unambiguous microscopic evidence of the ferromagnetic character of the spin correlations up to , the largest value studied. In addition, the maps depicted in Fig. 5 show that the distribution of the ordering temperature varies only slightly over the sample cross-section with well-defined ordering and/or freezing temperatures. The samples are hence metallurgically homogeneous on macroscopic scales. This confirms that bulk properties like the magnetization reflect intrinsic behavior.
The onset of the neutron depolarization at / is in excellent agreement with the ordering/freezing temperature observed in the bulk properties. The behaviour at / does not depend on the temperature and field history, apart from a small broadening at for . Indeed, for the strong easy-axis ferromagnetism causes a Larmor rotation of the polarization even well above the Curie temperature, whereas a pronounced depolarization is observed below . The properties of the ferromagnetically ordered compositions are, hence, perfectly consistent with an Ising ferromagnet without noticeable evidence of disorder, e.g., such as depolarization above . This provides an important point of reference for the emergence of the reentrant and glassy behaviour near quantum criticality.
For the agreement of observed in the depolarization and the bulk properties contrasts the observation of a small but finite hysteresis in the magnetization for that has been attributed to the formation of clustersWesterkamp et al. (2009). The absence of depolarization above thus shows that the size and the life-time of the clusters inferred from the magnetization must be tiny and below the threshold of depolarization, consistent with a decrease of the ordered moment and the interactions under increasing Rh content. The behaviour we observe in CePd1-xRhx contrasts that observed in the superparamagnetic regime of Fe1-xCrx where a sizeable depolarization is observed well above the freezing temperature Benka et al. (2022). It underscores the formation of a cluster glass at in CePd1-xRhx, however, consisting of tiny clusters.
A highly unconventional property emerges, finally, under zero-field-cooling/field-heating. All samples with exhibit a pronounced reentrance of the depolarization between and . In fact, even the ferromagnetic single-crystal with displayed a reentrance at , though barely noticeable. Here it may be helpful to note that the reentrant temperature dependence of the depolarzation under zfc-fh cannot be the signature of a reentrant spin-glass. Rather, the lack of depolarization up to under zero-field-cooling/field-heating implies that the clusters which undergo a freezing at must be tiny in the absence of an applied field. This is consistent with the absence of a depolarization above despite the presence of hysteresis in the magnetization.
Yet, the applied magnetic field of 7.5 mT under which reentrance is observed is small, and the energy scale associated with the applied field corresponds to a temperature of several hundred milli-Kelvin. The Zeeman energy of the applied magnetic field is hence roughly consistent with the values of . Thus, when heating the sample in a small applied magnetic field after zero-field-cooling, a thermally activated formation of clusters may take place at , where the resulting clusters are sufficiently large to generate a sizeable depolarization.
Considering the combination of energy scales in CePd1-xRhx mentioned above, it is instructive to discuss the possible origin of the small size of the clusters at zero magnetic field that undergo the spin freezing at . Experimentally we find that the freezing temperature and the reentrance temperature decrease with increasing and roughly track each other. As a function of increasing Rh content, this is consistent with the reduction of the spontaneous magnetic moment and the strength of the interactions, as well as the steep increase of the Kondo screening and the distribution of Kondo temperatures for . Namely, as the moment decreases the freezing temperatures decrease, empirically suggesting that the additional Kondo screening above controls the small size of the clusters.
The setup shown in Fig.3 (a) yields detection thresholds of and for an unscreened moment of in CePd1-xRhx as discussed in Sec. III.2. However, ferromagnetic fluctuations in this parameter regime and on this time scale are not plausible based on the bulk properties and the value of . Therefore, we attribute the change in polarization at to an increase of the average size of the clusters.
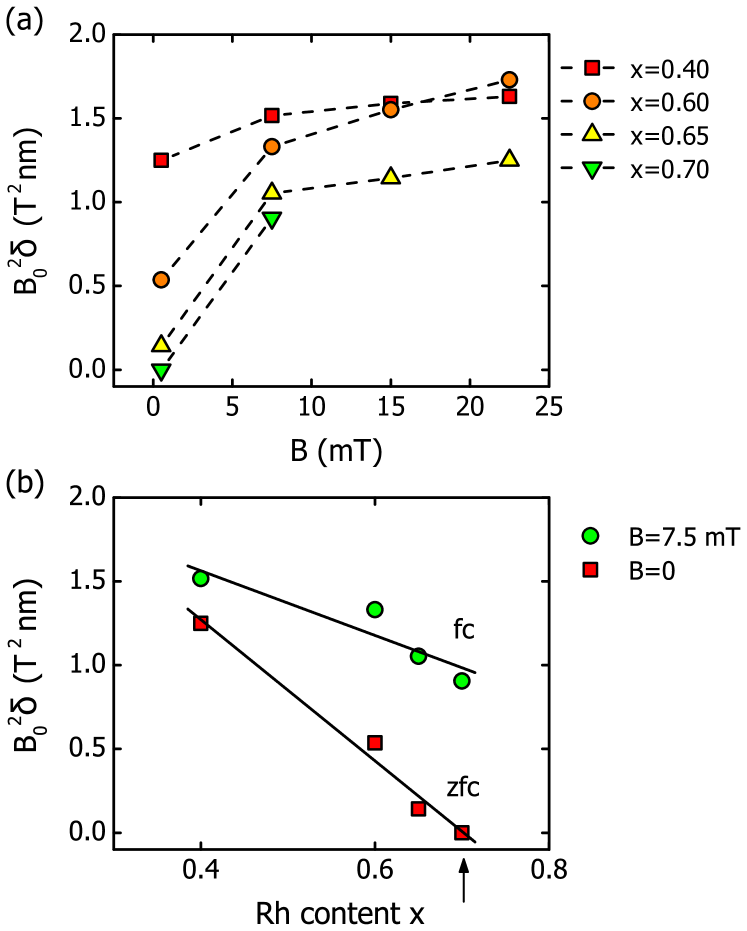
Fitting the depolarization shown in Fig. 6 with Eq. 4, typical values of may be inferred, i.e., the average field per domain squared times the average domain size . Shown in Figs. 12 (a) and 12 (b) is the extrapolated zero-temperature limit of as a function of the applied field and the Rh concentration , respectively. Under small applied magnetic fields increases significantly. The absolute values of as compared to the applied magnetic field suggest that this may be attributed to a thermally activated increase of the average cluster size. The broad distribution of Kondo temperatures at large values of support this suggestion. Likewise, decreases as a function of increasing Rh content, as expected when approaching the intermediate valent properties of CeRh.
The average size of the clusters may, finally, be estimated when taking into account the magnetic moment of CePd1-xRhxNieva et al. (1988); Sereni et al. (1993); Schmakat (2015); Deppe et al. (2006). In the field-cooled state the cluster size decreases continuously from a value exceeding to when the Rh concentration increases from to 0.7. Under zero-field-cooling decreases from to a value below the detection threshold. This is consistent with basic estimates of the cluster size of approximately 5 spins in the tail region of the phase diagramWesterkamp (2008).
VI Conclusions
In conclusion, we have carried out neutron depolarization measurements of ferromagnetism and spin freezing in CePd1-xRhx. We find clear signatures of ferromagnetic correlations up to a Rh concentration of , where the 3D polarization analysis of a single crystal with underscores well behaved long-range ferromagnetic order. The ordering and freezing temperatures are in good agreement with the bulk properties. A reentrant temperature dependence of the depolarization under zero-field-cooling/field-heating of the Rh compositions featuring spin freezing reveals thermally activated cluster growth in the spin-frozen state. The sensitivity of our setup and the estimated size of the ferromagnetic correlations provide microscopic information consistent with the formation of a Kondo cluster glass, initially proposed on the basis of the bulk properties.Westerkamp et al. (2009); Westerkamp (2008) The Kondo cluster glass emerges adjacent to a ferromagnetic QPT. Taken together, our observations in CePd1-xRhx underscore the potential of neutron depolarization as a microscopic probe of ferromagnetic quantum phase transitions and concomitant escape routes.
Acknowledgements.
We wish to thank Peter Böni for fruitful discussions and the team at the beamline ANTARES for support with our experiments. This work has been funded by the Deutsche Forschungsgemeinschaft (DFG, German Research Foundation) under FOR960 (Quantum Phase Transitions), TRR80 (From Electronic Correlations to Functionality, Project No. 107745057) and the excellence cluster MCQST under Germany’s Excellence Strategy EXC-2111 (Project No. 390814868). Financial support by the European Research Council (ERC) through Advanced Grants No. 291079 (TOPFIT) and No. 788031 (ExQuiSid) is gratefully acknowledged. M.S., P.S., and P.J. acknowledge financial support through the TUM Graduate School.References
- Löhneysen et al. (2007) v. Hilbert Löhneysen, Achim Rosch, Matthias Vojta, and Peter Wölfle, “Fermi-liquid instabilities at magnetic quantum phase transitions,” Reviews of Modern Physics 79, 1015–1075 (2007).
- Senthil et al. (2004) T. Senthil, M. Vojta, and S. Sachdev, “Weak magnetism and non-Fermi liquids near heavy-fermion critical points,” Physical Review B 69, 035111 (2004).
- Si and Steglich (2010) Q. Si and F. Steglich, “Heavy Fermions and Quantum Phase Transitions,” Science 329, 1161–1166 (2010).
- Vojta (2003) M. Vojta, “Quantum phase transitions,” Rep. Prog. Phys. 66, 2069 (2003).
- Vojta (2018) M. Vojta, “Frustration and quantum criticality,” Rep. Prog. Phys. 81, 064501 (2018).
- Brando et al. (2016) M. Brando, D. Belitz, F. M. Grosche, and T. R. Kirkpatrick, “Metallic quantum ferromagnets,” Reviews of Modern Physics 88, 025006 (2016).
- Pfleiderer et al. (2001) C. Pfleiderer, S. R. Julian, and G. G. Lonzarich, “Non-Fermi-liquid nature of the normal state of itinerant-electron ferromagnets,” Nature 414, 427 (2001).
- Grosche et al. (1995) F.M. Grosche, C. Pfleiderer, G.J. McMullan, G.G. Lonzarich, and N.R. Bernhoeft, “Critical behaviour of ZrZn2,” Physica B: Condensed Matter 206–207, 20 (1995).
- Uhlarz et al. (2004) M. Uhlarz, C. Pfleiderer, and S. M. Hayden, “Quantum Phase Transitions in the Itinerant Ferromagnet ZrZn2,” Physical Review Letters 93, 256404 (2004).
- Saxena et al. (2000) S. S. Saxena, P. Agarwal, K. Ahilan, F. M. Grosche, R. K. W. Haselwimmer, M. J. Steiner, E. Pugh, I. R. Walker, S. R. Julian, P. Monthoux, G. G. Lonzarich, A. Huxley, I. Sheikin, D. Braithwaite, and J. Flouquet, “Superconductivity on the border of itinerant-electron ferromagnetism in UGe2,” Nature 406, 587–592 (2000).
- Thessieu et al. (1997) C. Thessieu, C. Pfleiderer, A. N. Stepanov, and J. Flouquet, “Field dependence of the magnetic quantum phase transition in MnSi,” J. Phys. Cond. Matter 9, 6677 (1997).
- Perry et al. (2001) R. S. Perry, L. M. Galvin, S. A. Grigera, L. Capogna, A. J. Schofield, A. P. Mackenzie, M. Chiao, S. R. Julian, S. I. Ikeda, S. Nakatsuji, Y. Maeno, and C. Pfleiderer, “Metamagnetism and critical fluctuations in high quality single crystals of the bilayer ruthenate Sr3Ru2O7,” Phys. Rev. Lett. 86, 2661 (2001).
- Paglione et al. (2003) J. Paglione, M. A. Tanatar, D. G. Hawthorn, Etienne Boaknin, R. W. Hill, F. Ronning, M. Sutherland, Louis Taillefer, C. Petrovic, and P. C. Canfield, “Field-Induced Quantum Critical Point in CeCoIn5,” Physical Review Letters 91, 246405 (2003).
- Gegenwart et al. (2002) P. Gegenwart, J. Custers, C. Geibel, K. Neumaier, T. Tayama, K. Tenya, O. Trovarelli, and F. Steglich, “Magnetic-Field Induced Quantum Critical Point in YbRh2Si2,” Physical Review Letters 89, 056402 (2002).
- Fuchs et al. (2014) D. Fuchs, M. Wissinger, J. Schmalian, C.-L. Huang, R. Fromknecht, R. Schneider, and H. v. Löhneysen, “Critical scaling analysis of the itinerant ferromagnet Sr1-xCaxRuO3,” Physical Review B 89, 174405 (2014).
- van der Marel et al. (2003) D. van der Marel, H. J. A. Molegraaf, J. Zaanen, Z. Nussinov, F. Carbone, A. Damascelli, H. Eisaki, M. Greven, P. H. Kes, and M. Li, “Quantum critical behaviour in a high-Tc superconductor,” Nature 425, 271–274 (2003).
- Belitz et al. (2005) D. Belitz, T. R. Kirkpatrick, and Jörg Rollbühler, “Tricritical Behavior in Itinerant Quantum Ferromagnets,” Physical Review Letters 94, 247205 (2005).
- Pfleiderer (2005) C. Pfleiderer, “Why first order quantum phase transitions are interesting,” J. Phys.: Condens. Matter 17, S987 (2005).
- Brando et al. (2008) M. Brando, W. J. Duncan, D. Moroni-Klementowicz, C. Albrecht, D. Grüner, R. Ballou, and F. M. Grosche, “Logarithmic Fermi-Liquid Breakdown in NbFe2,” Phys. Rev. Lett. 101, 026401 (2008).
- Abdul-Jabbar et al. (2015) G. Abdul-Jabbar, D. A. Sokolov, C. D. O’Neill, C. Stock, D. Wermeille, F. Demmel, F. Krüger, A. G. Green, F. Lévy-Bertrand, B. Grenier, and A. D. Huxley, “Modulated magnetism in PrPtAl,” Nature Phys 11, 321 (2015).
- Friedemann et al. (2018) S. Friedemann, W. J. Duncan, M. Hirschberger, T. W. Bauer, R. Küchler, A. Neubauer, M. Brando, C. Pfleiderer, and F. M. Grosche, “Quantum tricritical points in NbFe2,” Nature Physics 14, 62 (2018).
- Aoki et al. (2001) Dai Aoki, Andrew Huxley, Eric Ressouche, Daniel Braithwaite, Jacques Flouquet, Jean-Pascal Brison, Elsa Lhotel, and Carley Paulsen, “Coexistence of superconductivity and ferromagnetism in URhGe,” Nature 413, 613–616 (2001).
- Huy et al. (2007) N. T. Huy, A. Gasparini, D. E. de Nijs, Y. Huang, J. C. P. Klaasse, T. Gortenmulder, A. de Visser, A. Hamann, T. Görlach, and H. v. Löhneysen, “Superconductivity on the Border of Weak Itinerant Ferromagnetism in UCoGe,” Physical Review Letters 99, 067006 (2007).
- Aoki et al. (2019) Dai Aoki, Ai Nakamura, Fuminori Honda, DeXin Li, Yoshiya Homma, Yusei Shimizu, Yoshiki J. Sato, Georg Knebel, Jean-Pascal Brison, Alexandre Pourret, Daniel Braithwaite, Gerard Lapertot, Qun Niu, Michal Vališka, Hisatomo Harima, and Jacques Flouquet, “Unconventional Superconductivity in Heavy Fermion UTe2,” Journal of the Physical Society of Japan 88, 043702 (2019).
- Pfleiderer (2009) C. Pfleiderer, “Superconducting phases of f -electron compounds,” Rev. Mod. Phys. 81, 1551 (2009).
- Haslbeck et al. (2019) F. Haslbeck, S. Säubert, M. Seifert, C. Franz, M. Schulz, A. Heinemann, T. Keller, P. Das, J. D. Thompson, E. D. Bauer, C. Pfleiderer, and M. Janoschek, “Ultrahigh-resolution neutron spectroscopy of low-energy spin dynamics in UGe2,” Phys. Rev. B 99, 014429 (2019).
- Miranda and Dobrosavljević (2005) E Miranda and V Dobrosavljević, “Disorder-driven non-Fermi liquid behaviour of correlated electrons,” Reports on Progress in Physics 68, 2337–2408 (2005).
- Vojta (2010) Thomas Vojta, “Quantum Griffiths Effects and Smeared Phase Transitions in Metals: Theory and Experiment,” Journal of Low Temperature Physics 161, 299–323 (2010).
- Pfleiderer et al. (2010) C. Pfleiderer, P. Böni, C. Franz, T. Keller, A. Neubauer, P. G. Niklowitz, P. Schmakat, M. Schulz, Y.-K. Huang, J. A. Mydosh, M. Vojta, W. Duncan, F. M. Grosche, M. Brando, M. Deppe, C. Geibel, F. Steglich, A. Krimmel, and A. Loidl, “Search for Electronic Phase Separation at Quantum Phase Transitions,” Journal of Low Temperature Physics 161, 167–181 (2010).
- Uemura et al. (2007) Y. J. Uemura, T. Goko, I. M. Gat-Malureanu, J. P. Carlo, P. L. Russo, A. T. Savici, A. Aczel, G. J. MacDougall, J. A. Rodriguez, G. M. Luke, S. R. Dunsiger, A. McCollam, J. Arai, C. Pfleiderer, P. Böni, K. Yoshimura, E. Baggio-Saitovitch, M. B. Fontes, J. Larrea, Y. V. Sushko, and J. Sereni, “Phase separation and suppression of critical dynamics at quantum phase transitions of MnSi and Sr1-xCaxRuO3,” Nature Physics 3, 29 (2007).
- Schmakat et al. (2015) P. Schmakat, M. Wagner, R. Ritz, A. Bauer, M. Brando, M. Deppe, W. Duncan, C. Duvinage, C. Franz, C. Geibel, F.M. Grosche, M. Hirschberger, K. Hradil, M. Meven, A. Neubauer, M. Schulz, A. Senyshyn, S. Süllow, B. Pedersen, P. Böni, and C. Pfleiderer, “Spin dynamics and spin freezing at ferromagnetic quantum phase transitions,” Eur. Phys. J. Special Topics 224, 1041 (2015).
- Benka et al. (2022) Georg Benka, Andreas Bauer, Philipp Schmakat, Steffen Säubert, Marc Seifert, Pau Jorba, and Christian Pfleiderer, “Interplay of itinerant magnetism and spin-glass behavior in Fe1-xCrx,” Phys. Rev. Materials 6, 044407 (2022).
- Niklowitz et al. (2005) P. G. Niklowitz, F. Beckers, G. G. Lonzarich, G. Knebel, B. Salce, J. Thomasson, N. Bernhoeft, D. Braithwaite, and J. Flouquet, “Spin-fluctuation-dominated electrical transport of Ni3Al at high pressure,” Phys. Rev. B 72, 024424 (2005).
- Ritz et al. (2013a) R. Ritz, M. Halder, M. Wagner, C. Franz, A. Bauer, and C. Pfleiderer, “Formation of a topological non-Fermi liquid in MnSi,” Nature 497, 231 (2013a).
- Ritz et al. (2013b) R. Ritz, M. Halder, C. Franz, A. Bauer, M. Wagner, R. Bamler, A. Rosch, and C. Pfleiderer, “Giant generic topological Hall resistivity of MnSi under pressure,” Phys. Rev. B 87, 134424 (2013b).
- Gati et al. (2021) E. Gati, J. M. Wilde, R. Khasanov, L. Xiang, S. Dissanayake, R. Gupta, M. Matsuda, F. Ye, B. Haberl, U. Kaluarachchi, R. J. McQueeney, A. Kreyssig, S. L. Bud’ko, and P. C. Canfield, “Formation of short-range magnetic order and avoided ferromagnetic quantum criticality in pressurized LaCrGe3,” Phys. Rev. B 103, 075111 (2021).
- Rana et al. (2021) K. Rana, H. Kotegawa, R. R. Ullah, E. Gati, S. L. Bud’ko, P. C. Canfield, H. Tou, V. Taufour, and Y. Furukawa, “Magnetic properties of the itinerant ferromagnet LaCrGe3 under pressure studied by La139 NMR,” Phys. Rev. B 103, 174426 (2021).
- Wendl et al. (2022) A. Wendl, H. Eisenlohr, F. Rucker, C. Duvinage, M. Kleinhans, M: Vojta, and C. Pfleiderer, “Emergence of mesoscale quantum phase transitions in a ferromagnet,” Nature 609, 65 (2022).
- Halpern and Holstein (1941) O. Halpern and T. Holstein, “On the Passage of Neutrons Through Ferromagnets,” Physical Review 59, 960–981 (1941).
- Rauch and Weber (1968) H. Rauch and H.W. Weber, “Passage of polarized neutrons through type II superconductors,” Physics Letters A 26, 460–461 (1968).
- Drabkin et al. (1969) G. M. Drabkin, E. I. Zabidarov, Y. A. Kasman, and A. I. Okorokov, “Investigation of a phase transition in nickel with polarized neutrons,” Soviet Physics JETP 29, 261–266 (1969).
- Maleev and Ruban (1970) S. V. Maleev and V. A. Ruban, “Depolarization of neutrons passing through a ferromagnet,” Soviet Physics JETP 31, 111–116 (1970).
- Weber (1974) H. W. Weber, “Properties of the flux line lattice in hysteretic type II superconductors. II. Neutron depolarization experiments,” Journal of Low Temperature Physics 17, 49–63 (1974).
- Rekveldt and van Schaik (1979) M. Th. Rekveldt and F. J. van Schaik, “Static and dynamic neutron depolarization studies of ferromagnetic domain structures,” Journal of Applied Physics 50, 2122–2127 (1979).
- van der Valk and Rekveldt (1982) H.J.L. van der Valk and M.Th. Rekveldt, “Neutron depolarization in ferromagnets in terms of correlation functions,” Journal of Magnetism and Magnetic Materials 28, 88–96 (1982).
- Mitsuda and Endoh (1985) S. Mitsuda and Y. Endoh, “Neutron Depolarization Studies on Magnetization Process Using Pulsed Polarized Neutrons,” Journal of the Physical Society of Japan 54, 1570–1580 (1985).
- Mirebeau et al. (1986) I. Mirebeau, G. Jehanno, I. A. Campbell, F. Hippert, B. Hennion, and M. Hennion, “Magnetic order and canting in a reentrant alloy studied by magnetization, Mössbauer and neutron scattering,” Journal of Magnetism and Magnetic Materials 54, 99–100 (1986).
- Rosman and Rekveldt (1990) R. Rosman and M. Th. Rekveldt, “Neutron depolarization theory in the Larmor and the scattering approach,” Zeitschrift für Physik B - Condensed Matter 79, 61–68 (1990).
- Mirebeau et al. (1992) I. Mirebeau, C. Bellouard, M. Hennion, J.L. Dormann, C. Djega-Mariadassou, and M. Tessier, “Small angle neutron scattering in a superparamagnet,” Journal of Magnetism and Magnetic Materials 104-107, 1560–1562 (1992).
- Rekveldt (1999) M. Th. Rekveldt, “Transmission of polarised neutrons in magnetic materials,” Physica B: Condensed Matter 267-268, 60–68 (1999).
- Yusuf et al. (2000) S. M. Yusuf, M. Sahana, M. S. Hegde, K. Dörr, and K.-H. Müller, “Evidence of ferromagnetic domains in the perovskite,” Phys. Rev. B 62, 1118–1123 (2000).
- Sato et al. (2004) T. Sato, T. Shinohara, T. Ogawa, and M. Takeda, “Spin freezing process in a reentrant ferromagnet studied by neutron depolarization analysis,” Physical Review B 70, 134410 (2004).
- De Teresa et al. (2006) J. M. De Teresa, C. Ritter, P. A. Algarabel, S. M. Yusuf, J. Blasco, A. Kumar, C. Marquina, and M. R. Ibarra, “Detailed neutron study of the crossover from long-range to short-range magnetic ordering in manganites,” Phys. Rev. B 74, 224442 (2006).
- Rekveldt et al. (2006) M. Theo Rekveldt, Niels H. van Dijk, Serguei V. Grigoriev, Wicher H. Kraan, and Wim G. Bouwman, “Three-dimensional magnetic spin-echo small-angle neutron scattering and neutron depolarization: A comparison,” Review of Scientific Instruments 77, 073902 (2006).
- Treimer et al. (2012a) W. Treimer, O. Ebrahimi, and N. Karakas, “Observation of partial Meissner effect and flux pinning in superconducting lead containing non-superconducting parts,” Applied Physics Letters 101, 162603 (2012a).
- Treimer et al. (2012b) Wolfgang Treimer, Omid Ebrahimi, Nursel Karakas, and Ruslan Prozorov, “Polarized neutron imaging and three-dimensional calculation of magnetic flux trapping in bulk of superconductors,” Phys. Rev. B 85, 184522 (2012b).
- Treimer et al. (2013) W. Treimer, O. Ebrahimi, and N. Karakas, “Imaging of Quantum Mechanical Effects in Superconductors by Means of Polarized Neutron Radiography,” Physics Procedia 43, 243–253 (2013).
- Seifert et al. (2017) M Seifert, M Schulz, G Benka, C Pfleiderer, and S Gilder, “Neutron depolarization measurements of magnetite in chiton teeth,” Journal of Physics: Conference Series 862, 012024 (2017).
- Deepak et al. (2021) Deepak, A. Kumar, and S. M. Yusuf, “Intertwined magnetization and exchange bias reversals across compensation temperature in compound,” Phys. Rev. Materials 5, 124402 (2021).
- Bakker et al. (1968) H.K. Bakker, M.Th. Rekveldt, and J.J. Van Loef, “Neutron depolarization measurements in nickel near the curie point,” Physics Letters A 27, 69–70 (1968).
- Drabkin et al. (1968) G. M. Drabkin, A. I. Okorokov, E. I. Zabidarov, and Y. A. Kasman, “Influence of the magnetic field on the phase transition in nickel,” ZhETF Pisma Redaktsiiu 8, 549 (1968).
- Takahashi et al. (1995) M. Takahashi, S. Itoh, and M. Takeda, “Neutron depolarization study on the magnetic critical fluctuation in Rb2CrCl4,” Journal of the Physical Society of Japan 64, 268–274 (1995).
- Schulz et al. (2010) Michael Schulz, Andreas Neubauer, Sergey Masalovich, Martin Mühlbauer, Elbio Calzada, Burkhard Schillinger, Christian Pfleiderer, and Peter Böni, “Towards a tomographic reconstruction of neutron depolarization data,” Journal of Physics: Conference Series 211, 012025 (2010).
- Schulz (2010) Michael Schulz, Radiography with polarized neutrons, PhD thesis, Technische Universität München, Munich (2010).
- Schulz et al. (2016) M. Schulz, A. Neubauer, P. Böni, and C. Pfleiderer, “Neutron depolarization imaging of the hydrostatic pressure dependence of inhomogeneous ferromagnets,” Applied Physics Letters 108, 202402 (2016).
- Jorba et al. (2019) Pau Jorba, Michael Schulz, Daniel S. Hussey, Muhammad Abir, Marc Seifert, Vladimir Tsurkan, Alois Loidl, Christian Pfleiderer, and Boris Khaykovich, “High-resolution neutron depolarization microscopy of the ferromagnetic transitions in Ni3Al and HgCr2Se4 under pressure,” Journal of Magnetism and Magnetic Materials 475, 176–183 (2019).
- Kardjilov et al. (2008) Nikolay Kardjilov, Ingo Manke, Markus Strobl, André Hilger, Wolfgang Treimer, Michael Meissner, Thomas Krist, and John Banhart, “Three-dimensional imaging of magnetic fields with polarized neutrons,” Nature Physics 4, 399–403 (2008).
- Kappler et al. (1988) J. P. Kappler, E. Beaurepaire, G. Krill, C. Godart, G. L. Nieva, and J.G. Sereni, “Magnetic to non-magnetic transition of Ce induced by volume in Ce(Pd, Ni) and electron concentration in Ce(Pd,Rh),” J. Phys. Colloques 49, C8–723 (1988).
- Kappler (1991) J P Kappler, “Crossover between intermediate valence and magnetic order in CeRh1-xPdx,” Physica B: Condensed Matter 171, 346–349 (1991).
- Sereni et al. (1993) J. G. Sereni, E. Beaurepaire, and J. P. Kappler, “Effects of volume and electronic concentration on the CePd1-xMx) compounds (M=Ni, Rh, and Ag),” Physical Review B 48, 3747–3754 (1993).
- Sereni et al. (2005) J.G. Sereni, R. Küchler, and C. Geibel, “Evidence for a ferromagnetic quantum critical point in CePd1-xRhx,” Physica B: Condensed Matter 359-361, 41–43 (2005).
- Deppe et al. (2006) M. Deppe, P. Pedrazzini, N. Caroca-Canales, C. Geibel, and J.G. Sereni, “Investigations of CePd1-xRhx single crystals located near a ferromagnetic quantum critical point,” Physica B: Condensed Matter 378-380, 96–97 (2006).
- Pikul et al. (2006) A P Pikul, N Caroca-Canales, M Deppe, P Gegenwart, J G Sereni, C Geibel, and F Steglich, “Non-Fermi-liquid behaviour close to the disappearance of ferromagnetism in CePd1-xRhx,” Journal of Physics: Condensed Matter 18, L535–L542 (2006).
- Sereni et al. (2006) J.G. Sereni, R. Küchler, and C. Geibel, “Peculiar quantum criticality in ferromagnetic CePd1-xRhx,” Physica B: Condensed Matter 378-380, 648–649 (2006).
- Sereni et al. (2007) J. G. Sereni, T. Westerkamp, R. Küchler, N. Caroca-Canales, P. Gegenwart, and C. Geibel, “Ferromagnetic quantum criticality in the alloy CePd1-xRhx,” Physical Review B 75, 024432 (2007).
- Westerkamp et al. (2009) T. Westerkamp, M. Deppe, R. Küchler, M. Brando, C. Geibel, P. Gegenwart, A. P. Pikul, and F. Steglich, “Kondo-Cluster-Glass State near a Ferromagnetic Quantum Phase Transition,” Physical Review Letters 102, 206404 (2009).
- Brando et al. (2010) M Brando, T Westerkamp, M Deppe, P Gegenwart, C Geibel, and F Steglich, “Quantum Griffiths phase in CePd1-xRhx with x 0.8,” Journal of Physics: Conference Series 200, 012016 (2010).
- Schmakat (2015) Philipp Schmakat, Neutron Depolarisation Measurements of Ferromagnetic Quantum Phase Transitions & Wavelength-Frame Multiplication Chopper System for the Imaging Instrument ODIN at the ESS, PhD thesis, Technische Universität München, Munich (2015).
- Westerkamp (2008) Tanja Westerkamp, Quantenphasenübergänge in den Schwere-Fermionen-Systemen Yb(Rh1-xMx)2Si2 und CePd1-xRhx, PhD thesis, Technische Universität Dresden, Dresden (2008).
- Thornton et al. (1998) M J Thornton, J G M Armitage, G J Tomka, P C Riedi, R H Mitchell, M Houshiar, D T Adroja, B D Rainford, and D Fort, “Low-temperature thermal and high-pressure studies of CePd and CeAgSb2,” Journal of Physics: Condensed Matter 10, 9485–9493 (1998).
- Nieva et al. (1988) G. L. Nieva, J. G. S. Tm, M. Afyouni, G. Schmerber, and J. P. Kappler, “From Ferromagnetic to Non-Magnetic Singlet Ground State in CePd1-xNix,” Z. Phys. B 70, 181 (1988).
- Koelling et al. (1985) D. D. Koelling, B. D. Dunlap, and G. W. Crabtree, “f-electron hybridization and heavy-fermion compounds,” Phys. Rev. B 31, 4966–4971 (1985).
- Marcano et al. (2007) N. Marcano, J. C. Gómez Sal, J. I. Espeso, J. M. De Teresa, P. A. Algarabel, C. Paulsen, and J. R. Iglesias, “Mesoscopic magnetic states in metallic alloys with strong electronic correlations: A percolative scenario for CeNi1-xCux,” Phys. Rev. Lett. 98, 166406 (2007).
- Vojta (2009) Thomas Vojta, “Thermal expansion and Grüneisen parameter in quantum Griffiths phases,” Physical Review B 80, 041101(R) (2009).
- Schlenker and Shull (1973) Michel Schlenker and C. G. Shull, “Polarized neutron techniques for the observation of ferromagnetic domains,” Journal of Applied Physics 44, 4181–4184 (1973).
- Piegsa et al. (2009) F. M. Piegsa, B. van den Brandt, P. Hautle, J. Kohlbrecher, and J. A. Konter, “Quantitative Radiography of Magnetic Fields Using Neutron Spin Phase Imaging,” Physical Review Letters 102, 145501 (2009).
- Sales et al. (2018) Morten Sales, Markus Strobl, Takenao Shinohara, Anton Tremsin, Luise Theil Kuhn, William R. B. Lionheart, Naeem M. Desai, Anders Bjorholm Dahl, and Søren Schmidt, “Three Dimensional Polarimetric Neutron Tomography of Magnetic Fields,” Scientific Reports 8 (2018), 10.1038/s41598-018-20461-7.
- Treimer (2014) Wolfgang Treimer, “Radiography and tomography with polarized neutrons,” Journal of Magnetism and Magnetic Materials 350, 188–198 (2014).
- Mitsuda et al. (1992) S. Mitsuda, H. Yoshizawa, and Y. Endoh, “Neutron-depolarization studies on re-entrant spin glass,” Physical Review B 45, 9788–9797 (1992).
- Calzada et al. (2009) Elbio Calzada, Florian Gruenauer, Martin Mühlbauer, Burkhard Schillinger, and Michael Schulz, “New design for the ANTARES-II facility for neutron imaging at FRM II,” Nuclear Instruments and Methods in Physics Research Section A: Accelerators, Spectrometers, Detectors and Associated Equipment 605, 50–53 (2009).
- Schulz and Schillinger (2015) Michael Schulz and Burkhard Schillinger, “ANTARES: Cold neutron radiography and tomography facility,” Journal of large-scale research facilities JLSRF 1 (2015), 10.17815/jlsrf-1-42.
- Hutanu et al. (2016) V. Hutanu, W. Luberstetter, E. Bourgeat-Lami, M. Meven, A. Sazonov, A. Steffen, G. Heger, G. Roth, and E. Lelièvre-Berna, “Implementation of a new Cryopad on the diffractometer POLI at MLZ,” Review of Scientific Instruments 87, 105108 (2016).
- Endoh and Ishikawa (1986) Y. Endoh and Y. Ishikawa, “Pulsed polarized neutron studies at KENS,” Physica B: Condensed Matter 136, 64–68 (1986).
- Franz et al. (2019) C. Franz, S. Säubert, A. Wendl, F. Haslbeck, O. Soltwedel, J.K. Jochum, L. Spitz, J. Kindervater, A. Bauer, P. Böni, and C. Pfleiderer, “MIEZE neutron spin-echo spectroscopy of strongly correlated electron systems,” J. Phys. Soc. Jpn. 88, 081002 (2019).