Attention is All They Need: Exploring the Media Archaeology of the Computer Vision Research Paper
Abstract.
The success of deep learning has led to the rapid transformation and growth of many areas of computer science, including computer vision. In this work, we examine the effects of this growth through the computer vision research paper itself by analyzing the figures and tables in research papers from a media archaeology perspective. We ground our investigation both through interviews with veteran researchers spanning computer vision, graphics and visualization, and computational analysis of a decade of vision conference papers. Our analysis focuses on elements with roles in advertising, measuring and disseminating an increasingly commodified “contribution.” We argue that each of these elements has shaped and been shaped by the climate of computer vision, ultimately contributing to that commodification. Through this work, we seek to motivate future discussion surrounding the design of the research paper and the broader socio-technical publishing system.
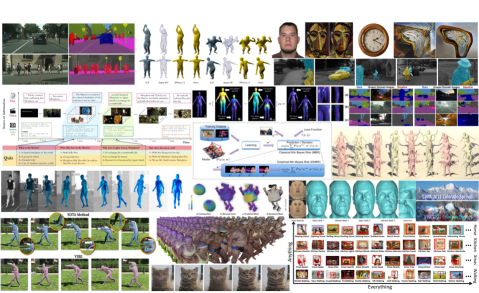
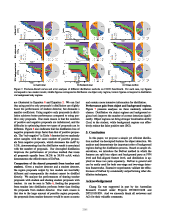
Several teaser images from computer vision research papers, including elements like various 3D models of human faces and bodies, images with bounding boxes and distorted images.
1. Introduction
It’s a pretty strong signal to get papers accepted to a selective conference. I think that’s really a big one. Most people do this essentially to advance their careers and this is really…the biggest benchmark by which you are evaluated. — P8
The research paper has many meanings. It is a contribution to knowledge, often responding—according to formal and informal rules of scientific discourse—to a decades-long conversation. It signals to peers, funding agencies, future employers, and future students that the authors are knowledgeable about a topic and actively studying it. It is a unit of productivity which indicates progress towards a PhD, tenure, or promotion. But beneath all of those layers of interaction, it is a media artifact, designed by its authors, with a style that both influences, and is influenced by, its discipline.
In this paper, we propose thinking about the research paper not as a neutral medium for disseminating textual scientific content, but as a designed interface which researchers—its “users”—interact with in a variety of ways. For example, we might glance at its title in a list of papers, get hooked by its first page figure, scroll through its pages in a PDF viewer, and quickly scan a table of results. We may then print the paper and carry it with us, write in its margin and leave it on a desk, and then find it months or years later. In all of these interactions, the design of both the visual and textual content, as well as the design of the larger technical system, which produced the PDF, delivered it to us, and transferred its image to paper, affects and shapes our interactive experience of the research paper.
Moreover, we examine the research paper as an interface shaped by its disciplinary culture. This perspective draws from a long history of Science and Technology Studies scrutinizing artifacts of science as cultural objects. Bruno Latour, for example, writes extensively about the social nature of the research paper and the important rhetorical role its figures and tables play in creating scientific truth (Latour, 1987). Taking this further, we view the research paper as a media object (Manovich, 2002), an assemblage of designed technologies — like rendered data visualizations, LaTeX, and the PDF file format — viewed on a screen or printed on paper, which have technological affordances and, as we will discuss, accessibility concerns.
Rather than studying academic writing in the abstract, we specifically examine the computer vision research paper over the past decade. Computer vision is a particularly information-rich site (Patton, 1990, p.242) for understanding the paper as a media object both because of its inherently visual nature and its immense recent growth. Over the past decade, the “deep learning revolution” has transformed both the field itself and the way computer vision researchers and practitioners feel about it (Su and Crandall, 2021)—specifically “a general mood of malaise” (Su and Crandall, 2021) which permeates the field. We argue that this malaise is a symptom of an increasingly commodified and competitive research environment, which is visible in the changing interface and “use” of research papers.
Perhaps the biggest hint that the design of computer vision papers has changed with the rapid changes in its disciplinary culture is the sardonic commentary from its members. In the 2010 computer vision satire paper “Paper Gestalt” (Von Bearnensquash, 2010), the pseudonymous authors “take the simple intuition that the quality of a paper can be estimated by merely glancing through the general layout, and use this intuition to build a system that employs basic computer vision techniques to predict if the paper should be accepted or rejected,” (Von Bearnensquash, 2010) and suggest that this system might replace the peer review process. The visual design of the paper parodies the qualities it observes, including unnecessary complex equations and long algorithms.
But in 2018, Jia Bin Huang published a sequel, “Deep Paper Gestalt” (Huang, 2018), which updates both the methods and the jokes. Juxtaposing these two papers gives a glimpse of how the style of computer vision research papers has changed in just eight years. Instead of using complex algorithms and equations, Huang proposes a benchmark dataset, CVPG (the “Computer Vision Paper Gestalt” benchmark), and uses deep learning to significantly outperform the “hand-crafted features” of “Paper Gestalt” (Von Bearnensquash, 2010). Then, it presents an unnecessarily dense table and gratuitously large figure of class activation heatmaps to show the page regions which predict good papers. Though satire, these papers raise serious questions about the research paper as a designed document and the way its design both reflects and shapes its discipline.
Though our topic is a bit unconventional, we believe that our findings are nevertheless highly relevant to HCI. First, we study researchers as users of electronic reading and writing systems, like PDF viewers, reference management tools, LaTeX, visualization libraries, and graphic design tools. A strong understanding of these users, their use patterns, and how they specifically change over time is important for the design of these systems. Second, we study researchers as designers of AI technologies. These technologies are increasingly studied in HCI and used in interactive systems (Harper, 2019). But, as many have observed (Denton et al., 2021; Scheuerman et al., 2021; Sculley et al., 2018; Ethayarajh and Jurafsky, 2020; Paullada et al., 2021), these technologies are not neutral mathematical truth, but products of the research culture that surrounds them, which can lead to communication challenges (Piorkowski et al., 2021). HCI researchers should understand how to read these papers in their subtly-different disciplinary context in order to use them effectively. We believe that studying the design evolution of computer vision papers helps to build such understanding.
Over the following sections, we take a media archaeology approach and analyze historical computer vision research papers and the way their style has developed over time. To better understand these developments in context, we also report results of interviews with twelve veteran researchers, spanning computer vision, graphics, and visualization, and supplementary computational analysis of nine years of open access proceedings from a computer vision conference. We approach elements of both the paper and larger research publication system and their roles in advertising, measuring, and disseminating an increasingly commodified “contribution.” We find that as academic discourse has moved online, the limiting factor on publishing shifted from printing costs to the attention of other researchers, which has changed both the culture of computer vision, as well as the design of its research papers.
2. Related Work
Our inquiry sits at the intersection of several scholarly conversations in and around HCI, including data mining of research paper figures, studies of digital media objects, designing for readers and writers of research papers, and studies of the culture of computer vision.
2.1. Research papers as media object
The fascinating satire paper “Paper Gestalt” (Von Bearnensquash, 2010) is both a related work and a primary source in our inquiry. It claims, facetiously, that “the quality of a paper can be estimated by merely glancing through the general layout” and uses machine learning to predict whether papers will be accepted or rejected from their page images. The (unknown) authors identify that certain features, like sophisticated math and large figures, are predictive of acceptance while large, dense tables are predictive of rejection. A sequel, Jia-Bin Huang’s “Deep Paper Gestalt” (Huang, 2018), updates this methodology using deep learning, and is able to predict paper acceptance with 92% accuracy. These papers are a commentary on the the reality of the modern computer vision community: a reliance on visual performance to ensure successful dissemination and influence of papers.
There is also work surrounding the analysis of research papers in document image analysis (Davila et al., 2020) and data visualization (Wu et al., 2021; Chen et al., 2021). These methods, however, treat the figure as a neutral data source, where there is an objective correspondence between the original data and the figure for each chart type. More recent work has started to, for example, see data visualization as not merely objective reporting of facts but as a communicative medium that has affective impact (Lee-Robbins and Adar, 2022; van Koningsbruggen and Hornecker, 2021). We respond to this literature by pointing out the cultural layers which may interfere with the neutrality and machine-readability of visualization across disciplines.
2.2. Studies of digital media objects
There has been growing interest in analyzing code and its visual results as media objects: artifacts which trace the development of a media culture over time, like wax cylinders or old television sets. Jacob Gaboury’s Image Objects: An Archaeology of Computer Graphics (Gaboury, 2021) takes a media archaeology approach to five such objects in the history of computer graphics: the hidden surface problem, the frame buffer, the virtual teapot, object orientation, and the GPU. In 10 PRINT CHR (Montfort et al., 2014), Montfort et al. study a line of BASIC code used to generate a random maze and use it as an entry-point to explore the cultural history of the Commodore 64 as well as topics including mazes, grids and randomness. These works live within the space charted by Lev Manovich’s now-canonical The Language of New Media (Manovich, 2002), which frames “new media” in terms of code, and argues that it obeys different rules than non-computational technologies like film, and demands its own theory. We extend this approach to computer science research papers, which are themselves rendered digital objects on a screen.
There is also a rich history of “distant reading” (i.e. looking at a corpus of texts in aggregate, usually with computational methods) in the digital humanities. For example, Moretti studies the titles of novels published in Victorian England (Moretti, 2009). Goldstone and Underwood use topic modeling to investigate the changes over time in a large corpus of articles from literary studies (Goldstone and Underwood, 2014). Arnold and Tilton describe a theoretical framework for extending distant reading to “distant viewing” of visual culture which they apply to historical photographs and television (Arnold and Tilton, 2019). While we rely primarily on qualitative analysis, the concept of distant reading and viewing is central to our approach.
2.3. The research paper as a site for interaction design research
Closer to HCI, there are several studies of the research paper as a site for interaction design research. Head et al. study ways of augmenting digital documents with definitions of terms and symbols to improve readability (Head et al., 2021), and how authors improve readability by augmenting the visual design of their equations (Head et al., 2022). Manzoor et al. develop a LaTeX editor extension to improve the accessibility of LaTeX for authors with visual impairments (Manzoor et al., 2018) and Hara et al. develop a system for generating Braille documents from mathematical expressions written in LaTeX (Hara et al., 2000). Gobert and Beaudouin-Lafon conduct a study of LaTeX users and design an extension for VSCode that uses transitional representations of document objects like tables to improve the editing experience (Gobert and Beaudouin-Lafon, 2022). Haber et al. study how groups of coworkers interact differently when using physical vs. virtual documents (Haber et al., 2014). These studies approach research papers as a site of human-computer interaction, and consider how improved design can make reading and writing papers more usable and accessible. While we do not design or develop any technical tools, our work points to the importance of these design studies of research papers.
2.4. The culture of computer vision
Motivated by the dangers of algorithmic discrimination and safety concerns in systems relying on computer vision algorithms, several recent papers have studied the culture of the computer vision research community and its understanding of data and truth, often using research papers as texts for analysis. Su and Crandall study the emotional state of the computer vision community, finding that the deep learning revolution and subsequent growth has had a profound effect on its culture, and leading both to excitement regarding progress as well as to isolation and malaise (Su and Crandall, 2021). Denton et al. use a discourse analysis approach to study the history of the ImageNet dataset through the research papers and presentation slides of Fei-Fei Li (Denton et al., 2021). Scheuerman, Denton, and Hanna study a corpus of 500 papers describing computer vision datasets and analyze the values implicit in their writing: efficiency, universality, impartiality, and model development over dataset development (Scheuerman et al., 2021).
A wide variety of authors have written critically about the culture of data collection and dataset use in machine learning. For example, Sculley et al. and Ethayarajh and Jurafsky critique the concept of benchmarks and leaderboards in machine learning, arguing in different ways that steadily increasing scores do not always correspond to progress (Sculley et al., 2018; Ethayarajh and Jurafsky, 2020). For a more comprehensive survey please see Paullada et al. (Paullada et al., 2021). Our work here, which does not investigate data collection or dataset usage directly, nevertheless echoes these themes.
3. Methods
Our inquiry began through visual analysis of historical computer vision research papers. We found the changes to the visual design of these papers surprising, particularly the increasing prevalence of highly complex figures, and decided to investigate further by conducting both semi-structured interviews with researchers who had been active in computer vision, graphics, and visualization for several decades, and computational analysis of image renders from a corpus of research papers published between 2013 and 2021 in the IEEE Conference on Computer Vision and Pattern Recognition — the largest and arguably most prestigious conference in the field. Along the way, our visual analysis, interviews and computational findings condensed into a media archaeology approach.
3.1. Media Archaeology
Inspired by recent work on the history of computer graphics (Gaboury, 2021), we examine historical research papers through the lens of media archaeology. Unlike physical archaeology, which studies artifacts physically excavated from historical sites, “media archaeology rummages textual, visual and auditory archives as well as collections of artifacts, emphasizing both the discursive and material manifestations of culture” (Huhtamo and Parikka, 2011), p. 3. The goal of media archaeology is to study new media objects as elements of discourse (in the sense of Foucault’s Archaeology of Knowledge (Foucault, 2013)) — components which construct a media culture, a system of practices and meanings which structures our interpretation (Rose, 2016). In our case, we are scrutinizing the highly specialized media culture of an academic discipline.
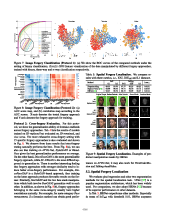
To illustrate this concept of media culture, consider Figure 2(d), a teaser image from a paper in the proceedings of the IEEE Winter Conference on Applications of Computer Vision (WACV) (Kong et al., 2022). This figure is split into 5 similar subfigures, with different combinations of black lines and teal dots. With the requisite disciplinary knowledge, a viewer can interpret the meaning of the figure: the five subfigures represent an occluded image and four attempts to reconstruct the wireframe of the original using different automated methods. Using our understanding of the task, we clearly see that the fifth subfigure labeled “ours” is the best, because its dots and lines align with the geometry of the depicted room. These inferential steps require a degree of initiation in computer vision, an understanding of both the goal of a research paper and the system of meaning that these papers use. The goal of media archaeology is to dissect these inferences and show how their layers of meaning developed over time.
We skimmed through research papers from the IEEE, Computer Vision Foundation, and ACM digital archives, primarily from the proceedings of the IEEE Conference on Computer Vision and Pattern Recognition (CVPR), IEEE International Conference on Computer Vision (ICCV), European Conference on Computer Vision (ECCV), IEEE Transactions on Pattern Analysis and Machine Intelligence (PAMI), and the ACM Speical Interest Group on Graphics and Interactive Techniques conference (SIGGRAPH). We examined CVPR, ICCV, ECCV, and PAMI because they are the four most influential computer vision venues according to Google Scholar,111https://web.archive.org/web/20220709182958/https://scholar.google.com/citations?view_op=top_venues&hl=en&vq=eng_computervisionpatternrecognition and SIGGRAPH due to its historical significance and prevalence in our interviews. While we did not systematically code the enormous number of papers published in these venues, we collected dozens of screenshots of interesting figures and tables and discussed their visual style in weekly meetings, integrating interview and computational results which eventually coalesced into historical narratives.
3.2. Interviews
To augment our visual analysis, we conducted interviews with veteran computer vision researchers. As there are a relatively small number of eligible participants, we recruited specific individuals via email and in-person at the CVPR 2022 conference. Participants are listed by years of industry and academic experience in Table 1. Since this sample is highly non-representative, showing both survival bias based on who remains in the field over a long period of time and selection bias based on who agreed to an interview, we cannot make any representative claims about the attitudes of computer vision researchers. Instead, we approached these interviews through the lens of oral history (Shopes, 2011), and took a grounded theory approach to the analysis (Glaser and Strauss, 2017). While distinct, these approaches are compatible and highly complementary (Ingersoll and Ingersoll, 1987).
We conducted interviews in person and over the Zoom videoconferencing platform between March and August 2022. To avoid participants historicizing or theorizing themselves, we asked each participant to discuss a specific research paper from their early career, and asked them to explain the different elements and tell us stories about the writing process for that paper. Additionally, we asked each participant how they read research papers while they were writing that paper, and how their reading and writing processes differ from the time of that paper to the present. This method of interviewing mirrors that of previous studies examining media artifacts such as websites (Chen et al., 2017; Goree et al., 2021).
After transcribing the interviews, we engaged in a process of iterative memoing grounded by weekly meetings where we compared excerpts which shared common themes. We focused our analysis on identifying patterns from the context that participants provided while telling stories about their writing, as well how participants thought about their papers in relation to changing disciplinary practices. Since our participants are all highly educated scholars, we took caution to avoid simply repeating our participants’ opinions about disciplinary change uncritically.
| Participant | Discipline | Years Industry | Years Academia |
|---|---|---|---|
| P1 | CV,G | 9 | 33 |
| P2 | G,V | 3 | 17 |
| P3 | CV | 0 | 42 |
| P4 | CV | 21 | 3 |
| P5 | CV | 15 | 11 |
| P6 | CV | 0 | 10 |
| P7 | CV | 0 | 36 |
| P8 | CV | 0 | 16 |
| P9 | CV | 0 | 19 |
| P10 | CV,V | 0 | 22 |
| P11 | V | 11 | 0 |
| P12 | CV,G | 0 | 23 |
10 participants come from computer vision, 3 from graphics and 2 from visualization. 11 have academic experience, ranging from 10 to 42 years, 5 have industry experience ranging from 3 to 21 years. Facetiously, the highest number in each column is bolded.
3.3. Computational Analysis
As both qualitative approaches rely on the analysis of specific examples, we used supplementary quantitative analysis to verify that phenomena we observed in the interviews and media archaeology were as pervasive as they seemed. Specifically, we were interested in whether teaser images, figures and tables were becoming more prevalent in CVPR papers over time, and whether more titles were following a particular format containing an acronym followed by a colon. To answer these questions, we collected open access PDF files from thecvf.com published in CVPR 2013 to 2021 and article metadata from ieeexplore.ieee.org for CVPR 1992 to 2020. While we experimented with automated visual analysis of PDFs, we did not find these methods reliable and instead only report statistics counted manually and from text. We manually inspected PDFs from thecvf.com to count teaser images, then used the Linux pdftotext tool combined with regular expressions to count figures and tables. From the IEEExplore metadata, we used regular expressions to parse paper titles, treating a word with more than two capital letters as an acronym, and an acronym as unique if it only appears once in a given year of data.
4. Results


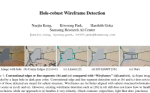
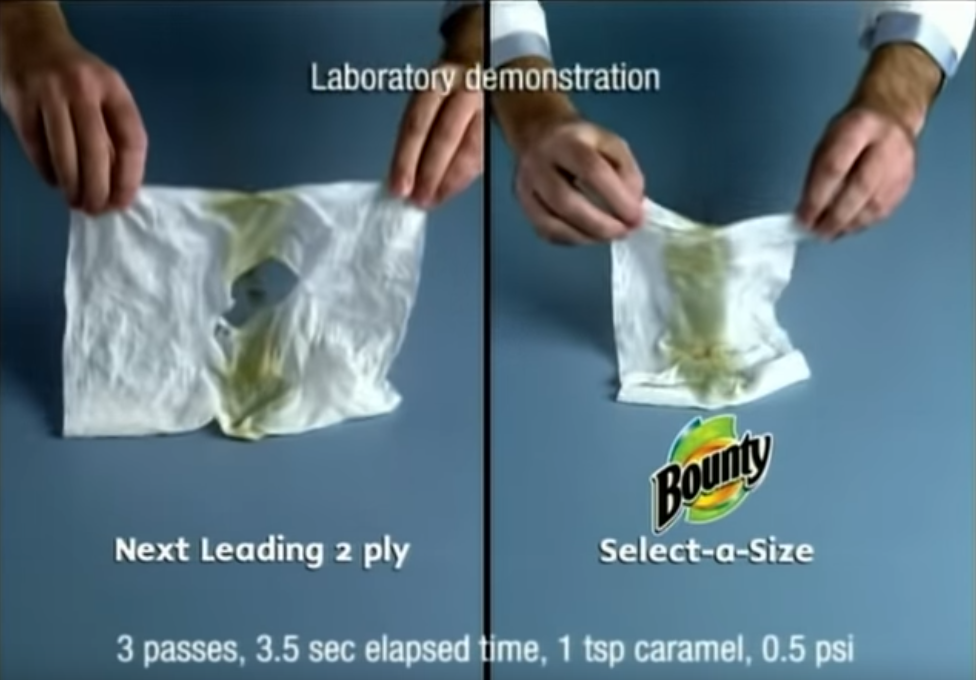
Six subfigures. (a) shows Randy Pausch’s 1996 teaser image, a large color figure of an Aladdin-themed virtual reality ride. (b) shows a 2021 visualization paper from TVCG which uses superhero imagery to illustrate its design approach. (c) shows the ACM conference template, with its stock baseball teaser image. (d) shows a paper from WACV 2022 with a teaser showing an image of a room containing a missing image region and four attempts to locate the edges of the room. The last method labeled “ours” clearly has the best results. (e) shows an input image of a small figurine, possibly Moses, and five competing methods to predict saliency maps over the image. Again, the last method, marked “ours” does best. (f) a still from a paper towel TV advertisement showing “Bounty select-a-size” effectively cleaning up a spill while “Next leading 2 ply” fails. The image also reads “Laboratory demonstration. 3 passes, 3.5 sec elapsed time, 1 stp caramel, 0.5 psi.”
Through our analysis, we found that several elements of the contemporary computer vision research paper serve as material traces of the disciplinary change which took place over the course of the 2010s. Primarily, these are the teaser image, the results table and the high resolution figure. We have grouped our results into thematic sections surrounding these three elements in relation to the concept of a paper’s contribution. By “contribution,” we mean the model, algorithm, method, dataset or other system that the paper offers to readers. We find that these contributions are increasingly commodified—reduced to its exchange value in terms of the attention it attracts, the improvement it makes over an existing method or the career progress it signals.
4.1. Advertising the Contribution
4.1.1. Teaser images
The first element of research paper design that we examine is the “teaser image,” a large first-page figure which summarizes the paper. Several examples of teaser images are shown in Figures 1 and 2. These figures are functionally similar to the trend of “visual abstracts” (Ramos and Concepcion, 2020) and “table of contents images” (Buriak, 2011) in the biomedical sciences, however unlike these forms which are graphical summaries of the text, teaser images are part of the main paper and are usually a visualized system output that the authors want to show. Teaser images have been steadily gaining popularity within CVPR, as shown in Figure 3. For this analysis, we defined the teaser image as a first-page figure which covers the entire width of the page, not just a column.
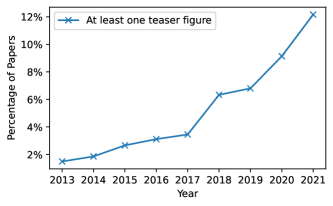
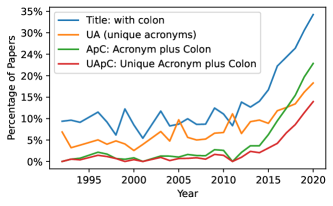
Two subfigures. Left shows a graph with “fraction of papers with teaser figures” on the Y axis and “Year” on the X axis. The line increases from 2% in 2013 to 12 % in 2021. Right shows a graph with four lines, representing four quantities which increase between 1992 and 2020: “Title: with colon” increases from 10% to 35%, “UA (unique acronym)” increases from 7% to 17%, “AFbC: Acronym Followed by Colon” increases from nearly 0% to 22% and “UAFbC: Unique Acronym Followed by Colon” increases from nearly 0% to 15%.
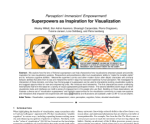
P12 ascribes the teaser image to the famous graphics researcher Randy Pausch: “Randy Pausch…takes credit for putting the teaser image in SIGGRAPH papers…he claimed that he did a paper where half the first page was a teaser image and after that that became the norm where people started always putting these images.” The paper in question is Pausch et al.’s 1996 SIGGRAPH paper “Disney’s Aladdin: First Steps Toward Storytelling in Virtual Reality” (Pausch et al., 1996), pictured in Figure 2 (a). Jia Bin Huang (the author of “Deep Paper Gestalt” (Huang, 2018)) repeated this story on social media (Huang, 2020) as part of a thread on “LaTeX Hacks” like the teaser image. While Pausch did not invent the large first-page figure (Tim Berners-Lee famously used one in his 1989 proposal for the world wide web, for example (Berners-Lee, 1989)), he did publish the first paper in SIGGRAPH with this layout, and it quickly became popular. P2 and P10 point to the quick adoption of teaser images, which even became institutionalized in the SIGGRAPH template, which is now the template for all ACM conferences (including CHI).
P12 defines the teaser as a visualization of either a result or a system and explains that it has spread to many other conferences because of the way it attracts attention: “It’s a trailer. It’s to get people in…I think it’s a very compelling way to convey what the paper does.” For her, the teaser is a highly effective innovation which improves research papers. P2 echoes that sentiment: “They just made the papers look good! I mean, It’s much more memorable and there are some papers still today that I don’t remember the title, but you see the picture and you’re like, oh yeah, that’s the Randy Pausch paper on the VR for whatever, right? So yeah there’s a few of those that are just like, really iconic first pagers.” P2 is referencing the same Pausch paper as P12 (Pausch et al., 1996), highlighting its memorability.
The teaser image is a trailer, a hook; it advertises the paper to the potential reader. The authors want to promote their paper and showcase the best results they can because the sheer number of and easy access to papers has made it harder to stand out. The visual organization of these figures echoes that theme. Notice the commonalities between the two teaser images in Figure 2 (d) and (e). Both show the output of several algorithms attempting to solve the same problem, but they depict the results in such a way that their method is clearly best. This visual effect mirrors that of advertisements, which depict two competing products in action (Figure 2 (f)). While the experiments in research papers are more rigorous than those in paper towel advertisements, the visual effect is similar. Along these lines, we find a recurring theme of teaser images which rely on the iconography of the 3D-reconstructed, brightly colored human body as a particularly compelling visual. Several examples are shown in Figure 1. Human faces and bodies have been found to attract consumer attention to advertisements (Wilkinson and Light, 2011; Ohme et al., 2011); a similar principle may be motivating computer vision authors.
We observe a similar advertising quality in titles. Figure 3 right shows the rise in popularity of a particular title construction where an acronym, which is usually the name of a model, is followed by a colon: “HOPE-Net: A Graph-Based Model for Hand-Object Pose Estimation” (Doosti et al., 2020) or “DeMoN: Depth and Motion Network for Learning Monocular Stereo” (Ummenhofer et al., 2017). These names both signal that the paper proposes a new model and brands the paper with a short, memorable name which is often a cultural reference or clever pun. An especially cheeky example is Joseph Redmon and Ali Farhadi’s 2017 paper “YOLO9000: Better Faster Stronger” (Redmon and Farhadi, 2017), which improves upon an earlier model called YOLO (short for You Only Look Once) (Redmon et al., 2016), and references a variety of memes from the mid-2010s.222YOLO itself was a meme, short for “you only live once,” the number 9000 references a famous quote from the television show Dragon Ball Z and the phrase “better, faster, stronger” references a Daft Punk song. While unusual in computer vision, this kind of nerdy referential humor has been observed in other areas, for example, web design (Goree et al., 2022).
4.1.2. Beyond the paper: videos, arXiv and social media
The pressure to promote one’s work now extends beyond traditional channels, onto the preprint server arXiv and social media. P4 describes how his students have strategies to get their arXiv papers noticed, like submitting papers at a specific time to get them to the top of the daily arXiv notification emails: “if they take your submission on Thursday and it goes up on the arXiv most recent publications list it’s up for all of Friday, Saturday, and Sunday…so it gets more days of exposure…It improves your odds that somebody will notice your thing.” P8 describes the pressure on her students to promote their work: “social media, like promoting one’s research has become such a big thing and I think students…are realizing, oh it’s not enough for me to, y’know, come up with a paper, post it on arXiv, get it accepted. I also need to tweet about it. It’s frankly quite exhausting…[before] the only way you promote your paper is it shows up at the conference and hopefully, y’know, some famous computer vision researchers will come up and look.” She talks about how her advisor would bring his friends over to her poster, and that was all the advertising she needed to get noticed, but that strategy no longer works as well in the modern crowded field of computer vision.
Again this pattern resembles one from computer graphics. P12 describes the importance of videos in SIGGRAPH: “in graphics the conventional wisdom has been it’s useful to have, not only do the paper…but to also show a video that really highlights and explains the work. And if you do a good job of explaining it, people find it compelling.” These videos were considered part of the paper submission and peer reviewed alongside the text, which led authors to invest heavily in the quality of their videos: “SIGGRAPH quality, production quality was very high. There was also a lot of, you know, the entertainment industry, etc. also published in SIGGRAPH so they knew how to make very good videos. And then everybody sort of upped their game to match that, right?” While SIGGRAPH-style video demos did not become a central part of the computer vision publication process during this period, we may still see increased emphasis on video communication going forward, as people do “find it compelling.”
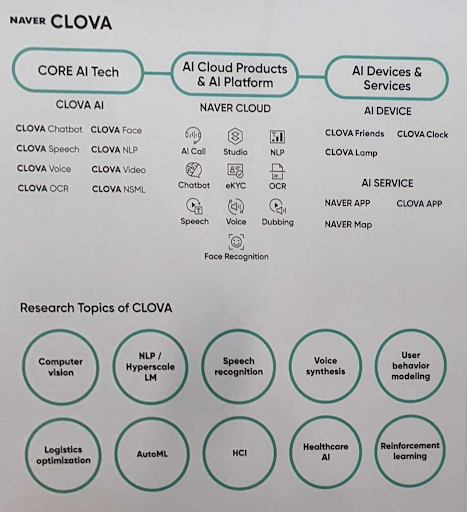
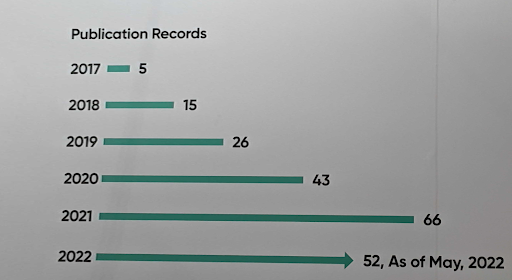
Two subfigures, both show photographs of a conference expo booth wall with text on it. The left has a diagram showing “Clova CORE AI Tech” connected to “AI Cloud Products and AI Platform and “AI Devices & Services.” Below, there is a list of ten research topics including computer vision and HCI. The right shows a bar graph labeled “Publication Records.” The bars increase from 5 publications in 2017 to 66 in 2021 and the last bar reads “52 as of May 2022.”
Even after being accepted to a highly selective conference, many of the benefits of publishing also require attracting the attention of other scholars. Attention translates into citations, as well as job offers for junior researchers and job applicants for senior researchers. P11, who works in an industry lab that hires recent PhDs, explains why his group publishes at all: “exposure is actually really important. If you want to attract really top level talent, then having zero published papers is really going to work against you, right? Particularly if you’re looking at people who are in positions that are for doing some sort of active innovation.”
In summary, the benefits of research, for student, faculty, and industry researchers, are closely tied to attention and publicity. The focus on attracting attention has led researchers to use eye-catching teaser images, titles, and videos, and to maintain social media presence. These practices resemble those of web design—the hero image, the attention-grabbing title, the increased use of video (Goree et al., 2021, 2022)—and evokes the concept of an attention economy (Goldhaber, 1997). As Davenport and Beck argued in the early 2000s, when “capital, labor, information and knowledge are all in plentiful supply” the limiting factor is the attention of consumers (Davenport and Beck, 2001), which begins to be treated like a commodity. In computer vision, the consumers of research vary considerably based on context. For example, for manuscripts the consumers are conference peer reviewers, but for published papers they are the other researchers working on similar problems. But the same idea seems to apply to these audiences.
Here we can see two key themes starting to emerge. First, there are parallels between computer vision in the 2010s and computer graphics in the 1980s and 1990s, which many of our participants pointed out (P1, P2, P6, P9, P10, P12). Both disciplines rapidly grew due to industry investment, from the tech industry in vision and the entertainment industry in graphics, which created an attention economy, forcing papers to go above and beyond to be noticed. Second, research work is being treated as a product and commodified—treated as interchangeable, given some measure of its value. In computer vision, that means the particular ideas an author proposes are less important than their ability to grab attention and advance the author’s career goals.
4.2. Measuring the Contribution
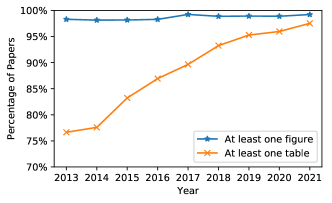
Two subfigures, both line plots. Left shows the percentage of papers with a figure remaining constant around 99% while the percentage of papers with a table increases from 77% in 2013 to 97% in 2021. Right shows the average number of figures and tables per paper. Figures are constant between 6 and 7 while tables increase from 2 in 2013 to 4 in 2021.
Today, the “table of results” in a computer vision paper fulfills a central function in both the written argument and the peer review process: evaluation. When proposing a new method for solving a vision problem, the authors must demonstrate that it works at least as well, if not better than, “SOTA” (state-of-the-art) existing methods. These tables often contain the values of standard evaluation metrics computed on a benchmark dataset, like top-1 or top-5 accuracy on the ImageNet test set (Deng et al., 2009) for image classification or mean average precision on the MS-COCO test set (Lin et al., 2014) for object detection.
A key feature of these tables is that they put the best result, which is almost always from the author’s proposed method, in bold. This design feature is essential for readability, as a large table full of numbers is very difficult to interpret. These tables will sometimes also use arrows to indicate whether a column displays a metric where higher or lower numbers indicate better performance. More recently, as these tables have become more complex, authors have developed other readability innovations, like using colored numbers and subscripted or parenthetical percent improvements (Figure 6 (e)).
But all of this was not the case a few decades ago. The vast majority of computer vision papers from the 1980s and 1990s rely on mathematical arguments based on pinhole camera geometry and do not contain any quantitative results. Empirical evaluation, if included at all, was primarily qualitative, in the form of figures showing sample results. As P8 explains, she had a combination of quantitative and qualitative evaluation in her paper from 2003, which was unusual: “quantitative evaluation, you know, back in 2003 was still kind of in its infancy…I’m not sure that this [2003] paper has basically any comparison to competing methods which probably would be required today.” P3 explains that he was primarily concerned in 1990 with showing test examples to demonstrate his algorithm’s effective handling of edge cases. P9 explains that in 1999, showing example output of his system was sufficient: “instead of [Amazon] Mechanical Turk you just have the reviewers just eyeball the images.” In the satirical 2010 “Paper Gestalt” (Von Bearnensquash, 2010) paper, which attempts to use computer vision methods to distinguish between good and bad papers, large confusing tables were identified as a key feature of bad papers, not an essential feature of good ones.
So how did computer vision transform from a mathematical discipline based on geometry to an empirical, quantitative discipline based on benchmarks? We can see the seeds of this transition as early as a debate at ICCV 1999, referenced by P9, between Jitendra Malik and Olivier Faugeras (Triggs et al., 2000). In that debate, Malik argued that computer vision should focus more on probabilistic modeling and perception, rather than methods based in geometry, while Faugeras responded that empirical computer vision was not scientific, since it is unfalsifiable, and geometric methods based on rigorous mathematics were a better foundation for the discipline.
 |
 |
 |
| (a) Table from SIGGRAPH 1995 (Stalling and Hege, 1995) | (b) Table from a 1999 edited volume (Chella et al., 1999) | (c) Table from NeurIPS 2012 (Krizhevsky et al., 2012) |
 |
 |
 |
| (d) Table from NeurIPS 2021 (Dai et al., 2021) | (e) Table from CVPR 2021 (Li et al., 2021) | (f) Table from CVPR 2022 (Hruby et al., 2022) |
Six subfigures. Each shows a table full of numbers, where some of the numbers are in bold. (a) shows a table split into sections with double lines where one number in each row is bolded. (b) shows a simpler table where all of the numbers in one column are bolded. (c) shows another simple table where one row has an italicized label and a citation, while two of the other rows have numbers in bold. (d) shows a highly complex table with dozens of rows split into several sections with horizontal lines and several numbers in bold. (e) shows a dense table with a grayscale background, alternating in tone to differentiate the lines, and numbers in both blue and red. (f) shows a table with many rows split into sections with double horizontal lines, two numbers in bold and several cells with infinity symbols.
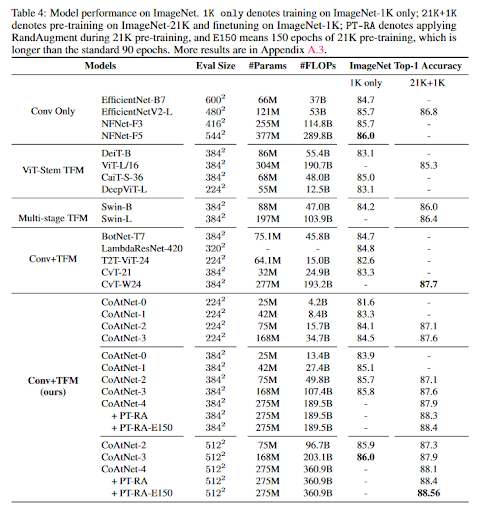
The publication of Krizhevsky, Sutskever and Hinton’s “ImageNet Classification with Deep Convolutional Neural Networks” in 2012 (Krizhevsky et al., 2012) marks a turning point for empirical evaluation. This paper is historically significant for setting off the deep learning revolution, and its design and writing served as a foundation for the thousands of deep learning-based computer vision papers that followed. The paper’s central argument is that several “new and unusual features” lead deep convolutional neural networks to significantly outperform other methods. These features include rectified linear units (ReLU), GPU-based training, and regularization techniques like data augmentation and dropout. Crucially for our story, however, this argument is made by way of a table, shown in Figure 6 (c), with the best performance in bold. Neural network papers were obligated to use empirical evaluation, as there are insufficient theoretical guarantees for these models and they are difficult to compare otherwise. Over the following years, many papers followed Krizhevsky’s lead, showing that deep convolutional neural networks outperform existing methods on other central problems like object detection and semantic segmentation. We can see a corresponding increase in both the average number of tables per paper, as well as the fraction of papers containing at least one table in Figure 5. While the prevalence of figures has remained relatively constant, tables have become significantly more common. While only 75% of CVPR 2013 papers had a table, 95% of CVPR 2021 papers did, and the average number of tables per paper has doubled from 2 to 4. While not all of these tables are the kind of results table we’re discussing, the change is striking.
Like teaser images, however, this style of table arises in computer graphics before entering computer vision; see Figure 6 (a) for an early example. Early graphics results tables primarily showed runtime comparisons, rather than accuracy or quality evaluations. These tables are used in computer vision for showing machine learning performance at least as early as 1999 (Figure 6 (b)). Interestingly, tables from this era usually had methods in the columns and different data examples in the rows, in contrast to the later tables which have evaluation metrics in columns and methods in rows. This swap also aided readability, as it is easier to scan vertically than horizontally (Luckiesh and Moss, 1941).
Today, competition on major vision problems is fierce. For example, compare the table in Figure 6 (c), from a 2012 paper, to the table in Figure 6 (d), from a 2021 paper. The benchmark remains ImageNet, though performance has surged from 40% top-1 accuracy to over 85%, but the competing state-of-the-art includes dozens of models and differ by only fractions of a percent. Even highly geometric papers, like the best paper from CVPR 2022, involve machine learning methods and empirical evaluation (Figure 6 (f)).
More broadly, in computer vision there is widespread assumption that research inherently involves competition between technical methods (and the researchers who have the resources to implement such methods). Several of our participants described academic publication using free market metaphors. P2 explains his research output: “publication was really fast during that time because there was not a lot of competition.” P3 explained that CVPR has become inaccessible to students because “supply and demand” have raised the standards for publication. P4 described vision as “very industrial” and gave examples of techniques that students use to optimize their arXiv submissions to reach as many eyes as possible. P6 compares benchmarks to arcade game leaderboards: “If it’s an established benchmark, there’s like there’s somebody who has the lead right? Like you would have on like a classic video game arcade machine, right? It’s like I have to just get my initials at the top right? That’s exactly what they’re doing, and that’s frustrating.” P5 and P8 advise their students to avoid working on research which forces them into competition with large companies. P5: “I tell them, don’t work on problems that, you know, a lot of people are working on right now, you can’t possibly compete with Facebook, Google, Amazon because you’re not as computing heavy.”
In summary, the development of the results table shows the transition of computer vision from an applied mathematical discipline to a quantitative-empirical one. As vision started relying on empirical evaluation, it adopted a style of results table which was used for runtime benchmarking in computer graphics, and as evaluation benchmarks became established for vision problems, these tables grew in size and importance. Today, competition on benchmarks is the organizing principle of the discipline, new methods must demonstrate that they are empirically more effective than existing methods to be accepted, and the results table is an essential part of the paper. This element showcases several of the same themes as teaser images: influence from computer graphics, and commodification, in the form of measurable improvements over prior work. It also echoes patterns observed in HCI more broadly regarding quantification: once a phenomenon, in this case the quality of a method, has been measured, that measurement creates and constrains possibilities for action (Pine and Liboiron, 2015).
4.3. Disseminating the Contribution
Six subfigures: (a) a screenshot of a research paper with two scatterplots in the top right corner, occupying a tiny fraction of the page. (b) and (c) are zoomed versions of the scatterplot, revealing that each data point is represented with a digit drawn on the pdf. (d) shows a page with a dense neural network diagram in the top third with tiny mathematical annotations. (e) shows a page with nine ROC curves and 9 pie charts in the top third. (f) shows a page with three figures and a table in half the page area, one figure contains three scatterplots and a line graph, the second contains two matrix heatmaps with tiny labels for each of dozens of columns, and the third contains 25 images of faces.
4.3.1. The PDF and digital proceedings
The final element we explore is the Portable Document Format (PDF) itself, and the way that authors engage with it as a medium. In this section, to avoid confusion, we use “research paper” to refer to printed papers and “research PDF” to refer to the digital version. The PDF was developed by Adobe in 1993 as a file format for its Acrobat product, which promised to show digital documents in a consistent manner across platforms. PDF was a derivative of Adobe’s already-successful Postscript programming language for specifying documents, and a proprietary file format until 2008. In an article from 1998, Kasdorf compares the PDF format to SGML (Standard Generalized Markup Language), and argues that both formats should be used on the web: markup languages for screen-based content and page-based languages for printed content (Kasdorf, 1998).
However, in the context of computer vision research, the PDF is now more of a screen-based format than a printed one. The PDF viewer has steadily replaced paper as the medium for reading research articles, which has led researchers to design their articles for viewing on screens, rather than as physical, printed research papers.
Our participants point to color as the main factor behind this shift. P9 explains that a huge draw of a conference like SIGGRAPH was its color proceedings: “SIGGRAPH was always in color. It was absolutely beautiful color. Much more expensive.” P10 points to a turning point where researchers started preparing all of their figures in color: “There was also a turning moment at some point, I think it was around 2004-5-6 something like that. So before that, it was black and white plus color images at the end. Like in a set of separate full color plates as they call them. It was difficult to decide which figures to put in color, since visualizations had to be fully redesigned for black and white.” Once some figures could be in color, authors had to choose which of their figures to leave in black and white, which was a difficult choice. P10 explains his solution: “the only simple solution I found is you don’t decide. You just leave it like this and then they complain, well this is not visible…[so] you insert the URL of your webpage.”
In fact, the existence of URLs, and particularly hyperlinked URLs, points towards the changing nature of the research PDF in computer vision. Before the web, articles were written, submitted, and published on paper. But through the 1990s and 2000s, a series of rapid technological changes took place in computer vision publishing: LaTeX was adopted for typesetting papers in the early 90s, email replaced mail submissions in the late 90s, PDF replaced postscript as the page description language of choice in the early 2000s, and conference proceedings transitioned from printed volumes to CDs in the mid 2000s and to web-only proceedings in the early 2010s.
The transition to digital proceedings, like other trends, started in SIGGRAPH, which produced the first fully digital proceedings on CD-ROM in 1993 (Brown and Cunningham, 2007). CVPR distributed digital proceedings as early as 2005, allowing color figures without the cost of color printing. P9 explains that in 1999, digital versions of papers were hard to read: “most papers were in postscript and the postscript viewer was kind of sucky. Didn’t really look very good on the screen. And so it wasn’t really great to be read off the screen anyway, and the screens were pretty bad.” P7 found the transition to PDF freeing: “I’ve seen figures have become a whole lot more common…the PDFs are now in color so you have a whole bunch of other choices that you’re welcome to.”
One such option is the high resolution figure, which exploits the scalable nature of vector graphics and the zoom feature of PDF viewers to put more data in a research PDF without exceeding the page limit. Several examples of this trend from CVPR 2021 are shown in Figure 7. While these figures are not overly complex or poorly designed, they are too small to be readable on a 300-dpi printed page.
Several of our participants mentioned these high resolution figures. P6 and P10 are frustrated that they cannot print some PDFs because the figures are too small. P10 ascribes these figures to the increasing complexity of research: “the tendency of grouping more small figures into a kind of collection… I wonder, is this because of the limited page count that people try to avoid the whitespace around the figures and then they put everything in one big figure because then you can save on the whitespace? Or is it simply because really…the techniques that we’re describing nowadays are so, so much more complicated? So you need them to, you know, to, to put the architecture of the whole thing in detail there. Otherwise nobody understands it.” P7, on the other hand, ascribes it to digital submissions: “In ’94, you turned in your paper by actually having a piece of large paper that was probably 24” wide by 30” or something… you had columns of text from LaTeX and then your figures had to be glued in place in what’s called “screen,” right? So you actually have to make sure that they didn’t copy badly.” When papers were submitted by mail, the medium of the “camera-ready” draft was a significant limitation on the kinds of visual content that could be included, as they had to photocopy well, but now the only limitation is on the number of pages, so authors utilize the zoom feature of PDF viewers to include more content.
The digital nature of contemporary research PDFs was a sensitive topic in our interviews. Half of our participants (P1, P2, P3, P4, P5, and P8) expressed attachment to and nostalgia for their printed papers, and were saddened when asked when they stopped reading on paper. For P1, the time spent at the library made the papers physically significant: “[the papers] were all me standing at a Xerox machine with a journal…I didn’t find it as annoying. I found that it gave me something like a kind of a physical connection to the paper. This was sort of like, it’s mine. I’ve watched it go by, you know.” P2 remembers that the SIGGRAPH proceedings “were like flipped to the point where like it’s the threads were like bare.” He’s kept all of the papers he printed during his master’s degree and revisits them from time to time: “I still go back, you know, look at like oh this crap that I thought about these things, right?” Finding and photocopying papers made them precious; he thinks there is “a kind of a correlation between that sense of, like scarcity of it, like how precious the paper was, because it’s so hard to find versus the amount of care you give it.” P4 fondly recalls his advisor taking papers out of a filing cabinet and photocopying them for him: “the amazing thing about your advisor is you have this filing cabinet of stuff that’s already pre-copied, you know, every paper he thought was interesting.”
These sorts of relationships to printed papers are interesting from a design perspective. They echo the findings of Odom et al. that we preserve designed objects which have functional, symbolic and material-aesthetic value (Odom et al., 2009). When a researcher prints out and writes on a paper, the paper gains symbolic significance, a “physical connection” which endures over time. That makes printed pages more “precious” and less disposable than digital ones, there is a more tangible opportunity cost to creating them. From this perspective, digitization is an essential component of commodification, as it separates the research from its paper and thus its role as symbolic object. While reading digitally is significantly more environmentally sustainable than printing, shipping and photocopying paper (Aydemir and Özsoy, 2020), many of our participants who primarily read on screens miss the era of physical papers.
In contrast, P7 prefers PDFs because they allow him to use a screenreader: “I use an app that reads the pdf aloud to me…I can get most of the paper from that, I still have to read equations.” Despite being an advocate for making computer vision papers more accessible for the community, he explains that conferences are reluctant to put accessible equations in their templates because of its impact on file size: “basically the conferences keep using templates that—so there’s a trade off by adding this stuff to your file, your file gets bigger. And it turns out that the package, that one of the packages is pretty good for this, if you do it badly, it blows files up huge…I tried to get the guys from CVPR to use it and it just didn’t happen, right?…I’ve just lived with the fact that it’s not there.”
The juxtaposition between high resolution figures and inaccessible equations is rather ironic. These figures can have surprisingly large file sizes—the PDF shown in Figure 7 (a) is a stunning 36MB, more than 10 times the size of a typical CVPR research PDF—so unnecessarily large file sizes are clearly not a concern for contemporary submissions. But computer vision proceedings remain inaccessible. These figures also point to the vestigial nature of the page limit. Originally, page limits were put in place to minimize printing costs. But in the era of online-only proceedings, there is no financial reason to keep papers page-limited. In fact, the main limiting factor on conferences is the attention of reviewers, rather than the lengths of accepted papers. As P8 describes: “for the last…five years or more, there has been talk every single cycle, oh, you know, we don’t have enough qualified reviewers. We have way too many submissions. Everyone’s way too overwhelmed to do the reviewing.” While keeping submissions page-limited intuitively seems like it would preserve reviewer time, it is unclear whether that is actually the case.
4.3.2. Faster publication through arXiv
The immateriality of the research PDF affords an alternative publication process that came up in several of our interviews (P4,P5,P8): the preprint server arXiv. P5 says arXiv is a major source of anxiety for his students: “So my students…had the unpleasant experience of, you know, finishing a paper when they’re just about to submit and they saw a paper on arXiv that did almost the same thing. Like, oh my, months of work just went down the drain.” This emotion, the sense of loss when a project becomes unpublishable because someone else got there first, echoes Su and Crandall’s observation of “selective amnesia” (Su and Crandall, 2021), except in addition to old papers quickly becoming obsolete because something else is better, current papers may become obsolete because they are no longer first.
Conferences originally gained popularity in computer vision because they allowed research to make it to print faster than journals. According to P3, “It used to take almost two years from the time a research is done and the PAMI [Pattern Analysis and Machine Intelligence journal] paper would appear. And so the conference has started becoming more and more important at that time. So that’s the origins of ICCV and CVPR conferences becoming far more popular than journals. So during the 1980s and early 90s, the journal was the thing.” But now, if research is primarily disseminated by PDFs posted on arXiv, it seems like the same process is occurring again: conferences behave like journals and arXiv behaves like a conference. As P8 explains: “In order to get promoted in order to get a job, you need that stamp of approval. And it’s a pretty strong signal to get papers accepted to a selective conference…this is really kind of the, you know, biggest marker, you know, the biggest benchmark by which you are evaluated.” That last phrase is striking because of the parallel it draws between the text and context of the publication. In the same way that computer vision benchmarks its models, the conference review system benchmarks its authors.
As arXiv replaces conference proceedings as the fastest way to bring attention to new research, the writing process changes as well. As P9 explains, “I find that the amount of time and effort put into each paper has gone downhill. For my papers, I would put a huge amount of time, especially in the intro…And recently I have been doing less and less of that and basically because the students are saying, ah you know, the new kids they don’t even, they just skip the intro, they just go directly to the method. So I feel like, oh my god, nobody’s even gonna read my beautiful prose!…But also I think because the field progresses faster, papers become obsolete much quicker. So it might be reasonable not to spend so much effort on a single paper if you know that in a year it will be obsolete.” In other words, author writes differently in order to better fit the faster publication system, spending less time on introductions in order to spend less effort on a paper which might quickly become obsolete.
To summarize, the technologies underlying the publishing process in computer vision have changed rapidly over the past three decades. Today, proceedings are published online, and most researchers read research PDFs on a screen, rather than research papers in print. The loss of physical research papers affects readers’ attachment to those documents, as virtual papers cannot hold significance as domestic symbols in the same way. Meanwhile, authors have taken advantage of this fact and increased the resolution of their figures to bend conference page limits, and started publishing on arXiv to share their results as quickly as possible. Again, we see the same themes: a pattern in computer vision was preceded by a similar shift in computer graphics, which has contributed to commodification. In this case, the conference review system serves to measure the value of a research contribution, since the submission itself has been devalued (in the attention economy) by the growth of the field and the ease of sharing a research PDF online. Acceptance to a computer vision conference serves as a marker, not just of peer-reviewed technical correctness, but of sufficient novelty and significance to warrant high scores from reviewers, a stamp of approval for employment or promotion. But those scores are an inherently unreliable measure of significance as no one can predict which papers submitted to a conference will have significant impact.
5. Discussion
Using a combination of media archaeology, ethnographic grounded theory, and computational image analysis, we have described the development of three aspects of the contemporary computer vision research paper. First, we saw how teaser images, titles with acronyms and videos have gained traction in vision because of how they advertise the contribution of a paper, and how attention from arXiv and social media has become more important. Second, we saw how the results table was introduced for measuring the significance of a contribution, alongside the shift from geometric to statistical learning. Recently, it has become a ubiquitous part of the computer vision research paper as the field has reorganized itself around benchmarks. Finally, we looked at the transition from paper to PDF as the methods for disseminating research contributions has changed. We saw how authors have pushed the boundaries of the PDF to avoid exceeding conference page limits and how arXiv is now fulfilling the role of a fast route to publication that conferences used to hold. These trends have a key commonality: they make research papers faster, easier to consume visually and more readily disposable.
We can take a step back and analyze the design of the computer vision conference system from this perspective. The negligible reproduction cost of digital documents removes the limitation of the conference printing budget, which was the original limiting factor on publishing. Combined with the rapid growth of computer vision after the deep learning revolution, the sheer amount of research being done puts a strain on the new limiting factor: the attention of other researchers. The peer review process is now governed by self-imposed limiting factors, born of a desire by conferences to signal prestige through low acceptance rates, which places the burden of growth on the attention spans of peer reviewers.
This attention economy, unlike limited conference printing budgets, functions as an incentive: authors are incentivized to write papers which are easy to understand at a glance, easy to promote on social media, and obviously novel and significant in the eyes of reviewers. This leads to design innovations, like more readable tables and the math augmentations observed by Head et al. (Head et al., 2022), but also allows large industry labs to out-compete individual students by simply using more resources than prior work, which all but guarantees significance. As P5 tells his students, “you can’t possibly compete with Facebook, Google, Amazon because you’re not as computing heavy.” Moreover, industry is highly incentivized to succeed in publishing papers in order to recruit the best computer vision researchers; papers generated by its employees are a powerful signal (Feldman and March, 1981) of its innovation and pedigree. These changes constitute the commodification of research.
By commodification, we mean a process by which research work is treated as interchangeable, given some measure of its value. In computer vision, that measure can be the benchmark, where a contribution over existing methods might be literally depicted as a bolded green number with an up arrow next to it, or a more conceptual evaluation like conference review scores or citation counts. In Marxist theory, production is an expression of our subjectivity: when we make things, we alter the world to express our desires, and develop our skills and grow as individuals in the process. However, under capitalism, production is commodified and reduced to its exchange value, which alienates workers from the products of their labor, denying them satisfaction of self-expression (Øversveen, 2022; Marx, 2004). While the products of research are less tangible, and their value is not measured in dollars, a startlingly similar process is occurring here, and further exploration of Marxist theory may be useful for understanding the malaise observed by Su and Crandall (Su and Crandall, 2021). These problems become more egregious when considered alongside the much larger labor issues in machine learning involving data labeling (Paullada et al., 2021; Scheuerman et al., 2021; Denton et al., 2021). Workers have their intelligence commodified and valued at cents per task by researchers who are themselves reacting to commodification. But, as our analysis shows, this labor system is created and maintained, in part, by the design of research papers and the conference review attention economy.
Several of these trends parallel developments in computer graphics decades earlier. These parallels may lead us towards a worrying implication: as P2 so aptly put it, “graphics is dead.” Of course, SIGGRAPH is far from a dead conference—SIGGRAPH 2022 still had more attendees than CVPR 2022 for example.333Attendance was 11,700 at SIGGRAPH vs. 9375 at CVPR according to https://s2022.siggraph.org/siggraph-2022-hybrid-conference-enjoys-notable-numbers-with-in-person-and-virtual-attendees/ and https://www.wjscheirer.com/misc/pamitc/PAMI_TC_Meeting_CVPR_2022.pdf But as P2 explains, “I came up during the era where graphics was king. You know, SIGGRAPH was the largest conference in all of ACM, yeah, and it basically single handedly propped up the finances of ACM, and at its height it was like 80,000 people conference.” Graphics was able to grow so large because of its relationship to the entertainment industry: “There’s so much work that was being done and the immediate impact of what you’re doing in research, like, you know, shows up in Pixar shows up in special effects studios and it’s almost instantaneous.” But that financial relationship ended up dooming graphics research: “Graphics died because graphics got crushed by its own success…it got to a point where Hollywood realized, hey the stuff we’re doing with the current technology is good enough that our audience is not like, they’re not complaining anymore…so at that point Hollywood was like, ok, so we’re done.” It is possible that a similar pattern will occur in computer vision.
Our work carries significant limitations. Our visual analysis of papers was not systematic, and is likely biased towards the more obvious trends, as well as trends which are present in published papers that have been digitized, which ignores the visual culture of posters, presentations, and rejected papers. As with any study of recent history, we cannot take an objective approach, as our personal experiences as computer scientists will skew our judgment. Our interview participants also only represent the views of senior researchers. A study of current students, junior faculty, and other younger authors and the “tricks” and “hacks” they use in their papers would be excellent future work.
Additionally, we have only scratched the surface of the media archaeology of the research paper. Alongside the patterns we analyze, sophisticated visual languages for system diagrams and renderings of visual features have developed, which we have not considered here. We have also neglected to discuss citations and the relationship between these sorts of readings of research papers with the much larger field of information science and bibliometrics (Ball, 2020). A more quantitative study which measures the relationships between visual features of research papers and the structures of citation graphs may prove fruitful.
We worry that the stylistic conventions of the field may be constraining the types of ideas students and faculty are willing to pursue. While this is true for any set of disciplinary norms, the culture of benchmarks in computer vision fosters a particular mindset of technological determinism, where research becomes a matter of either finding the best performing model for an existing task or proposing a new task and constructing a benchmark dataset for it. Within this mindset, it seems inevitable that all possible visual perception tasks have computational solutions, and research is only a matter of finding them first.
We also worry that these stylistic conventions may be contributing to the safety and injustice issues which currently surround machine learning. If authors are under pressure to publish more and faster, it is easiest to do that by overstating the significance of completed work. There are a range of behaviors which contribute to this problem: from neglecting to explore the limitations of a method, to only showing favorable evaluations, to outright results fabrication. While we have not verified whether authors are engaging in such behaviors through our analysis here, we do observe an tendency to write papers like advertisements and only minimally discuss downsides. These behaviors become problematic when engineers, stakeholders or researchers in other fields who are unfamiliar with the reality of conference publishing may take the claims in papers at face value, and put minimally tested systems into production based on a general trust of computation and data.
6. Conclusion
In conclusion, we have demonstrated that the media artifact of the research paper both showcases and shapes the culture of computer vision. First, the attention economy incentivizes authors to include teaser images, and the presence of teasers incentivizes researchers to develop methods which can more easily be presented as products, ready-made for readers to download, use, and cite. Second, the results table allows researchers to demonstrate the effectiveness of their neural network methods, but then the expectation of comparison to other methods forces other kinds of papers into the same evaluation paradigm. Finally, desire for color figures led conferences to adopt digital proceedings, which has led authors to create content which cannot be viewed on paper, necessitating screen-based reading. These trends contribute to the commodification of research, by reducing papers to the attention they attract, the improvement they achieve over existing work or the conference reviews and citations they earn.
Our inquiry carries implications both for the design of the technologies which support publication, as well as the relationship between computer vision and other disciplines. First, as conferences continue to move beyond compatibility with paper, there is growing need for a LaTeX-compatible, digital-first document file format which gives authors control of the look and feel of their publication, but is machine-readable and supports accessibility tools. Second, we believe there is value in exploring the design space of digital-first publishing. There may be interactive digital-first figures and tables which are better for summarizing deep learning research. For example, imagine an interactive teaser which links directly from components in a system diagram to source code, or a table where readers can click to expand individual cells and show more nuanced results. Finally, we advise researchers, engineers, and designers in other disciplines who are making use of tools and techniques from computer vision to read these papers critically. Just as we might approach a historical novel or news article in historical context, rather than as a neutral source of truth, we should treat computer vision contributions in the context of their disciplinary culture. The fast pace of research and the incentives which it creates lead researchers to represent their models and datasets in a manner which may overstate success or understate limitations. In HCI, we should approach this style as a systemic characteristic of the deep learning era and tread carefully when using these techniques in our work.
There is also a serious case for the computer vision conferences to consider a substantial redesign of their submission, review, and publishing practices to better support the wellbeing of students and junior faculty. The current accelerating pace of publication is clearly unsustainable and harmful to students, and likely impeding long-term research progress out of small labs in favor of formulaic, but clearly measurable, contributions. Much like a video game designer might redesign a multiplayer game system to change the incentive structures, and thus the user experience, we recommend a redesign of the computer vision publishing system from an interaction design perspective to better handle the tension between the attention economy, speed of technical progress, and need for assessment of researchers.
Acknowledgements.
This work was supported in part by a NSF graduate research fellowship. The views expressed in this paper are those of the authors and do not necessarily reflect the views of the NSF or any other agencies.References
- (1)
- bou (2015) 2015. Bounty Paper Towels (Rubber Band Ball) Commercial. https://www.youtube.com/watch?v=-y30RsG6DJ8, screenshot taken by the authors..
- Arnold and Tilton (2019) Taylor Arnold and Lauren Tilton. 2019. Distant viewing: analyzing large visual corpora. Digital Scholarship in the Humanities 34, Supplement_1 (2019), i3–i16.
- Aydemir and Özsoy (2020) Cem Aydemir and SAMED Özsoy. 2020. Environmental impact of printing inks and printing process. Journal of Graphic Engineering and Design 2 (2020).
- Balan et al. (2007) Alexandru O. Balan, Leonid Sigal, Michael J. Black, James E. Davis, and Horst W. Haussecker. 2007. Detailed Human Shape and Pose from Images. In 2007 IEEE Conference on Computer Vision and Pattern Recognition. 1–8. https://doi.org/10.1109/CVPR.2007.383340
- Ball (2020) Rafael Ball (Ed.). 2020. Handbook Bibliometrics. De Gruyter Saur, Berlin, Boston. https://doi.org/doi:10.1515/9783110646610
- Bernard et al. (2016) Florian Bernard, Peter Gemmar, Frank Hertel, Jorge Goncalves, and Johan Thunberg. 2016. Linear Shape Deformation Models with Local Support Using Graph-Based Structured Matrix Factorisation. In 2016 IEEE Conference on Computer Vision and Pattern Recognition (CVPR). 5629–5638. https://doi.org/10.1109/CVPR.2016.607
- Berners-Lee (1989) Timothy J Berners-Lee. 1989. Information management: A proposal. Technical Report.
- Bogo et al. (2017) Federica Bogo, Javier Romero, Gerard Pons-Moll, and Michael J. Black. 2017. Dynamic FAUST: Registering Human Bodies in Motion. In 2017 IEEE Conference on Computer Vision and Pattern Recognition (CVPR). 5573–5582. https://doi.org/10.1109/CVPR.2017.591
- Brown and Cunningham (2007) Judy Brown and Steve Cunningham. 2007. A history of ACM Siggraph. Commun. ACM 50, 5 (2007), 54–61.
- Buriak (2011) Jillian Buriak. 2011. Summarize your work in 100 milliseconds or less… the importance of the table of contents image. , 7687–7689 pages.
- Byun et al. (2021) Jaeseok Byun, Sungmin Cha, and Taesup Moon. 2021. Fbi-denoiser: Fast blind image denoiser for poisson-gaussian noise. In Proceedings of the IEEE/CVF Conference on Computer Vision and Pattern Recognition. 5768–5777.
- Chan et al. (2021) Kelvin C.K. Chan, Xintao Wang, Xiangyu Xu, Jinwei Gu, and Chen Change Loy. 2021. GLEAN: Generative Latent Bank for Large-Factor Image Super-Resolution. In 2021 IEEE/CVF Conference on Computer Vision and Pattern Recognition (CVPR). 14240–14249. https://doi.org/10.1109/CVPR46437.2021.01402
- Chella et al. (1999) Antonio Chella, Vito Di Gesù, Ignazio Infantino, Daniela Intravaia, and Cesare Valenti. 1999. A cooperating strategy for objects recognition. In Shape, Contour and Grouping in Computer Vision. Springer, 264–274.
- Chen et al. (2021) Jian Chen, Meng Ling, Rui Li, Petra Isenberg, Tobias Isenberg, Michael Sedlmair, Torsten Möller, Robert S Laramee, Han-Wei Shen, Katharina Wünsche, et al. 2021. Vis30k: A collection of figures and tables from ieee visualization conference publications. IEEE Transactions on Visualization and Computer Graphics 27, 9 (2021), 3826–3833.
- Chen et al. (2017) Wen Chen, David J. Crandall, and Norman Makoto Su. 2017. Understanding the Aesthetic Evolution of Websites: Towards a Notion of Design Periods. In Proceedings of the 2017 CHI Conference on Human Factors in Computing Systems (CHI ’17). ACM, New York, NY, USA, 5976–5987. https://doi.org/10.1145/3025453.3025607
- Choi et al. (2021) Sungha Choi, Sanghun Jung, Huiwon Yun, Joanne T. Kim, Seungryong Kim, and Jaegul Choo. 2021. RobustNet: Improving Domain Generalization in Urban-Scene Segmentation via Instance Selective Whitening. In 2021 IEEE/CVF Conference on Computer Vision and Pattern Recognition (CVPR). 11575–11585. https://doi.org/10.1109/CVPR46437.2021.01141
- Dai et al. (2021) Zihang Dai, Hanxiao Liu, Quoc V Le, and Mingxing Tan. 2021. Coatnet: Marrying convolution and attention for all data sizes. Advances in Neural Information Processing Systems 34 (2021), 3965–3977.
- Davenport and Beck (2001) Thomas H Davenport and John C Beck. 2001. The attention economy. Ubiquity 2001, May (2001), 1–es.
- Davila et al. (2020) Kenny Davila, Srirangaraj Setlur, David Doermann, Bhargava Urala Kota, and Venu Govindaraju. 2020. Chart mining: A survey of methods for automated chart analysis. IEEE transactions on pattern analysis and machine intelligence 43, 11 (2020), 3799–3819.
- Deng et al. (2009) Jia Deng, Wei Dong, Richard Socher, Li-Jia Li, Kai Li, and Li Fei-Fei. 2009. Imagenet: A large-scale hierarchical image database. In 2009 IEEE conference on computer vision and pattern recognition. Ieee, 248–255.
- Denton et al. (2021) Emily Denton, Alex Hanna, Razvan Amironesei, Andrew Smart, and Hilary Nicole. 2021. On the genealogy of machine learning datasets: A critical history of ImageNet. Big Data & Society 8, 2 (2021), 20539517211035955.
- Divvala et al. (2014) Santosh K. Divvala, Ali Farhadi, and Carlos Guestrin. 2014. Learning Everything about Anything: Webly-Supervised Visual Concept Learning. In 2014 IEEE Conference on Computer Vision and Pattern Recognition. 3270–3277. https://doi.org/10.1109/CVPR.2014.412
- Doosti et al. (2020) Bardia Doosti, Shujon Naha, Majid Mirbagheri, and David J Crandall. 2020. Hope-net: A graph-based model for hand-object pose estimation. In Proceedings of the IEEE/CVF conference on computer vision and pattern recognition. 6608–6617.
- Ethayarajh and Jurafsky (2020) Kawin Ethayarajh and Dan Jurafsky. 2020. Utility is in the eye of the user: A critique of NLP leaderboards. arXiv preprint arXiv:2009.13888 (2020).
- Feldman and March (1981) Martha S Feldman and James G March. 1981. Information in Organizations as Signal and Symbol. Administrative Science Quarterly 26, 2 (1981), 171–186.
- Foucault (2013) Michel Foucault. 2013. Archaeology of knowledge. routledge.
- Gaboury (2021) Jacob Gaboury. 2021. Image objects: An archaeology of computer graphics. MIT Press.
- Gao and Grauman (2021) Ruohan Gao and Kristen Grauman. 2021. Visualvoice: Audio-visual speech separation with cross-modal consistency. In 2021 IEEE/CVF Conference on Computer Vision and Pattern Recognition (CVPR). IEEE, 15490–15500.
- Glaser and Strauss (2017) Barney G Glaser and Anselm L Strauss. 2017. The discovery of grounded theory: Strategies for qualitative research. Routledge.
- Gobert and Beaudouin-Lafon (2022) Camille Gobert and Michel Beaudouin-Lafon. 2022. i-LaTeX: Manipulating Transitional Representations between LaTeX Code and Generated Documents. In CHI Conference on Human Factors in Computing Systems. 1–16.
- Goldhaber (1997) Michael H Goldhaber. 1997. The attention economy and the net. First Monday (1997).
- Goldstone and Underwood (2014) Andrew Goldstone and Ted Underwood. 2014. The quiet transformations of literary studies: What thirteen thousand scholars could tell us. New Literary History 45, 3 (2014), 359–384.
- Goree et al. (2022) Samuel Goree, David Crandall, and Norman Makoto Su. 2022. “It Was Really All About Books:” Speech-like Techno-Masculinity in the Rhetoric of Dot-Com Era Web Design Books. ACM Transactions on Computer-Human Interaction (2022).
- Goree et al. (2021) Samuel Goree, Bardia Doosti, David Crandall, and Norman Makoto Su. 2021. Investigating the homogenization of web design: A mixed-methods approach. In Proceedings of the 2021 CHI Conference on Human Factors in Computing Systems. 1–14.
- Guo et al. (2021) Jianyuan Guo, Kai Han, Yunhe Wang, Han Wu, Xinghao Chen, Chunjing Xu, and Chang Xu. 2021. Distilling object detectors via decoupled features. In Proceedings of the IEEE/CVF Conference on Computer Vision and Pattern Recognition. 2154–2164.
- Haber et al. (2014) Jonathan Haber, Miguel A Nacenta, and Sheelagh Carpendale. 2014. Paper vs. tablets: The effect of document media in co-located collaborative work. In Proceedings of the 2014 international working conference on advanced visual interfaces. 89–96.
- Hara et al. (2000) Shunsuke Hara, Nobuyuki Ohtake, Mika Higuchi, Noriko Miyazaki, Ayako Watanabe, Kanako Kusunoki, and Hiroshi Sato. 2000. MathBraille; a system to transform LATEX documents into Braille. ACM SIGCAPH Computers and the Physically Handicapped 66 (2000), 17–20.
- Harper (2019) Richard HR Harper. 2019. The Role of HCI in the Age of AI. International Journal of Human–Computer Interaction 35, 15 (2019), 1331–1344.
- He et al. (2021) Yinan He, Bei Gan, Siyu Chen, Yichun Zhou, Guojun Yin, Luchuan Song, Lu Sheng, Jing Shao, and Ziwei Liu. 2021. Forgerynet: A versatile benchmark for comprehensive forgery analysis. In Proceedings of the IEEE/CVF conference on computer vision and pattern recognition. 4360–4369.
- Head et al. (2021) Andrew Head, Kyle Lo, Dongyeop Kang, Raymond Fok, Sam Skjonsberg, Daniel S Weld, and Marti A Hearst. 2021. Augmenting scientific papers with just-in-time, position-sensitive definitions of terms and symbols. In Proceedings of the 2021 CHI Conference on Human Factors in Computing Systems. 1–18.
- Head et al. (2022) Andrew Head, Amber Xie, and Marti A Hearst. 2022. Math Augmentation: How Authors Enhance the Readability of Formulas using Novel Visual Design Practices. In CHI Conference on Human Factors in Computing Systems. 1–18.
- Hruby et al. (2022) Petr Hruby, Timothy Duff, Anton Leykin, and Tomas Pajdla. 2022. Learning to Solve Hard Minimal Problems. In Proceedings of the IEEE/CVF Conference on Computer Vision and Pattern Recognition. 5532–5542.
- Huang (2018) Jia-Bin Huang. 2018. Deep paper gestalt. arXiv preprint arXiv:1812.08775 (2018).
- Huang (2020) Jia Bin Huang. 2020. “Sharing some LaTeX hacks I like (and trying to crowdsource more)! *Teaser* Popularized by Randy Pausch’s paper in 1996, now most papers start with a teaser. Make sure that you have an awesome one”. Tweet. https://twitter.com/jbhuang0604/status/1340178056296722434.
- Huhtamo and Parikka (2011) Erkki Huhtamo and Jussi Parikka. 2011. Media archaeology: Approaches, applications, and implications. Univ of California Press. 3 pages.
- Huynh et al. (2018) Loc Huynh, Weikai Chen, Shunsuke Saito, Jun Xing, Koki Nagano, Andrew Jones, Paul Debevec, and Hao Li. 2018. Mesoscopic Facial Geometry Inference Using Deep Neural Networks. In 2018 IEEE/CVF Conference on Computer Vision and Pattern Recognition. 8407–8416. https://doi.org/10.1109/CVPR.2018.00877
- Ingersoll and Ingersoll (1987) Fern Ingersoll and Jasper Ingersoll. 1987. Both a borrower and a lender be: Ethnography, oral history, and grounded theory. The Oral History Review 15, 1 (1987), 81–102.
- Kasdorf (1998) Bill Kasdorf. 1998. SGML and PDF–Why We Need Both. Journal of Electronic Publishing 3, 4 (1998).
- Kocabas et al. (2020) Muhammed Kocabas, Nikos Athanasiou, and Michael J. Black. 2020. VIBE: Video Inference for Human Body Pose and Shape Estimation. In 2020 IEEE/CVF Conference on Computer Vision and Pattern Recognition (CVPR). 5252–5262. https://doi.org/10.1109/CVPR42600.2020.00530
- Kong et al. (2022) Naejin Kong, Kiwoong Park, and Harshith Goka. 2022. Hole-robust Wireframe Detection. In Proceedings of the IEEE/CVF Winter Conference on Applications of Computer Vision. 1636–1645.
- Krizhevsky et al. (2012) Alex Krizhevsky, Ilya Sutskever, and Geoffrey E Hinton. 2012. ImageNet Classification with Deep Convolutional Neural Networks. In Advances in Neural Information Processing Systems, F. Pereira, C.J. Burges, L. Bottou, and K.Q. Weinberger (Eds.), Vol. 25. Curran Associates, Inc. https://proceedings.neurips.cc/paper/2012/file/c399862d3b9d6b76c8436e924a68c45b-Paper.pdf
- Kundu et al. (2016) Abhijit Kundu, Vibhav Vineet, and Vladlen Koltun. 2016. Feature Space Optimization for Semantic Video Segmentation. In 2016 IEEE Conference on Computer Vision and Pattern Recognition (CVPR). 3168–3175. https://doi.org/10.1109/CVPR.2016.345
- Latour (1987) Bruno Latour. 1987. Science in action: How to follow scientists and engineers through society. Harvard university press.
- Lee-Robbins and Adar (2022) Elsie Lee-Robbins and Eytan Adar. 2022. Affective Learning Objectives for Communicative Visualizations. (2022), 11.
- Li et al. (2021) Shichao Li, Zengqiang Yan, Hongyang Li, and Kwang-Ting Cheng. 2021. Exploring intermediate representation for monocular vehicle pose estimation. In Proceedings of the IEEE/CVF Conference on Computer Vision and Pattern Recognition. 1873–1883.
- Lin et al. (2014) Tsung-Yi Lin, Michael Maire, Serge Belongie, James Hays, Pietro Perona, Deva Ramanan, Piotr Dollár, and C Lawrence Zitnick. 2014. Microsoft coco: Common objects in context. In European conference on computer vision. Springer, 740–755.
- Liu et al. (2021) Xiao-Chang Liu, Yong-Liang Yang, and Peter Hall. 2021. Learning to Warp for Style Transfer. In 2021 IEEE/CVF Conference on Computer Vision and Pattern Recognition (CVPR). 3701–3710. https://doi.org/10.1109/CVPR46437.2021.00370
- Luckiesh and Moss (1941) Matthew Luckiesh and Frank Kendall Moss. 1941. The effect of line-length on readability. Journal of Applied Psychology 25, 1 (1941), 67.
- Manovich (2002) Lev Manovich. 2002. The language of new media. MIT press.
- Manzoor et al. (2018) Ahtsham Manzoor, Murayyiam Parvez, Suleman Shahid, and Asim Karim. 2018. Assistive Debugging to Support Accessible Latex Based Document Authoring. In Proceedings of the 20th International ACM SIGACCESS Conference on Computers and Accessibility. 432–434.
- Marx (2004) Karl Marx. 2004. Capital: volume I. Vol. 1. Penguin UK.
- Montfort et al. (2014) Nick Montfort, Patsy Baudoin, John Bell, Ian Bogost, and Jeremy Douglass. 2014. 10 PRINT CHR $(205.5+ RND (1));: GOTO 10. MIT Press.
- Moretti (2009) Franco Moretti. 2009. Style, Inc. Reflections on Seven Thousand Titles (British Novels, 1740–1850). Critical Inquiry 36, 1 (2009), 134–158.
- Odom et al. (2009) William Odom, James Pierce, Erik Stolterman, and Eli Blevis. 2009. Understanding why we preserve some things and discard others in the context of interaction design. In Proceedings of the SIGCHI Conference on Human Factors in Computing Systems. 1053–1062.
- Ohme et al. (2011) Rafal Ohme, Michal Matukin, and Beata Pacula-Lesniak. 2011. Biometric measures for interactive advertising research. Journal of interactive advertising 11, 2 (2011), 60–72.
- Øversveen (2022) Emil Øversveen. 2022. Capitalism and alienation: Towards a Marxist theory of alienation for the 21st century. European Journal of Social Theory 25, 3 (2022), 440–457.
- Patton (1990) Michael Quinn Patton. 1990. Qualitative Evaluation and Research Methods (second ed.). Thousand Oaks: Sage Publications, Inc.
- Paullada et al. (2021) Amandalynne Paullada, Inioluwa Deborah Raji, Emily M Bender, Emily Denton, and Alex Hanna. 2021. Data and its (dis) contents: A survey of dataset development and use in machine learning research. Patterns 2, 11 (2021), 100336.
- Pausch et al. (1996) Randy Pausch, Jon Snoddy, Robert Taylor, Scott Watson, and Eric Haseltine. 1996. Disney’s Aladdin: first steps toward storytelling in virtual reality. In Proceedings of the 23rd annual conference on Computer graphics and interactive techniques. 193–203.
- Pine and Liboiron (2015) Kathleen H Pine and Max Liboiron. 2015. The politics of measurement and action. In Proceedings of the 33rd Annual ACM Conference on Human Factors in Computing Systems. 3147–3156.
- Piorkowski et al. (2021) David Piorkowski, Soya Park, April Yi Wang, Dakuo Wang, Michael Muller, and Felix Portnoy. 2021. How ai developers overcome communication challenges in a multidisciplinary team: A case study. Proceedings of the ACM on Human-Computer Interaction 5, CSCW1 (2021), 1–25.
- Premachandran et al. (2014) Vittal Premachandran, Daniel Tarlow, and Dhruv Batra. 2014. Empirical Minimum Bayes Risk Prediction: How to Extract an Extra Few % Performance from Vision Models with Just Three More Parameters. In 2014 IEEE Conference on Computer Vision and Pattern Recognition. 1043–1050. https://doi.org/10.1109/CVPR.2014.137
- Ramos and Concepcion (2020) Everly Ramos and Beatrice P Concepcion. 2020. Visual abstracts: redesigning the landscape of research dissemination. In Seminars in nephrology, Vol. 40. Elsevier, 291–297.
- Redmon et al. (2016) Joseph Redmon, Santosh Divvala, Ross Girshick, and Ali Farhadi. 2016. You only look once: Unified, real-time object detection. In Proceedings of the IEEE conference on computer vision and pattern recognition. 779–788.
- Redmon and Farhadi (2017) Joseph Redmon and Ali Farhadi. 2017. YOLO9000: better, faster, stronger. In Proceedings of the IEEE conference on computer vision and pattern recognition. 7263–7271.
- Rose (2016) Gillian Rose. 2016. Visual methodologies: An introduction to researching with visual materials. sage.
- Scheuerman et al. (2021) Morgan Klaus Scheuerman, Alex Hanna, and Emily Denton. 2021. Do datasets have politics? Disciplinary values in computer vision dataset development. Proceedings of the ACM on Human-Computer Interaction 5, CSCW2 (2021), 1–37.
- Sculley et al. (2018) David Sculley, Jasper Snoek, Alex Wiltschko, and Ali Rahimi. 2018. Winner’s curse? On pace, progress, and empirical rigor. (2018).
- Shopes (2011) Linda Shopes. 2011. Oral history. The SAGE handbook of qualitative research (2011), 451–465.
- Stalling and Hege (1995) Detlev Stalling and Hans-Christian Hege. 1995. Fast and resolution independent line integral convolution. In Proceedings of the 22nd annual conference on Computer graphics and interactive techniques. 249–256.
- Su and Crandall (2021) Norman Makoto Su and David J Crandall. 2021. The affective growth of computer vision. In Proceedings of the IEEE/CVF Conference on Computer Vision and Pattern Recognition. 9291–9300.
- Tapaswi et al. (2016) Makarand Tapaswi, Yukun Zhu, Rainer Stiefelhagen, Antonio Torralba, Raquel Urtasun, and Sanja Fidler. 2016. MovieQA: Understanding Stories in Movies through Question-Answering. In 2016 IEEE Conference on Computer Vision and Pattern Recognition (CVPR). 4631–4640. https://doi.org/10.1109/CVPR.2016.501
- Taylor et al. (2015) Brian Taylor, Vasiliy Karasev, and Stefano Soattoc. 2015. Causal video object segmentation from persistence of occlusions. In 2015 IEEE Conference on Computer Vision and Pattern Recognition (CVPR). 4268–4276. https://doi.org/10.1109/CVPR.2015.7299055
- Triggs et al. (2000) Bill Triggs, Andrew Zisserman, and Richard Szeliski. 2000. Vision Algorithms: Theory and Practice: International Workshop on Vision Algorithms Corfu, Greece, September 21–22, 1999 Proceedings. Springer.
- Ummenhofer et al. (2017) Benjamin Ummenhofer, Huizhong Zhou, Jonas Uhrig, Nikolaus Mayer, Eddy Ilg, Alexey Dosovitskiy, and Thomas Brox. 2017. Demon: Depth and motion network for learning monocular stereo. In Proceedings of the IEEE conference on computer vision and pattern recognition. 5038–5047.
- van Koningsbruggen and Hornecker (2021) Rosa van Koningsbruggen and Eva Hornecker. 2021. “It’s Just a Graph” – The Effect of Post-Hoc Rationalisation on InfoVis Evaluation. In Creativity and Cognition (C&C ’21). Association for Computing Machinery, New York, NY, USA, 1–10. https://doi.org/10.1145/3450741.3465257
- Von Bearnensquash (2010) Carven Von Bearnensquash. 2010. Paper gestalt. Secret Proceedings of Computer Vision and Pattern Recognition (CVPR) (2010).
- Wang et al. (2021) Shaofei Wang, Andreas Geiger, and Siyu Tang. 2021. Locally Aware Piecewise Transformation Fields for 3D Human Mesh Registration. In 2021 IEEE/CVF Conference on Computer Vision and Pattern Recognition (CVPR). 7635–7644. https://doi.org/10.1109/CVPR46437.2021.00755
- Weinzaepfel et al. (2011) Philippe Weinzaepfel, Hervé Jégou, and Patrick Pérez. 2011. Reconstructing an image from its local descriptors. In CVPR 2011. 337–344. https://doi.org/10.1109/CVPR.2011.5995616
- Wilkinson and Light (2011) Krista M Wilkinson and Janice Light. 2011. Preliminary investigation of visual attention to human figures in photographs: Potential considerations for the design of aided AAC visual scene displays. (2011).
- Willett et al. (2021) Wesley Willett, Bon Adriel Aseniero, Sheelagh Carpendale, Pierre Dragicevic, Yvonne Jansen, Lora Oehlberg, and Petra Isenberg. 2021. Superpowers as inspiration for visualization. IEEE TVCG 2021 (2021).
- Wu et al. (2021) Aoyu Wu, Yun Wang, Xinhuan Shu, Dominik Moritz, Weiwei Cui, Haidong Zhang, Dongmei Zhang, and Huamin Qu. 2021. Ai4vis: Survey on artificial intelligence approaches for data visualization. IEEE Transactions on Visualization and Computer Graphics (2021).
- Zhang et al. (2017) Chao Zhang, Sergi Pujades, Michael Black, and Gerard Pons-Moll. 2017. Detailed, Accurate, Human Shape Estimation from Clothed 3D Scan Sequences. In 2017 IEEE Conference on Computer Vision and Pattern Recognition (CVPR). 5484–5493. https://doi.org/10.1109/CVPR.2017.582
- Zheng et al. (2021) Mianlun Zheng, Yi Zhou, Duygu Ceylan, and Jernej Barbič. 2021. A Deep Emulator for Secondary Motion of 3D Characters. In 2021 IEEE/CVF Conference on Computer Vision and Pattern Recognition (CVPR). 5928–5936. https://doi.org/10.1109/CVPR46437.2021.00587