High Resolution Polar Kerr Effect Studies of CsV3Sb5: Tests for Time Reversal Symmetry Breaking Below the Charge Order Transition
Abstract
We report high resolution polar Kerr effect measurements on CsV3Sb5 single crystals in search for signatures of spontaneous time reversal symmetry breaking below the charge order transition at K. Utilizing two different versions of zero-area loop Sagnac interferometers operating at 1550 nm wavelength, each with the fundamental attribute that without a time reversal symmetry breaking sample at its path, the interferometer is perfectly reciprocal, we find no observable Kerr effect to within the noise floor limit of the apparatus at 30 nanoradians. Simultaneous coherent reflection ratio measurements confirm the sharpness of the charge order transition in the same optical volume as the Kerr measurements. At finite magnetic field we observe a sharp onset of a diamagnetic shift in the Kerr signal at , which persists down to the lowest temperature without change in trend. Since 1550 nm is an energy that was shown to capture all features of the optical properties of the material that interact with the charge order transition, we are led to conclude that it is highly unlikely that time reversal symmetry is broken in the charge ordered state in CsV3Sb5.
pacs:
NaNSymmetry-breaking is the phenomenon where an infinitesimal perturbation can cause the system to break the underlying symmetry of the Hamiltonian. And it is a cornerstone concept in the understanding and manipulation of quantum materials. The state of a system can also be manipulated without explicit symmetry-breaking by controlling topological aspects of the material in momentum space, thereby regulating the electronic band-structure. When strong electron correlations dominate, the system is often observed to be close to multiple competing ordered phases with similar energies. For example, the appearance of charge order may trigger competition with an emerging new electronic state, which in turn leads to the phenomenon of “intertwined order” Fradkin et al. (2015).
A particularly interesting material system in that respect are the quasi-two-dimensional kagomé compounds AV3Sb5 (A=K, Rb and Cs) Ortiz et al. (2019). These are layered materials with ideal kagomé lattice of V ions coordinated by Sb crystallizing in the P6/mmm space group. Cooling these materials below a temperature , the kagomé lattice distorts, undergoing a charge-order transition ( 80 K, 110 K and 94 K for K, Rb and Cs respectively) Ortiz et al. (2020, 2021a); Yin et al. (2021), which was shown to be associated with a CDW superstructure modulation displaying chiral anisotropy Jiang et al. (2021); Shumiya et al. (2021); Wang et al. (2021). Further investigation of the CDW transitions using hard-X-ray scattering revealed that the observed superstructure has in fact a three-dimensional (3D) nature with either or superstructure depending on conditions of crystal growth, imposed strain and sample’s thermal history Stahl et al. (2022); Ortiz et al. (2021b); Liang et al. (2021); Li et al. (2021); Stahl et al. (2022); Xiao et al. (2022). Intertwined order was initially identified with the discovery of superconductivity in this material system with K for CsV3Sb5 Ortiz et al. (2020), where the charge-order transition was first suspected to be wholly electronic in origin. However, detailed nuclear magnetic resonance (NMR) and nuclear quadrupole resonance (NQR) measurements on CsV3Sb5 single crystals revealed an orbital ordering at K clearly induced by a first order structural transition. This is accompanied by electronic charge order that appears to grow gradually below as a secondary (intertwined) order Song et al. (2022). In fact, a first order characteristic of the transition can be further deduced from the anomalous peak of the specific heat Ortiz et al. (2020); Yu et al. (2021a); Li et al. (2021) and the abrupt large diamagnetic shift of the magnetic susceptibility for magnetic field aligned with the -axis Ortiz et al. (2020); Yu et al. (2021a). The absence of such diamagnetic shift at for magnetic field in the plane for KV3Sb5 (see “Extended Data,” Fig. 3 in Mielke et al. (2022)) and the much reduced effect for CsV3Sb5 Chen et al. (2022) further support the NMR/NQR findings.
Focusing on the transitions at , a key issue of a possible co-occurrence of time-reversal symmetry breaking (TRSB) has emerged through claims of observation of anomalous Hall effect (AHE)Yang et al. (2020); Yu et al. (2021a); Zhou et al. (2022), changes in muon spin relaxation rate below Yu et al. (2021b); Mielke et al. (2022); Khasanov et al. (2022), and magneto-optic Kerr effects Wu et al. (2022); Xu et al. (2022); Hu et al. (2022). From a theoretical standpoint, a CDW formation in kagome metals can appear through both electronically and phonon-mediated mechanisms, or a cooperative version thereof. For CsV3Sb5 , both electronic and phonon fluctuations seems to be relevant due to the joint presence of van Hove singularities nearby the Fermi level and prominent breathing-phonon modes Feng et al. (2021); Denner et al. (2021); Tan et al. (2021); Park et al. (2021). The possible appearance of orbital currents has suggested the possibility of a TRSB state below , along with an enhanced propensity to nematicity due to multiple CDW nesting vectors Denner et al. (2021); Wulferding et al. (2022). Both TRSB and point group symmetry breaking via nematicity are secondary to the translation symmetry breaking and dependent on the precise microscopic setting involving temperature, disorder, and interaction profile.
In this paper we aim to closely examine possible TRSB in high quality crystals of CsV3Sb5 via high resolution measurements of the polar Kerr effect. To substantiate our findings, we use crystals grown in two different laboratories (MPI-Dresden and UC Santa Barbara), all showing salient attributes of the charge order transition at K. Further we use two different zero-area-loop Sagnac interferometers (ZALSI) Xia et al. (2006a) operating at a wavelength of 1550 nm, one at Stanford University and one at UC Irvine to measure Kerr rotation through the CDW transition, both in zero and in finite magnetic fields. While we clearly observe the abrupt onset of optical birefringence and/or dichroism associated with the structural transition, we see no evidence for a spontaneous Kerr effect below within the volume of the same optical beam to a measurement limit of nanoradians, neither in zero-field cool, nor after training with a magnetic field up to 0.34 T. Measurements in an applied magnetic field reveal a diamagnetic Kerr shift, which onsets abruptly below similar to the magnetic susceptibility Ortiz et al. (2020), but unlike the susceptibility, it stays diamagnetic down to low temperatures.
Our results stand in stark contrast to previously published optical measurements claiming finite spontaneous Kerr effects. Two experiments Wu et al. (2022); Xu et al. (2022) performed at nm wavelength measured rotation of linearly polarized light at oblique reflection angle, while the third Hu et al. (2022) used a similar apparatus to our ZALSI at 1550 nm. We discuss the differences between our measurement and reports Wu et al. (2022); Xu et al. (2022) in detail below. As for the third report Hu et al. (2022), we speculate that a series of uncontrolled subtractions of data may have been the source of a false positive result.
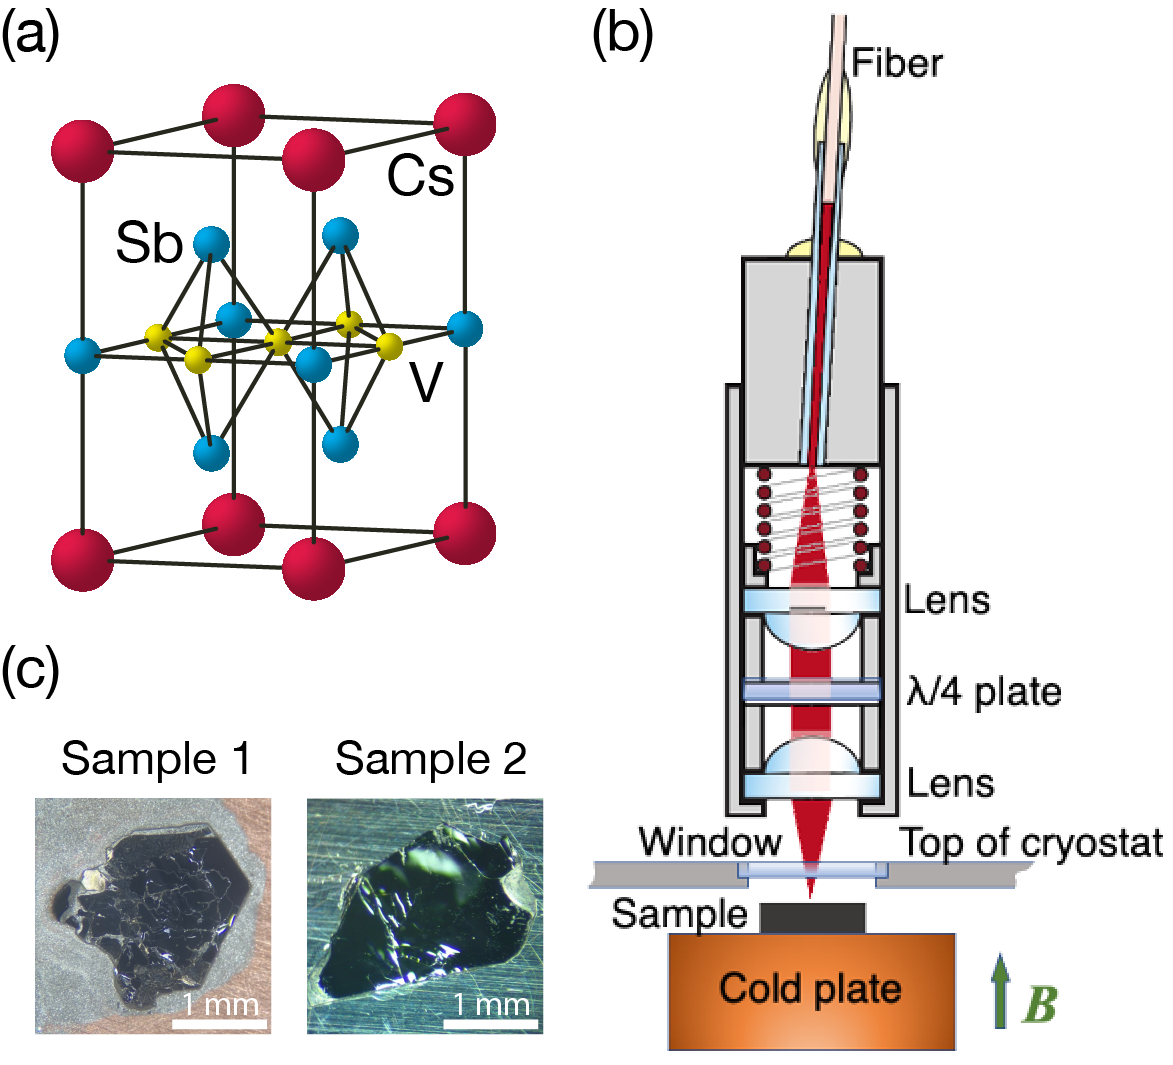
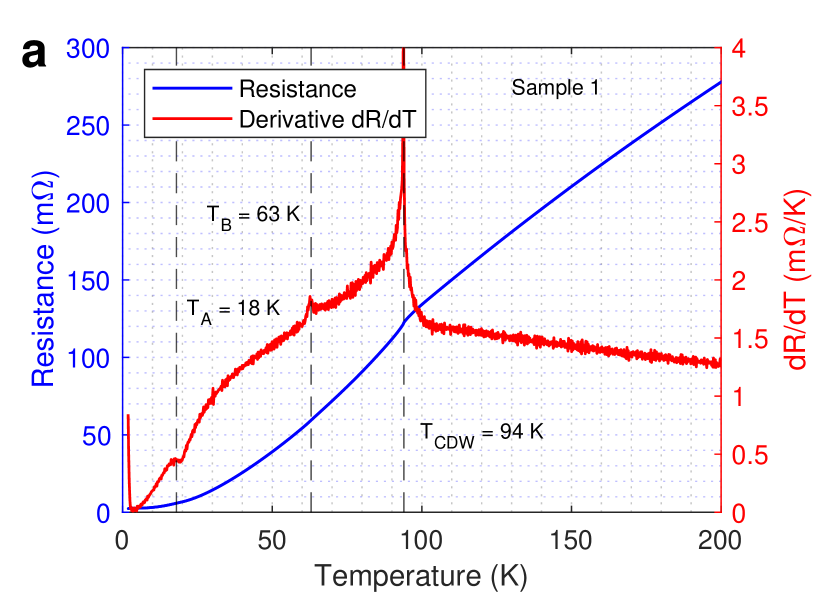
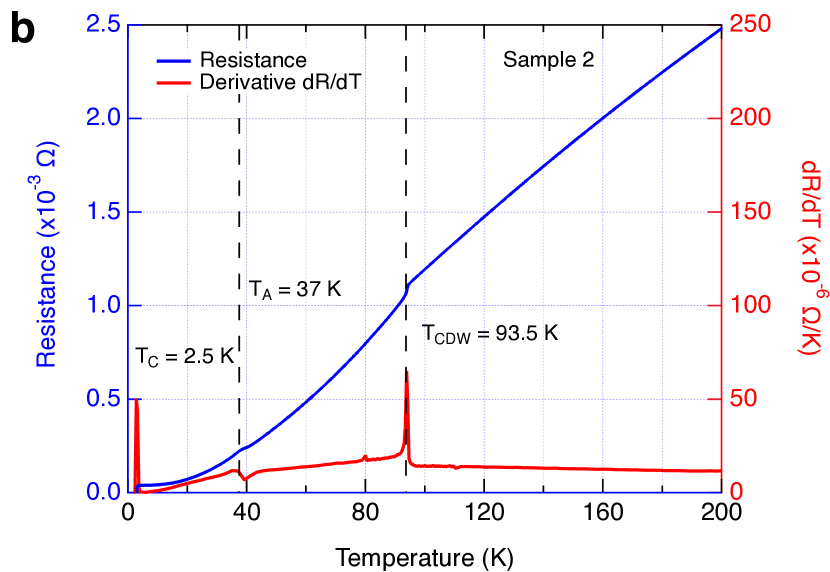
In this study we use high quality and well-characterized single crystals of CsV3Sb5 obtained from two different sources. Samples grown at UCSB (dubbed sample 2) followed the previously published procedure found in Ortiz et al. (2020) and related publications, while samples grown at MPI-Dresden (dubbed sample 1) followed the previously published procedure found in Huang et al. (2022) and related publications. The crystal structure of CsV3Sb5 and photos of two example crystals from the two sources are presented in Fig. 1. Specific heat data obtained on these crystals show the “standard” sharp first–order–like transition peak at 93.5 K as is shown in Fig. 2. This charge density transition is also marked by the kink in DC resistance and the pronounced peak in its first derivative as shown in Supplemetary Figure sup . Moreover, we observe two additional features in the curve. There is a dispersive line shape close to the temperatures where a kink was observed in NMR Song et al. (2022) and where the electronic magneto-chiral anisotropy (eMChA) was observed in nonlinear transport Guo et al. (2022), suggesting an additional phase transition. Also there is a small bump in resistance derivative happening at temperatures below which could be related to either onset of CDW along direction or to formation of stripe order Li et al. (2023). Importantly, we also detect onset of charge order simultaneously with Kerr effect measurements within the same optical volume through reflectivity and coherent reflection ratio measurements.
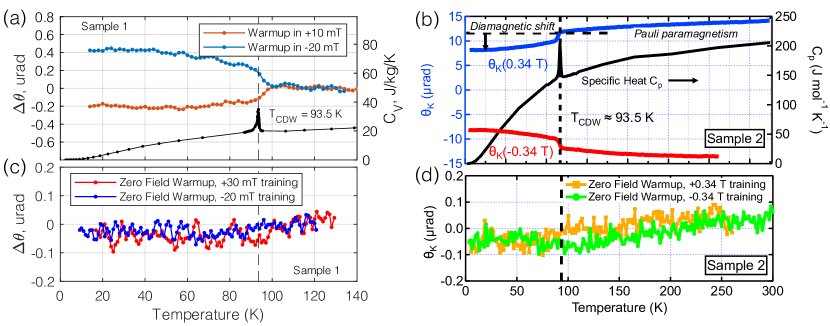
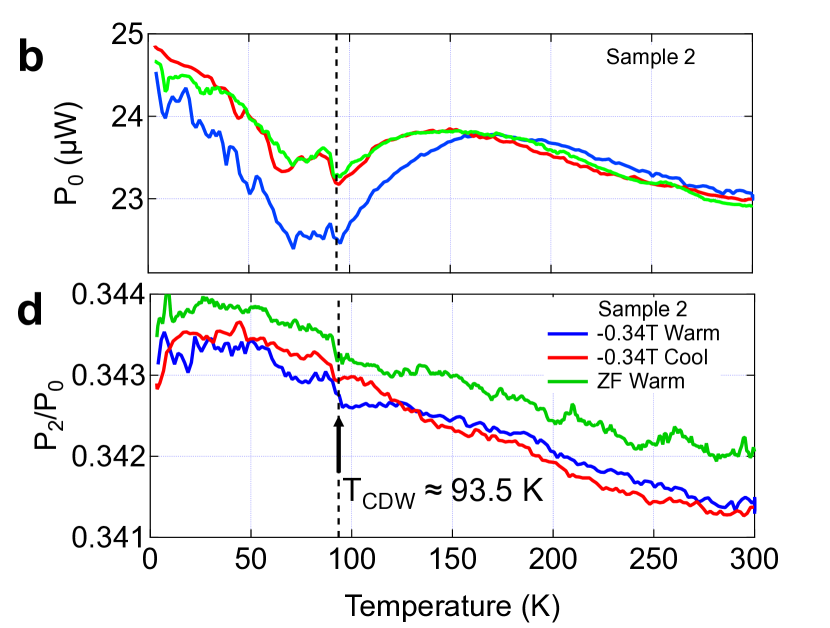
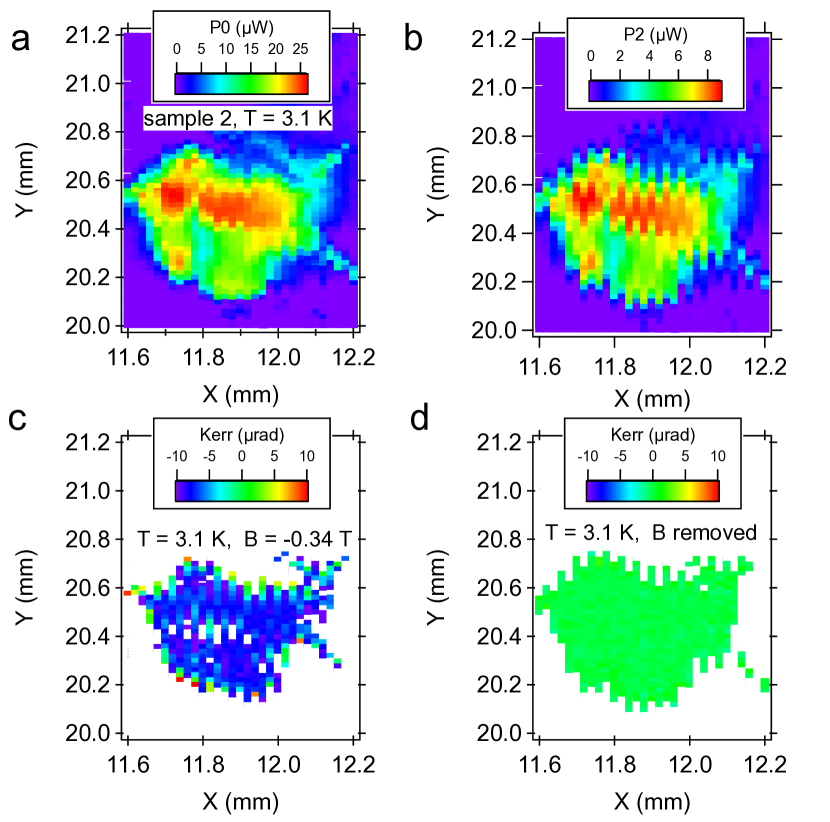
High resolution Polar Kerr effect measurements presented in this paper were performed using zero-area-loop Sagnac interferometers (ZALSI) first introduced by Xia et al. Xia et al. (2006a). By construction the ZALSI is inherently reciprocal and thus by its symmetry it can distinguish between true TRSB Kerr effect and optical activity when reflected from a chiral medium. The light beam of ZALSI is focused onto an optically flat region that can be hundreds of microns in size. One such region is illustrated in the scanning images of reflected power on sample 2 at provided in supplementary materials sup . In a magnetic field of -0.34 T the Kerr signal is uniform across this flat region. The temperature dependence of the in-field Kerr signals at fixed spots are shown in Fig. 2A for sample 1 measured at Stanford, and in Fig. 2B for sample 2 measured at Irvine, alongside the measured specific heat. In both cases, there is a clear and relatively abrupt onset of diamagnetic shift that coincides with the anomalous peak in the specific heat at , confirming the CDW transition in the probed optical volume.
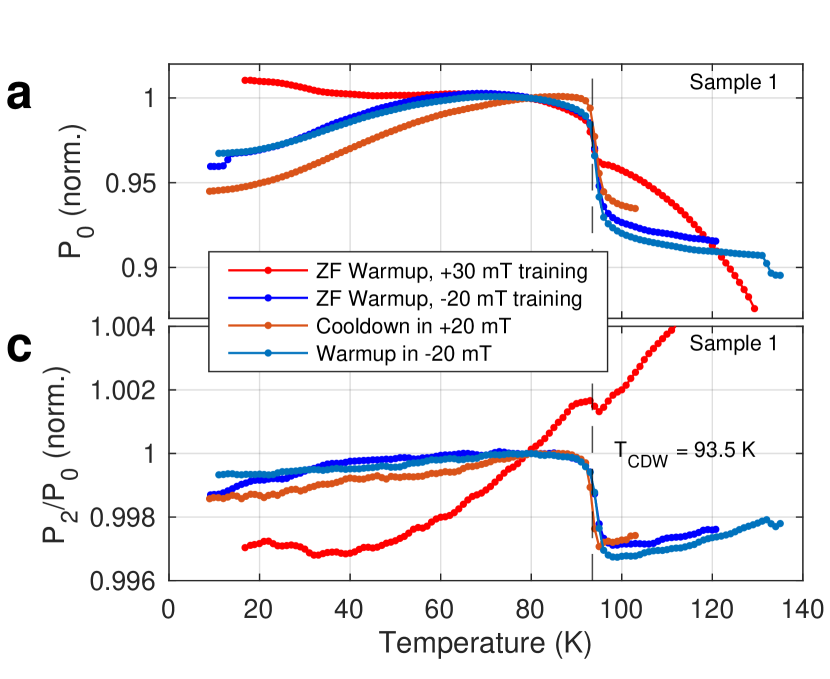
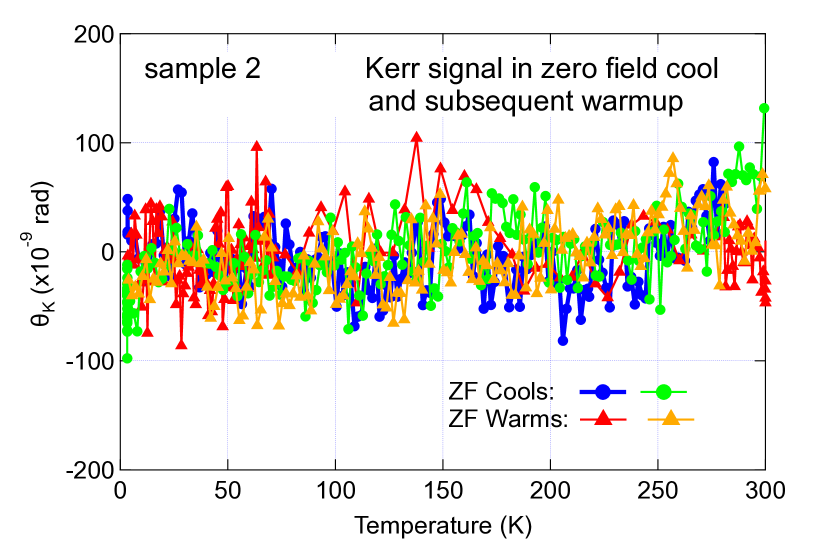
The main result of this work is the test for spontaneous Kerr effect in CsV3Sb5 . Kerr signal was recorded during zero field warmup after removal of a “training” magnetic field applied during cooldown. Results from the two laboratories are presented in Fig. 2C and Fig. 2D respectively, showing no discernible Kerr effect below to within 50 nrad. This uncertainty is a factor of smaller than the recent MOKE measurements Wu et al. (2022); Xu et al. (2022); Hu et al. (2022). Similarly, no spontaneous Kerr signal was found during zero field cooldowns and subsequent zero field warmups. The absence of spontaneous Kerr signal is also universally found across the sample surface, which can be seen in the scanning Kerr signal image presented in the supplementary materials sup taken on sample 2 at after removal of the -0.34 T magnetic field.
Our main result raises doubts to whether time reversal symmetry is indeed broken below in CsV3Sb5 . On the other hand, measurements at a finite magnetic field oriented along the -axis show a clear and relatively abrupt diamagnetic shift in the Kerr effect, which near behaves similarly to the in-field magnetic susceptibility measurements Ortiz et al. (2020); Yu et al. (2021a); Wang et al. (2021). However, the detected average (DC) optical power () and the coherent reflection ratio () (see supplementary material sup ) measurements in either zero field or in-field, which are taken simultaneously with the Kerr measurements within the same optical volume, consistently show an abrupt transition at with a width of to 3 K, irrespective of the applied fields (similar result is reported in Zhou et al. (2021); Uykur et al. (2021)). Since TRSB effect is expected to be secondary to any structural or CDW transitions, and grow gradually below Denner et al. (2021), it is unlikely that the observed abrupt changes in the differential reflectivity are associated with such a TRSB effect. A similar scenario was previously observed in the Cuprate superconductors where a first-order structural transition from an orthorhombic to tetragonal phase at (so called LTO to LTT transition) in La2-xBaxCuO4 Hücker et al. (2011) was accompanied by a charge-order transition with an order parameter that evolved gradually below .
The bulk magnetic susceptibility of CsV3Sb5 has been previously shown to develop a paramagnetic response below K Ortiz et al. (2020); Yu et al. (2021a); Wang et al. (2021), presumably due to bulk impurities, overwhelming the initial diamagnetic drop below . The Sagnac interferometers probe only the freshly cleaved surface region within a small volume defined by the beam diameter m and the optical penetration depth nm, and thus are less susceptible to these bulk impurities, particularly as we typically use a lower magnetic field. Hence, the change in the Kerr signal below stays diamagnetic and is almost temperature independent as seen in the relative Kerr angle for sample 1 in Fig. 2A and in the absolute Kerr signal for sample 2 in Fig. 2B.
The susceptibility measurements on CsV3Sb5 further show that the diamagnetic drop with the field along the plane is almost 5 times weaker than if the field points in the -direction, where earlier results on KV3Sb5 show no diamagnetic shift for the field along the -plane Ortiz et al. (2020). These observations indicate that the diamagnetic response originates from in-plane effect, presumably orbital effects such as non-interacting loop currents as suggested by the NMR/NQR experiments Song et al. (2022). In contrast, the paramagnetic response observed in magnetic susceptibility is isotropic with respect to the applied magnetic field and remains on the scale of the Pauli paramagnetism above . Hence, we conclude that we have no evidence for spontaneous ferromagnetic orderings of loop currents. However, our results still allow for an antiferromagnetic ordering of loop currents.
Next we provide our speculations on why results reported here are in contrast to other optical measurements that attempt to measure Kerr effect in the AV3Sb5 systems Wu et al. (2022); Xu et al. (2022). First of all, we note that while the ZALSI is designed to only detect TRSB effects in the sample as an excess signal beyond the natural reciprocity of the apparatus, other techniques may need to employ less controlled means to scrutinize true TRSB effects. Secondly, we note that measurements Wu et al. (2022); Xu et al. (2022) have been made at oblique incident angle, while we have measured light reflected at normal incidence. It is known that, in an optically active material, the polarization of reflected light at oblique incidence will always rotate with respect to the initial state of polarization irrespective of orientation between initial polarization and principal axes of the crystal Silverman (1987); Silverman et al. (1992). Furthermore, the statement that no finite optical rotation is possible for reflected light at normal incidence is true for polar Kerr effect, but does not apply to circular dichroism, which originates from different optical penetration depths for the two circularly polarized components. Thirdly, if circular dichroism is detected at normal incidence, it is not a proof for TRSB. In fact, in most cases it will indicate circular birefringence that respects time reversal symmetry. A notable example is reflection from the surface of tellurium, where large rotary power and circular dichroism were previously measured Fukuda et al. (1975); Ades and Champness (1975); Stolze et al. (1977), but no Kerr effect was detected using our ZALSI Fried (2014). Lastly, concerning the difference in photon wavelength used in our system and in Wu et al. (2022); Xu et al. (2022), we turn to the optical properties of CsV3Sb5 Zhou et al. (2021); Uykur et al. (2021, 2022) and note that our wavelength is close to the Lorenz peak in optical conductivity centered around m-1 wavenumbers (dubbed L1 in Zhou et al. (2021)), which is enhanced by CDW. Hence, we would expect that our wavelength probes exactly the electronic states responsible for charge order formation, unlike the nm wavelength which is further away from the CDW energy scale. Thus, we conclude that unless there is a special reason for Kerr rotation to zero at 1550 nm, which is unlikely in a good metal, our wavelength should provide a more sensitive probe compared to the one used in Wu et al. (2022); Xu et al. (2022).
The above discussion suggests that at least within the technical aspect, those other optical measurements fall short in comparison to the ZALSI, which inherently measures only non-reciprocal effects, thus returning a zero signal if time reversal symmetry is not broken. On the materials side we note that if the CDW is chiral along the -axis of the material, mirror symmetries are broken as was previously observed in STM Jiang et al. (2021); Shumiya et al. (2021); Wang et al. (2021), and circular dichroism is allowed. Moreover, a finite minimum value of polarization rotation will be present with magnitude that depends on the pitch of the chiral CDW, which depends on the initial symmetry of the unbroken state, as well as the optical penetration depth at the probing photon energy. These effects may then be incorrectly interpreted as signatures of TRSB. From the technical point of view we also note that using linear polarization to probe complex materials requires perfect alignments of the optical components with respect to the plane of incidence. For example, if rotation of the incident light polarization is performed using a perfect half-wave plate (HWP), which is tilted by a small angle with respect to the propagation axis, even a perfect metallic mirror will show an apparent polarization rotation Zhu (1994). For CsV3Sb5 parameters, a 5 degrees error in the HWP alignment yields a millirad error. Commercial zero-order HWPs have a typical retardance error of 1 even for normal incidence, yielding further errors.
Finally we briefly comment on the reported onset of anomalous Hall effect Yang et al. (2020); Yu et al. (2021a); Zhou et al. (2022) and change in muon spin relaxation below Yu et al. (2021b); Mielke et al. (2022); Khasanov et al. (2022). Indeed, the anomalous Hall effect is a direct measure of ferromagnetic order. However, in general it implies a finite value at zero applied magnetic field. Yet, all reports of AHE in CsV3Sb5 show no Hall resistance at zero magnetic field. In that respect this AHE is not strictly related to spontaneous TRSB effect and may come from non-TRSB chiral effects König et al. (2019) or change in carrier density and mobility due to charge order. Another set of experiments which are at odds with our results involve -Sr measurements, and in particular the study in Mielke et al. (2022) where a TRSB is inferred from a rather small change through a sharp onset in muons relaxation below at zero field, followed by an almost temperature independent trend at low temperatures. Indeed, as a purely magnetic probe, Sr is not directly sensitive to charge order and thus a change in relaxation might be interpreted as evidence for TRSB in the electronic system. However, Sr does sense the presence of charge order via the magnetic dipolar coupling of the muons with the host nuclei at zero or low magnetic fields (see e.g. Sonier (2015)). In particular, since the zero and low field effect in the Sr studies is abrupt and follows in trend the structural transition Song et al. (2022), it is likely to induce a change in the muons’ preferred “rest positions” above and below , which will show up as change in relaxation rates. While an all-electronic spontaneous TRSB buildup mechanism for the CDW Denner et al. (2021) is in principle not inconsistent with the Sr data deeper in the CDW phase, the abruptness in the Sr response at the transition cannot solely be reconciled from this angle, and suggests a pivotal role of phonon-mediated CDW formation related to a structural first order transition. Furthermore, the in-field enhancement of the signal in magnetic field seems to follow the NMR results, which again cannot directly point to a spontaneous TRSB.
In conclusion, we have used high resolution polar Kerr effect measurements to scrutinize previously reported submissions Wu et al. (2022); Xu et al. (2022); Hu et al. (2022) that time reversal symmetry is spontaneously broken below the charge order transition a in CsV3Sb5 (marked as ). For these studies we used two different variation of a zero-area loop Sagnac interferometer operating at 1550 nm wavelength, each with the fundamental attribute that without a time reversal symmetry breaking sample at its path, the interferometer is perfectly reciprocal and thus yield a zero Kerr signal at the detector to within its noise floor limit of nanoradians. We then show that high quality CsV3Sb5 single crystals obtained from two different crystal-growth laboratories show no resolvable Kerr signal at zero magnetic field to within the instruments noise floor level, whether the sample was cooled at zero field, or was trained through at a finite field and then measured at zero field upon warming up. Concurrent measurements of the coherent reflection ratio show a sharp transition within the same optical volume where Kerr effect was measured, thus supporting the robustness of our measurements. At finite magnetic field we observe a sharp diamagnetic transition at , similar to the transition observed in magnetic susceptibility, except that the Kerr data remain diamagnetic down to low temperatures without change in trend. Since 1550 nm is an energy that was shown to capture all features of the optical properties of the material that interact with the charge order transition, we are led to conclude that it is highly unlikely that time reversal symmetry is broken in the charge ordered state in CsV3Sb5 .
Note added:
during the review process of this manuscript, we’ve learnt that recent measurement Farhang et al. (2023) demonstrated that rotation of linear polarization in CsV3Sb5 has isotropic component even at normal incidence that is comparable in size to those found at 800 nm Wu et al. (2022); Xu et al. (2022). Moreover, it was found that does not respond to applied magnetic field and changes sign and magnitude from sample to sample. These suggest that the polarization rotations reported in Wu et al. (2022); Xu et al. (2022) may not be related to MOKE.
I Acknowledgements
Work at Stanford University was supported by the U.S. Department of Energy, Office of Science, Basic Energy Sciences, Division of Materials Sciences and Engineering, under Contract DE-AC02-76SF00515. Work at UC Irvine was supported by the Gordon and Betty Moore Foundation through Grant GBMF10276. S.D.W. and B.R.O. acknowledge support via the UC Santa Barbara NSF Quantum Foundry funded via the Q-AMASE-i program under award DMR-1906325. R.T. acknowledges support from the Deutsche Forschungsgemeinschaft (DFG, German Research Foundation) through QUAST FOR 5249-449872909 (Project P3), through Project-ID 258499086-SFB 1170, and from the Würzburg-Dresden Cluster of Excellence on Complexity and Topology in Quantum Matter – ct.qmat Project-ID 390858490-EXC 2147.
References
- Fradkin et al. (2015) E. Fradkin, S. A. Kivelson, and J. M. Tranquada, Rev. Mod. Phys. 87, 457 (2015).
- Ortiz et al. (2019) B. R. Ortiz, L. C. Gomes, J. R. Morey, M. Winiarski, M. Bordelon, J. S. Mangum, I. W. H. Oswald, J. A. Rodriguez-Rivera, J. R. Neilson, S. D. Wilson, E. Ertekin, T. M. McQueen, and E. S. Toberer, Phys. Rev. Materials 3, 094407 (2019).
- Ortiz et al. (2020) B. R. Ortiz, S. M. L. Teicher, Y. Hu, J. L. Zuo, P. M. Sarte, E. C. Schueller, A. M. M. Abeykoon, M. J. Krogstad, S. Rosenkranz, R. Osborn, R. Seshadri, L. Balents, J. He, and S. D. Wilson, Phys. Rev. Lett. 125, 247002 (2020).
- Ortiz et al. (2021a) B. R. Ortiz, P. M. Sarte, E. M. Kenney, M. J. Graf, S. M. L. Teicher, R. Seshadri, and S. D. Wilson, Phys. Rev. Materials 5, 034801 (2021a).
- Yin et al. (2021) Q. Yin, Z. Tu, C. Gong, Y. Fu, S. Yan, and H. Lei, Chinese Physics Letters 38, 037403 (2021).
- Jiang et al. (2021) Y.-X. Jiang, J.-X. Yin, M. M. Denner, N. Shumiya, B. R. Ortiz, G. Xu, Z. Guguchia, J. He, M. S. Hossain, X. Liu, J. Ruff, L. Kautzsch, S. S. Zhang, G. Chang, I. Belopolski, Q. Zhang, T. A. Cochran, D. Multer, M. Litskevich, Z.-J. Cheng, X. P. Yang, Z. Wang, R. Thomale, T. Neupert, S. D. Wilson, and M. Z. Hasan, Nature Materials 20, 1353 (2021).
- Shumiya et al. (2021) N. Shumiya, M. S. Hossain, J.-X. Yin, Y.-X. Jiang, B. R. Ortiz, H. Liu, Y. Shi, Q. Yin, H. Lei, S. S. Zhang, G. Chang, Q. Zhang, T. A. Cochran, D. Multer, M. Litskevich, Z.-J. Cheng, X. P. Yang, Z. Guguchia, S. D. Wilson, and M. Z. Hasan, Phys. Rev. B 104, 035131 (2021).
- Wang et al. (2021) Z. Wang, Y.-X. Jiang, J.-X. Yin, Y. Li, G.-Y. Wang, H.-L. Huang, S. Shao, J. Liu, P. Zhu, N. Shumiya, M. S. Hossain, H. Liu, Y. Shi, J. Duan, X. Li, G. Chang, P. Dai, Z. Ye, G. Xu, Y. Wang, H. Zheng, J. Jia, M. Z. Hasan, and Y. Yao, Phys. Rev. B 104, 075148 (2021).
- Stahl et al. (2022) Q. Stahl, D. Chen, T. Ritschel, C. Shekhar, E. Sadrollahi, M. C. Rahn, O. Ivashko, M. v. Zimmermann, C. Felser, and J. Geck, Phys. Rev. B 105, 195136 (2022).
- Ortiz et al. (2021b) B. R. Ortiz, S. M. L. Teicher, L. Kautzsch, P. M. Sarte, N. Ratcliff, J. Harter, J. P. C. Ruff, R. Seshadri, and S. D. Wilson, Phys. Rev. X 11, 041030 (2021b).
- Liang et al. (2021) Z. Liang, X. Hou, F. Zhang, W. Ma, P. Wu, Z. Zhang, F. Yu, J.-J. Ying, K. Jiang, L. Shan, Z. Wang, and X.-H. Chen, Phys. Rev. X 11, 031026 (2021).
- Li et al. (2021) H. Li, T. T. Zhang, T. Yilmaz, Y. Y. Pai, C. E. Marvinney, A. Said, Q. W. Yin, C. S. Gong, Z. J. Tu, E. Vescovo, C. S. Nelson, R. G. Moore, S. Murakami, H. C. Lei, H. N. Lee, B. J. Lawrie, and H. Miao, Phys. Rev. X 11, 031050 (2021).
- Xiao et al. (2022) Q. Xiao, Y. Lin, Q. Li, W. Xia, X. Zheng, S. Zhang, Y. Guo, J. Feng, and Y. Peng, arXiv preprint arXiv:2201.05211 (2022).
- Song et al. (2022) D. Song, L. Zheng, F. Yu, J. Li, L. Nie, M. Shan, D. Zhao, S. Li, B. Kang, Z. Wu, Y. Zhou, K. Sun, K. Liu, X. Luo, Z. Wang, J. Ying, X. Wan, T. Wu, and X. Chen, Science China Physics, Mechanics & Astronomy 65, 247462 (2022).
- Yu et al. (2021a) F. H. Yu, T. Wu, Z. Y. Wang, B. Lei, W. Z. Zhuo, J. J. Ying, and X. H. Chen, Phys. Rev. B 104, L041103 (2021a).
- Mielke et al. (2022) C. Mielke, D. Das, J.-X. Yin, H. Liu, R. Gupta, Y.-X. Jiang, M. Medarde, X. Wu, H. C. Lei, J. Chang, P. Dai, Q. Si, H. Miao, R. Thomale, T. Neupert, Y. Shi, R. Khasanov, M. Z. Hasan, H. Luetkens, and Z. Guguchia, Nature 602, 245 (2022).
- Chen et al. (2022) Q. Chen, D. Chen, W. Schnelle, C. Felser, and B. Gaulin, “Charge density wave order and fluctuations above tcdw and below superconducting tc in the kagome metal CsV3Sb5,” (2022), arXiv:2203.09386 [cond-mat.mtrl-sci] .
- Yang et al. (2020) S.-Y. Yang, Y. Wang, B. R. Ortiz, D. Liu, J. Gayles, E. Derunova, R. Gonzalez-Hernandez, L. Šmejkal, Y. Chen, S. S. P. Parkin, S. D. Wilson, E. S. Toberer, T. McQueen, and M. N. Ali, Science Advances 6, eabb6003 (2020).
- Zhou et al. (2022) X. Zhou, H. Liu, W. Wu, K. Jiang, Y. Shi, Z. Li, Y. Sui, J. Hu, , and J. Luo, “Universal three-state nematicity and magneto-optical kerr effect in the charge density waves in AV3Sb5 (A=Cs, Rb, K),” (2022), arXiv:2111.00727v2 [cond-mat.str-el] .
- Yu et al. (2021b) L. Yu, C. Wang, Y. Zhang, M. Sander, S. Ni, Z. Lu, S. Ma, Z. Wang, Z. Zhao, H. Chen, K. Jiang, Y. Zhang, H. Yang, F. Zhou, X. Dong, S. L. Johnson, M. J. Graf, J. Hu, H.-J. Gao, and Z. Zhao, “Evidence of a hidden flux phase in the topological kagomé metal CsV3Sb5,” (2021b), arXiv:2107.10714 [cond-mat.supr-con] .
- Khasanov et al. (2022) R. Khasanov, D. Das, R. Gupta, C. Mielke, M. Elender, Q. Yin, Z. Tu, C. Gong, H. Lei, E. T. Ritz, R. M. Fernandes, T. Birol, Z. Guguchia, and H. Luetkens, Phys. Rev. Research 4, 023244 (2022).
- Wu et al. (2022) X. Wu, Z. X. Wang, Q. M. Liu, R. S. Li, S. X. Xu, Q. W. Yin, C. S. Gong, Z. J. Tu, H. C. Lei, T. Dong, and N. L. Wang, “Revealing the immediate formation of two-fold rotation symmetry in charge-density-wave state of kagomé superconductor CsV3Sb5 by optical polarization rotation measurement,” (2022), arXiv:2110.11306v3 [cond-mat.supr-con] .
- Xu et al. (2022) Y. Xu, Z. Ni, Y. Liu, B. R. Ortiz, S. D. Wilson, B. Yan, L. Balents, and L. Wu, “Universal three-state nematicity and magneto-optical kerr effect in the charge density waves in AV3Sb5 (A=Cs, Rb, K),” (2022), arXiv:2204.10116 [cond-mat.str-el] .
- Hu et al. (2022) Y. Hu, S. Yamane, G. Mattoni, K. Yada, K. Obata, Y. Li, Y. Yao, Z. Wang, J. Wang, C. Farhang, J. Xia, Y. Maeno, and S. Yonezawa, “Time-reversal symmetry breaking in charge density wave of CsV3Sb5 detected by polar kerr effect,” (2022), under Review at Nature Portfolio.
- Feng et al. (2021) X. Feng, K. Jiang, Z. Wang, and J. Hu, Science Bulletin 66, 1384 (2021).
- Denner et al. (2021) M. M. Denner, R. Thomale, and T. Neupert, Phys. Rev. Lett. 127, 217601 (2021).
- Tan et al. (2021) H. Tan, Y. Liu, Z. Wang, and B. Yan, Phys. Rev. Lett. 127, 046401 (2021).
- Park et al. (2021) T. Park, M. Ye, and L. Balents, Phys. Rev. B 104, 035142 (2021).
- Wulferding et al. (2022) D. Wulferding, S. Lee, Y. Choi, Q. Yin, Z. Tu, C. Gong, H. Lei, S. Yousuf, J. Song, H. Lee, T. Park, and K.-Y. Choi, Phys. Rev. Research 4, 023215 (2022).
- Xia et al. (2006a) J. Xia, P. T. Beyersdorf, M. M. Fejer, and A. Kapitulnik, Applied Physics Letters 89, 062508 (2006a).
- Huang et al. (2022) X. Huang, C. Guo, C. Putzke, Y. Sun, M. G. Vergniory, I. Errea, M. Gutierrez-Amigo, D. Chen, C. Felser, and P. J. W. Moll, “Mixed dimensional transport in CsV3Sb5 single crystals,” (2022), arXiv:2201.07780v2 [cond-mat.str-el] .
- (32) “Supplementary material,” URL will be provided by publisher.
- Guo et al. (2022) C. Guo, C. Putzke, S. Konyzheva, X. Huang, M. Gutierrez-Amigo, I. Errea, D. Chen, M. G. Vergniory, C. Felser, M. H. Fischer, T. Neupert, and P. J. W. Moll, “Field-tuned chiral transport in charge-ordered CsV3Sb5,” (2022), arXiv:2203.09593 [cond-mat.str-el] .
- Li et al. (2023) H. Li, D. Oh, M. Kang, H. Zhao, B. R. Ortiz, Y. Oey, S. Fang, Z. Ren, C. Jozwiak, A. Bostwick, et al., (2023), arXiv:2303.07254 .
- Zhou et al. (2021) X. Zhou, Y. Li, X. Fan, J. Hao, Y. Dai, Z. Wang, Y. Yao, and H.-H. Wen, Phys. Rev. B 104, L041101 (2021).
- Uykur et al. (2021) E. Uykur, B. R. Ortiz, O. Iakutkina, M. Wenzel, S. D. Wilson, M. Dressel, and A. A. Tsirlin, Phys. Rev. B 104, 045130 (2021).
- Hücker et al. (2011) M. Hücker, M. v. Zimmermann, G. D. Gu, Z. J. Xu, J. S. Wen, G. Xu, H. J. Kang, A. Zheludev, and J. M. Tranquada, Phys. Rev. B 83, 104506 (2011).
- Silverman (1987) M. P. Silverman, J. Opt. Soc. Am. A 4, 1145 (1987).
- Silverman et al. (1992) M. P. Silverman, J. Badoz, and B. Briat, Opt. Lett. 17, 886 (1992).
- Fukuda et al. (1975) S. Fukuda, T. Shiosaki, and A. Kawabata, physica status solidi (b) 68, K107 (1975).
- Ades and Champness (1975) S. Ades and C. H. Champness, J. Opt. Soc. Am. 65, 217 (1975).
- Stolze et al. (1977) H. Stolze, M. Lutz, and P. Grosse, physica status solidi (b) 82, 457 (1977).
- Fried (2014) A. D. Fried, Measurements of Nonreciprocity in Materials With a Sagnac Interferometer, Ph.D. thesis, Stanford University (2014).
- Uykur et al. (2022) E. Uykur, B. R. Ortiz, S. D. Wilson, M. Dressel, and A. A. Tsirlin, npj Quantum Materials 7, 16 (2022).
- Zhu (1994) X. Zhu, Appl. Opt. 33, 3502 (1994).
- König et al. (2019) E. J. König, M. Dzero, A. Levchenko, and D. A. Pesin, Phys. Rev. B 99, 155404 (2019).
- Sonier (2015) J. Sonier, Journal of Magnetism and Magnetic Materials 376, 20 (2015), pseudogap, Superconductivity and Magnetism.
- Farhang et al. (2023) C. Farhang, J. Wang, B. R. Ortiz, S. D. Wilson, and J. Xia, (2023), arXiv:2303.10265 .
- Sagnac (1913) G. Sagnac, Comptes Rendus 157, 708 (1913).
- Xia et al. (2006b) J. Xia, Y. Maeno, P. T. Beyersdorf, M. M. Fejer, and A. Kapitulnik, Phys. Rev. Lett. 97, 167002 (2006b).
- Schemm et al. (2014) E. R. Schemm, W. J. Gannon, C. M. Wishne, W. P. Halperin, and A. Kapitulnik, Science 345, 190 (2014).
- Hayes et al. (2021) I. M. Hayes, D. S. Wei, T. Metz, J. Zhang, Y. S. Eo, S. Ran, S. R. Saha, J. Collini, N. P. Butch, D. F. Agterberg, A. Kapitulnik, and J. Paglione, Science 373, 797 (2021).
- Xia et al. (2009a) J. Xia, W. Siemons, G. Koster, M. R. Beasley, and A. Kapitulnik, Phys. Rev. B 79, 140407(R) (2009a).
- Xia et al. (2009b) J. Xia, V. Shelukhin, M. Karpovski, A. Kapitulnik, and A. Palevski, Phys. Rev. Lett. 102, 087004 (2009b).
- Kapitulnik (2015) A. Kapitulnik, Physica B: Condensed Matter 460, 151 (2015), special Issue on Electronic Crystals (ECRYS-2014).
- Pershan (1967) P. S. Pershan, Journal of Applied Physics 38, 1482 (1967).
- Stern et al. (1964) E. A. Stern, J. C. McGroddy, and W. E. Harte, Phys. Rev. 135, A1306 (1964).
- McGroddy et al. (1965) J. C. McGroddy, A. J. McAlister, and E. A. Stern, Phys. Rev. 139, A1844 (1965).
- Uba et al. (2017) L. Uba, S. Uba, and V. N. Antonov, Phys. Rev. B 96, 235132 (2017).
*
Appendix A Supplementary Materials
Appendix B Samples
In the present study two CsV3Sb5 samples grown in different laboratories were measured in two Sagnac interferometers. First samples dubbed "sample 1" is from Cluadia Felser group in Dresden, it was measured in Kapitulnik group at Stanford, second sample dubbed "sample 2" grown at Stephen D. Wilson’s group at UCSB was studied at UC Irvine in Xia group.
Appendix C Zero-area-loop Fiber-optic Sagnac Interferometer (ZALSI)
Samples were measured using zero loop area fiber Sagnac interferometers (ZALSI) Xia et al. (2006a) using W optical power at 1550 nm wavelength with phase modulation at MHz. Two low-coherence light waves of right and left circularly polarizations were sent to the sample. And the non-reciprocal phase difference between the two lights acquired upon reflection was detected with lock-in amplifiers. By construction, unlike a standard ellipsometer, this approach fundamentally rejects polarization rotations due to non-TRSB effects such as linear and circular birefringence and dichroism that could mimic a TRSB Kerr signal. In addition, by reducing the Sagnac loop to zero area within a single fiber, it also rejects a background Sagnac signal from earth rotation, which breaks time-reversal symmetry and is the basis for fiber gyroscopes.
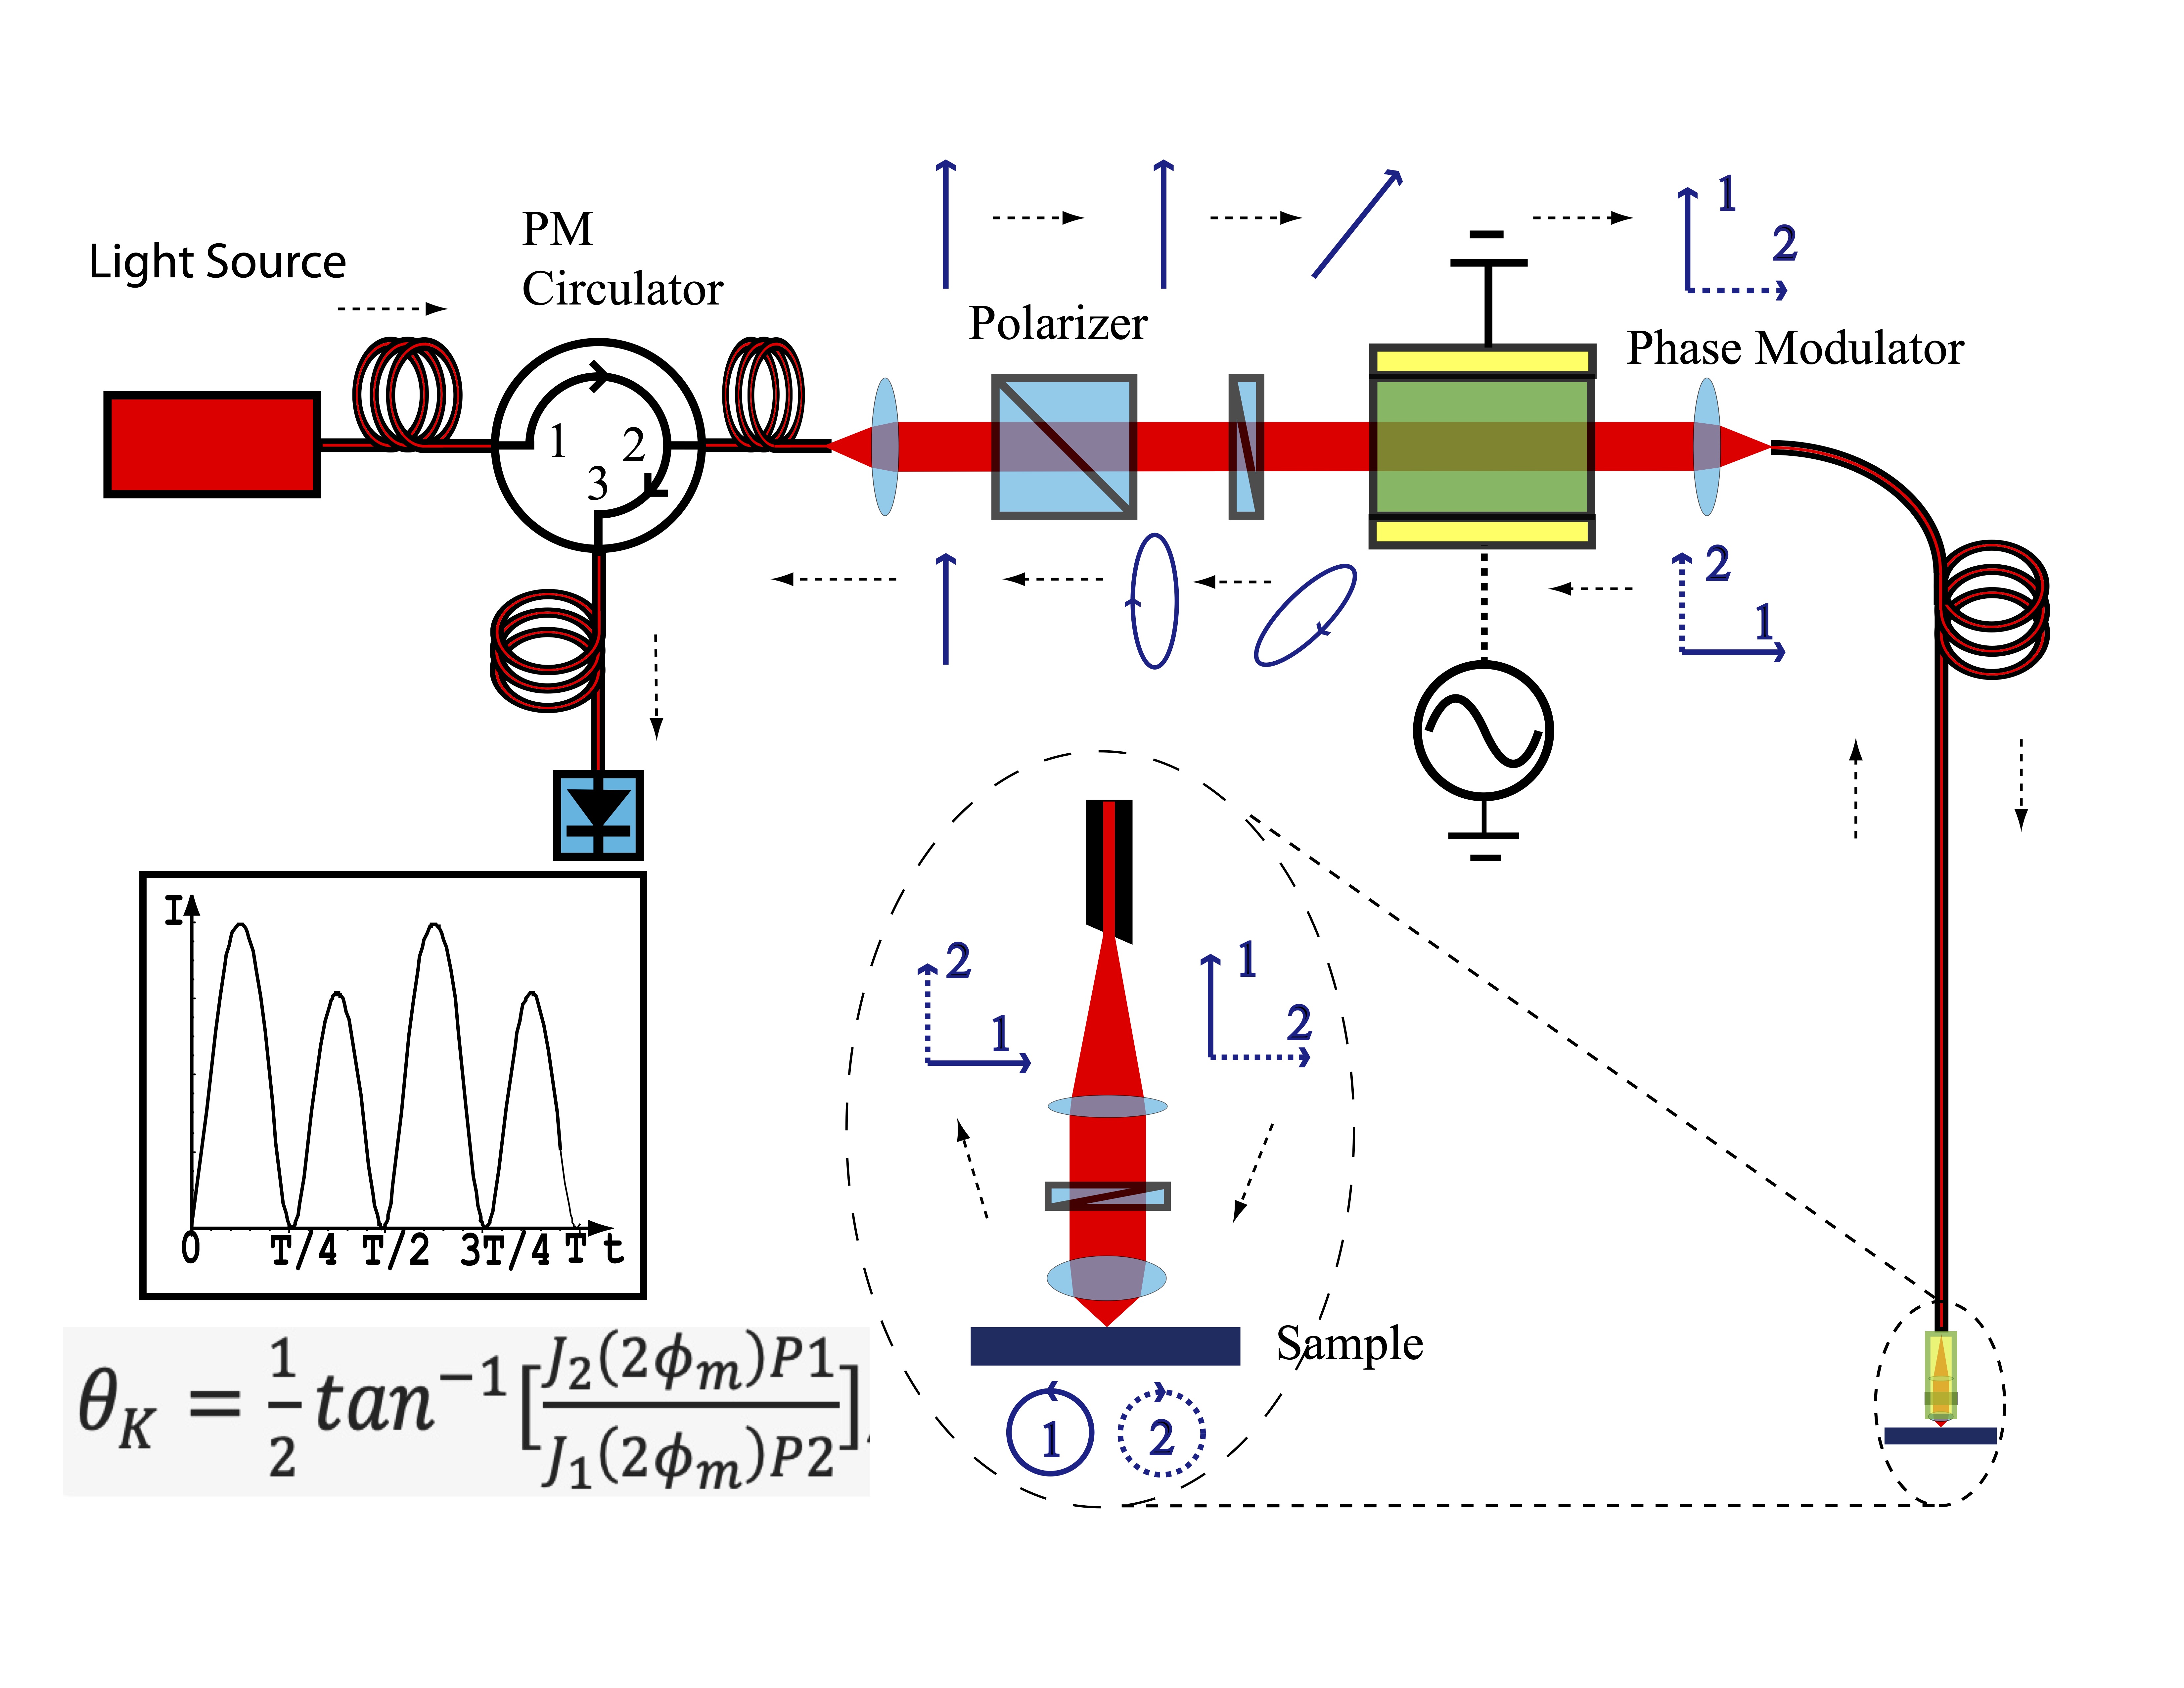
The apparatus is based on the Sagnac interferometer Sagnac (1913) where two counter-propagating beams travel the exact same optical path before interfering at the detector. In our implementation we use two orthogonally linearly polarized light beams, which are then converted into right and left circular polarizations using a quarter-wave plate. An objective lens focuses the light onto a small interaction region on the sample, and the reflected light beams are converted back to linear polarizations with exchanged polarization directions. Owing to the reciprocity of the apparatus, a non reciprocal phase shift will appear at the detector only if time reversal symmetry is broken through the interaction of the two circularly polarized beams with the sample Xia et al. (2006a) (see supplementary material sup ). With careful construction we can routinely achieve shot-noise-limited senstivity of (100 nrad) for optical power above W, with magneto-optic Kerr and Faraday resolutions of nrad limited by the long-term drift of the instrument. Some of our notable accomplishments include the study of TRSB in Sr2RuO4 Xia et al. (2006b), UPt3 Schemm et al. (2014) and more recently UTe2 Hayes et al. (2021), elucidating the limit for ferromagnetism in thin SrRuO3 films Xia et al. (2009a) and discovery of the inverse proximity effect in ferromagnet/superconductor bilayers Xia et al. (2009b) to name a few. Again, to be able to reliably scrutinize the possible spontaneous polar Kerr effect below , measurements were performed in two different apparatuses, one at Stanford University and one at UC Irvine. While both systems were constructed in a similar way employing a broadband superluminescent light emitting diode (SLED) with a center wavelength of 1550 nm, the details of the sample holder, windows construction and end-optics are slightly different.
A schematics of ZALSI as well as polarization states at each point are shown in Fig. 3. The beam of light polarized at 45o to the axis of a electro-optic modulator (EOM), which generates MHz time-varying differential phase shifts along its two major axis and split the light into two beams of roughly equal powers. The two beams are then launched into the fast and slow axes respectively of a polarization maintaining (PM) fiber. Upon exiting the fiber, the two orthogonally polarized beams are converted into right- and left-circularly polarized light by a quarter-wave () plate, and are then focused onto the sample. The non-reciprocal phase shift between the two circularly polarized beams upon reflection from the sample is twice the Kerr rotation (). The same quarter-wave plate converts the reflected beams back into linear polarization, but with a net 90o rotation of the polarization axis. The two beams then travel back through the PM fiber and the EOM with exchanged axes before they arrive again at the polarizer. At this point, the two beams have gone through exactly the same path but in opposite directions, except for a phase difference of from reflection off of the sample. The two beams are once again coherent, and interfere to produce an elliptically polarized beam, whose in-plane component is routed by the circulator to the photodetector. Lock-in detection was used to measure the average (DC) power (), the first harmonics (), and the second harmonics () of the detected optical power :
| (A.1) |
where is the returned power without modulation, and depends on focus of the objective lens and sample reflectivity. can be further expanded into Fourier series of if we keep as a slowly time-varying quantity compared to :
where and are Bessel functions. Therefore, the detected powers , and are:
| (A.2) | ||||
| (A.3) | ||||
| (A.4) |
Hence Kerr signal can be obtained using equation A.5, which is independent of optical power, sample reflectivity and focus of the objective lens. For optimal sensitivity is often chosen to be close to 0.92.
| (A.5) |
Appendix D Time-reversal Symmetry Preserving design
Here we provide a qualitative argument on why ZALSI only detects a signal when TRS is broken. Assume a sample with its surface in the - plane and a linearly polarized electric field propagating along the -direction which is perpendicular to the surface of the sample. Adopting the common convention where the sense of circular polarization is determined with respect to a fixed axis (here the axis), the handedness of the reflected light with respect to the direction of propagation flips. This convention defines four different indices of refraction: and are the refractive indices for right circularly polarized (RCP) light and left circularly polarized (LCP) light propagating along (reflected light) and and are the refractive indices for RCP and LCP propagating along (incident light). Where TRS is preserved
| (A.6) |
however, if TRS is broken at least one equality in (A.6) fails. Focusing on a polar configuration where light impinges on the sample at normal incidence (as it is in our ZALSI apparatus) and using scattering theory to calculate the Kerr effect from the difference between the reflection amplitudes for right and left circularly polarized light Kapitulnik (2015), it can be shown that
| (A.7) |
It is then clear that is finite only for the case of TRSB. The above results are robust, independent of whether the material that we study is isotropic, or it possesses linear birefringence or natural optical activity.
Appendix E Detection of CDW with coherent reflection ratio
In addition to the Kerr signal, we record the total (P0) and the coherence (P2) parts of the reflected optical power, as their ratio serves as a measure of the linear and/or circular birefringence. The above calculations of the ZALSI assume perfect retardance of the quarter-wave plate and absence of either linear or circular birefringence and dichroism of the sample. In reality, commercial zero-order quarter-wave plates have a typical retardance error of 1 even for normal incidence, and samples such as CsV3Sb5 display birefringence and/or dichroism. As a result, the reflected beams, after passing the quarter-wave plate again, become elliptical instead of being perfectly linearly polarized. And a small fraction of the light will be incoherent with the major beams and thus won’t participate in the interference. These incoherent components will not be captured by or , but will still be detected as part of the average power . And pre-factors need to be added to the formulas for , and :
| (B.1) | ||||
| (B.2) | ||||
| (B.3) |
where , and are small correction pre-factors for sample birefringence and/or dichroism, and retardance error of the wave plate. The Kerr signal can be obtained using updated equation B.4, with a small correction to the scaling factor. There is no change to the zero point of , which is guaranteed by the symmetry of the interferometer.
| (B.4) |
On the other hand, a change in sample birefringence and/or dichroism will induce changes to and . However, as previously mentioned, they are also dependent on , which changes with focus of the objective lens and sample reflectivity.
| (B.5) |
Their ratio is independent of these factors and represents the ratio between the coherent and the total optical powers, dubbed "coherent reflection ratio". Since the wave plate retardance error is a slow varying quantity usually dominated the slow drifts of its tilt and rotation, can be used to measure that change of sample birefringence and/or dichroism during temperature sweeps.
Appendix F Experimental Details
In a typical experiment, we align the focused beam to an optically flat area of the crystal after cleaving. This can be facilitated by scanning imaging as shown in Fig. 6 for sample 2, where a flat region of 300 m in size can be identified with high reflectivity (P0 of 10 to 30 W) at T = 3.1 . Kerr signals are obtained in the same scan. At B = - 0.34 T, a uniform Kerr signal of - 8.16 rad is observed, even though the reflected light varies by 300 across the region. And upon removing the magnetic field, the Kerr signal is reduced to zero without any sign of spontaneous TRSB. The optical beam is then fixed at a location temperature sweeps, as presented in Fig. 2 of the main text. During zero magnetic field warmups, an absolute Kerr resolution of nrad is typically achieved over a wide temperature range between 0 and 300 . For a smaller temperature range of a few , we can detect a change of Kerr signal as small as nrad.
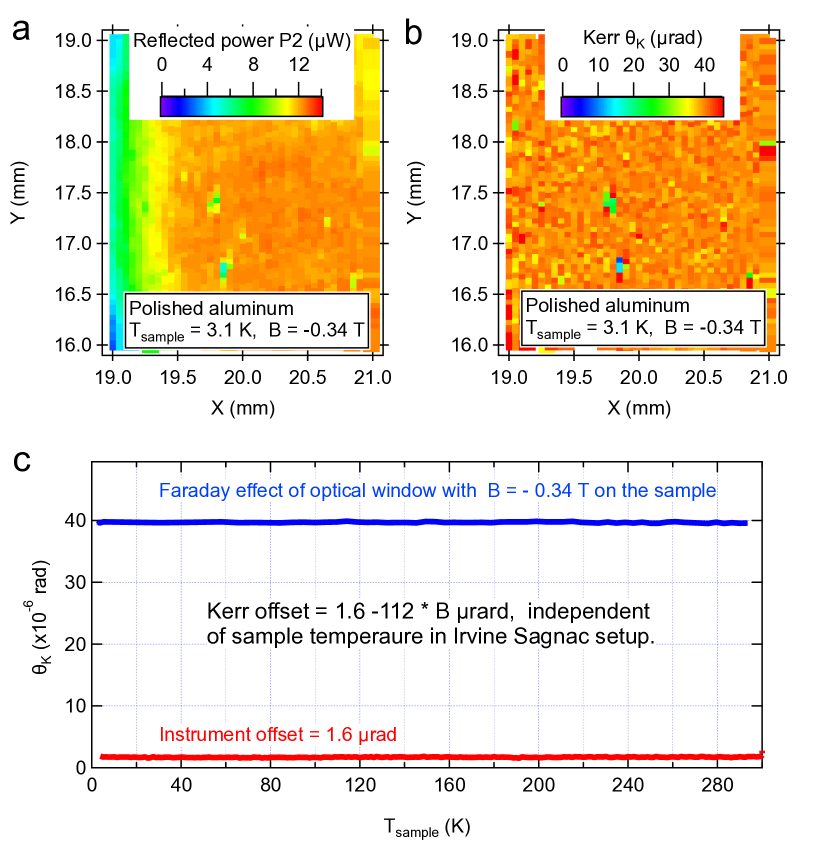
To reveal the diamagnetic shift below , it is necessary to perform Sagnac measurements when the sample is subject to a magnetic field. In our normal Sagnac setupsXia et al. (2006b), the fiber-optic head containing the wave-plate and focusing lens are placed inside the cryostat to achieve the lowest sample temperatures. Under a magnetic field, the fiber-optic head will contribute its own temperature-dependent Kerr signal, about T at room temperature and T below 4 . Due to the long thermalization time of glass at cryogenic temperatures, the temperature of the fiber-optic head often deviates significantly from the sample temperature readings, making accurate subtractions of this background signal practically impossible during temperature sweeps. And we should be cautious with such subtractions Hu et al. (2022). To eliminate this source of error, we have moved the optics outside the low temperature environment. In this project, both Stanford and Irvine Sagnac fiber-optic heads are located outside optical cryostats with a room temperature optical window between the focusing lens and the sample. The Kerr offset contributed by the optical window due fringing magnetic fields is thus independent of sample temperature, and can be calibrated accurately. One such calibration for the Irvine instrument is illustrated in Fig. 7, using a polished aluminum surface with negligible Kerr effect. The P2 image at T = 3.1 and B = - 0.34 T shows optical power variations between 7 and 12 W across the surface, while the Kerr image taken at the same time reveals a spatially uniform Kerr background of 39.7 rad due to the Faraday effect of the optical window held at 2950.1 . And we have verified that it is indeed independent of sample temperature, as shown in Fig. 7(C) (blue). There is a temperature and time-independent instrument offset of 1.6 rad due to minor misalignment of optics and electronic offsets (Fig. 7(C) (red)). The total offset is thus calibrated to be 1.6 - 112 B rad, which can be subtracted to produce accurate Kerr values for temperature sweeps (Fig. 2 of the main text) and spatial scans (Fig. 6) even in a magnetic field.
Appendix G General Considerations for MO effects
In general Magneto-optical (MO) effects appear because in the presence of magnetism right and left circularly polarized lights propagate differently in solids. When a magnetic field is applied to a diamagnetic insulating solid, magneto-optical effects will originate from the direct effect of the magnetic field on the orbital electronic motion. On the other hand, for ferromagnetic materials, or paramagnetic materials at low temperatures (when their Curie susceptibility is large enough), the effect of the magnetic field on the orbital motion is negligible compared with effects associated with spin-orbit interaction Pershan (1967). For simple metals, far from plasma frequency resonances we expect that the main contribution to Kerr response is dominated by off-diagonal intraband Drude-type transitions (i.e. originating from optical conductivity terms , where is the cyclotron frequency, is the DC Drude conductivity and is the scattering time). For example, in Al and Ag Stern et al. (1964) and nobel metals including Cu and Au McGroddy et al. (1965) these effects were measured and recently calculated, showing that for energies below eV the Kerr rotation is of order rad/Oe Uba et al. (2017). In the absence of magnetic polarization, the orbital and spin Zeeman terms will contribute off-diagonal terms through interband transitions, which for the above simple metals are at least an order of magnitude smaller. Taking into account optical and transport measurements on CsV3Sb5 , both effects are expected to yield an even smaller response, which will not be detectable for the magnetic fields we used with the ZALSI experiments.
Appendix H DC resistance Measurements
DC resistances measured on sample 1 and sample 2 are shown in Fig. 8. A kink at is clearly visible in the resistance of both samples, marking the charge density transition. The exact values of are determined by the temperatures of the peaks in the first derivative curve, and agree with literature data Ortiz et al. (2020) within K. The superconducting transition is marked by the zero resistance below the critical temperature K. In the curve, especially in sample 2, there is an additional feature of a dispersive line shape centered at K. We note that NMR experiments Song et al. (2022) have observed a kink behavior at a similar temperature of 35 K in , and that the electronic magneto-chiral anisotropy (eMChA) was detected in nonlinear transport Guo et al. (2022) below K. Since we observe no spontaneous Kerr signal across , it is suggestive of a phase transition without TRSB at K.