Theiss Research, La Jolla, CA, 92037, USA
Systematic DFT+U and Quantum Monte Carlo benchmark of magnetic two-dimensional (2D) CrX3 (X = I, Br, Cl, F)
Abstract
The search for two-dimensional (2D) magnetic materials has attracted a great deal of attention because of the experimental synthesis of 2D CrI3, which has a measured Curie temperature of 45 K. Often times, these monolayers have a higher degree of electron correlation and require more sophisticated methods beyond density functional theory (DFT). Diffusion Monte Carlo (DMC) is a correlated electronic structure method that has been demonstrated successful for calculating the electronic and magnetic properties of a wide variety of 2D and bulk systems, since it has a weaker dependence on the Hubbard parameter (U) and density functional. In this study we designed a workflow that combines DFT+U and DMC in order to treat 2D correlated magnetic systems. We chose monolayer CrX3 (X = I, Br, Cl, F), with a stronger focus on CrI3 and CrBr3, as a case study due to the fact that they have been experimentally realized and have a finite critical temperature. With this DFT+U and DMC workflow and the analytical method of Torelli and Olsen, we estimated a maximum value of 43.56 K for the Tc of CrI3 and 20.78 K for the Tc of CrBr3, in addition to analyzing the spin densities and magnetic properties with DMC and DFT+U. We expect that running this workflow for a well-known material class will aid in the future discovery and characterization of lesser known and more complex correlated 2D magnetic materials.
1 Introduction
Recently, the search for two-dimensional (2D) magnetic materials, especially ferromagnets, has become an important task for the materials science community. The revolutionary experimental synthesis of 2D CrI3, which has a measured Curie temperature of 45 K 1, has sparked interest in discovering and utilizing similar ferromagnetic materials for next generation devices. Beyond monolayer CrI3, room temperature magnetism has been experimentally measured for 2D VSe2 on a van der Waals substrate 2 and it has been shown that ferromagnetic order exists in 2D Cr2Ge2Te6 3 and Fe3GeTe2 4. In addition, theoretical calculations have predicted ferromagnetic ordering in monolayers such as CrBr3 5, CrCl3 5, 6, CrF3 7, MnO2 8, 9, FeCl2 10, K2CuF4 11, the family of MPX3 (M is 3d transition metal atom, X is group VI atom) 12, -RuCl3 13, RuBr3 and RuI3 14 and several other reported materials 5.
Often times, however, these monolayers have a higher degree of electron correlation and require more sophisticated methods beyond density functional theory (DFT). Diffusion Monte Carlo (DMC) 15 is a many-body correlated electronic structure method that has successful for the calculation of electronic and magnetic properties of a variety of bulk and low-dimensional systems 16, 17, 18, 19, 20, 21, 22, 23, 24, 25, 26, 27, 28, 29, 30, 31, 32, 33, 34, 35, 36, 37, 38, 39, 40. This method has a much weaker dependence on the starting density functional and Hubbard parameter, can achieve results with an accuracy beyond DFT 15, and scales similary to DFT with respect to the number of electrons in the simulation 15. For example, DMC has successfully predicted the magnetic structure for FeSe when DFT methods contradicted 28. In addition, the correct spin superexchange in the correlated cuprate Ca2CuO3 has been determined 27 using DMC methods 27. With regards to 2D materials and DMC, the band gap of GaSe 31 has been calculated to be in excellent agreement with experiment, the correct atomic structure and potential energy surface of CrI3 39 and GeSe 30 has been predicted, and the critical temperature of MnO2 9 has been estimated.
The last step in the investigation of 2D correlated magnetic systems is the estimation of Tc. Specifically, the Mermin-Wagner theorem 41 implies that magnetic order in a monolayer cannot exist unless magnetic anisotropy (MA) is present and perpendicular to the plane, which allows a finite critical temperature (Tc). In order to obtain an appropriate value for Tc, the magnetic anisotropy energies (MAE) should be determined by performing non-collinear (spin-orbit) calculations. Once the MAE and magnetic exchange parameters of a 2D system are obtained from first principles, they can be input into analytical models such as the one derived by Torelli and Olsen 42 to estimate Tc.
Data-driven high throughput studies of 2D materials are needed to identify candidates that meet the criteria to be a 2D ferromagnet with a finite Tc. Development of an efficient framework dealing with all the computational steps highlighted above is necessary to make such a high throughput search possible.
In this work we developed one such workflow and used it to perform a systematic DFT+U and Quantum Monte Carlo benchmark of magnetic two-dimensional (2D). The framework and all data it produced have been made available to the public through the JARVIS (Joint Automated Repository for Various Integrated Simulations, \urlhttps://jarvis.nist.gov/) project. JARVIS, which is part of Materials Genome Initiative (MGI), is a computational materials science framework developed at National Institute of Standards and Technology (NIST) 43. One of the main components, JARVIS-DFT, is a comprehensive database of DFT-computed material properties for over 3,000 2D and 2D-like materials and over 60,000 bulk materials, with results from multiple functionals such as PBE and vdW-DF-OptB88. JARVIS-DFT contains DFT calculated structural, energetics 44, elastic 45, optoelectronic 45, thermoelectric 46, piezoelectric, dielectric, infrared 47, solar-efficiency 48, topological 49, anomalous quantum confinement 50, and superconducting 51 properties. As a response to the limitations of DFT, a limited number of beyond-DFT data, such as hybrid functionals (HSE06, PBE0) or many-body (GW, DMFT) results have been added to JARVIS, to increase accuracy and reliability of data. The discrepancies observed in DFT results, between different density functionals and experimental data, are more prevalent for materials that have a higher degree of electron correlation, and are common for the 2D magnetic structures of interest. Specifically, this failure of DFT to describe correlated systems can be due in part to the tendency of standard exchange-correlation functionals to over-delocalize valence electrons 52. That is why DFT fails for systems whose ground state is characterized by a more pronounced localization of electrons, such as transition metal-based materials. This delocalization occurs due to the inability of the exchange-correlation functional to completely cancel out the electronic self-interaction, and a “fragment” of the same electron remains that can induce added self-interaction, inducing an excessive delocalization of the wavefunction 52. To combat this self-interaction error, more sophisticated density functionals such as meta-GGAs 53, 54, hybrid functionals 55, or DFT functionals with the added Hubbard (U) correction 56 can be utilized. Despite the fact that these more sophisticated DFT methods exist, often times the calculated properties of 2D magnets are heavily influenced by which density functional and U parameter are used. Due to this, a method that has a weaker dependence on the U parameter and functional and can capture the electron correlation that drive magnetic ordering is required. With such a many-body method, the realization of 2D magnetic device fabrication can be significantly expedited.
The goal of this study is to utilize a higher order many-body method such as DMC, in order to treat 2D correlated magnetic systems. We chose monolayer CrX3 (X = I, Br, Cl, F) as a case study because they are an ideal class of materials to benchmark, due to the fact that they have been experimentally realized 1, 57, 58, have a finite critical temperature 1, 5, and have extensively been studied with DFT 5. We hope that making such a DMC framework public through the JARVIS project, for a well-known class of materials will aid in the future discovery and characterization of lesser known and more complex correlated 2D materials.
The outline of this paper is as follows: The Computational Methods section will outline the computational approaches for DFT, Quantum Monte Carlo (QMC), post-processing of QMC data, and will detail the newly developed DFT-QMC JARVIS workflow to obtain accurate magnetic properties of 2D systems. The Results and Discussion section will present DFT benchmarking using various DFT methods, and QMC results, and the Conclusion section will provide concluding remarks.
2 Computational Methods
2.1 DFT and QMC Methods
We performed DFT calculations with the added Hubbard correction (U) 56 to treat the on-site Coulomb interaction of the orbitals of Cr atoms. To determine how the choice of functional impacts the results, benchmarking DFT simulations were performed using the Vienna Ab initio Simulation (VASP) code and projector augmented wave (PAW) pseudopotentials 59, 60 (please note that the use of commercial software (VASP) does not imply recommendation by the National Institute of Standards and Technology). It is advantageous to benchmark these materials with VASP and PAW pseudopotentials due to the fact that they require a much smaller cutoff energy and are therefore more cost effective for a large number of simulations. For these reference calculations, the Perdew-Burke-Ernzerhof (PBE)61, local density approximation (LDA)62 the strongly constrained and appropriately normed (SCAN)53 meta-GGA, and recently developed r2SCAN 54 functionals were used. r2SCAN was developed to improve the numerical performance of SCAN, at the expense of breaking constraints known from the exact exchange–correlation functional 54. In addition, to increase accuracy, we also performed calculations with the screened hybrid HSE06 functional, which is created by mixing 75 of the PBE exchange with 25 of the Fock exchange and 100 of the correlation energy from PBE 55. For our VASP calculations using PBE, LDA, SCAN, and r2SCAN (+U), we used the Crpv PAW potential (12 electrons) while for HSE06, we used the standard Cr PAW potential (6 electrons) due to computational restraints. We justified this choice for the HSE06 calculations by performing PBE+U (U = 2 eV) calculations with the Crpv PAW potential and the Cr standard PAW potential separately, and found the results for magnetic exchange to be within 2-4 of each other. There was at least 20 Å of vacuum given between periodic layers of CrX3 in the -direction. We used a kinetic energy cutoff of 500 eV for CrI3, CrBr3 and CrCl3 and a cutoff of 700 eV for CrF3. A 5x5x1 k-point grid was used for the 8 atom unit cell of all CrX3 monolayers. To calculate MAE, spin-orbit DFT (DFT+U) calculations were carried out for the FM and AFM states of each 2D CrX3. This is done by performing two spin-orbit calculations, one where the spins are oriented in the off-plane direction (in our case, ) and one where the easy axis is rotated 90∘ (in our case, ). A workflow where these four static spin-orbit calculations (for the FM and AFM phases) are performed (using the previously optimized vdW-DF-OptB88 63 geometry) was carried out within JARVIS.
For all QMC calculations, we used DFT and the PBE functional to create the trial wavefunction for subsequent fixed-node DMC calculations. The Quantum Espresso (QE) 64 code was used for the DFT calculations within our QMC workflow. The trial wavefunction was generated separately for the FM and AFM configurations of each CrX3 monolayer, using various values of U. The reason for this was to variationally determine the optimal nodal surface (find the value of U that produces the lowest total energy). All QMC calculations require norm-conserving (NC) pseudopotentials. For Cr, we used hard NC RRKJ (OPT), scalar relativistic pseudopotentials 65. For Br, Cl and F, scalar relativistic effective core potentials (ECP) were used 66, 67. For I, a newly developed averaged relativistic effective potential (AREP) was used 68. For DMC calculations that explicitly include spin-orbit effects, a spin-orbit relativistic effective potential (SOREP) for I 68 could be used, but since the spin-orbit interaction of CrI3 are on the order of the DMC error bar, we decided to use the AREP potential for I. These NC potentials are meant to produce all electron results (in accordance with coupled cluster theory), while the PAW pseudopotentials are meant to reproduce all electron density functional results. Ideally, the energy differences obtained with either method should yield similar results, which we verify by observing a 2 - 6 difference between PAW results and NC results for magnetic exchange (for PBE+U, U = 2 eV). For these pseudopotentials, we used a kinetic energy cutoff of 300 Ry ( 4,080 eV) for all calculations, with the exception of F which required 600 Ry ( 8,160 eV, see Fig. S1). We tested the reciprocal grid size at the DFT level and determined that a k-grid of 3x3x1 was sufficient for each CrX3 monolayer (see Fig. S2). Although three different types of pseudopotentials were used in our calculations (PAW for DFT benchmarking, PAWpv for HSE06 benchmarking, and NC for DMC), the results at the DFT level are all within 2 - 8 of each other, which indicates that pseudopotential choice does not significantly hinder the accuracy of such small energy scale calculations.
The QMCPACK 69, 70 code was used to carry out Variational Monte Carlo (VMC) and DMC 15, 71 calculations, after the DFT generation of the trial wavefunction. VMC calculations are the intermediate steps between the DFT and DMC calculations, where the single determinant wavefunction from DFT is converted into a many-body wavefunction by use of the Jastrow parameters 72, 73, which aid in modeling the electron correlation and ultimately reduce the uncertainty in the DMC simulations 74, 75. Up to two-body Jastrow 76 correlation functions were included in the trial wavefunction. The linear method 77 was used to minimize the variance and energy respectively of the VMC energies. The cost function of the variance optimization is 100 variance minimization while the cost function of the energy optimization is split as 95 energy minimization and 5 variance minimization, which has been demonstrated to reduce the uncertainty for DMC results 74. The DFT-VMC-DMC workflows were automated using the Nexus 78 software suite. After testing, a large supercell size of 48 atoms was deemed to be sufficient in eliminating finite-size effects for the FM and AFM configurations of 2D CrI3 (see Fig. S3), which justified our choice to use a 48 atom supercell to calculate the magnetic exchange energy with QMC for the other materials of interest. For the DMC simulations, the T-moves 79 algorithm was used to evaluate the nonlocal part of the pseudopotentials and after testing, a timestep of 0.01 Ha-1 was determined to be sufficient (see Table S1). The error in our DMC calculations is the standard error about the mean value. This value about the mean is indicated by the error bars in the figures and the parenthesis in the tabulated results. As previously stated, in our DMC simulations, controllable errors such as timestep, finite-size, and choice of nodal surface are appropriately addressed. The remaining sources of uncertainty can arise from the fixed-node bias and the error associated with evaluating the nonlocal part of the pseudopotential. Luckily, the fixed-node error has been demonstrated to be on the order of 1 - 2 in other crystal systems 26 and the T-moves 79 algorithm has been proved to be successful in evaluating the nonlocal part of the pseudopotential, since it is treated in a variational way 79, 26.
The total charge and spin densities were extracted from our DMC results. The spin density () is the difference between the spin-up contribution to the total charge density and the spin-down contribution to the total charge density (). We used an extrapolation scheme on the DMC densities in order to eliminate the bias that occurs from using a mixed estimator. Because the density estimator does not commute with the fixed-node Hamiltonian, the DMC density we calculated is a mixed estimator between the pure fixed-node DMC and VMC densities. The extrapolation formula takes the form 15:
| (1) |
where and are the DMC and VMC charge densities respectively. is the trial wavefunction arising from the DMC Hamiltonian and is the trial wavefunction arising from VMC.
We integrated the DFT (DFT+U) and DMC spin densities up to a cutoff radius (which is defined as half of the Cr-X bond distance in CrX3 monolayers) to obtain an estimate for the site-averaged atomic magnetic moment per atom. To calculate these magnetic moments per atom (), we summed over the spherically interpolated spin densities:
| (2) |
where is the radial grid size and is the distance from the center of the atom to a given point on the grid.
To estimate the critical temperature of CrX3 monolayers, we used the method outlined by Torelli and Olsen 42, which derived a simple expression for Tc of 2D ferromagnets by fitting classical Monte Carlo results for different lattice types. The expression they derived is a solely a function of the first principles obtained MAE and magnetic exchange constants. By calculating the magnetic exchange constants with DMC and the MAE from DFT+U, we were able to obtain an estimate of Tc for the monolayers.
2.2 JARVIS Workflow
| (3) |
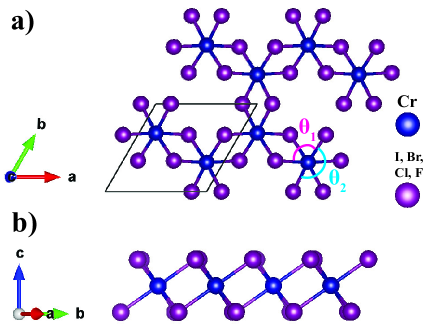
where the sum over runs over the lattice of Cr atoms and runs over the nearest Cr site of atom due to a strong magnetic moment localized on Cr atoms. Due to the fact that long-range interactions have previously been shown to die out in 2D CrI3 80, we focused solely on the nearest neighbor interactions (our calculations consisted of a unit cell of two Cr atoms and six X atoms). From this unit cell (which is depicted in Fig. 1), we adopt two magnetic orientations: ferromagnetic (FM), consisting of two spin up Cr atoms, and antiferromagnetic (AFM), consisting of one spin up Cr atom and one spin down Cr atom. This nearest neighbor AFM magnetic configuration is commonly referred to as the Neel configuration 80.
The first term in the spin Hamiltonian refers to the easy axis single ion anisotropy ( chosen as the off-plane direction). The second term describes the Heisenberg isotropic exchange and the last term describes the anisotropic exchange. The sign convention is as follows: favors FM interactions, favors off-plane easy axis and implies full isotropic exchange. We treat Eq. 3 classically, describing the spins collinearly as either or . By doing this, it possible to write the energy of the 4 possible magnetic ground states: i) ferromagnetic off-plane (FM,), ii) antiferromagnetic off-plane (AFM,), iii) ferromagnetic in-plane (FM,), and iv) antiferromagnetic in-plane (AFM,). The corresponding energy equations take the form:
| (4) |
| (5) |
| (6) |
| (7) |
where . This model has been extensively used to model 2D magnetism 80, 5. However, the model assumes diagonal exchange interaction and does not include Dzyaloshinskii-Moriya interactions, Kitaev interactions, or higher order spin interactions. Recently, there have been attempts to modify this model with various types of spin interactions, but presently the role of the different terms are not completely understood. Most importantly, there are strong disagreements between calculations 81, 82 and experiments 83 in regards to the magnitude of Kitaev interactions.
To obtain initial reference values for , and , we performed self-consistent noncollinear DFT calculations in VASP (PAW). In these spin-orbit calculations, we rotated the easy axis by 90∘ and calculated the energy difference between the rotated and non-rotated configurations separately for FM and AFM. Since the magnetic anisotropy calculations are more difficult to converge than the total energy, we adjusted certain parameters to allow for careful convergence. Specifically, the cutoff energy was increased by 100 - 200 eV, the electronic convergence threshold was decreased to 1.0 eV, symmetry was turned off, and the well-converged k-point grid obtained from JARVIS was used 84. Upon comparison to the magnetic anisotropy energy results from other recent studies 10, 5, 42 that used even higher convergence criteria (cutoff energy, k-points, supercell size), our results are in excellent agreement, which further demonstrates that our results are carefully converged. These four DFT calculations were automated using the JARVIS workflow, where four distinct total energy values were calculated for each material. This workflow was benchmarked for 2D CrI3 (JVASP-76195), CrBr3 (JVASP-6088), CrCl3 (JVASP-76498) and CrF3 (JVASP-153105) for using multiple flavors of DFT (discussed in detail in DFT Benchmarking section).
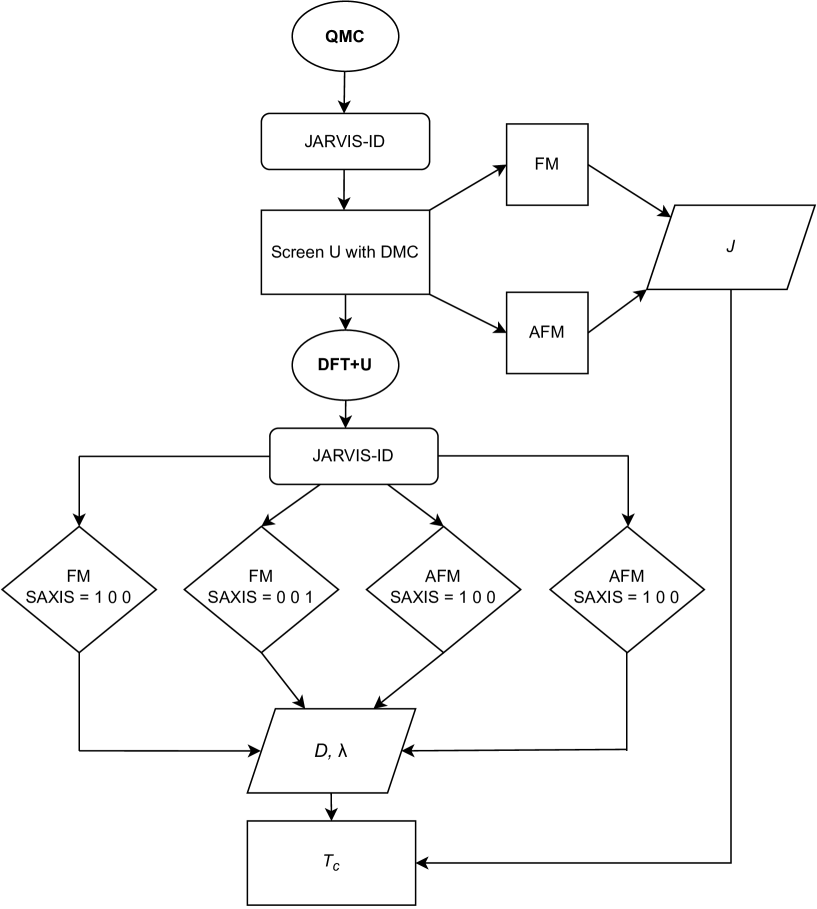
Although performing these four noncollinear DFT+U calculations is a robust method for determining the magnetic exchange and anisotropy parameters of a 2D system, these results can be systematically improved with QMC simulations. QMC can improve the magnetic property predictions in two ways. Firstly, one can variationally determine the optimal U value using DMC (discussed in further detail in the following section) and secondly, a statistical bound can be calculated for the parameter by performing DMC simulations for the FM and AFM phases separately. It is important to note that these QMC energies are collinear (spin-polarized), in contrast to the previous noncollinear (spin-orbit) DFT calculations. Currently, spin-orbit implementation is limited in DMC. For this reason, we neglect the contribution when calculating with QMC using Eq. 4 and 5, since such a contribution can only be obtained from spin-orbit calculations. This does not have a significant impact the final result for , since . As a result, we design a high-throughput workflow that allows us to variationally determine the optimal value of U using DMC, calculate a statistical bound on by performing collinear DMC calculations for the FM and AFM phases, and use that optimal determined U to perform DFT+U simulations and extract the anisotropy parameters (, ), with the end goal of using these parameters to accurately estimate the 2D critical temperature. A full schematic of this workflow is depicted in Fig. 2.
It is possible to estimate the critical temperature using the analytical method outlined in Torelli and Olsen 42 with our obtained values of , and . In Torelli’s work, classical Monte Carlo and Random Phase Approximation (RPA) simulations were used to derive a simple expression for Tc that depends soley on lattice type and the ab-initio exchange coupling constants. The analytical function for takes the form:
| (8) |
with
| (9) |
where is the number of nearest neighbors and (dimensionless constant). is the critical temperature for the standard Ising model, which can be written as , where is the fitted dimensionless critical temperature (1.52 for honeycomb lattice). In cases where single ion anisotropy and anisotropic exchange are present, , where is the spin gap:
| (10) |
Post-processing of the energies to determine , and , and finally Tc were also carried out within the JARVIS workflow.
3 Results and Discussion
3.1 DFT Benchmarking
Prior to incorporating QMC calculations in the workflow (as depicted in Fig. 2), we performed reference DFT calculations using VASP (PAW) to benchmark the magnetic properties of monolayer CrX3 (X = I, Br, Cl, F). Performing these reference calculations in VASP is advantageous because it allows us to perform spin-orbit calculations and the DFT calculations come at a much lower cost than those performed with the NC pseudopotentials in QE (due to higher cutoff energy). Due to these advantages, we performed these calculations with a variety of local and semi-local density functionals such as PBE, LDA, SCAN, r2SCAN (with and without a U correction of 2 eV) and HSE06, including spin-orbit effects, to identify if such a choice made a real difference. Table 1 depicts the values of , , and Tc calculated with each functional, using static geometry (depicted in Fig. 1) and structures taken from the JARVIS-DFT database, where the geometry was optimized with vdW-DF-OptB88. A scatter plot of the data presented in Table 1 is depicted in Fig. S4. The reason we did not perform this workflow with vdW-DF-OptB88 is because spin-orbit coupling is not compatible with vdW functionals such as vdW-DF-OptB88 63. Similar to previous DFT results, CrI3 has the highest degree of MA when compared to the other 2D CrX3 materials. This is due to the larger contribution of spin-orbit coupling that can be attributed to the I atoms in the cell. Depending on functional, a wide variety of is predicted for CrI3, ranging from 1.98 meV to 4.22 meV. This drastic difference in magnetic exchange demonstrates the shortcomings of local/semi-local density functionals being used to deal with correlated electronic systems. This wide, functional dependent spread in is also observed for 2D CrBr3, CrCl3 and CrF3 (see Table 1). Since the magnetic exchange is the driving force behind the magnitude of the Curie temperature, the estimation of is crucial for an accurate Tc. For example, the LDA value of 1.98 yields a Tc of 27.09 K and the HSE06 value yields a Tc of 48.63 K for CrI3. With respect to the experimental value of Tc = 45 K for CrI3 1, PBE+U, SCAN+U and HSE06 are closest.
In terms of the MA of CrI3 ( and ), there is a relatively consistent trend between density functionals, with the exception of SCAN and SCAN+U. For SCAN and SCAN+U, the in-plane easy axis is favored () and for pure SCAN, a smaller value of combined with this negative results in a negative spin gap (see Eq. 10) and a nonphysical critical temperature in the Torelli and Olsen model. This negative spin gap behavior as a result of SCAN is not unique to CrI3. As seen in Table 1, this occurs for CrBr3 (calculated with SCAN+U) and CrF3 (calculated with SCAN). This behavior can be due in part to the numerical instabilities of the SCAN functional when being used to calculate properties of complex and correlated systems. This is even more evident when comparing SCAN and SCAN+U findings to r2SCAN and r2SCAN+U (r2SCAN is meant to correct the numerical instabilities in SCAN 54) results, where we only obtain positive spin gaps and finite Tc (see Table 1). In recent literature, concerns about the performance of the SCAN functional for magnetic materials have been brought up, including the over-magnetization of transition metal solids, deeming SCAN inappropriate for open shell metallic ferromagnetic metals 85, 86. However, SCAN has been reported to yield accurate properties across all bulk MnO2 polymorphs 87. Regardless of these successes and concerns, we believe it is important to report these SCAN results as a benchmark to compare DMC and other density functionals to.
| CrI3 | ||||
| Functional | (meV) | (meV) | (meV) | Tc (K) |
| PBE | 2.83 | 0.192 | 0.173 | 38.33 |
| PBE+U | 3.70 | 0.075 | 0.161 | 43.60 |
| LDA | 1.98 | 0.139 | 0.126 | 27.09 |
| LDA+U | 2.80 | 0.054 | 0.147 | 34.21 |
| SCAN | 3.24 | -0.129 | 0.019 | - |
| SCAN+U | 4.06 | -0.069 | 0.216 | 46.23 |
| r2SCAN | 2.57 | 0.145 | 0.049 | 29.00 |
| r2SCAN+U | 3.08 | 0.146 | 0.044 | 32.91 |
| HSE06 | 4.22 | 0.068 | 0.173 | 48.63 |
| CrBr3 | ||||
| Functional | (meV) | (meV) | (meV) | Tc (K) |
| PBE | 2.14 | 0.035 | 0.032 | 20.36 |
| PBE+U | 2.85 | 0.020 | 0.032 | 24.28 |
| LDA | 1.44 | 0.041 | 0.031 | 15.23 |
| LDA+U | 2.45 | 0.025 | 0.031 | 21.82 |
| SCAN | 1.63 | 0.083 | -0.016 | 13.40 |
| SCAN+U | 1.83 | 0.016 | -0.052 | - |
| r2SCAN | 1.85 | 0.037 | 0.013 | 16.21 |
| r2SCAN+U | 1.98 | 0.024 | 0.016 | 16.68 |
| HSE06 | 2.16 | 0.011 | 0.014 | 16.17 |
| CrCl3 | ||||
| Functional | (meV) | (meV) | (meV) | Tc (K) |
| PBE | 1.20 | 0.002 | 0.007 | 8.44 |
| PBE+U | 2.04 | -0.003 | 0.009 | 12.44 |
| LDA | 0.49 | 0.011 | 0.002 | 4.14 |
| LDA+U | 1.87 | 0.009 | 0.002 | 10.69 |
| SCAN | 0.94 | 0.032 | -0.003 | 7.64 |
| SCAN+U | 1.33 | 0.005 | 0.004 | 8.57 |
| r2SCAN | 1.42 | 0.007 | 0.004 | 9.33 |
| r2SCAN+U | 1.80 | 0.007 | 0.004 | 11.26 |
| HSE06 | 1.89 | 0.006 | 0.000 | 8.91 |
| CrF3 | ||||
| Functional | (meV) | (meV) | (meV) | Tc (K) |
| PBE | 1.53 | 0.055 | 0.000 | 13.45 |
| PBE+U | 1.33 | 0.053 | -0.001 | 11.91 |
| LDA | 1.87 | 0.068 | 0.003 | 16.83 |
| LDA+U | 1.63 | 0.065 | 0.002 | 14.91 |
| SCAN | 1.41 | -0.028 | -0.044 | - |
| SCAN+U | 1.29 | 0.048 | -0.013 | 8.97 |
| r2SCAN | 1.66 | 0.023 | 0.000 | 11.38 |
| r2SCAN+U | 1.44 | 0.050 | -0.002 | 12.22 |
| HSE06 | 1.02 | 0.053 | -0.001 | 9.79 |
| CrI3 | ||||
| Functional | (meV) | (meV) | (meV) | Tc (K) |
| PBE | 2.80 | 0.211 | 0.176 | 38.42 |
| PBE+U | 3.84 | 0.077 | 0.182 | 46.06 |
| LDA | 1.13 | 0.149 | 0.117 | 17.61 |
| LDA+U | 2.54 | 0.083 | 0.148 | 32.52 |
| SCAN | 2.73 | 0.041 | 0.071 | 28.61 |
| SCAN+U | 4.00 | -0.089 | 0.167 | 41.69 |
| r2SCAN | 2.58 | 0.142 | 0.057 | 29.48 |
| r2SCAN+U | 3.17 | 0.345 | -0.077 | 30.72 |
| CrBr3 | ||||
| Functional | (meV) | (meV) | (meV) | Tc (K) |
| PBE | 2.48 | 0.041 | 0.036 | 23.53 |
| PBE+U | 3.12 | 0.016 | 0.044 | 27.52 |
| LDA | 0.13 | 0.040 | 0.028 | 2.51 |
| LDA+U | 2.01 | 0.022 | 0.028 | 18.37 |
| SCAN | 1.73 | 0.050 | 0.018 | 16.64 |
| SCAN+U | 1.89 | 0.061 | 0.011 | 17.56 |
| r2SCAN | 1.95 | 0.037 | 0.020 | 17.76 |
| r2SCAN+U | 2.01 | 0.023 | 0.020 | 17.29 |
| CrCl3 | ||||
| Functional | (meV) | (meV) | (meV) | Tc (K) |
| PBE | 1.78 | -0.022 | 0.026 | 13.49 |
| PBE+U | 2.41 | -0.029 | 0.028 | 16.77 |
| LDA | -1.46 | 0.009 | 0.002 | - |
| LDA+U | 1.26 | 0.006 | 0.001 | 7.48 |
| SCAN | 1.04 | 0.041 | 0.012 | 10.64 |
| SCAN+U | 1.26 | 0.032 | -0.023 | - |
| r2SCAN | 1.57 | -0.012 | 0.024 | 12.67 |
| r2SCAN+U | 1.92 | -0.018 | 0.026 | 14.63 |
| CrF3 | ||||
| Functional | (meV) | (meV) | (meV) | Tc (K) |
| PBE | 1.74 | 0.058 | 0.001 | 15.12 |
| PBE+U | 1.44 | 0.057 | -0.001 | 12.86 |
| LDA | 1.12 | 0.067 | 0.003 | 11.41 |
| LDA+U | 1.55 | 0.061 | -0.001 | 13.86 |
| SCAN | 1.49 | 0.025 | -0.007 | 8.52 |
| SCAN+U | 1.22 | 0.044 | -0.006 | 9.76 |
| r2SCAN | 1.68 | 0.037 | 0.008 | 14.38 |
| r2SCAN+U | 1.42 | 0.049 | 0.020 | 14.45 |
In addition to performing this DFT/DFT+U workflow for a fixed geometry, we investigated the geometry dependence on the magnetic exchange and anisotropy. We did so by first relaxing the FM orientation of each structure with each respective functional (PBE, LDA, SCAN, r2SCAN, and +U for each) using spin-polarized DFT (as opposed to spin-orbit DFT, which comes at a much higher computational cost for geometric relaxation calculations). The relaxation using HSE06 was omitted due to the high computational expense of such calculations. Once the relaxed FM geometry was obtained, we fixed this geometry and performed the same noncollinear DFT (as Table 1) workflow to obtain the magnetic constants. The results of these calculations are presented in Table 2 and the relaxed structural parameters are given in Table S2. A scatter plot of the data presented in Table 2 is depicted in Fig. S5.
For the most part, geometry has little effect on the magnetic properties of each monolayer, which implies that the functional dependence is stronger. When comparing Table 1 and Table 2 for 2D CrI3, we observe that the parameters and Tc values are consistent between whether the geometry is relaxed or the geometry is fixed to the vdW-DF-OptB88 (JARVIS) structure. The only exception of this is the LDA relaxed geometry, where the lattice parameters are severely underestimated (see Table S2) for CrI3 and subsequently the values for and Tc are much lower than expected (1.13 meV and 17.16 K). This LDA trend also occurs for monolayer CrBr3, CrCl3 and CrF3. For CrCl3, the lattice compression from the LDA relaxation causes a magnetic phase transition from FM favorable to AFM favorable (see negative value in Table 2). This compression-induced phase transition has been reported theoretically for 2D CrCl3 in Dupont et al. 6. Changes in the MA energy with respect to geometry are most prevalent for 2D CrCl3, where we see a shift from out-of- plane easy axis () to in-plane easy axis () favorability for PBE and r2SCAN. This sign change in occurs while relaxing with the respective functionals for CrCl3, but there is only a small shift in Tc (between Table 1 and Table 2) due to the fact that is the driving force behind the critical temperature. For these reasons, we proceeded to use the vdW-DF-OptB88 relaxed geometry for subsequent QMC calculations in the next section. Further justification of using the vdW-DF-OptB88 geometry for QMC calculations stems from the fact that the geometry of 2D CrI3 calculated with vdW-DF-OptB88 is in identical statistical agreement with the geometry calculated from a previous DMC study from Staros et al. 39 (see Table S2). In addition, the lattice constant obtained with vdW-DF-OptB88 for 2D CrCl3 is in the closest agreement with the bulk lattice constant of layered CrCl388 (see also Table S2).
Although the structural parameters impact the magnetic properties of CrCl3 more significantly than CrI3, CrBr3 and CrF3 (see difference between Table 1 and Table 2), overall the functional dependence is stronger than the structural dependence. For comparison purposes, we present literature results 80, 42, 89, 90, 82, 5, 91, 7, 92 for all four monolayers calculated with a variety of computational methods in Table S3. Similar to our own results, we see a large variability in and Tc with respect to the computational method used, but we observe the same overall trends between each material. This is especially prevalent in works such as the one by Pizzochero et al. 92, which benchmarks the properties of CrI3 for a variety of DFT methods and multi-reference configuration interaction (MRCI) theory.
This high-throughput benchmarking with VASP is an important preliminary step in identifying the key areas where higher order correlated methods such as QMC can be used to improve electronic and magnetic property prediction. The next section will detail the process of incorporating QMC calculations into the workflow (as depicted in Fig. 2) and provide a deeper analysis of our QMC results.
3.2 QMC Results
QMC calculations in this study (which consist of a VMC calculation to optimize the Jastrow parameters of the wavefunction, followed by a DMC calculation) require a well converged trial wavefunction that is created via a DFT calculation. As opposed to the VASP DFT (PAW) calculations in the previous section, the DFT calculations detailed in this section (for additional benchmarking and creating the trial wavefunction) are performed using NC pseudopotentials (for additional information see Computational Methods). DMC has the property of zero-variance, which means that as the trial wave function approaches the exact ground state (exact nodal surface), the statistical fluctuations in the energy reduce to zero 15. There have been reported instances where various sophisticated and expensive methods have been used to optimize the nodal surface of the trial wave function 93, 94, 95, 96. Similar to other DMC studies of magnetic materials 27, 97, 19, 29, 39, 9, we employed a PBE+U approach where the Hubbard U value was used as a variational parameter to optimize the nodal surface using DMC. Since we can determine the optimal U parameter variationally using DMC, it makes our final results more reliable than solely using DFT+U, where the U parameter is arbitrarily chosen or fitted to experimental data. In addition, the DMC determined U value can be used for subsequent DFT+U calculations, giving a more reliable and less costly method to compute correlated material properties.
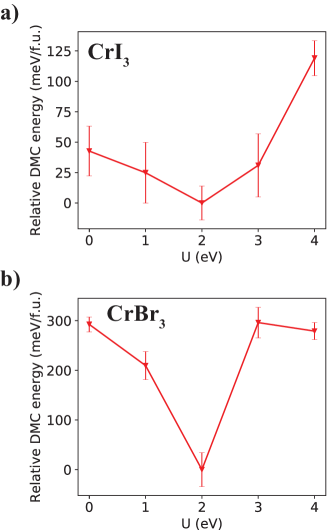
Fig. 3 depicts the total energies of a 16-atom supercell (normalized per formula unit (f.u.)) of the FM orientation of 2D a) CrI3 and b) CrBr3 while Fig. S6 depicts a) CrCl3, and b) CrF3 calculated as a function of the U parameter, with the goal of variationally determining the optimal trial wave function. For convenience of presentation, the DMC energies are shifted by the lowest DMC energy obtained at the appropriate U value (U = 2 eV for CrI3 and CrBr3, U = 1 eV for CrCl3 and U = 4 eV for CrF3). Unsurprisingly, the U value that yields the lowest energy for 2D CrI3 is 2 eV, which is similar to the result obtained by Staros et al. 39. U = 2 eV also yields the lowest energy for CrBr3, but the difference in energy between U = 2 eV and other values of U is much larger than that of CrI3, indicating that the U dependence on the trial wavefunction is stronger for 2D CrBr3. As seen in Fig. S6 a) and b), U = 1 eV produces an optimal wavefunction for CrCl3 and U = 4 eV produces an optimal wavefunction for CrF3. Although these U values differ from the U = 2 eV value for CrI3 and CrBr3, the energies at the minimum points are statistically identical to the energy produced at U = 2 eV for CrCl3 and CrF3.
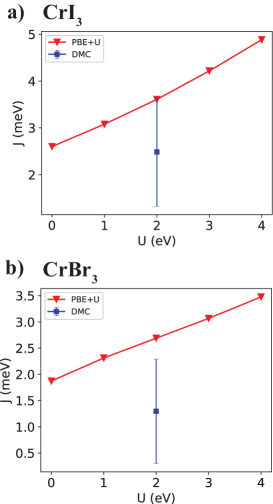
Due to the fact that 2D CrI3 and CrBr3 have the highest predicted Tc out of the four CrX3 monolayers (at the DFT level, see Table 1 and Table 2), and the fact that the largest discrepancy in predicted and Tc occurs for CrI3 and CrBr3, we decided to focus primarily on these two materials for the remainder of this study. Therefore, we ran monolayer CrI3 and CrBr3 through the full workflow depicted in Fig. 2, with the goal of determining a statistical bound on and Tc. In order to compute , we had to perform calculations for both monolayers in the FM and AFM (Neel) configurations. We performed these calculations using NC pseudpotentials (as previously mentioned) and based on our results presented in Fig. 3 a) and b), we created the trial wavefunction with PBE+U (U = 2 eV). For the sake of completeness, we also determined that U = 2 eV yields the optimal wavefunction for the AFM phase of CrI3 and CrBr3 (see Fig. S7), and this was used for all subsequent DMC calculations of the AFM phase. In addition, we performed these QMC simulations at a supercell size of 48 atoms (see Fig. S3 for convergence details). Fig. 4 depicts the calculated parameter of 2D a) CrI3 and b) CrBr3 using PBE+U (red triangle) and DMC (blue square). It is important to note that the DMC simulations required to achieve an estimate for (both FM and AFM calculations) require significant computational resources. Specifically, the DMC estimate of required 1.0 seconds/node to properly reduce the uncertainty (further details in supporting information). With more substantial computational resources beyond our capabilities, the uncertainty could be further reduced. As expected with PBE+U, as the U value increases from U = 0 eV to 4 eV, the parameter also increases linearly. In comparison to the PBE+U values, the average DMC calculated for CrI3 falls slightly under that of PBE+2 value, with the error bar overlapping with the DFT values at U = [0, 1, 2] eV. For 2D CrBr3, the average value of falls about 1 meV under the PBE+2 value, with the error bar overlaping with the DFT values at U = 0 and 1 eV. We report a DMC value of 2.49(1.16) meV for 2D CrI3 and a value of 1.30(1.00) meV for 2D CrBr3. This average DMC value of 2.49(1.16) meV for CrI3 is in excellent agreement with the MRCI calculated value of 2.88 meV reported in Pizzochero et al. 92 (see Table S3).
| CrI3 | |||||||
| Method | (meV) | (K) | (K) | (K) | (K) | (K) | (K) |
| PBE+0 | 2.60 | 103.26 | 33.46 | 32.40 | 33.10 | 29.00 | 33.81 |
| PBE+1 | 3.08 | 122.23 | 37.98 | 36.78 | 37.57 | 32.91 | 38.38 |
| PBE+2 | 3.61 | 143.23 | 42.79 | 41.42 | 42.32 | 37.07 | 43.23 |
| PBE+3 | 4.22 | 167.39 | 48.10 | 46.57 | 47.58 | 41.67 | 48.60 |
| PBE+4 | 4.88 | 193.84 | 53.70 | 51.99 | 53.12 | 46.52 | 54.26 |
| DMC | 2.49(1.16) | 98.65(46.02) | 32.34(10.78) | 31.31(10.43) | 31.98(10.66) | 28.02(9.33) | 32.67(10.89) |
| CrBr3 | |||||||
| Method | (meV) | (K) | (K) | (K) | (K) | (K) | (K) |
| PBE+0 | 1.87 | 74.31 | 17.70 | 17.84 | - | 15.98 | 14.52 |
| PBE+1 | 2.31 | 91.76 | 20.74 | 20.90 | - | 18.72 | 17.01 |
| PBE+2 | 2.69 | 106.74 | 23.23 | 23.41 | - | 20.97 | 19.05 |
| PBE+3 | 3.07 | 121.72 | 25.63 | 25.84 | - | 23.14 | 21.03 |
| PBE+4 | 3.48 | 137.97 | 28.16 | 28.38 | - | 25.42 | 23.10 |
| DMC | 1.30(1.00) | 51.45(39.52) | 13.43(7.17) | 13.54(7.23) | - | 12.13(6.47) | 11.02(5.88) |
In order to understand the implications of the DMC results presented in Fig. 4, we went a step further and calculated the Ising temperature (as described in the JARVIS Workflow section) and Curie temperature (Tc, calculated with the Torelli and Olsen model). These results are presented in Table 3. It is important to reiterate that the PBE+U and DMC (and subsequent ) values are determined from spin-polarized calculations and NC pseudopotentials, while the MA that is used in the Torelli and Olsen model to determine Tc is carried out using VASP with PAW pseudopotentials (from the DFT Benchmarking section). This combination of methods (outlined in Fig. 2) allows us to put a statistical bound on Tc for a given magnetic material. As seen in Table 3, we present Tc calculated with various values of (rows: PBE+U with varying U and DMC at U = 2 eV) and various values for the MA parameters (columns: using various functionals at the optimal U of 2 eV, indicated by the superscript on Tc). It is clear from Table 3 that is more of a driving force behind the variability of Tc than the MA. The largest difference in anisotropy (and therefore Tc) occurs for r2SCAN+2 for CrI3 and r2SCAN+2 and HSE06 for CrBr3, with respect to other functionals used to calculate anisotropy. Similarly to the data reported in Table 1, we observe a nonphysical Tc for CrBr3 with MA calculated with SCAN+2 (due to a negative spin gap). For 2D CrI3, we obtain a statistical bound of Tc = 43.56 K using the obtained from DMC and the anisotropy parameters obtained from HSE06, which is in excellent agreement with the measured value of 45 K 1. For 2D CrBr3, we obtain a maximum value of Tc = 20.78 K using the obtained from DMC and the anisotropy parameters obtained from LDA+2. For the sake of completeness, we calculated the Tc with a fixed obtained from DMC and the anisotropy ( and ) from a wider range DFT functionals, resulting in a sweep of possible values for Tc (a more detailed extension of Table 3). This thorough sensitivity analysis of the DMC-DFT calculated critical temperature is given in Table S4, where we observe that the different values of anisotropy have a 20 impact on the variability of the critical temperature for CrI3 and CrBr3. Interestingly, anisotropy obtained from PBE (no U correction) results in a slightly higher critical temperature for both monolayers (and bare LDA for CrBr3), but we find our maximum value estimates of Tc = 43.56 K and Tc = 20.78 K (for CrI3 and CrBr3 respectively) to be more reliable since the anisotropy was obtained from hybrid and Hubbard corrected functionals. Although these critical temperatures are far below room temperature, it has been demonstrated that Tc can be increased by applying strain 8 or by changing the monolayer substrate 2.
| CrI3 | ||
|---|---|---|
| Method | M () | M () |
| PBE+0 | 3.06 | -0.08 |
| PBE+1 | 3.15 | -0.1 |
| PBE+2 | 3.25 | -0.13 |
| PBE+3 | 3.34 | -0.16 |
| PBE+4 | 3.43 | -0.18 |
| DMC | 3.21(5) | -0.13(5) |
| CrBr3 | ||
| Method | M () | M () |
| PBE+0 | 3.01 | -0.03 |
| PBE+1 | 3.07 | -0.05 |
| PBE+2 | 3.14 | -0.07 |
| PBE+3 | 3.2 | -0.09 |
| PBE+4 | 3.26 | -0.11 |
| DMC | 2.96(5) | -0.07(5) |
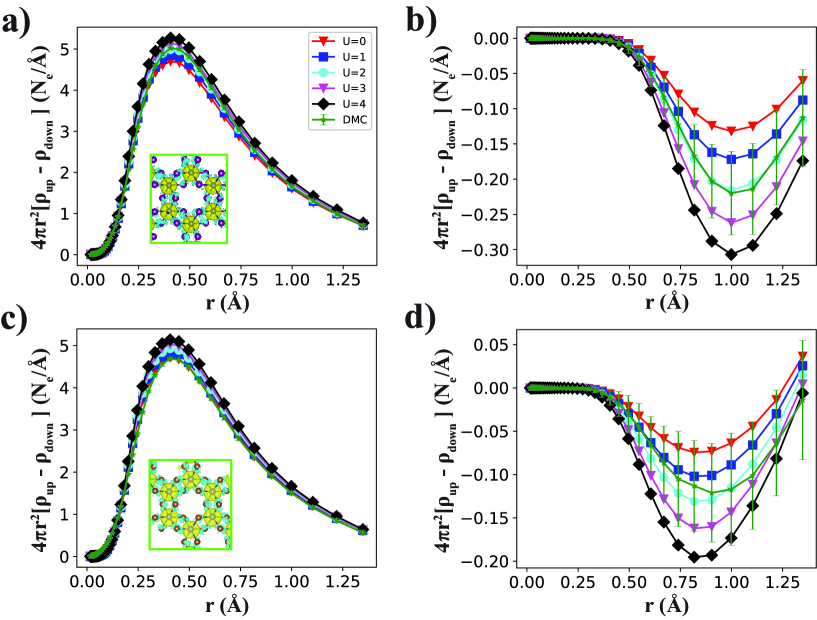
As an additional benchmark, we extracted the total charge density from our DMC simulations of 2D CrI3 and CrBr3 (using a trial wavefunction at U = 2 eV and 48 atom supercell). From the total charge densities, we were able to determine the spin densities ( - ), which are depicted in the insets of Fig. a) and c) for CrI3 and CrBr3 respectively. From this many-electron DMC approach, we observe that for both materials, the Cr atoms are highly spin-polarized while the I and Br atoms are slightly polarized antiparallel with respect to the Cr atoms. We went a step further by plotting the radial averaged densities as a function of distance for Cr and I separately for CrI3 and Cr and Br separately for CrBr3. This gives us the spatial variations in total charge density (Fig. S8) and spin density (Fig. 5). We benchmarked these radially averaged densities with PBE+U (U = [0, 1, 2, 3, 4] eV) using NC pseudopotentials in QE.
Fig. S8 a) and c) depicts the radially averaged total charge density of the Cr atoms as a function of distance for CrI3 and CrBr3 respectively. We observe that while the PBE+U results are almost identical for the Cr atoms for both materials, the total charge density of Cr is overestimated (mostly around the peak) with respect to the DMC total density. Although this PBE+U overestimation occurs for both CrI3 and CrBr3, it is much more apparent for CrBr3 (see Fig. S8 c)). For I and Br (Fig. S8 b) and d)), the difference between the PBE+U and DMC total charge density is negligible. The larger discrepancy between DMC and PBE+U for the Cr atom (for both CrI3 and CrBr3) near the radial density peak (peak of d orbital) is due in part to the fact that DFT functionals tend to unsuccessfully capture 3 orbitals. Although this sizeable difference between PBE+U and DMC occurs for the total charge densities, it has been reported that various DFT methods can give a more accurate description of the spin density than the total charge density 38. Fig. 5 depicts the radially averaged spin densities for each atom of 2D CrI3 and CrBr3. For CrI3 (Fig. 5 a) and b)), we observe excellent agreement between the DMC and PBE+2 spin densities for Cr and I, indicating that the PBE+2 method does not only reproduce a correct Tc with respect to DMC, but also correct spin density. In contrast, the results for CrBr3 are slightly different. Although it was determined that PBE+2 yields the most optimal wavefunction for DMC (Fig. 3 b)), the DMC spin density of Cr in CrBr3 is closest to the PBE+0 result (see Fig. 5 c)). This is consistent with the trend of the DMC calculated (and Tc) overlapping more closely with PBE+0 for CrBr3 (see Fig. 4 b) and Table 3). As for the Br atom in CrBr3, the DMC spin density is within the margin of error of that calculated with PBE+U for U = [0, 1, 2 and 3] eV. Most importantly for both materials (Fig. 5 b) and d)), the antiparallel polarization of I and Br with respect to Cr is present for DMC and all PBE+U results.
We went one step further and estimated the site-averaged atomic magnetic moments per Cr and I for 2D CrI3 and Cr and Br for CrBr3 by integrating the spin densities depicted in Fig. 5. These tabulated magnetic moments are presented in Table 4. The results of Table 4 are consistent with the spin density results presented in Fig. 5, where we see that the DMC calculated magnetic moment for CrI3 is closest to PBE+2 and the DMC calculated magnetic moment of CrBr3 is closest to PBE+0. Since PBE+0 produces results closest to DMC, we decided to recalculate the Tc using the anisotropy from PBE+U (U = 0 eV). We find that this increases the DMC maximum value to Tc = 21.39 K, which is about 1 K larger than previously reported (see Table S4). By analyzing and integrating the spin densities, we obtain a clear picture of how the magnetization of each ion depends on the computational method used. These results serve as a many-body theoretical benchmark for the magnetic properties of 2D CrI3 and CrBr3 and give information on how to assess the accuracy of DFT calculations with various Hubbard corrections.
4 Conclusion
In this work we designed and applied a workflow that combines DFT+U, QMC (VMC, DMC) and analytical models to estimate a statistical bound for the critical temperature of a 2D magnetic system. Such a workflow is intended to be integrated into the JARVIS framework. We chose monolayer CrX3 (X = I, Br, Cl, F) as a case study since they have been experimentally realized and have a finite critical temperature. After extensive DFT+U benchmarking with several functionals, we deemed that 2D CrI3 and CrBr3 were worthwhile to run through the more computationally expensive DFT+U and QMC workflow, due to their higher Tc and higher degree of disagreement between DFT functionals. After variationally determining the optimal wavefunction for DMC (Hubbard U value used in the DFT wavefunction generation), we calculated maximum value of 43.56 K for the Tc of CrI3 and of 20.78 K for the Tc of CrBr3. We also extracted the spin-density from our DMC results for Cr and I atoms separately for CrI3 and Cr and Br atoms separately for CrBr3 and provide a detailed comparison with DFT+U. In terms of the workflow, this procedure can be used for the investigation of future 2D magnetic systems that have a higher degree of complexity and electron correlation, such as transition metal oxides. The findings of this specific case study show the successes of the DMC method when applied to a 2D magnetic system and provide a many-body theoretical benchmark for CrX3 monolayers that will guide experimentalists in characterizing 2D magnets.
5 Data Availability Statement
The data from the present work is available at https://github.com/wines1/CrX3-QMC.
6 Code Availability Statement
Software packages mentioned in the article can be found at https://github.com/usnistgov/jarvis.
7 Competing interests
The authors declare no competing interests.
8 Supporting Information
Energy cutoff convergence, k-point convergence, DMC timestep convergence, finite-size convergence, tabulated geometric properties, scatter plot of DFT computed magnetic exchange and anisotropy, tabulated comparison to literature of magnetic properties, supplemental figures for nodal surface optimization, table that illustrates sweep of Tc values calculated from DMC and DFT, total charge density.
9 Acknowledgments
The authors thank the National Institute of Standards and Technology for funding, computational, and data-management resources. K.C. thanks the computational support from XSEDE (Extreme Science and Engineering Discovery Environment) computational resources under allocation number TG-DMR 190095. Contributions from K.C. were supported by the financial assistance award 70NANB19H117 from the U.S. Department of Commerce, National Institute of Standards and Technology. The authors thank Dr. Can Ataca and Dr. Kayahan Saritas for fruitful discussions.
References
References
- Huang et al. 2017 Huang, B.; Clark, G.; Navarro-Moratalla, E.; Klein, D. R.; Cheng, R.; Seyler, K. L.; Zhong, D.; Schmidgall, E.; McGuire, M. A.; Cobden, D. H.; Yao, W.; Xiao, D.; Jarillo-Herrero, P.; Xu, X. Layer-dependent ferromagnetism in a van der Waals crystal down to the monolayer limit. Nature 2017, 546, 270–273
- Bonilla et al. 2018 Bonilla, M.; Kolekar, S.; Ma, Y.; Diaz, H. C.; Kalappattil, V.; Das, R.; Eggers, T.; Gutierrez, H. R.; Phan, M.-H.; Batzill, M. Strong room-temperature ferromagnetism in VSe2 monolayers on van der Waals substrates. Nature Nanotech. 2018, 13, 289–293
- Gong et al. 2017 Gong, C.; Li, L.; Li, Z.; Ji, H.; Stern, A.; Xia, Y.; Cao, T.; Bao, W.; Wang, C.; Wang, Y.; Qiu, Z. Q.; Cava, R. J.; Louie, S. G.; Xia, J.; Zhang, X. Discovery of intrinsic ferromagnetism in two-dimensional van der Waals crystals. Nature 2017, 546, 265–269
- Deng et al. 2018 Deng, Y.; Yu, Y.; Song, Y.; Zhang, J.; Wang, N. Z.; Sun, Z.; Yi, Y.; Wu, Y. Z.; Wu, S.; Zhu, J.; Wang, J.; Chen, X. H.; Zhang, Y. Gate-tunable room-temperature ferromagnetism in two-dimensional Fe3GeTe2. Nature 2018, 563, 94–99
- Torelli et al. 2020 Torelli, D.; Moustafa, H.; Jacobsen, K. W.; Olsen, T. High-throughput computational screening for two-dimensional magnetic materials based on experimental databases of three-dimensional compounds. npj Comp. Materials 2020, 6, 158
- Dupont et al. 2021 Dupont, M.; Kvashnin, Y. O.; Shiranzaei, M.; Fransson, J.; Laflorencie, N.; Kantian, A. Monolayer as an Ideal Test Bed for the Universality Classes of 2D Magnetism. Phys. Rev. Lett. 2021, 127, 037204
- Zhang et al. 2015 Zhang, W.-B.; Qu, Q.; Zhu, P.; Lam, C.-H. Robust intrinsic ferromagnetism and half semiconductivity in stable two-dimensional single-layer chromium trihalides. J. Mater. Chem. C 2015, 3, 12457–12468
- Kan et al. 2013 Kan, M.; Zhou, J.; Sun, Q.; Kawazoe, Y.; Jena, P. The Intrinsic Ferromagnetism in a MnO2 Monolayer. J. Phys. Chem. Lett. 2013, 4, 3382–3386
- Wines et al. 2022 Wines, D.; Saritas, K.; Ataca, C. Intrinsic Ferromagnetism of Two-Dimensional (2D) MnO2 Revisited: A Many-Body Quantum Monte Carlo and DFT+U Study. J. Phys. Chem. C 2022, 126, 5813–5821
- Saritas and Ismail-Beigi 2022 Saritas, K.; Ismail-Beigi, S. Piezoelectric ferromagnetism in two-dimensional materials via materials screening. Phys. Rev. B 2022, 106, 134421
- Sachs et al. 2013 Sachs, B.; Wehling, T. O.; Novoselov, K. S.; Lichtenstein, A. I.; Katsnelson, M. I. Ferromagnetic two-dimensional crystals: Single layers of K2CuF4. Phys. Rev. B 2013, 88, 201402
- Chittari et al. 2016 Chittari, B. L.; Park, Y.; Lee, D.; Han, M.; MacDonald, A. H.; Hwang, E.; Jung, J. Electronic and magnetic properties of single-layer metal phosphorous trichalcogenides. Phys. Rev. B 2016, 94, 184428
- Sarikurt et al. 2018 Sarikurt, S.; Kadioglu, Y.; Ersan, F.; Vatansever, E.; Akturk, O. U.; Yuksel, Y.; Akinci, U.; Akturk, E. Electronic and magnetic properties of monolayer -RuCl3: a first-principles and Monte Carlo study. Phys. Chem. Chem. Phys. 2018, 20, 997–1004
- Ersan et al. 2019 Ersan, F.; Vatansever, E.; Sarikurt, S.; Yuksel, Y.; Kadioglu, Y.; Ozaydin, H. D.; Akturk, O. U.; Akinci, U.; Akturk, E. Exploring the electronic and magnetic properties of new metal halides from bulk to two-dimensional monolayer: RuX3 (X = Br, I). J. Mag. Mag. Materials 2019, 476, 111–119
- Foulkes et al. 2001 Foulkes, W. M. C.; Mitas, L.; Needs, R. J.; Rajagopal, G. Quantum Monte Carlo simulations of solids. Rev. Mod. Phys. 2001, 73, 33–83
- Hao et al. 2018 Hao, H.; Shee, J.; Upadhyay, S.; Ataca, C.; Jordan, K. D.; Rubenstein, B. M. Accurate Predictions of Electron Binding Energies of Dipole-Bound Anions via Quantum Monte Carlo Methods. J. Phys. Chem. Lett. 2018, 9, 6185–6190
- Szyniszewski et al. 2017 Szyniszewski, M.; Mostaani, E.; Drummond, N. D.; Fal’ko, V. I. Binding energies of trions and biexcitons in two-dimensional semiconductors from Diffusion Quantum Monte Carlo calculations. Phys. Rev. B 2017, 95, 081301
- Mostaani et al. 2017 Mostaani, E.; Szyniszewski, M.; Price, C. H.; Maezono, R.; Danovich, M.; Hunt, R. J.; Drummond, N. D.; Fal’ko, V. I. Diffusion Quantum Monte Carlo study of excitonic complexes in two-dimensional transition-metal dichalcogenides. Phys. Rev. B 2017, 96, 075431
- Saritas et al. 2019 Saritas, K.; Krogel, J. T.; Okamoto, S.; Lee, H. N.; Reboredo, F. A. Structural, electronic, and magnetic properties of bulk and epitaxial through Diffusion Monte Carlo. Phys. Rev. Materials 2019, 3, 124414
- Luo et al. 2016 Luo, Y.; Benali, A.; Shulenburger, L.; Krogel, J. T.; Heinonen, O.; Kent, P. R. C. Phase stability of TiO2 polymorphs from Diffusion Quantum Monte Carlo. New J. Phys. 2016, 18, 113049
- Benali et al. 2016 Benali, A.; Shulenburger, L.; Krogel, J. T.; Zhong, X.; Kent, P. R. C.; Heinonen, O. Quantum Monte Carlo analysis of a charge ordered insulating antiferromagnet: the Ti4O7 Magnéli phase. Phys. Chem. Chem. Phys. 2016, 18, 18323–18335
- Santana et al. 2015 Santana, J. A.; Krogel, J. T.; Kim, J.; Kent, P. R. C.; Reboredo, F. A. Structural stability and defect energetics of ZnO from Diffusion quantum Monte Carlo. J. Chem. Phys. 2015, 142, 164705
- Saritas et al. 2018 Saritas, K.; Krogel, J. T.; Reboredo, F. A. Relative energies and electronic structures of CoO polymorphs through ab initio Diffusion Quantum Monte Carlo. Phys. Rev. B 2018, 98, 155130
- Wang et al. 2020 Wang, G.; Annaberdiyev, A.; Mitas, L. Binding and excitations in SixHy molecular systems using Quantum Monte Carlo. J. Chem. Phys. 2020, 153, 144303
- Bennett et al. 2022 Bennett, M. C.; Hu, G.; Wang, G.; Heinonen, O.; Kent, P. R. C.; Krogel, J. T.; Ganesh, P. Origin of metal-insulator transitions in correlated perovskite metals. Phys. Rev. Research 2022, 4, L022005
- Annaberdiyev et al. 2021 Annaberdiyev, A.; Wang, G.; Melton, C. A.; Bennett, M. C.; Mitas, L. Cohesion and excitations of diamond-structure silicon by quantum Monte Carlo: Benchmarks and control of systematic biases. Phys. Rev. B 2021, 103, 205206
- Foyevtsova et al. 2014 Foyevtsova, K.; Krogel, J. T.; Kim, J.; Kent, P. R. C.; Dagotto, E.; Reboredo, F. A. Ab initio Quantum Monte Carlo Calculations of Spin Superexchange in Cuprates: The Benchmarking Case of . Phys. Rev. X 2014, 4, 031003
- Busemeyer et al. 2016 Busemeyer, B.; Dagrada, M.; Sorella, S.; Casula, M.; Wagner, L. K. Competing collinear magnetic structures in superconducting FeSe by first-principles quantum Monte Carlo calculations. Phys. Rev. B 2016, 94, 035108
- Saritas et al. 2018 Saritas, K.; Krogel, J. T.; Kent, P. R. C.; Reboredo, F. A. Diffusion Monte Carlo: A pathway towards an accurate theoretical description of manganese oxides. Phys. Rev. Materials 2018, 2, 085801
- Shin et al. 2021 Shin, H.; Krogel, J. T.; Gasperich, K.; Kent, P. R. C.; Benali, A.; Heinonen, O. Optimized structure and electronic band gap of monolayer GeSe from Quantum Monte Carlo methods. Phys. Rev. Materials 2021, 5, 024002
- Wines et al. 2020 Wines, D.; Saritas, K.; Ataca, C. A first-principles Quantum Monte Carlo study of two-dimensional (2D) GaSe. J. Chem. Phys. 2020, 153, 154704
- Wines et al. 2021 Wines, D.; Saritas, K.; Ataca, C. A pathway toward high-throughput quantum Monte Carlo simulations for alloys: A case study of two-dimensional (2D) GaSxSe1-x. J. Chem. Phys. 2021, 155, 194112
- Shulenburger et al. 2015 Shulenburger, L.; Baczewski, A. D.; Zhu, Z.; Guan, J.; Tománek, D. The Nature of the Interlayer Interaction in Bulk and Few-Layer Phosphorus. Nano Lett. 2015, 15, 8170–8175
- Frank et al. 2019 Frank, T.; Derian, R.; Tokár, K.; Mitas, L.; Fabian, J.; Štich, I. Many-Body Quantum Monte Carlo Study of 2D Materials: Cohesion and Band Gap in Single-Layer Phosphorene. Phys. Rev. X 2019, 9, 011018
- Mostaani et al. 2015 Mostaani, E.; Drummond, N. D.; Fal’ko, V. I. Quantum Monte Carlo Calculation of the Binding Energy of Bilayer Graphene. Phys. Rev. Lett. 2015, 115, 115501
- Kadioglu et al. 2018 Kadioglu, Y.; Santana, J. A.; Ozaydin, H. D.; Ersan, F.; Akturk, O. U.; Akturk, E.; Reboredo, F. A. Diffusion Quantum Monte Carlo and density functional calculations of the structural stability of bilayer arsenene. J. Chem. Phys. 2018, 148, 214706
- Saritas et al. 2019 Saritas, K.; Ming, W.; Du, M.-H.; Reboredo, F. A. Excitation Energies of Localized Correlated Defects via Quantum Monte Carlo: A Case Study of Mn4+-Doped Phosphors. J. Phys. Chem. Lett. 2019, 10, 67–74
- Kylänpää et al. 2017 Kylänpää, I.; Balachandran, J.; Ganesh, P.; Heinonen, O.; Kent, P. R. C.; Krogel, J. T. Accuracy of ab initio electron correlation and electron densities in vanadium dioxide. Phys. Rev. Materials 2017, 1, 065408
- Staros et al. 2021 Staros, D.; Hu, G.; Tiihonen, J.; Nanguneri, R.; Krogel, J.; Bennett, M. C.; Heinonen, O.; Ganesh, P.; Rubenstein, B. A combined first principles study of the structural, magnetic, and phonon properties of monolayer CrI3. J. Chem. Phys. 2021, 156, 014707
- Annaberdiyev et al. 2022 Annaberdiyev, A.; Melton, C. A.; Wang, G.; Mitas, L. Electronic structure of by fixed-node and fixed-phase diffusion Monte Carlo methods. Phys. Rev. B 2022, 106, 075127
- Mermin and Wagner 1966 Mermin, N. D.; Wagner, H. Absence of Ferromagnetism or Antiferromagnetism in One- or Two-Dimensional Isotropic Heisenberg Models. Phys. Rev. Lett. 1966, 17, 1133–1136
- Torelli and Olsen 2018 Torelli, D.; Olsen, T. Calculating critical temperatures for ferromagnetic order in two-dimensional materials. 2D Materials 2018, 6, 015028
- Choudhary et al. 2020 Choudhary, K. et al. The joint automated repository for various integrated simulations (JARVIS) for data-driven materials design. npj Comp. Materials 2020, 6, 173
- Choudhary et al. 2018 Choudhary, K.; Cheon, G.; Reed, E.; Tavazza, F. Elastic properties of bulk and low-dimensional materials using van der Waals density functional. Phys. Rev. B 2018, 98, 014107
- Choudhary et al. 2018 Choudhary, K.; Zhang, Q.; Reid, A. C. E.; Chowdhury, S.; Van Nguyen, N.; Trautt, Z.; Newrock, M. W.; Congo, F. Y.; Tavazza, F. Computational screening of high-performance optoelectronic materials using OptB88vdW and TB-mBJ formalisms. Scientific Data 2018, 5, 180082
- Choudhary et al. 2020 Choudhary, K.; Garrity, K. F.; Tavazza, F. Data-driven discovery of 3D and 2D thermoelectric materials. J. Phys.: Cond. Matter 2020, 32, 475501
- Choudhary et al. 2020 Choudhary, K.; Garrity, K. F.; Sharma, V.; Biacchi, A. J.; Hight Walker, A. R.; Tavazza, F. High-throughput density functional perturbation theory and machine learning predictions of infrared, piezoelectric, and dielectric responses. npj Comp. Materials 2020, 6, 64
- Choudhary et al. 2019 Choudhary, K.; Bercx, M.; Jiang, J.; Pachter, R.; Lamoen, D.; Tavazza, F. Accelerated Discovery of Efficient Solar Cell Materials Using Quantum and Machine-Learning Methods. Chem. Mater. 2019, 31, 5900–5908
- Choudhary et al. 2020 Choudhary, K.; Garrity, K. F.; Jiang, J.; Pachter, R.; Tavazza, F. Computational search for magnetic and non-magnetic 2D topological materials using unified spin–orbit spillage screening. npj Comp. Materials 2020, 6, 49
- Choudhary and Tavazza 2021 Choudhary, K.; Tavazza, F. Predicting anomalous quantum confinement effect in van der Waals materials. Phys. Rev. Materials 2021, 5, 054602
- Choudhary and Garrity 2022 Choudhary, K.; Garrity, K. Designing high-TC superconductors with BCS-inspired screening, density functional theory, and deep-learning. npj Comp. Materials 2022, 8, 244
- Himmetoglu et al. 2014 Himmetoglu, B.; Floris, A.; de Gironcoli, S.; Cococcioni, M. Hubbard-corrected DFT energy functionals: The LDA+U description of correlated systems. Int. J. Quantum Chem. 2014, 114, 14–49
- Sun et al. 2015 Sun, J.; Ruzsinszky, A.; Perdew, J. P. Strongly Constrained and Appropriately Normed Semilocal Density Functional. Phys. Rev. Lett. 2015, 115, 036402
- Furness et al. 2020 Furness, J. W.; Kaplan, A. D.; Ning, J.; Perdew, J. P.; Sun, J. Accurate and Numerically Efficient r2SCAN Meta-Generalized Gradient Approximation. J. Phys. Chem. Lett. 2020, 11, 8208–8215
- Heyd et al. 2003 Heyd, J.; Scuseria, G. E.; Ernzerhof, M. Hybrid functionals based on a screened Coulomb potential. J. Chem. Phys. 2003, 118, 8207–8215
- Dudarev et al. 1998 Dudarev, S. L.; Botton, G. A.; Savrasov, S. Y.; Humphreys, C. J.; Sutton, A. P. Electron-energy-loss spectra and the structural stability of nickel oxide: An LSDA+U study. Phys. Rev. B 1998, 57, 1505–1509
- Zhang et al. 2019 Zhang, Z.; Shang, J.; Jiang, C.; Rasmita, A.; Gao, W.; Yu, T. Direct Photoluminescence Probing of Ferromagnetism in Monolayer Two-Dimensional CrBr3. Nano Lett. 2019, 19, 3138–3142
- Cai et al. 2019 Cai, X.; Song, T.; Wilson, N. P.; Clark, G.; He, M.; Zhang, X.; Taniguchi, T.; Watanabe, K.; Yao, W.; Xiao, D.; McGuire, M. A.; Cobden, D. H.; Xu, X. Atomically Thin CrCl3: An In-Plane Layered Antiferromagnetic Insulator. Nano Lett. 2019, 19, 3993–3998
- Kresse and Furthmüller 1996 Kresse, G.; Furthmüller, J. Efficient iterative schemes for ab initio total-energy calculations using a plane-wave basis set. Phys. Rev. B 1996, 54, 11169–11186
- Kresse and Joubert 1999 Kresse, G.; Joubert, D. From ultrasoft pseudopotentials to the projector augmented-wave method. Phys. Rev. B 1999, 59, 1758–1775
- Perdew et al. 1996 Perdew, J. P.; Burke, K.; Ernzerhof, M. Generalized Gradient Approximation Made Simple. Phys. Rev. Lett. 1996, 77, 3865–3868
- Hohenberg and Kohn 1964 Hohenberg, P.; Kohn, W. Inhomogeneous Electron Gas. Phys. Rev. 1964, 136, B864–B871
- Klimeš et al. 2009 Klimeš, J.; Bowler, D. R.; Michaelides, A. Chemical accuracy for the van der Waals density functional. J. Phys.: Cond. Matter 2009, 22, 022201
- Giannozzi et al. 2009 Giannozzi, P. et al. QUANTUM ESPRESSO: a modular and open-source software project for quantum simulations of materials. J. Phys.: Cond. Matter 2009, 21, 395502
- Krogel et al. 2016 Krogel, J. T.; Santana, J. A.; Reboredo, F. A. Pseudopotentials for quantum Monte Carlo studies of transition metal oxides. Phys. Rev. B 2016, 93, 075143
- Bennett et al. 2018 Bennett, M. C.; Wang, G.; Annaberdiyev, A.; Melton, C. A.; Shulenburger, L.; Mitas, L. A new generation of effective core potentials from correlated calculations: 2nd row elements. J. Chem. Phys. 2018, 149, 104108
- Wang et al. 2019 Wang, G.; Annaberdiyev, A.; Melton, C. A.; Bennett, M. C.; Shulenburger, L.; Mitas, L. A new generation of effective core potentials from correlated calculations: 4s and 4p main group elements and first row additions. J. Chem. Phys. 2019, 151, 144110
- Wang et al. 2022 Wang, G.; Kincaid, B.; Zhou, H.; Annaberdiyev, A.; Bennett, M. C.; Krogel, J. T.; Mitas, L. A new generation of effective core potentials from correlated and spin–orbit calculations: Selected heavy elements. J. Chem. Phys. 2022, 157, 054101
- Kim et al. 2018 Kim, J. et al. QMCPACK: an open source ab initio quantum Monte Carlo package for the electronic structure of atoms, molecules and solids. J. Phys.: Cond. Matter 2018, 30, 195901
- Kent et al. 2020 Kent, P. R. C. et al. QMCPACK: Advances in the development, efficiency, and application of auxiliary field and real-space Variational and Diffusion Quantum Monte Carlo. J. Chem. Phys. 2020, 152, 174105
- Needs et al. 2009 Needs, R. J.; Towler, M. D.; Drummond, N. D.; Ríos, P. L. Continuum Variational and Diffusion Quantum Monte Carlo calculations. J. Phys.: Cond. Matter 2009, 22, 023201
- Slater 1929 Slater, J. C. The Theory of Complex Spectra. Phys. Rev. 1929, 34, 1293–1322
- Jastrow 1955 Jastrow, R. Many-Body Problem with Strong Forces. Phys. Rev. 1955, 98, 1479–1484
- Umrigar and Filippi 2005 Umrigar, C. J.; Filippi, C. Energy and Variance Optimization of Many-Body Wave Functions. Phys. Rev. Lett. 2005, 94, 150201
- Mitas et al. 1991 Mitas, L.; Shirley, E. L.; Ceperley, D. M. Nonlocal pseudopotentials and Diffusion Monte Carlo. J. Chem. Phys. 1991, 95, 3467–3475
- Drummond et al. 2004 Drummond, N. D.; Towler, M. D.; Needs, R. J. Jastrow correlation factor for atoms, molecules, and solids. Phys. Rev. B 2004, 70, 235119
- Umrigar et al. 2007 Umrigar, C. J.; Toulouse, J.; Filippi, C.; Sorella, S.; Hennig, R. G. Alleviation of the Fermion-Sign Problem by Optimization of Many-Body Wave Functions. Phys. Rev. Lett. 2007, 98, 110201
- Krogel 2016 Krogel, J. T. Nexus: A modular workflow management system for quantum simulation codes. Comp. Phys. Comm. 2016, 198, 154 – 168
- Casula et al. 2010 Casula, M.; Moroni, S.; Sorella, S.; Filippi, C. Size-consistent variational approaches to nonlocal pseudopotentials: Standard and lattice regularized diffusion Monte Carlo methods revisited. J. Chem. Phys. 2010, 132, 154113
- Lado and Fernández-Rossier 2017 Lado, J. L.; Fernández-Rossier, J. On the origin of magnetic anisotropy in two dimensional CrI3. 2D Materials 2017, 4, 035002
- Xu et al. 2020 Xu, C.; Feng, J.; Prokhorenko, S.; Nahas, Y.; Xiang, H.; Bellaiche, L. Topological spin texture in Janus monolayers of the chromium trihalides Cr(I, . Phys. Rev. B 2020, 101, 060404
- Xu et al. 2018 Xu, C.; Feng, J.; Xiang, H.; Bellaiche, L. Interplay between Kitaev interaction and single ion anisotropy in ferromagnetic CrI3 and CrGeTe3 monolayers. npj Comp. Materials 2018, 4, 57
- Lee et al. 2020 Lee, I.; Utermohlen, F. G.; Weber, D.; Hwang, K.; Zhang, C.; van Tol, J.; Goldberger, J. E.; Trivedi, N.; Hammel, P. C. Fundamental Spin Interactions Underlying the Magnetic Anisotropy in the Kitaev Ferromagnet . Phys. Rev. Lett. 2020, 124, 017201
- Choudhary and Tavazza 2019 Choudhary, K.; Tavazza, F. Convergence and machine learning predictions of Monkhorst-Pack k-points and plane-wave cut-off in high-throughput DFT calculations. Comp. Materials Sci. 2019, 161, 300–308
- Mejía-Rodríguez and Trickey 2019 Mejía-Rodríguez, D.; Trickey, S. B. Analysis of over-magnetization of elemental transition metal solids from the SCAN density functional. Phys. Rev. B 2019, 100, 041113
- Fu and Singh 2019 Fu, Y.; Singh, D. J. Density functional methods for the magnetism of transition metals: SCAN in relation to other functionals. Phys. Rev. B 2019, 100, 045126
- Kitchaev et al. 2016 Kitchaev, D. A.; Peng, H.; Liu, Y.; Sun, J.; Perdew, J. P.; Ceder, G. Energetics of polymorphs in density functional theory. Phys. Rev. B 2016, 93, 045132
- Morosin and Narath 1964 Morosin, B.; Narath, A. X‐Ray Diffraction and Nuclear Quadrupole Resonance Studies of Chromium Trichloride. J. Chem. Phys. 1964, 40, 1958–1967
- Olsen 2021 Olsen, T. Unified Treatment of Magnons and Excitons in Monolayer from Many-Body Perturbation Theory. Phys. Rev. Lett. 2021, 127, 166402
- Gudelli and Guo 2019 Gudelli, V. K.; Guo, G.-Y. Magnetism and magneto-optical effects in bulk and few-layer CrI3: a theoretical GGA+U study. New J. Phys. 2019, 21, 053012
- Webster and Yan 2018 Webster, L.; Yan, J.-A. Strain-tunable magnetic anisotropy in monolayer , , and . Phys. Rev. B 2018, 98, 144411
- Pizzochero et al. 2020 Pizzochero, M.; Yadav, R.; Yazyev, O. V. Magnetic exchange interactions in monolayer CrI3 from many-body wavefunction calculations. 2D Materials 2020, 7, 035005
- Kwon et al. 1993 Kwon, Y.; Ceperley, D. M.; Martin, R. M. Effects of three-body and backflow correlations in the two-dimensional electron gas. Phys. Rev. B 1993, 48, 12037–12046
- Kwon et al. 1998 Kwon, Y.; Ceperley, D. M.; Martin, R. M. Effects of backflow correlation in the three-dimensional electron gas: Quantum Monte Carlo study. Phys. Rev. B 1998, 58, 6800–6806
- López Ríos et al. 2006 López Ríos, P.; Ma, A.; Drummond, N. D.; Towler, M. D.; Needs, R. J. Inhomogeneous backflow transformations in quantum Monte Carlo calculations. Phys. Rev. E 2006, 74, 066701
- Bajdich et al. 2010 Bajdich, M.; Tiago, M. L.; Hood, R. Q.; Kent, P. R. C.; Reboredo, F. A. Systematic Reduction of Sign Errors in Many-Body Calculations of Atoms and Molecules. Phys. Rev. Lett. 2010, 104, 193001
- Ichibha et al. 2021 Ichibha, T.; Dzubak, A. L.; Krogel, J. T.; Cooper, V. R.; Reboredo, F. A. revisited with a many-body ab initio theoretical approach. Phys. Rev. Materials 2021, 5, 064006