Structure around threshold in radiative decays
Abstract
In this paper, we study the structure around the threshold that appears in , and invariant mass spectra in the processes of relevant radiative decays. The rescattering is taken into account, and the distorted-wave Born approximation is applied to get the decaying amplitude through a two-step process: , and . The scattering amplitudes are obtained by solving the Lippmann-Schwinger equation with the potentials given by chiral effective field theory. To fix the unknown couplings, we fit the amplitudes to the datasets of the latest measurements on the invariant mass spectra of radiative decays, as well as the phase shifts and inelasticities given by partial wave analysis. We vary the cutoffs (=0.9, 1.0, and 1.1 fm) and find that the solutions are stable. The structures around threshold found in the processes of , and can be attributed to threshold behavior of intermediate states.
I Introduction
Physicists have long been interested in 6-quark dibaryons and 3-quark-3-antiquark baryonium states. They can be one new kind of inner structure of matters and give clues to experimentalists to find new resonances. One possible candidate of the baryonium, first discovered in the invariant mass spectrum of near the threshold in the process of by BES collaboration [1], attracts both theoretical and experimental attention as the proton and neutron are the basic components of nucleus. Its mass and width are given as MeV and MeV [1]. Subsequently, this resonance is also observed in decays of [2], [3] and [4], while it is faintly supported by a few other experiments [5, 6]. A few years ago, BESIII increased the statistics of their measurements on the and observed a clear structure around threshold, but it does not look like a Breit-Wigner type peak around 1835 MeV. Indeed, the anomalous behavior around threshold has also been observed in quite a bit other processes such as and by Belle collaboration [7, 8], by BES collaboration [9], by BABAR [10] and SND [11] collaborations, and by BABAR collaboration [12]. Consequently, one would wonder about the internal links between the structure around threshold in the energy region around the and rescattering. There are many relevant theoretical researches which focused on [13, 14], [15, 16, 17], and [18], etc..
In the previous paper [16], the final-state interactions (FSI)111For different approaches implementing FSI, see e.g. Refs.[37, 24, 25]. have been included to study the structure around threshold in the process of . The strategy is following a two-step process, , with the quantum number of being . The distorted-wave Born approximation (DWBA) is used to implement FSI of . The underlying physics behind the first process is following the experimental measurements of anomalous energy-dependent behavior near the threshold in . See, e.g., Ref. [9], where there is an apparent threshold enhancement near the threshold in the decay of as observed by BES collaboration. Echoing these measurements, some theoretical models do find that the structure around threshold discovered in invariant mass spectrum of and/or the cross section of electron-positron annihilation into multipions is caused by the intermediate rescattering [15, 16], while no resonance pole is found in the partial wave.
Recently, BESIII collaboration performed the latest measurements on again, and the uncertainty of the invariant mass spectrum has been reduced near the threshold [20]. Thus, it would be necessary to include these new datasets and update the research of Ref. [16]. Also, there are clear structures around threshold in the measurements of the processes of and . If the structure is caused by the threshold behavior, the DWBA method discussed above should give a compatible data description. Thus we will include all these processes and give a systematic discussion. Further, in the previous work, only one cutoff (R=0.9 fm) was considered, and it is essential to check whether the structure is stable with different cutoffs.
This paper is organized as follows. In Sec. II, the formulas to calculate the reactions of , , , , , and are given. Through solving a set of coupled channel equations, e.g., Lippmann-Schwinger equation (LSE) and DWBA equations, one can get the scattering and decaying amplitudes. Then the fit results and discussions are given in Sec. III. The amplitude is fixed by fitting to the invariant mass spectra and the phase shifts of partial waves of scattering. The amplitudes of scattering into , and are fixed by fitting to the invariant mass spectra and/or branching ratios. The , and amplitude is then fixed by fitting to the corresponding invariant mass spectra of radiative decays. The effects of varying cutoffs are also discussed. Finally, a summary is given in Sec. IV.
II Formalism
As mentioned above, the , and decaying amplitudes are obtained through two-step processes of , and . The off-shell scattering amplitude is the kernel to be input into DWBA equations, which is solved by LSE [21],
| (1) |
where is the scattering amplitude. Here the relevant partial waves are of , with isospin . denotes the free propagator of the nucleon, is the nucleon-antinucleon interaction potential, which is calculated from chiral effective field theory (ChEFT) up to next-to-next-to-next-to leading order (N3LO). See Ref. [21] for details. The other amplitudes of the processes of , and , are obtained by solving the following set of coupled equations established by DWBA,
| (2) |
where denotes the final states with , , and , respectively. The transition amplitudes and , and the annihilation potential are parameterized as
| (3) |
where is the center-of-mass momentum of the nucleon-antinucleon system, and is the invariant mass , and for different processes, respectively. Notice that for the processes of and , we consider as a whole particle with the mass . Then these multipion final states are simplified into “three body” final states and have similar formalism as other processes. The decay rates and cross sections of these processes can be obtained through
| (4) |
where , and are the Lorentz invariant amplitudes of corresponding progresses. is the normalization factor caused by the property of identical particles, with for final states of , and , respectively. One has
| (5) | |||||
where one has , and for different processes, respectively.
Notice that the meaning of invariant mass has been extended: it can be either for the processes of and or for . The relations between the energies and the invariant mass are given as
| (6) |
where the subscripts ‘1,2,3’ have the same meaning as those appear in Eq.(5). The upper and lower limits of the integrals of Eq.(4) are
| (7) | |||||
with the Källén function defined as . The explicit set of coupled equations to solve the scattering and decaying amplitudes are as follows
| (8) |
where are the energy of the nucleon or antinucleon in the center of mass frame, with for the processes of and . The transition potentials given in Eq.(3) are multiplied with an exponential regulator in the actual calculations, which is consistent with the regularization of potentials, see Ref.[16] for details. This also ensures that the integrations in Eq.(8) are converging.
III Results and discussions
In this section, we will discuss the fit to the experimental data and the physics underlying the structure around threshold. Since the decaying amplitude of is constructed based on a two-step process, it would be convenient to divide this section into four parts: one is about the physics of the process of ; The second part is of ; The third part is about the results of ; And the last part is about .
III.1 Analysis of
First, we focus on the process of . As discussed above, the final state interactions should be considered. It is reasonable to assume that the relative angular momentum between and should be the lowest one, i.e., S-wave. Then the relevant partial wave of should be , with isospin to be either one or zero according to the unfixed isospin of the photon. Here we follow the previous work [16] and set the ratio between different isospin components to be . Indeed, this ratio gives the best for fitting to the data. In the previous work [16], the process of has been analyzed at fm. To study the stability of the solutions with different cutoffs, we analyze the process again with a set of cutoffs, e.g., 0.9, 1.0, and 1.1 fm. Here the corresponding cutoffs in the momentum space are given by , see Ref. [21].
The scattering amplitudes are solved by LSE. Similar to Ref.[16], the phase shifts of partial wave with isospin =1 are refit to reproduce the invariant mass spectra of . The values of the low-energy constants (LECs) of the chiral scattering potential of partial wave are listed in Table. 1.
| LECs | N2LO | N3LO | ||
|---|---|---|---|---|
| (fm) | 1.0 | 0.9 | 1.0 | 1.1 |
| (GeV-2) | 0.0480 | 0.3535 | 0.2674 | 0.0664 |
| (GeV-4) | -1.8397 | -3.7566 | -5.1411 | -5.3367 |
| (GeV-6) | -7.9227 | -15.0857 | -25.0000 | |
| (GeV-6) | 11.1314 | 20.0000 | 25.0000 | |
| (GeV-1) | -0.0102 | -0.0120 | -0.0907 | -0.1154 |
| (GeV-3) | -4.5259 | -3.0480 | -3.8174 | -4.6828 |
The fitting results of scattering phase shifts and inelasticity at N3LO for different cutoffs are at the top of Fig. 1.
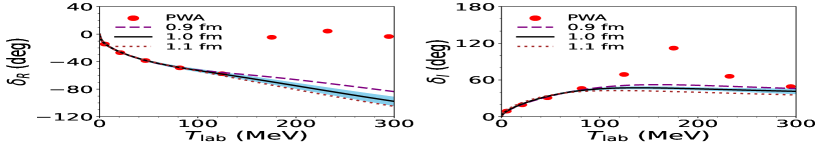
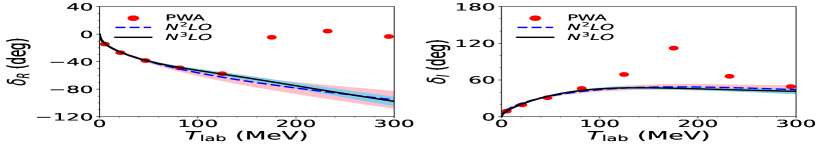
The results of N2LO and N3LO with cutoff fm are at the bottom of Fig. 1. Both are consistent with the phase shifts and inelasticity of partial wave analysis (PWA) [22] in the low-energy region ( below 100 MeV). This is guaranteed by the fact that we fit the first four points to constraint the low energy behavior of the off-shell scattering amplitudes , which will be input in the DWBA. While in the high energy region, there is an apparent difference between ours and PWA’s. The reason is that the phase shifts are the same in the low energy region for the processes of and , but they do not need to be the same in the high energy region. This is required by the final state interactions, e.g., the Watson theorem. See Refs. [23, 24, 25] for more discussions. Also, the invariant mass spectra of are smooth and decrease slowly in the high energy region, which requires the phase shifts to have similar behavior. For nucleon-antinucleon system, the relation between , and the nucleon’s energy, in the center of mass frame, is given as follows:
With the scattering amplitude, one can obtain the decaying amplitude according to Eq. (II). Here we set as a constant transition amplitude is enough to describe the data well. Also, we fix due to the overall normalization factor for the events data. Notice that the phase shifts and inelasticity of =1 partial wave and the invariant mass spectra from BESIII [26], BES [9] and CLEO [27] are fitted simultaneously. The fitting results of the decay rate of the process of are shown in Fig.2.
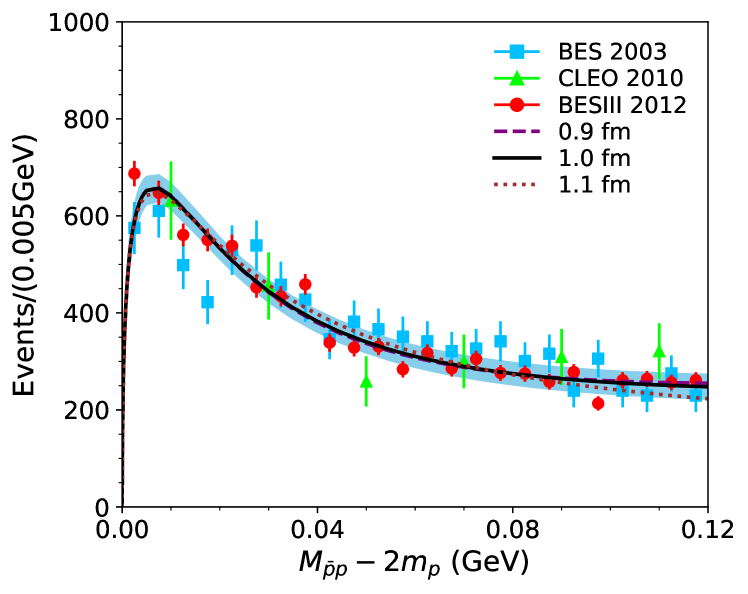
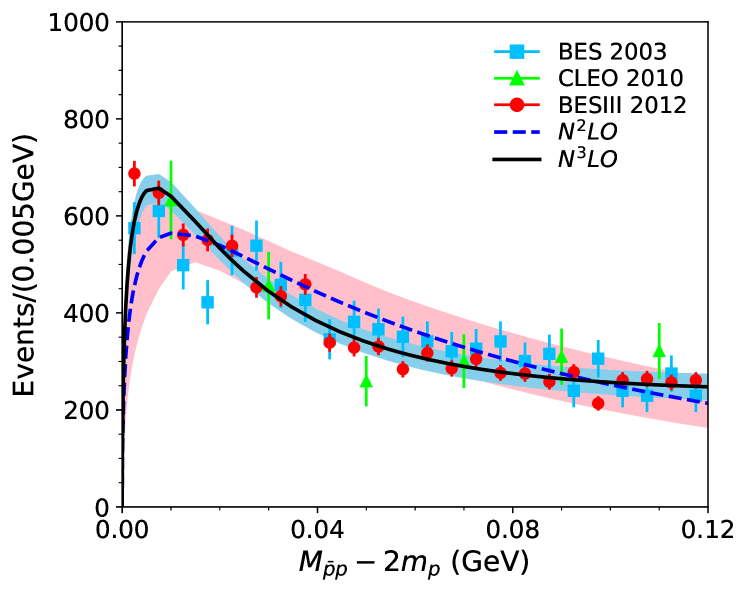
The top graphs of Fig. 2 are those of N3LO with different cutoffs: The purple dashed, black solid, and brown dotted curves are for cutoffs =0.9, 1.0, and 1.1 fm, respectively. All curves with different cutoffs are consistent with the experimental data. The results with =0.9 and 1.0 fm are somewhat similar to each other, and they have only a slight difference with the result of =1.1 fm. The comparison between the decay rates of N2LO and N3LO are given in the bottom graphs of Fig. 2, shown as the dashed blue and solid black curves. The error bands of the results with =1.0 fm are given by the pink and sky blue bands for N2LO and N3LO, respectively. The estimation is based on a Bayesian method [28, 21]. In the next sections, we will also use this method to estimate the uncertainties. Though the fit of N2LO is not as good as that of N3LO, especially in the energy region around the threshold, both are compatible with the experimental measurements.
As observed by the experiments, there is a clear threshold enhancement near the threshold. This inspires people to believe that there is a baryonium state related to the , e.g., the . In our analysis, such a state is not found in the origin scattering amplitudes, neither in nor in waves. Nonetheless, with the modest modified partial wave, such a bound state can be found below the threshold. For instance, the pole location for fm is MeV of N3LO, and MeV of N2LO, which are compatible with those found in Refs. [15, 16]. Nevertheless, the width () of the state is large, and thus it is not easy to conclude that the anomalous structure around threshold of other processes is purely caused by the . It should be stressed that the pole found here may not be suitable to be treated as evidence of confirming the baryonium origin of the 222Indeed, in some other processes, there have been observed (baryon-anti-baryon) threshold enhancements. However, it is not necessary to have a baryonium state there [38, 39]., as the data above the or threshold could determine the amplitudes below threshold unreliably.
III.2 Analysis of
As mentioned above, to determine the decay amplitude, one needs to know the amplitudes of two processes, and . The former decaying amplitude has been given in the previous subsection, and the latter is calculated out by the first equation of Eq. (II). Notice that only isoscalar wave is needed. The unknown couplings ( is set to be zero) is fixed by fitting to the cross section, mb, which is obtained by multiplying the measured branching ratio BR()=0.626 [30] and the total annihilation cross section of [31]. With these two amplitudes, we can now use DWBA to get the decaying amplitude of . Note that the parameters , and normalization factors for the invariant mass spectra are multiplied together. Therefore, we can set again. Finally, one only needs to determine three parameters by fitting to the invariant mass spectra, i.e., , and a normalization factor. Notice that and can be complex numbers, and hence there are four degrees of freedom for them. In the previous work [16], these two parameters are taken as real numbers. However, in this analysis, for cutoffs R=1.0 and 1.1 fm, the complex parameters would give a better quality of the fits. The parameters of our solutions are shown in Table 2.
| N2LO | N3LO | |||
|---|---|---|---|---|
| (fm) | 1.0 | 0.9 | 1.0 | 1.1 |
| (GeV-2) | 0.0075 | 0.0069 | 0.0072 | 0.0075 |
| (GeV-2) | -0.2498 | -0.1072 | -0.1561 | -0.2283 |
| +0.0105 | -0.0844 | -0.0342 | +0.0177 | |
| (GeV-3) | 0.0881 | 0.0360 | 0.0538 | 0.0830 |
| +0.0101 | +0.0462 | +0.0249 | +0.0025 | |
Recently, BESIII collaboration performed a new measurement on the invariant mass spectra of the decay rate of [20]. In this new measurement, two ways to collect the events of the final state are considered: one is from , and the other is from . Correspondingly, there are two different datasets, and we label them as BESIII 2022 (I) and (II), respectively. These new datasets have smaller errors than that of the previous measurement[32], and thus it is necessary to include them in the present analysis. The fitting results are shown in Fig. 3.
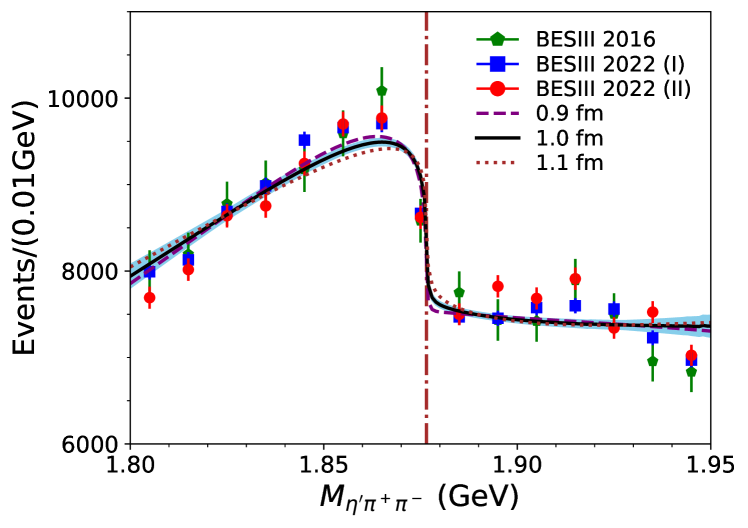
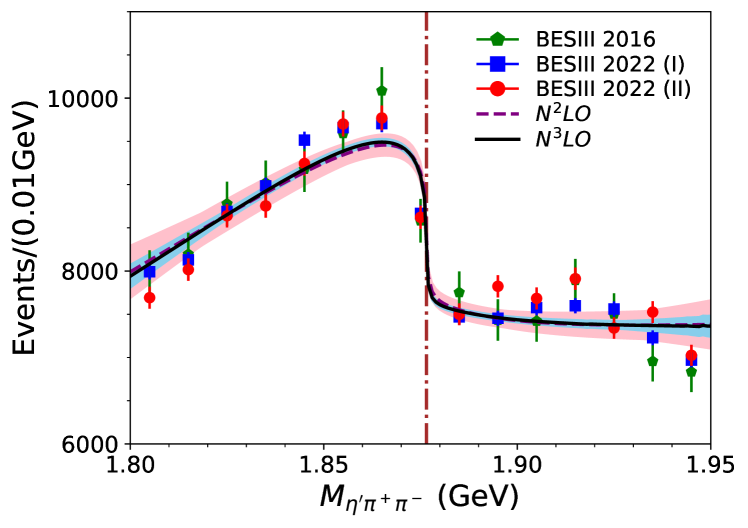
The fitting results of N3LO with cutoffs 0.9, 1.0, and 1.1 fm are shown in the top graphs of Fig. 3, denoted by dashed purple, solid black, and dotted brown curves, respectively. It can be found that all our solutions are consistent with the datasets. The difference between the results of different cutoffs is relatively tiny, revealing that the solutions are somewhat cutoff independent. The error bands of fm, both for N2LO and N3LO, are shown by the pink and sky blue bands as plotted in Fig. 3. The error estimation method is again from the Bayesian method as Ref. [28, 21]. Interestingly, the solution of N2LO has almost the same quality as that of N3LO. This is because we have let the parameters of the transition amplitude , and be complex, and thus the degrees of freedom of the fit have been increased. Also, notice that the results of at N2LO are worse than that at N3LO. Nevertheless, the mechanism of how the structure around threshold is generated would be similar to that of the previous paper [16]. See discussions below.
To study the structure around threshold in the invariant mass spectra of , we separate two contributions to the spectra: one is from rescattering (), and the other is the ‘background, i.e., the contribution from the transition amplitude . The individual contributions of these two parts are calculated by Eq. (II), with one part switched on while the other switched off. The results are shown in Fig.4.
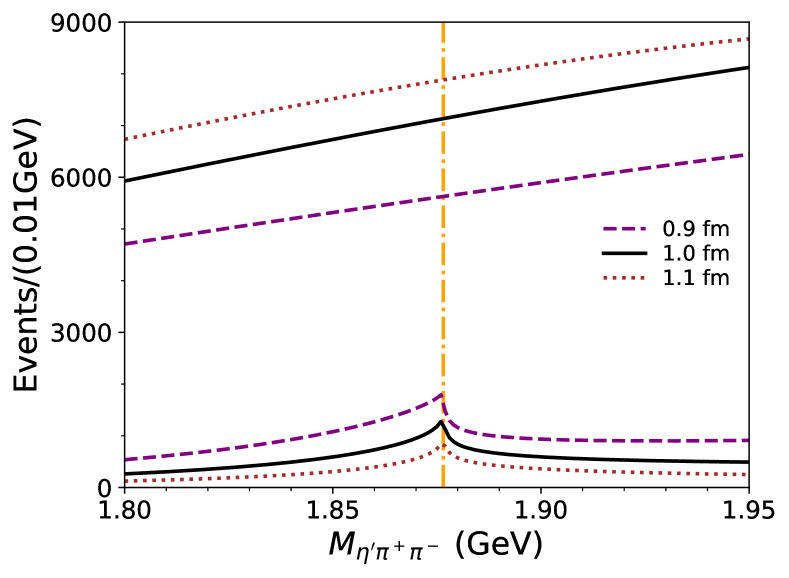
As can be seen, the backgrounds are pretty smooth and more prominent, while the rescattering term contributes little except for a cusplike structure around the threshold. This confirms our conclusion, i.e., the structure around the threshold in the invariant mass spectra of should be generated by the interference between the background and the rescattering. On the other hand, there is no pole ( bound state or resonance) found in the partial wave of scattering amplitude for any of these cutoffs, neither in the N2LO case nor in the N3LO case333We are aware that in some other models [40, 41, 17], they find a near-threshold pole in the partial wave. . Hence, our analysis indicates that there is no need for a bound state to quantitatively describe the structure around the threshold in invariant mass spectra of .
III.3 Analysis of
As discussed above, the decaying amplitude of is constructed by DWBA with the amplitudes of and . The former has been given in the previous sections, and the latter is fixed by fitting the relevant cross section. In Ref. [34], the cross section is measured in the momentum range =374-680 MeV. In the low energy region, one can obtain =7.520.89 mb at =106.6 MeV by combining the branching ratio BR()=% [35] and the total annihilation cross section [31]. With the amplitudes of and , we can construct the decay amplitude of according to Eq. (II). The unknown couplings of the Born term of and the potential of will be fixed by combination fitting the cross section of and the invariant mass spectrum of [2].
The unknown parameters are , , and , see Eq. (3). Note that only the isoscalar partial wave is taken into account according to ignoring higher partial waves. For and , they can be complex numbers, resulting in four degrees of freedom. For that corresponds to momentum dependence of the potential, we include it and find a better fit. Besides, one also needs a normalization factor for the decay rates of in the full range. The values of parameters of our fit are given in Table 3.
| N2LO | N3LO | |||
|---|---|---|---|---|
| (fm) | 1.0 | 0.9 | 1.0 | 1.1 |
| (GeV-2) | 0.0124 | 0.0108 | 0.0113 | 0.0117 |
| (GeV-2) | 0.1246 | 0.0980 | 0.1245 | 0.1555 |
| (GeV-2) | 0.3578 | 0.1491 | 0.1453 | 0.2015 |
| -0.1786 | -0.0477 | -0.1257 | -0.1080 | |
| (GeV-3) | -0.2009 | -0.0350 | -0.0522 | -0.1021 |
| +0.0592 | +0.0149 | +0.0447 | 0.0291 | |
The results of fitting to the cross section of are shown in Fig. 5.
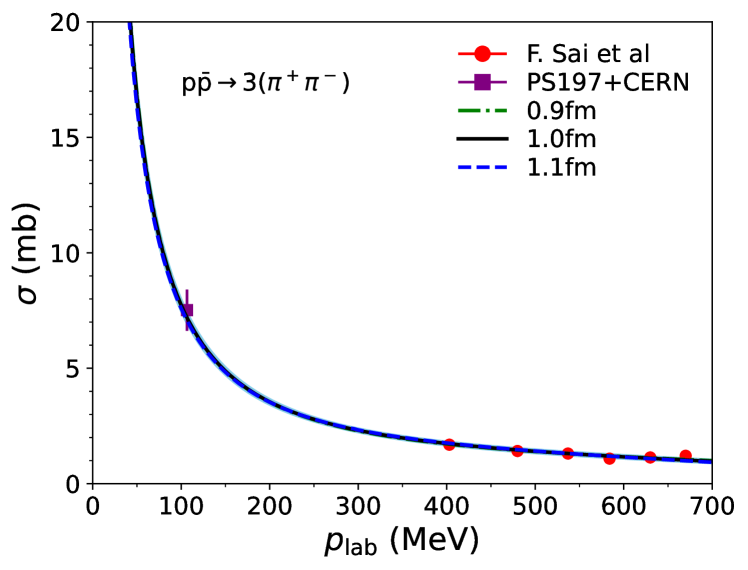
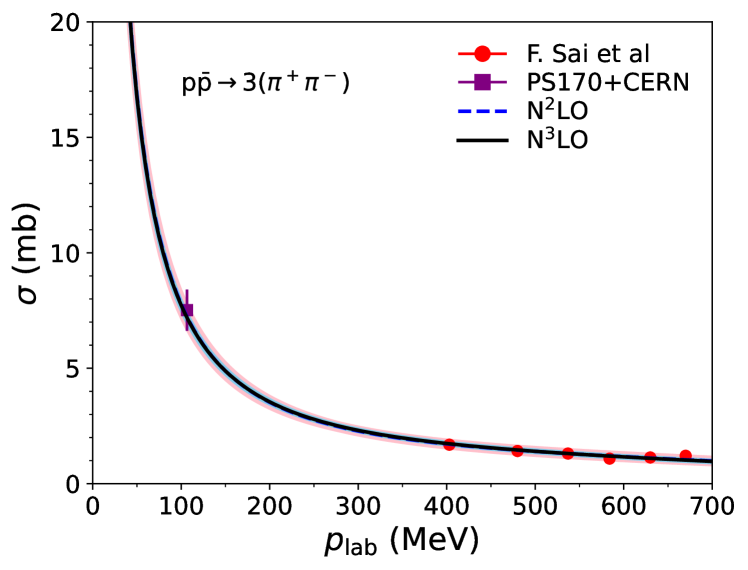
The top graphs show the results of N3LO with different cutoffs, =0.9, 1.0, and 1.1 fm. Our solutions are consistent with the data. Indeed, there is almost no difference between the solutions with different cutoffs. The results for N2LO and N3LO, with the cutoff =1.0 fm, are shown in the bottom graphs. As can be found, they are consistent with the data, and the one of N2LO (the dashed blue line and pink band) overlaps with that of N3LO (the solid black line and sky blue band). From this aspect, one can conclude that the higher order correction on rescattering at N3LO has little influence on the scattering of . The reason may be that there are only a few data points for this process, so the N2LO description on the rescattering is enough.
The results of fitting to the decay rates are shown in Fig. 6.
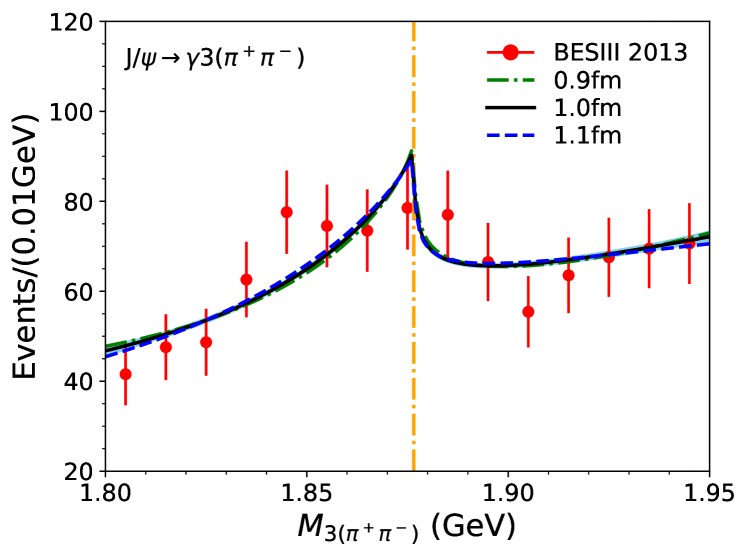
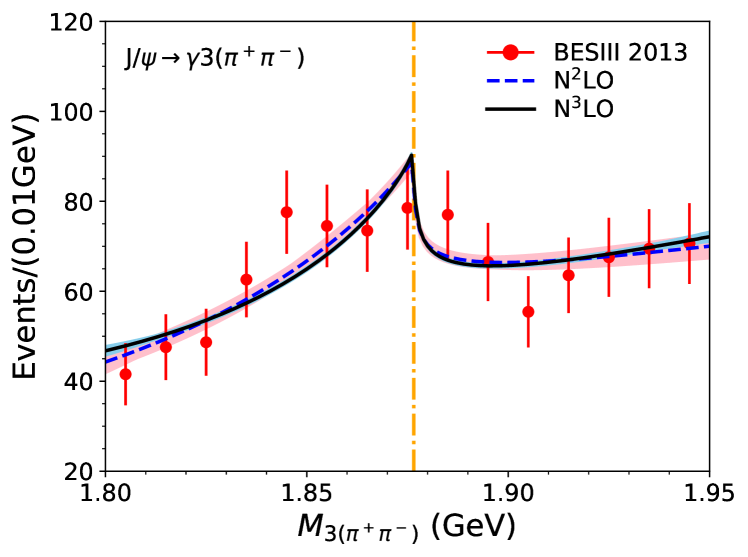
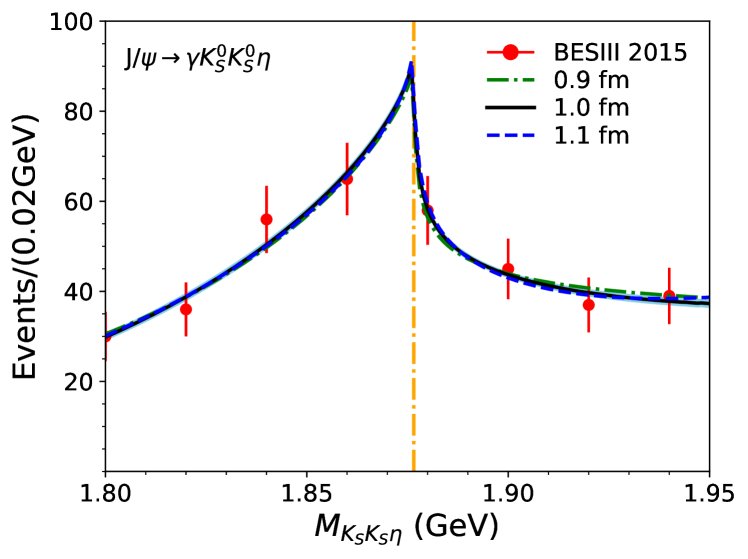
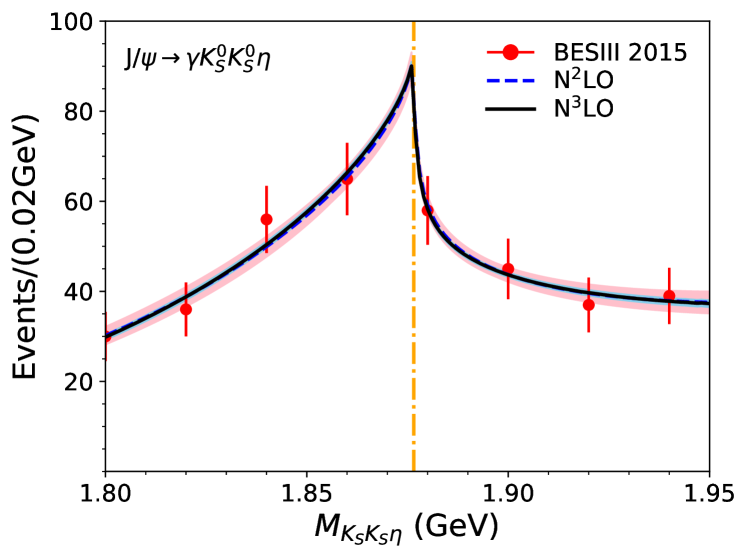
In the top graphs, the dash-dotted green, solid black, and dashed blue lines are the solutions with cutoffs =0.9, 1.0, and 1.1 fm of N3LO, respectively. In the bottom graphs, the dashed blue and black solid lines are for N2LO and N3LO with cutoff =1.0 fm. Notice that we only focus on the energy region around the threshold. One would notice that our solutions around the threshold behaves like a cusp, while two data points, one around 1.84 GeV and the other around 1.90 GeV, are not fitted well. Nevertheless, taking into account the large uncertainties of the data, our solutions are still compatible with the data of the invariant mass spectrum of . The difference between the solutions with different cutoffs is tiny. See the green, black and blue curves in the top graphs. This implies that our solutions of are stable by varying cutoffs. The results of N2LO and N3LO also have slight differences. See the blue and black curves at the bottom. The reason may be that the data statistics need to be higher.
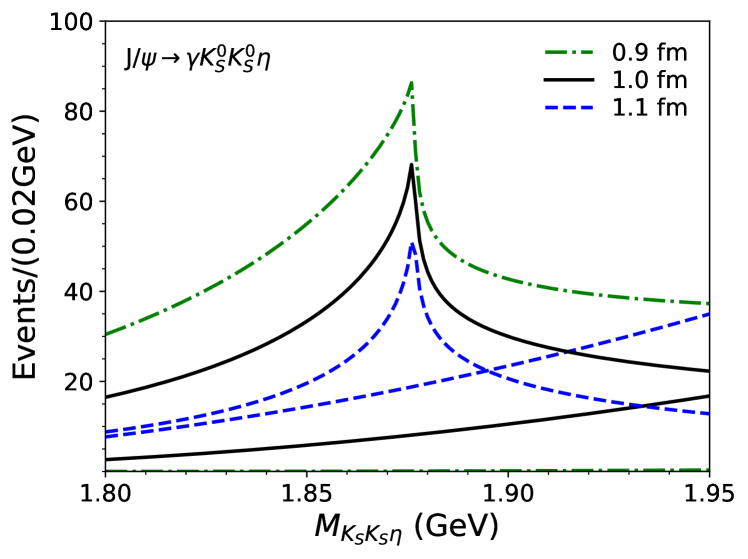
Like what is done in the previous subsection, we present the individual contributions from the background and the rescattering (). See Fig. 7.
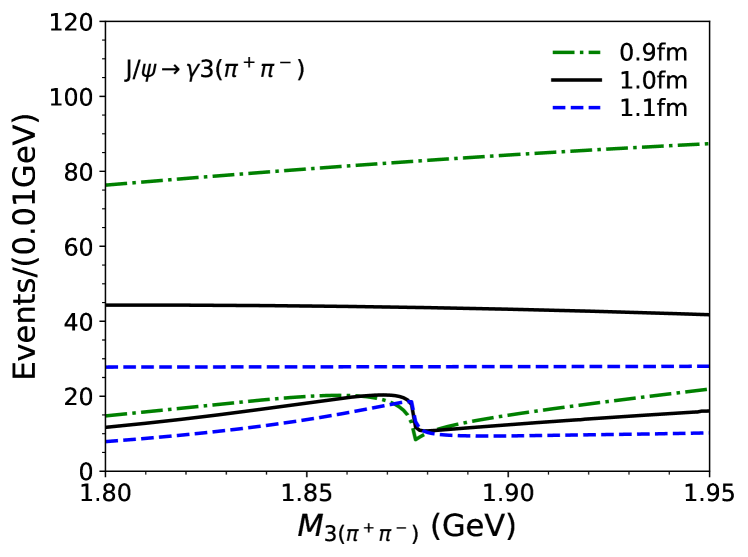
The dash-dotted green, solid black, and dashed blue lines are for cutoffs =0.9, 1.0, and 1.1 fm, respectively. The contributions from the background are smooth, and the structure around the threshold is caused by the rescattering. This supports that the structure of invariant mass spectrum around the threshold should be originated from the threshold behavior.
III.4 Analysis of
The amplitude of is constructed through a two-step process of . The amplitude of is fixed by the cross section, which is obtained from the branching ratio BR()=(0.250.04)% [36] and the total annihilation cross section of [31]. One has b at MeV. Combined the amplitudes of and through DWBA, one can fix the amplitude of by fitting to the invariant mass spectrum. Notice that in Ref. [3], the structure around the (1835) become more prominent by requiring GeV. Correspondingly, we set the upper limit in Eq. (4) for the decay rate of . Notice that the channel is quite far away from threshold, and it will only supply a background in the energy region concerned.
The unknown parameters are given in Eq. (3), i.e., , , and . Since there is only one data point for the cross section, we set to be zero and then can be fixed. For and , they could be complex numbers, but in practice, we can set them as real numbers and the fit is in high quality. Thus there are only two degrees of freedom. In addition, an overall normalization factor to the data of invariant mass spectrum in the radiative decay is needed. The values of these parameters are shown in Table 4.
| N2LO | N3LO | |||
|---|---|---|---|---|
| (fm) | 1.0 | 0.9 | 1.0 | 1.1 |
| (GeV-2) | 0.4659 | 0.4514 | 0.4573 | 0.4607 |
| (GeV-2) | 6.8187 | 0.9990 | 4.4638 | 6.1870 |
| (GeV-3) | -4.2018 | -0.5561 | -2.6581 | -3.7904 |
One would notice that are much smaller than that of , and . This is because the cross section of is almost three orders smaller than that of and . For and , it is difficult to discuss why its magnitude is smaller than those of , , and , because these transition potentials interfere with the rescattering parts. Their magnitudes are fixed by fitting to the invariant mass spectra. Notice that the whole amplitudes should also multiply an overall normalization factor to fit the events data.
Our solutions fitting to the invariant mass spectrum are shown in Fig. 8.
As can be found, our solutions fit the experimental data rather well. However, it should be noted that there are only 8 data points in the energy region of [1.80-1.95] GeV that we focus on. The top graphs in Fig. 8 are the results of N3LO. The dash-dotted green, solid black, and dashed blue lines are for cutoffs 0.9, 1.0, and 1.1 fm, respectively. These curves of different cutoffs almost overlap, implying that the results are not sensitive to the cutoffs. The bottom graphs are the results of N2LO (dashed blue) and N3LO (black solid) with cutoff =1.0 fm. The results of N2LO and N3LO overlap with each other, and this is again caused by lacking enough statistics on the data. It would be rather helpful if there are future measurements on the invariant mass spectrum of , especially those around the threshold to get apparent structure.
The individual contributions from background and rescattering to invariant mass spectra of are shown Fig. 9. The smooth lines at the bottom are from backgrounds (Born terms as given in Eq.(3)), and the ones with cusps around the threshold are from rescattering. It shows clearly that the structure around the threshold is caused by threshold behavior. Note that in some other models, the origin of the structure around threshold could be caused by some bound states. See e.g., Refs. [15, 17]. As a short summary, in all the processes of radiative decays, , , and , the structure around threshold are caused by the rescattering. While there is no resonance found in the isoscalar wave.
IV Conclusion
In this paper, we analyzed the radiative decays of the processes of , , and with chiral effective field theory and distorted wave Born approximation. The latest measurements on the , , and invariant mass spectra are taken into account. Our results show that the structures around the threshold found in all these processes are caused by the threshold effect, while no bound state or resonance is found in the relevant partial wave. To check the reliability, we test the effects of different cutoffs and find that our conclusion is not sensitive to the cutoffs. It would be helpful to refine the analysis if there are future measurements on the invariant mass spectra around the threshold of the radiative decays.
Acknowledgements
We thank professor X.-W. Kang for helpful discussions. This work is supported by Joint Large Scale Scientific Facility Funds of the National Natural Science Foundation of China (NSFC) and Chinese Academy of Sciences (CAS) under Contract No.U1932110, and NSFC Grant with No. 12061141006.
References
- Ablikim et al. [2005] M. Ablikim et al. (BES Collaboration), Observation of a Resonance in , Phys. Rev. Lett. 95, 262001 (2005).
- Ablikim et al. [2013] M. Ablikim et al. (BESIII Collaboration), Observation of a structure at 1.84 GeV/ in the 3() mass spectrum in decays, Phys. Rev. D 88, 091502 (2013).
- Ablikim et al. [2015] M. Ablikim et al. (BESIII Collaboration), Observation and Spin-Parity Determination of the in , Phys. Rev. Lett. 115, 091803 (2015).
- Ablikim et al. [2018] M. Ablikim et al. (BESIII Collaboration), Study of and in radiative decays to , Phys. Rev. D 97, 051101 (2018).
- He et al. [2014] X. H. He et al. (Belle Collaboration), Search for the process at GeV, Phys. Rev. D 89, 032003 (2014).
- Zhang et al. [2012] C. C. Zhang et al. (Belle Collaboration), First study of , and production via final states in two-photon collisions, Phys. Rev. D 86, 052002 (2012).
- Abe et al. [2002a] K. Abe et al. (Belle Collaboration), Observation of , Phys. Rev. Lett. 88, 181803 (2002a).
- Abe et al. [2002b] K. Abe et al. (Belle Collaboration), Observation of , Phys. Rev. Lett. 89, 151802 (2002b).
- Bai et al. [2003] J. Z. Bai et al. (BES Collaboration), Observation of a Near-Threshold Enhancement in the Mass Spectrum from Radiative Decays, Phys. Rev. Lett. 91, 022001 (2003).
- Lees et al. [2013] J. P. Lees et al. (BABAR Collaboration), Study of via initial-state radiation at BABAR, Phys. Rev. D 87, 092005 (2013).
- Achasov et al. [2022] M. N. Achasov et al. (SND Collaboration), Experimental study of the process at the VEPP-2000 collider with the SND detector, Eur. Phys. J. C 82, 761 (2022).
- Aubert et al. [2006] B. Aubert et al. (BABAR Collaboration), The and cross sections at center-of-mass energies from production threshold to 4.5 GeV measured with initial-state radiation, Phys. Rev. D 73, 052003 (2006).
- Haidenbauer et al. [2014] J. Haidenbauer, X. W. Kang, and U. G. Meißner, The electromagnetic form factors of the proton in the timelike region, Nucl. Phys. A 929, 102 (2014).
- [14] Q.-H. Yang, L.-Y. Dai, D. Guo, J. Haidenbauer, X.-W. Kang, and U.-G. Meißner, New insights into the oscillation of the nucleon electromagnetic form factors, arXiv:2206.01494 [nucl-th] .
- Kang et al. [2015] X.-W. Kang, J. Haidenbauer, and U.-G. Meißner, Near-threshold invariant mass spectrum measured in and decays, Phys. Rev. D 91, 074003 (2015).
- Dai et al. [2018] L.-Y. Dai, J. Haidenbauer, and U.-G. Meißner, and the structure observed around the threshold, Phys. Rev. D 98, 014005 (2018).
- Dedonder et al. [2018] J. P. Dedonder, B. Loiseau, and S. Wycech, Photon or meson formation in decays into , Phys. Rev. C 97, 065206 (2018).
- Haidenbauer et al. [2015] J. Haidenbauer, C. Hanhart, X.-W. Kang, and U.-G. Meißner, Origin of the structures observed in annihilation into multipion states around the threshold, Phys. Rev. D 92, 054032 (2015).
- Note [1] For different approaches implementing FSI, see e.g. Refs.[37, 24, 25].
- Ablikim et al. [2022] M. Ablikim et al. (BESIII Collaboration), Observation of a State in the System in the Process , Phys. Rev. Lett. 129, 042001 (2022).
- Dai et al. [2017a] L.-Y. Dai, J. Haidenbauer, and U.-G. Meißner, Antinucleon-nucleon interaction at next-to-next-to-next-to-leading order in chiral effective field theory, JHEP 07, 078.
- Zhou and Timmermans [2012] D. Zhou and R. G. E. Timmermans, Energy-dependent partial-wave analysis of all antiproton-proton scattering data below 925 MeV, Phys. Rev. C 86, 044003 (2012).
- Au et al. [1987] K. Au, D. Morgan, and M. Pennington, Meson dynamics beyond the quark model: Study of final state interactions, Phys. Rev. D 35, 1633 (1987).
- Dai and Pennington [2014] L.-Y. Dai and M. R. Pennington, Comprehensive amplitude analysis of and below 1.5 GeV, Phys. Rev. D 90, 036004 (2014).
- Yao et al. [2021] D.-L. Yao, L.-Y. Dai, H.-Q. Zheng, and Z.-Y. Zhou, A review on partial-wave dynamics with chiral effective field theory and dispersion relation, Rept. Prog. Phys. 84, 076201 (2021).
- Ablikim et al. [2012] M. Ablikim et al. (BESIII Collaboration), Spin-Parity Analysis of Mass Threshold Structure in and Radiative Decays, Phys. Rev. Lett. 108, 112003 (2012).
- Alexander et al. [2010] J. P. Alexander et al. (CLEO Collaboration), Study of decays to , , and , and search for threshold enhancements, Phys. Rev. D 82, 092002 (2010).
- Epelbaum et al. [2015] E. Epelbaum, H. Krebs, and U. Meißner, Improved chiral nucleon-nucleon potential up to next-to-next-to-next-to-leading order, Eur. Phys. J. A 51, 53 (2015).
- Note [2] Indeed, in some other processes, there have been observed (baryon-anti-baryon) threshold enhancements. However, it is not necessary to have a baryonium state there [38, 39].
- Amsler et al. [2004] C. Amsler et al., Production and decay of (958) and (1440) in annihilation at rest, Eur. Phys. J. C 33, 23 (2004).
- Bertin et al. [1996] A. Bertin et al. (OBELIX Collaboration), annihilation cross-section at very low-energy, Phys. Lett. B 369, 77 (1996).
- Ablikim et al. [2016] M. Ablikim et al. (BESIII Collaboration), Observation of an Anomalous Line Shape of the Mass Spectrum near the Mass Threshold in , Phys. Rev. Lett. 117, 042002 (2016).
- Note [3] We are aware that in some other models [40, 41, 17], they find a near-threshold pole in the partial wave.
- Sai et al. [1983] F. Sai, S. Sakamoto, and S. S. Yamamoto, Measurement of annihilation cross-sections into charged particles in the momentum Range 374 - 680 MeV/, Nucl. Phys. B 213, 371 (1983).
- Klempt et al. [2005] E. Klempt, C. Batty, and J.-M. Richard, The Antinucleon-nucleon interaction at low energy : Annihilation dynamics, Phys. Rept. 413, 197 (2005).
- Barash et al. [1967] N. Barash, L. Kirsch, D. Miller, and T. H. Tan, Annihilations of antiprotons at rest in hydrogen. VI. kaonic final states, Phys. Rev. 156, 1399 (1967).
- Dai et al. [2015] L. Y. Dai, M. Shi, G.-Y. Tang, and H. Q. Zheng, Nature of , Phys. Rev. D 92, 014020 (2015).
- Dai et al. [2017b] L.-Y. Dai, J. Haidenbauer, and U. G. Meißner, Re-examining the resonance in the reaction , Phys. Rev. D 96, 116001 (2017b).
- Haidenbauer et al. [2021] J. Haidenbauer, U.-G. Meißner, and L.-Y. Dai, Hyperon electromagnetic form factors in the timelike region, Phys. Rev. D 103, 014028 (2021).
- Dedonder et al. [2009] J. P. Dedonder, B. Loiseau, B. El-Bennich, and S. Wycech, Structure of the baryonium, Phys. Rev. C 80, 045207 (2009).
- Milstein and Salnikov [2017] A. I. Milstein and S. G. Salnikov, Interaction of real and virtual pairs in decays, Nucl. Phys. A 966, 54 (2017).