Influence of oscillatory shear on nucleation in metallic glasses: a molecular dynamics study
Abstract
The process of crystal nucleation can be accelerated or retarded by ultrasonic vibration, which is particularly attractive for the addictive manufacture and thermoplastic forming of metallic glasses, however, the effect and mechanism of oscillatory loading on the nucleation process are still elusive. Here, by using molecular dynamics simulation, the changes in the time-temperature-transformation (TTT) curve under oscillatory external loading are systematically investigated in two typical binary alloys. A glass forming ability dependent response to the external loading is found, and the shortest incubation time is insensitive to the external loading, while the corresponding temperature can be significantly shifted. Within the framework of classical nucleation theory, a fitting formula is proposed to describe the simulation data quantitatively. In contrast to stationary shear, the elastic stress, rather than the strain rate, is the key parameter to control the evolution of TTT curve under oscillatory loading. Furthermore, the model shows that oscillatory loading can decouple the mobility and nucleation in the deeply supercooled liquid, hence the deformation ability can be enhanced while the nucleation is suppressed, which is particularly helpful for the forming and manufacturing of metallic glasses.
I Introduction
Understanding solidification phenomena during which a liquid morphs either into an amorphous or crystalline state is of fundamental importance as well as practical interest for materials manufacturing in industrial applications. It would enable a better control by defining the nonequilibrium pathway that determines the microstructure, both for natural and artificial materialsSosso2016crystal ; kelton2010nucleation . For amorphous materials, avoiding nucleation during the quench is the key for improving the glass-forming ability (GFA) of the systemgreer2015new . GFA is very high for many polymers or for silicates, due to the complex frustration between intrachain and interchain interactions, or to strong covalent bonds Jakse2012 .
However, in metallic alloys, the metallic bond is less directional and weaker leading to a close-packing tendency, which makes the nucleation easier to happen during the quench. Since the seminal work of Turnbull Turnbull1949 ; turnbull1969under the link between crystal nucleation and GFA still remains an open question that triggered many theoretical and experimental works Turnbull1949 ; turnbull1969under ; Inoue2000stabilization ; PhysRevLett.91.115505 ; tang2013anomalously ; zhang2013computational ; Russo2018 ; Nie2020connecting ; Hu2020 ; PhysRevX.9.031016 . Such a relationship may find its roots at the atomic scale in terms of the variety of favoured local structures Ronceray2011 , competing short-range orders Jakse2003 ; Becker2020 ; Pedersen2021 , or interplay between chemical and fivefold symmetry orderings Jakse2008 ; Pasturel2017 ; Tang2018 . The overall objective is to find a connection between nucleation or growth parameters such as liquidus temperature, atomic size or chemical potential with the GFA of metallic glasses (MGs). In contrast, there are fewer works that focus on the effect of external loading on the GFA of metallic glassesPhysRevE.91.020301 .
Recently, new fabrication processes such as rheological processingJohnson2011 , thermoplasticADMA200902776 , and additive manufacturingSohrabi2021 were designed to improve the GFA of MGs by reheating and forming MGs in the supercooled liquid or glassy state. This immediately raises the question of the evolution of GFA with the external loading. As studied both in the simulation and experimental worksPhysRevE.87.062307 ; Richard2015 ; PhysRevE.82.021505 ; PhysRevE.93.042803 , the nucleation process can be retarded or accelerated in a sheared liquid, that is to say, the GFA could be changed in stationary shear flow. Beside the steady shear deformation, oscillatory shear as a specific deformation mode is widely used in the study of metallic glasses and supercooled liquids, such as dynamic relaxation or mechanical annealingPriezjev2018 ; PhysRevB.90.144201 ; Wang2020revealing ; PhysRevLett.122.105501 , especially the oscillatory deformation induced by ultrasonic vibration can be applied in the forming of MGsLi2014 ; Ma2019 and it can also accelerate the crystallization of MGsPhysRevLett.95.245501 . In general, oscillatory shear allows a glass to access a broader range of energies Priezjev2021 , but how the parameters of oscillatory deformation affects the nucleation process, and how the TTT curve changes under oscillatory deformation, are still open questions.
In the present paper, by using molecular dynamics simulation (MD), we investigate the homogeneous nucleation behavior of alloys under oscillatory shear conditions, with amplitude and period as varying parameters. For this purpose, two typical binary alloys, namely Ni50Al50 and Cu23Zr77, were considered as they both have a stable underlying crystalline structure, but display a significantly different GFA Jakse2015 ; tang2013anomalously . Interestingly, their crystallization times are reachable by brute force MD, giving access to a detailed description of the structure and dynamics. We find that the oscillation can significantly affect the time-temperature-transformation (TTT) curve for both alloys. More precisely, the shortest incubation time of the TTT curves is insensitive to the various external oscillatory loading conditions, while the corresponding temperature does depend on them. We further show that the nucleation process can be controlled by two loading parameters, which differ significantly from those obtained in stationary shear flow. Finally, we rationalize our results by proposing a simple phenomenological formula that describes these observations, in which the elastic stress associated with the external loading is the main parameter.
II Methods
II.1 Initial sample preparation
Molecular Dynamics simulations were performed by using the open-source software LAMMPS Thompson2022 . A number of atoms for Ni50Al50 and for Cu23Zr77 were placed randomly in a cubic simulation box subject to the standard periodic boundary conditions (PBC) in the three directions of space. Interatomic interactions were taken into account through the semi-empirical potentials based on the embedded atom model (EAM) for Ni50Al50 PurjaPun2009development as well as Cu23Zr77 Mendelev2009development . Integration of the equations of motion were solved using Verlet’s algorithm in the velocity form with a time step of fs. The thermodynamic conditions were controlled by means of the isothermal–isobaric (NPT) ensemble at ambient pressure using the Nosé-Hoover thermostat and barostat nose1984unified ; martyna1994constant .
The samples were first equilibrated at K for ns, where the temperature was far above the liquidus temperature ( ) of each system. The investigated samples were prepared by fast quenching from K to a target temperature with a fast cooling rate around K/s at constant pressure. During cooling, a configuration is taken and saved at each target temperature to further construct the TTT curves for various loading conditions along isotherms.
II.2 Oscillatory shear deformation
Subsequently, during the isothermal homogeneous nucleation, the simulation box was deformed by using a sinusoidal shear deformation along the direction. The time dependent oscillatory shear strain is , where is the amplitude and is the oscillation period. During the deformation, we solved the SLLOD equationsEdwards2006validation of motion with the Nosé-Hoover thermostat and PBC in all dimensions, keeping the volume and temperature constant (NVT ensemble).
II.3 Characterization of crystallization
We monitored the degree of crystallization at the target temperature by calculating the parameter goodrich2014solids . The crystal bond of two neighbouring atoms i and j was constructed by the scalar product
| (1) |
where is the standard bond-orientations order parameterPhysRevB.28.784 and is the corresponding complex conjugate. We defined the bond between neighbour atoms and as a crystalline bond when . Summing over all the crystal bonds of atom , the local degree of crystallinity for atom is written asAuer2004numerical ; Russo2012microscopic
| (2) |
Where is the step function and is the number of neighbours of atom . The parameter is obtained by averaging over all atoms of the simulation box. For a perfect crystal, and in a liquid state, is small and approaches zero. For all data points reported, five independent simulations were used to improve the statistics and estimate the error bars.
II.4 Dynamical modulus analysis
Dynamical modulus analysis is widely used in the deformation and relaxation mechanism of amorphous solid and supercooled liquidsPhysRevB.90.144201 ; Wang2020revealing ; PhysRevLett.122.105501 . Here, we used an oscillatory shear to obtain the dynamic modulus spectrum at a given temperature. The storage modulus and loss modulus can be obtained from the measured shear stress as
| (3) | |||
| (4) |
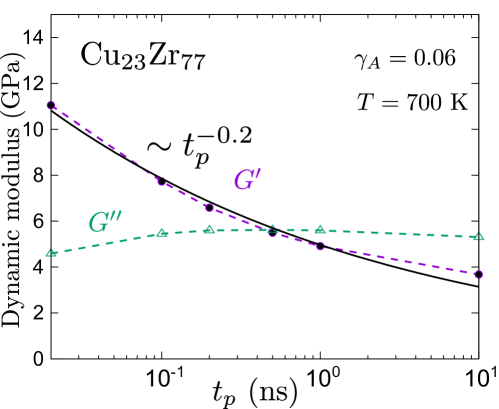
Here is the shear stress along the shear strain direction, and is the number of cycles, here . We obtained the dynamical modulus spectrum of Cu23Zr77 at 700 K with , which will be used in the following.
III Results and Discussion
III.1 Time-temperature-transformation (TTT) curve
According to classical nucleation theory (CNT), the nucleation process from a supercooled liquid can be ascribed to the competition between kinetic and thermodynamic factorsTurnbull1949 ; turnbull1969under ; cavagna2009supercool , and the incubation time can be written as:
| (5) |
where is a prefactor, is the kinetic factor which describes the difficulty for atomic attachment to the crystalline nuclei. As temperature decreases, the kinetic factor increases. is the kinetic barrier. Both and are supposed to be insensitive to temperature. is the thermodynamic factor, which describes the difficulty for generating a critical crystalline nucleus through thermal fluctuations. is is determined by the balance between the chemical potential difference and the liquid-crystal interfacial energyturnbull1969under . varies with temperature, increasing rapidly near the liquidus temperature () and then decreasing with temperature. Approaching the liquidus temperature, the thermodynamic factor is larger than the kinetic factor, and the nucleation process is dominated by the thermodynamic barrier (). As temperature decreases, the influence of the thermodynamic factor declines but the kinetic factor becomes dominant. Below a certain temperature, the kinetic factor becomes a dominant factor in the nucleation process. Therefore the nucleation time of the supercooled liquid is non-monotonically dependent on temperature, and with a transition from thermodynamically to kinetically controlled nucleation as temperature decreases. This non-monotonic behaviour is usually illustrated by the time-temperature-transformation (TTT) curve (Figure 1). At the “nose temperature” (), the incubation time () is minimum (Figure 1 (c)). It is worth noting that the value can be often taken as a quantitative measure of the GFA of the alloyJohnson2016quantifying .
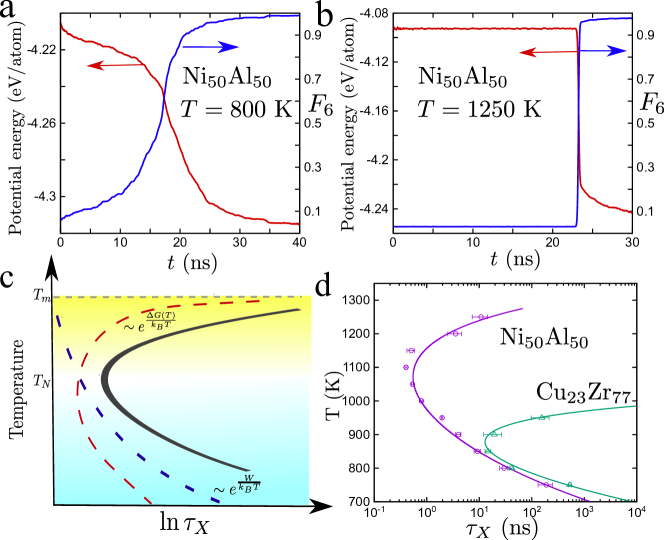
Figure 1 (a) shows a typical nucleation event in the deeply supercooled liquid regime (below the nose temperature ) for Ni50Al50. One sees that the potential energy decreases gradually as the degree of crystallization () increases. This contrasts with the slightly supercooled case (above ), shown in Figure 1 (b), where the crystalline nuclei are difficult to form. However, once an embryo attains the critical radius, the resulting nucleus grows rapidly thanks to the high atomic mobility. As a result, both the potential energy and the degree of crystallization change abruptly during the nucleation event. Figure 1 (c) schematically illustrates the contribution of the kinetic and thermodynamic factors to the TTT curve. The incubation time is defined as the time when the degree of crystallization reaches the threshold . Other thresholds were also investigated, with results qualitatively consistent with those obtained for . A more detailed discussion of the TTT curve is given in the Appendix. Figure 1 (d) shows incubation times versus temperatures in the quiescent state for the two alloys. The nose temperature of the quiescent state () is about K and K for Ni50Al50 or Cu23Zr77, respectively. For Cu23Zr77, the incubation time at the nose temperature of the quiescent state () is larger than for Ni50Al50 (more than one order of magnitude), indicating that the GFA of Cu23Zr77 is significantly higher than that of Ni50Al50 Johnson2016quantifying .
III.2 Homogeneous nucleation under oscillatory shear
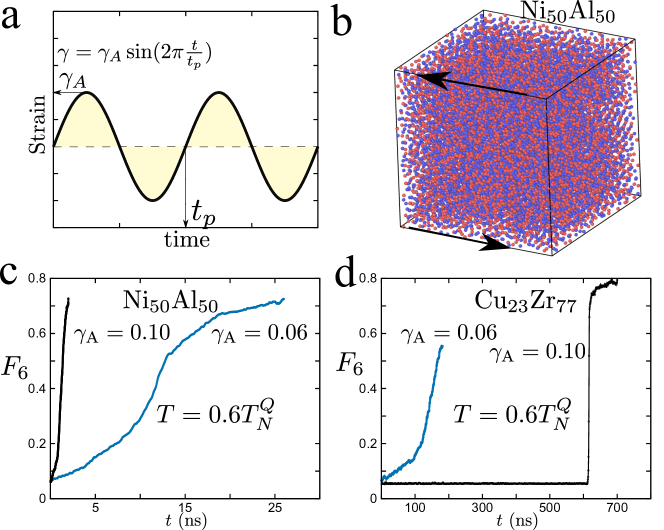
Next, we used a sinusoidal deformation to investigate the effect of external loading on the TTT curve. Figure 2 (a) illustrates of the two control parameters in the loading: the amplitude of the shear strain and its period . A snapshot of an atomic configuration showing the loading direction is displayed in Figure 2 (b). At a given temperature, which we choose first to be in the deeply supercooled regime , we impose the period ns and investigate first the effect of the loading amplitude on the nucleation process. Figure 2 (c), (d) illustrates the nucleation process under oscillatory shear with or and ns at the temperature . Interestingly, although the control parameter and relative temperatures are the same in both Ni50Al50 and Cu23Zr77, the nucleation process with different amplitude strains is still notably distinct. For Ni50Al50, both for and , the degree of crystallization increases gradually, and shows a behavior typical of the nucleation process in a deeply supercooled liquid (below ). The incubation time decreases when increasing (Figure 2 (c)). This suggests that, as increases, the kinetic factor decreases, but is still the dominant term in this region of the TTT curve in Ni50Al50. For Cu23Zr77, a completely different behavior is observed. For , the nucleation process still retains the features of the deeply supercooled liquid. For , however, the nucleation process is retarded and has a behaviour typical of nucleation from a moderately supercooled liquid (above ). This suggests a transition from kinetic control to thermodynamic control as the strain amplitude is increased at fixed temperature in Cu23Zr77.
III.3 The effect of oscillatory loading within the framework of CNT
The oscillatory shear can change both the kinetic and thermodynamic factors. Following the work of Turnbull turnbull1969under , we incorporate the effect of external loading into the CNT formula, so that the incubation time can be rewritten as
| (6) |
Where by convention s. is Boltzmann constant and is the temperature. There are four parameters in equation 6, which are independent of temperature but sensitive to external loading: the prefactor , the kinetic barrier , the liquid-crystal interfacial parameter and the liquidus temperature . Those parameters can be obtained by fitting equation 6 to the simulation results.
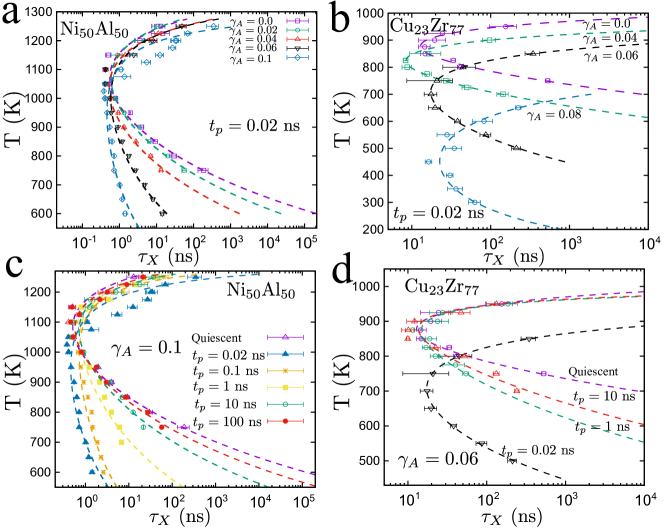
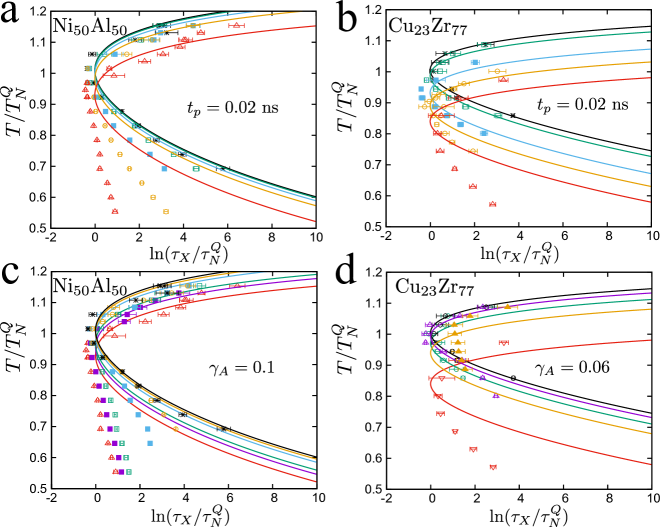
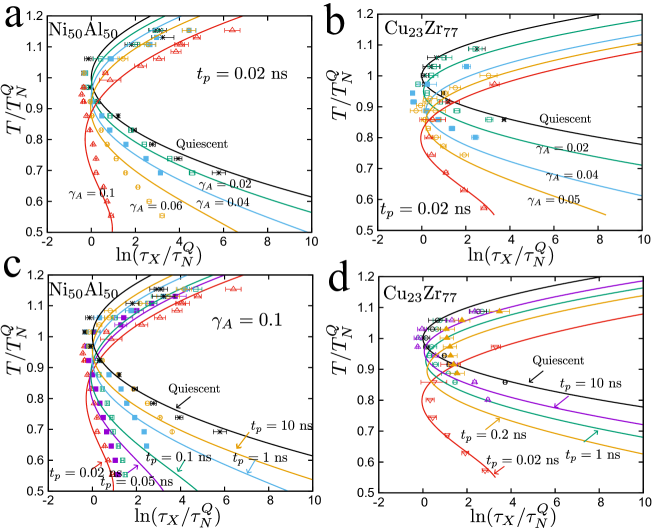
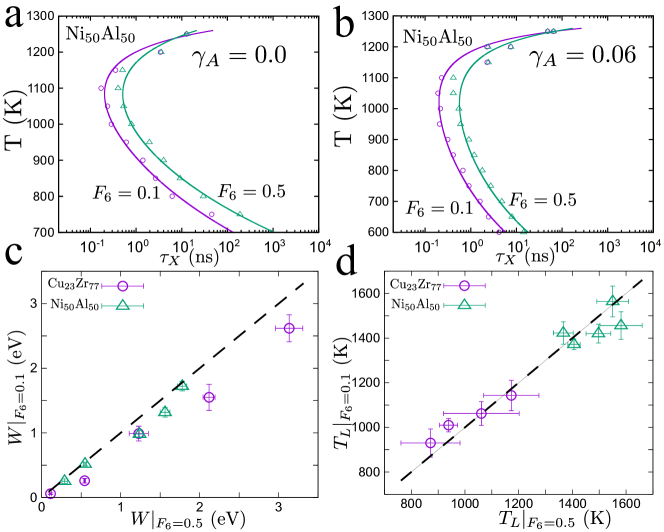
We systematically obtained the TTT curves for different strain amplitudes, keeping the period fixed at ns on the one hand, and for different periods, with a strain amplitude or , on the other hand. Figure 3 shows the corresponding results both in Ni50Al50 (panel (a),(c)) and Cu23Zr77 (panel (b),(d)). The simulation data can be well fitted by equation 6, and the TTT curve is shown as a dashed line. The corresponding parameters are shown in figure 4.

For Ni50Al50, the nucleation process is quite fast, and the shortest incubation time is less than 1 ns. Both the nose temperature and the corresponding incubation time are insensitive to the strain amplitude and period (Figure 4 (a),(b)). Furthermore, above , the nucleation process is slightly retarded, and below , the nucleation process is significantly accelerated (Figure 3 (a),(c)). The main effects of the external oscillatory loading, obtained either by increasing or by decreasing , are that (i) the kinetic factor is significantly decreased (Figure 4), and (ii) the thermodynamic factor is slightly enhanced.
In contrast, for Cu23Zr77, the nucleation process is relatively slow, and is larger than 10 ns. For a fast period ns, Figure 3 (b) and Figure 4 (b) shows that is almost insensitive to the external loading, but the nose temperature decreases when increases (figure 4 (a)). The shift of the nose temperature of the TTT curve when increasing in Cu23Zr77 is consistent with the observation of the transition from kinetic control to thermodynamic control in Figure 2 (d). This suggests that the thermodynamic factor is significantly increased by the external loading, and the balance between the kinetic and thermodynamic factors shifts to a lower temperature. In contrast, for a slow oscillation period ( ns and ns in Figure 3 (d)), the effect of external loading is similar to the case of Ni50Al50 system in Figure 3 (c).
Hence the shift in the nose temperature behavior in Cu23Zr77 is dependent on the competition between the external period and the nose incubation time . For a slow period, when the ratio is approaching the situation of Ni50Al50, the nose temperature is insensitive to the amplitude of the strain. For faster oscillations, the ratio is large, and the thermodynamic factor will be increased notably by the strain, so that the nose temperature will be shifted to a lower temperature (Figure 4 (a)).
III.4 Shear melting and effective temperature model
Generally, the liquidus temperature can be changed by an external loading, as has been observed and well studied in the stationary shear flow situationbutler2002factors . We also observed a shear melting phenomenon in the oscillatory shear deformation, as seen in figure 4 (f), which shows that the liquidus temperature decreases as increases. The solid line shows a relation , and indicates that the shear melting is induced by an additional elastic work associated with the external loading. However, the shear melting effect in the case of oscillatory shear is distinct from the case of stationary shear flow.
For stationary shear flow, the strain rate is the only external loading parameter, in contrast, there are two parameters in the oscillatory shear: the amplitude and the period . For stationary shear flow, both the thermodynamic and kinetic factors can be modified by a function of strain rate PhysRevE.87.062307 ; PhysRevE.99.062801 ; PhysRevE.93.042803 . However, for oscillatory shear, the simple combination of these two parameters can not be simply combined into a strain rate does not describe the changes induced in the nucleation process. For instance, the TTT curve with and ns in Ni50Al50 is quantitatively similar to the situation with and ns (see Figure 3(a), (c)). However, the shear rate of the previous situation is times larger than the latter one. This means that the shear rate is not an appropriate quantity for the nucleation process under oscillatory shear.
For oscillatory shear, we argue that the elastic stress, rather than shear rate, is the key parameter in crystal nucleation and shear melting. As is well known, the viscoelastic response of glasses is strongly frequency dependent. In the frequency range covered by our simulations, the storage modulus for our systems behaves typically as an inverse power of frequency, , with an exponent , which is far less than one (Figure 5), hence the elastic stress can be written as . As a result, the shear melting can be seen as a stress modified result, to second order in the maximum elastic stress ().
Following this idea, it is tempting to introduce an effective temperature to represent the external perturbation on the shear melting, where is a material parameter. We also note that the GFA of alloys measured by at the nose is insensitive to the perturbation at first order (figure 4(b)). It implies that the derivative of with respect to the external perturbation vanishes at the nose. This observation can be rationalized by assuming that, in a first approximation, the perturbation is described by the effective temperature and that the nucleation time is given by where is obtained under quiescent conditions. With this assumption, taking the derivative w.r.t. the perturbation (e.g. ) involves, according to the chain rule, a derivative w.r.t. temperature, which by construction vanishes at . As a result, to first order, the nose temperature will be shifted, but the value of the nucleation time will be stationary. This effective temperature model can be written as:
| (7) |
Where is an adimensional effective temperature, and , , are the fitting parameters of quiescent states by equation 6. For Ni50Al50, , , and for Cu23Zr77 system, , , . The parameter for Ni50Al50 system is fitted by the simulation result of and ns, and for Cu23Zr77 system is fitted by the data of and ns. Interestingly, we take the material parameter into liquidus temperature , where is the liquidus temperature at the quiescent state, the predicted curve matches pretty well with simulation results (see Figure 4 (f)), it proves that the shear melting can be well depicted by the effective temperature model. Figure 6 shows the comparison between the TTT curve predicted by equation 7 and that of the simulation data. The effective temperature model can depict the influence of amplitude and period on the TTT curve in the vicinity of the nose temperature, but it overestimates at low temperature (Figure 6). This implies that the effective temperature model does not represent the kinetic factor well, as the latter shows a linear dependence on the strain amplitude (Figure 4 (c)).
III.5 Phenomenological nucleation model for oscillatory shear
Based on the above numerical observations, we provide a simple fitting formula to describe the effect of oscillatory loading on the TTT curve. We focus on the TTT curve near the nose temperature of the quiescent state and the following parameters K, ns for Ni50Al50 and K, ns for Cu23Zr77. In the vicinity of the nose, the TTT curve of the quiescent state takes the form:
| (8) |
Where is the incubation time in the quiescent state at the nose temperature. is a material parameter which can be well fitted using the numerical results in the quiescent state (Figure 1 d), for Ni50Al50 and for Cu23Zr77.
When the oscillatory shear is applied during the nucleation, the TTT curve will be modified. As discussed above, we found that the relevant parameter is , with . Generally, the incubation time is controlled by three factors: the prefactor, kinetic and thermodynamic factors. The shortest incubation time results from the balance between these three factors. Our analysis shows that the kinetic factor, , decreases linearly with the strain amplitude (Figure 4 (c)). . Furthermore, there is a good correlation between the prefactor and the kinetic factor at nose temperature ( see Figure 4 (d)) , implying that the change in the prefactor is also proportional to . The thermodynamic factor, it controlled by the liquid-crystal interface parameter and liquidus temperature (see equation 6). Both and display a quadratic dependence on the strain amplitude (Figure 4), so that at first order, We can take the change thermodynamic barrier as . Therefore, the incubation time under oscillatory shear can be written as:
| (9) |
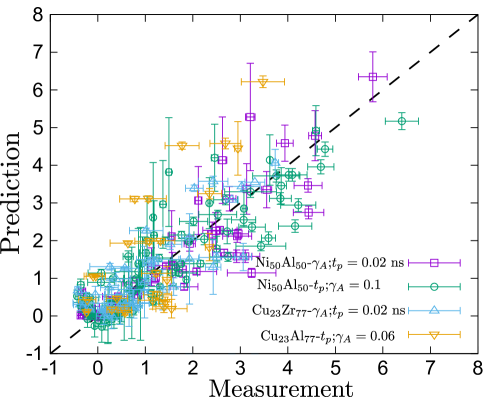
Where , are material parameters. We fitted and from the numerical results of , ns for Ni50Al50 (, ) and , ns for Cu23Zr77 (, ). Interestingly, this simple formula agrees quantitatively well with the simulation data of various strain amplitudes and periods (Figure 7). The correlation between the r.h.s and l.h.s of equation 9 is shown in Figure 8.
An interesting observation of equation 9 is that the oscillatory deformation induces a linear decrease of the kinetic factor, and increases the thermodynamic factor quadratically as a function of the stress. For , the decrease of the kinetic factor is faster than the increase of the thermodynamic factor, and the nucleation will be accelerated by the atomic mobility, in contrast, for , the thermodynamic factor increases more rapidly than the kinetic factor decreases. Therefore one can on the one hand improve the atomic mobility of the alloy, and on the other hand, the nucleation can be significantly retarded. This is important and attractive for the fabrication of metallic glasses and control the nucleation process of the alloy, one can use ultrasonic vibration to enhance mobility meanwhile avoiding crystallization during forging or cold joining of metallic glassesLi2014 ; Ma2019 .
IV Conclusion
In conclusion, we find the TTT curve under oscillatory shear can be adjusted by tuning the amplitude of the strain and its frequency. We provide an empirical model to describe the dependence of the TTT curve on the loading, which can quantitatively well represent the numerical data. This formula is interpreted by introducing the elastic stress associated with the loading, which appears to be the essential parameter that will influence the nucleation time. Our study shows that, using oscillatory loading, the mobility and nucleation of alloys can be decoupled in the deeply supercooled liquid state, therefore the formation ability can be enhanced and nucleation can be retarded. This is particularly attractive and useful for the manufacturing and processing of metallic glasses.
V Acknowledgements
This work is supported by Guangdong Major Project of Basic and Applied Basic Research, China (Grant No.2019B030302010), Guangdong Basic and Applied Basic Research, China (Grant No.2021B1515140005, 2022A1515010347), the NSF of China (Grant Nos.52130108, Nos.U1930402), B.S.S acknowledges the computational support from the Platform for Data-Driven Computational Materials Discovery of Songshan Lake Materials Laboratory.
References
- [1] Gabriele C. Sosso, Ji Chen, Stephen J. Cox, Martin Fitzner, Philipp Pedevilla, Andrea Zen, and Angelos Michaelides. Crystal nucleation in liquids: Open questions and future challenges in molecular dynamics simulations. Chemical Reviews, 116(12):7078–7116, May 2016.
- [2] Kenneth F Kelton and Alan Lindsay Greer. Nucleation in condensed matter: applications in materials and biology. Elsevier, 2010.
- [3] A. Lindsay Greer. New horizons for glass formation and stability. Nat Mater, 14(6):542–546, Jun 2015. Commentary.
- [4] N. Jakse, M. Bouhadja, J. Kozaily, J. W E Drewitt, L. Hennet, D. R. Neuville, H. E. Fischer, V. Cristiglio, and A. Pasturel. Interplay between non-bridging oxygen, triclusters, and fivefold al coordination in low silica content calcium aluminosilicate melts. Applied Physics Letters, 101:1–5, 2012.
- [5] D. Turnbull and J. C. Fisher. Rate of nucleation in condensed systems. The Journal of Chemical Physics, 17(1):71–73, January 1949.
- [6] David Turnbull. Under what conditions can a glass be formed? Contemporary physics, 10(5):473–488, 1969.
- [7] Akihisa Inoue. Stabilization of metallic supercooled liquid and bulk amorphous alloys. Acta Materialia, 48(1):279–306, January 2000.
- [8] Z. P. Lu and C. T. Liu. Glass formation criterion for various glass-forming systems. Phys. Rev. Lett., 91:115505, Sep 2003.
- [9] Chunguang Tang and Peter Harrowell. Anomalously slow crystal growth of the glass-forming alloy cuzr. Nature materials, 12(6):507–511, 2013.
- [10] Kai Zhang, Minglei Wang, Stefanos Papanikolaou, Yanhui Liu, Jan Schroers, Mark D Shattuck, and Corey S O’Hern. Computational studies of the glass-forming ability of model bulk metallic glasses. The Journal of chemical physics, 139(12):124503, 2013.
- [11] John Russo, Flavio Romano, and Hajime Tanaka. Glass forming ability in systems with competing orderings. Phys. Rev. X, 8:021040, May 2018.
- [12] Yunhuan Nie, Jun Liu, Jialing Guo, and Ning Xu. Connecting glass-forming ability of binary mixtures of soft particles to equilibrium melting temperatures. Nature Communications, 11(1), June 2020.
- [13] Yuan-Chao Hu and Hajime Tanaka. Physical origin of glass formation from multicomponent systems. Science Advances, 6(50), December 2020.
- [14] Trond S. Ingebrigtsen, Jeppe C. Dyre, Thomas B. Schrøder, and C. Patrick Royall. Crystallization instability in glass-forming mixtures. Phys. Rev. X, 9:031016, Aug 2019.
- [15] P. Ronceray and P. Harrowell. The variety of ordering transitions in liquids characterized by a locally favoured structure. Epl, 96, 2011.
- [16] Noël Jakse and Alain Pasturel. Local order of liquid and supercooled zirconium by ab initio molecular dynamics. Physical Review Letters, 91:1–4, 2003.
- [17] S. Becker, E. Devijver, R. Molinier, and N. Jakse. Glass-forming ability of elemental zirconium. Physical Review B, 102, 2020.
- [18] Ulf R. Pedersen, Ian Douglass, and Peter Harrowell. How a supercooled liquid borrows structure from the crystal. Journal of Chemical Physics, 154, 2021.
- [19] N. Jakse and A. Pasturel. Glass forming ability and short-range order in a binary bulk metallic glass by ab initio molecular dynamics. Applied Physics Letters, 93:11–13, 2008.
- [20] Alain Pasturel and Noel Jakse. Atomic-scale structural signature of dynamic heterogeneities in metallic liquids. npj Computational Materials, 3:33, 2017.
- [21] Chunguang Tang and Peter Harrowell. Composition susceptibility and the role of one, two, and three-body interactions in glass forming alloys: Cu50zr50 vs ni50al50. Journal of Chemical Physics, 148, 2018.
- [22] Zhen Shao, Jonathan P. Singer, Yanhui Liu, Ze Liu, Huiping Li, Manesh Gopinadhan, Corey S. O’Hern, Jan Schroers, and Chinedum O. Osuji. Shear-accelerated crystallization in a supercooled atomic liquid. Phys. Rev. E, 91:020301, Feb 2015.
- [23] William L. Johnson, Georg Kaltenboeck, Marios D. Demetriou, Joseph P. Schramm, Xiao Liu, Konrad Samwer, C. Paul Kim, and Douglas C. Hofmann. Beating crystallization in glass-forming metals by millisecond heating and processing. Science, 332(6031):828–833, May 2011.
- [24] Jan Schroers. Processing of bulk metallic glass. Advanced Materials, 22(14):1566–1597, 2010.
- [25] Navid Sohrabi, Jamasp Jhabvala, and Roland E. Logé. Additive manufacturing of bulk metallic glasses—process, challenges and properties: A review. Metals, 11(8):1279, August 2021.
- [26] Anatolii V. Mokshin, Bulat N. Galimzyanov, and Jean-Louis Barrat. Extension of classical nucleation theory for uniformly sheared systems. Phys. Rev. E, 87:062307, Jun 2013.
- [27] David Richard and Thomas Speck. The role of shear in crystallization kinetics: From suppression to enhancement. Scientific Reports, 5(1), September 2015.
- [28] Anatolii V. Mokshin and Jean-Louis Barrat. Crystal nucleation and cluster-growth kinetics in a model glass under shear. Phys. Rev. E, 82:021505, Aug 2010.
- [29] Federica Mura and Alessio Zaccone. Effects of shear flow on phase nucleation and crystallization. Phys. Rev. E, 93:042803, Apr 2016.
- [30] Nikolai V. Priezjev. Molecular dynamics simulations of the mechanical annealing process in metallic glasses: Effects of strain amplitude and temperature. Journal of Non-Crystalline Solids, 479:42–48, January 2018.
- [31] Hai-Bin Yu and Konrad Samwer. Atomic mechanism of internal friction in a model metallic glass. Phys. Rev. B, 90:144201, Oct 2014.
- [32] B. Wang, L.J. Wang, B.S. Shang, X.Q. Gao, Y. Yang, H.Y. Bai, M.X. Pan, W.H. Wang, and P.F. Guan. Revealing the ultra-low-temperature relaxation peak in a model metallic glass. Acta Materialia, 195:611–620, August 2020.
- [33] Baoshuang Shang, Jörg Rottler, Pengfei Guan, and Jean-Louis Barrat. Local versus global stretched mechanical response in a supercooled liquid near the glass transition. Phys. Rev. Lett., 122:105501, Mar 2019.
- [34] Ning Li, Xiaona Xu, Zhizhen Zheng, and Lin Liu. Enhanced formability of a zr-based bulk metallic glass in a supercooled liquid state by vibrational loading. Acta Materialia, 65:400–411, February 2014.
- [35] Jiang Ma, Can Yang, Xiaodi Liu, Baoshuang Shang, Quanfeng He, Fucheng Li, Tianyu Wang, Dan Wei, Xiong Liang, Xiaoyu Wu, Yunjiang Wang, Feng Gong, Pengfei Guan, Weihua Wang, and Yong Yang. Fast surface dynamics enabled cold joining of metallic glasses. Science Advances, 5(11), November 2019.
- [36] T. Ichitsubo, E. Matsubara, T. Yamamoto, H. S. Chen, N. Nishiyama, J. Saida, and K. Anazawa. Microstructure of fragile metallic glasses inferred from ultrasound-accelerated crystallization in pd-based metallic glasses. Phys. Rev. Lett., 95:245501, Dec 2005.
- [37] Nikolai V. Priezjev. Accessing a broader range of energy states in metallic glasses by variable-amplitude oscillatory shear. JOURNAL OF NON-CRYSTALLINE SOLIDS, 560, MAY 15 2021.
- [38] N. Jakse and A. Pasturel. Correlation between dynamic slowing down and local icosahedral ordering in undercooled liquid al80ni20 alloy. The Journal of Chemical Physics, 143:084508, 2015.
- [39] Aidan P. Thompson, H. Metin Aktulga, Richard Berger, Dan S. Bolintineanu, W. Michael Brown, Paul S. Crozier, Pieter J. in ’t Veld, Axel Kohlmeyer, Stan G. Moore, Trung Dac Nguyen, Ray Shan, Mark J. Stevens, Julien Tranchida, Christian Trott, and Steven J. Plimpton. Lammps - a flexible simulation tool for particle-based materials modeling at the atomic, meso, and continuum scales. Computer Physics Communications, 271, 2 2022.
- [40] G.P. Purja Pun and Y. Mishin. Development of an interatomic potential for the ni-al system. Philosophical Magazine, 89(34-36):3245–3267, December 2009.
- [41] M.I. Mendelev, M.J. Kramer, R.T. Ott, D.J. Sordelet, D. Yagodin, and P. Popel. Development of suitable interatomic potentials for simulation of liquid and amorphous cu–zr alloys. Philosophical Magazine, 89(11):967–987, April 2009.
- [42] Shuichi Nosé. A unified formulation of the constant temperature molecular dynamics methods. The Journal of Chemical Physics, 81:511, 1984.
- [43] Glenn J Martyna, Douglas J Tobias, and Michael L Klein. Constant pressure molecular dynamics algorithms. The Journal of chemical physics, 101(5):4177–4189, 1994.
- [44] B. J. Edwards, C. Baig, and D. J. Keffer. A validation of the p-SLLOD equations of motion for homogeneous steady-state flows. The Journal of Chemical Physics, 124(19):194104, May 2006.
- [45] Carl P Goodrich, Andrea J Liu, and Sidney R Nagel. Solids between the mechanical extremes of order and disorder. Nature Physics, 10(8):578–581, 2014.
- [46] Paul J. Steinhardt, David R. Nelson, and Marco Ronchetti. Bond-orientational order in liquids and glasses. Phys. Rev. B, 28:784–805, Jul 1983.
- [47] S. Auer and D. Frenkel. Numerical prediction of absolute crystallization rates in hard-sphere colloids. The Journal of Chemical Physics, 120(6):3015–3029, February 2004.
- [48] John Russo and Hajime Tanaka. The microscopic pathway to crystallization in supercooled liquids. Scientific Reports, 2(1), July 2012.
- [49] Andrea Cavagna. Supercooled liquids for pedestrians. Physics Reports, 476(4–6):51 – 124, 2009.
- [50] W. L. Johnson, J. H. Na, and M. D. Demetriou. Quantifying the origin of metallic glass formation. Nature Communications, 7(1), January 2016.
- [51] Scott Butler and Peter Harrowell. Factors determining crystal–liquid coexistence under shear. Nature, 415(6875):1008–1011, 2002.
- [52] David Richard and Thomas Speck. Classical nucleation theory for the crystallization kinetics in sheared liquids. Phys. Rev. E, 99:062801, Jun 2019.
Appendix
A1 Effect of simulation parameters on the nucleation process
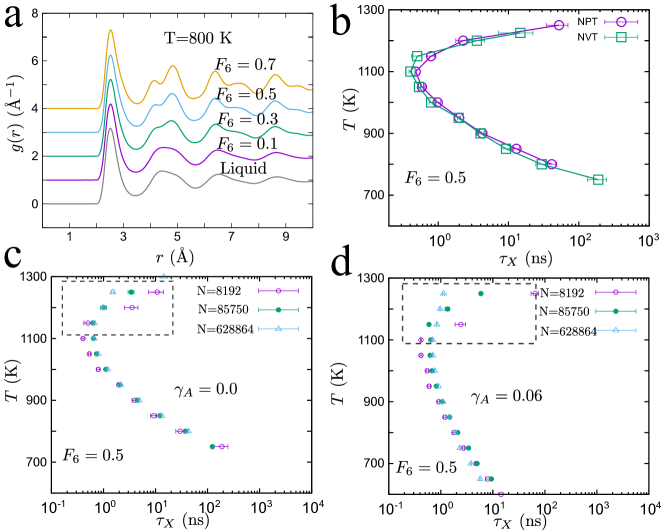
We investigated the role of control parameters such as the NPT ensemble, and system size during the nucleation process. Figure A1(a) shows the pair distribution function varies with at K, as the degree of crystallization increases, the alloy is transforming from liquid state to crystal state. For the sample quenching from high temperature with the NPT ensemble, the TTT curves with the NPT or the NVT ensemble are equivalent during the nucleation process (Figure A1 (b)). Figures A1 (c) and (d) show that the TTT curves with loading and quiescent condition reveal similar finite-size effects. Above , the incubation time is notably reduced as the system size increases (the dashed rectangular region), in contrast, below , is intensive with the system size. The nucleus formation is spatially localized, and the nucleation rate is intensive to system size, however, as the system size increases, the probability that the embryo reaches the critical size is increasing, and above , the nucleus will grow rapidly, hence the incubation time will dependent on the system size. In contrast, below , the nucleus grows sluggishly, and the incubation time is insensitive to the system size.
A2 Effect of threshold for the incubation time.
We investigated the sensitivity of the TTT curves on the threshold of the incubation time . Figure A2 (a) and (b) show the TTT curve evolves with the degree of crystallization at and , respectively. The nose temperature is insensitive to the threshold, in contrast, the incubation time at is retarded as the degree of crystallization increases. Above , the TTT curve is insensitive to and below the TTT curve will be retarded with increasing , it indicates the threshold of incubation time mainly impacts the kinetic term of the nucleation process, with more minor influences on the thermodynamic term. Figure A2 (c) shows the correlation between the kinetic barrier of various thresholds, there is slightly deviated from the equivalent line, and the kinetic barrier with is larger than , this is consistent with the retardation of nucleation below . Figure A2 (d) shows the correlation between the temperature of various thresholds, is not changed with threshold and it supports that the thermodynamic term is insensitive to the threshold of incubation time.