Telluric absorption lines in the ALMA spectra of Car
Abstract
The massive binary system formed by Car and an unknown companion is a strong source at millimetre and submillimetre wavelengths. Close to the stars, continuum bremsstrahlung and radio recombination lines originate in the massive ionized wind of Car and in several compact sources of high density plasma. Molecular lines are also detected at these wavelengths, some of them are seen in absorption towards the continuum emission region, many of them revealed by ALMA observations. However, because the ALMA atmospheric calibration is performed in a low spectral resolution mode, telluric lines can still be present in some high-resolution spectra of scientific products, which could lead to a false identification of molecules. In this work, we explore three different sets of ALMA archive data of Car, including high resolution () observations recently published by our group, to verify which of these absorption lines are real and discuss their origin. We conclude that some of them truly originate in clouds close to the binary system, while others are artifacts of a faulty elimination of telluric lines during ALMA calibration procedure. We found that these absorption lines are not present in the phase calibrators because they are much weaker than Car, where the absorption line appears because the high intensity continuum enhances the small individual systematic calibration errors.
keywords:
circumstellar matter: masers – stars: individual (Eta Carinae) – stars: mass loss – stars: winds, outflows – Astronomical instrumentation, methods and techniques: atmospheric effects1 Introduction
Carinae (hereafter Car) is one of the most massive and luminous stars of our galaxy ( , ). It is part of a binary system in a highly eccentric orbit; the companion star is not directly observed, but its existence was first reported by Damineli (1996) from the detection of a 5.54 y periodicity in the light curve of the high excitation line He i 10830. The periodicity was also found at at other frequencies, from radio to X and -rays (Damineli et al., 2000; Duncan & White, 2003; Whitelock et al., 2004; Abraham et al., 2005; Mehner et al., 2010; Reitberger et al., 2015; Teodoro et al., 2016; Corcoran et al., 2017). The high energy X-ray emission that varies with orbital phase reveals the existence of a shocked region formed by wind-wind collision (Corcoran et al., 2001).
Although it is not possible to observe the stars directly because they are embedded in the dusty reflection nebula, the Homunculus, formed by matter ejected in the 19th century "Great Eruption", their main stellar parameters are reasonably well established. The bolometric luminosity of Car, L⊙, was inferred from the infrared emission of the Homunculus nebula, assuming a distance of 2.3 kpc (Davidson & Humphreys, 1997). Using this bolometric luminosity, a lower limit of 120 M⊙ was derived for its mass from the Eddington limit, and an effective temperature K, mass loss rate and terminal wind velocity km s-1 was obtained from NLTE models of its spectra (Hillier et al., 2001, 2006; Groh et al., 2012).
The surface temperature of the companion star, K (Verner, Bruhweiler & Gull, 2005; Mehner et al., 2010), was inferred from the intensity of the high excitation lines observed in the spectra of the Weigelt blobs (Weigelt & Ebersberger, 1986), located at e distance of from the binary system, which cannot be excited by Car itself, because all the ionizing photons are absorbed by its own massive wind (Abraham et al., 2020). The mass of the companion star must be in the range of M⊙, depending on its evolutionary state: main sequence, supergiant or Wolf-Rayet. A mass loss rate of M⊙ y-1 and wind velocity km s-1 were derived fitting hydrodynamical models to a X-ray grating spectrum (Pittard & Corcoran, 2002).
Close to the binary system, dust can be formed in the wind-wind collision region (Falceta-Gonçalves, Jatenco-Pereira & Abraham, 2005). Numerical simulations show the formation of a complex and dense structure that evolves and persists during several orbital periods (Parkin, et al., 2011; Madura et al., 2012, 2013; Clementel et al., 2014; Russell et al., 2016). While Russel et al. (1987), Smith et al. (1995) and Morris et al. (2017) reported decrease in the dust emission of the Homunculus Nebula, Mehner et al. (2019) showed that its brightness remained constant since 1968, with fluctuations of about 25%. The study of Mehner et al. (2019) included mid-IR observations ( of the Homunculus with high spatial resolution () that confirmed the existence of a diameter dusty torus and also revealed the existence of a smaller inner circumstellar disk of dust.
The binary system has a rich molecular environment, with many molecules already revealed by ALMA observations, including several transitions of the CO molecule, HCN, H13CN and HCO+. Since many molecules were detected at different wavelengths, it was not surprising that we started to see molecular absorption at ALMA frequencies (Smith, Ginsburg & Bally, 2018; Bordiu & Rizzo, 2019; Morris et al., 2020). However, a recent ALMA report, (Hunter et al., 2018) showed that sometimes telluric lines are not entirely removed from the final spectrum, appearing as absorption features. Therefore, some additional analysis is required to recognize if an absorption feature is intrinsic to the source and not an artificial feature due to a calibration problem.
Hunter et al. (2018) explained that telluric lines like ozone could still be present as a feature in the science spectrum due to an unperfect correction of the line emission during the atmospheric calibration. Since the atmospheric calibration is performed in a low-resolution spectral mode using 128 channels of 15.625 MHz, the core emission of a few atmospheric lines is eventually not resolved. Most of those lines come from ozone, but other telluric lines could also be present, like CH2Cl2. A complete list of atmospheric lines in the sub-mm range can be found in Smette et al. (2015). The lines appear when the scientific goal uses a spectral resolution higher than that used for the atmospheric calibration. It should not be a problem if the bandpass calibrator is close in elevation to the science target, because any remaining telluric line would be corrected by the bandpass calibration. However, if the target source is bright, even a minor elevation difference between the calibrator and the science target observation could be enough to show a remaining absorption line. We do not expect such conditions to happen often, but unfortunately, we will show that the above criteria are satisfied in some of the Car data.
In the paper, we revisit some of the recent absorption lines detected by ALMA in Car to check which are real and which are due to an imperfect atmospheric calibration. We included in our investigation our recent ALMA data directed to the detection of H and He recombination lines published in Abraham et al. (2020), where we also detected absorption features. None of those absorption features were discussed before, and they are not related to our conclusions based on the recombination line emission.
In Section 2 of this paper we describe the observations we have explored; in Section 3 we present the data; in Section 4 we analyze and discuss the results and, in Section 5 we present the conclusions of the study.
The coordinates of Car were obtained from the ICRS catalog: 10:45:3.5362, :41:4.0534; its distance is assumed to be 2300 pc (Davidson et al., 1997), so that 0.1 arcsec corresponds to 224 AU.
2 Observations
We have analyzed three different sets of ALMA observations of Car. We included the data of our recent study (Abraham et al., 2020), focusing on the detection of the 230 GHz continuum and the H30 recombination line (project 2017.1.00725.S), because the spectral window used to measure the recombination line has a bandwidth large enough to include the absorption features at the frequency of 231.28 GHz reported by Morris et al. (2020). Our observations include 4 spectral windows, one of them with high-frequency resolution (948 kHz channel spacing), centered at 231.9 GHz with a bandwidth of 1.875 GHz. The other low resolution spectral windows were centered at 230.519, 218.018, and 215.518 GHz , with similar bandwidth and channel spacing around 15 MHz, and were used to image the continuum emission. The bandpass and phase calibrators were J0904-5735 and J1032-5917, respectively.
We re-analyzed our data of Car and of the phase calibrator at frequencies close to the frequency of the absorption line, to avoid the H30 strong emission. We used the CASA Hogbom algorithm to clean a data cube with the highest possible velocity resolution, taking 350 channels around the 321.28 GHz absorption line. We used Briggs weighting with the robust parameter set to 0.5.
We also re-analyzed the data in project 2013.1.00661.S extracted from the ALMA public archive, focused on the presence of the absorption lines centered at 231.28 GHz and close to the frequency of the CO (2-1) transition. The observations were obtained on 2015 April with resolution (), using four spectral windows, all of them with the same spectral resolution (channel width of 488.281 kHz). They were centered at 230.566, 232.521, 218.520, and 216.645 GHz, with a total bandwidth of 1.875 GHz. Bandpass and phase calibrator sources were J1107-4449 and J1047-6217, respectively. As we did with the previous data-set, we used the Hogbom algorithm of CASA to clean the data-cube. We obtained a cube with 1.26 km s-1 velocity resolution, with a cell size of 50 mas and pixels around the phase centre. We set Briggs weighting with a robust parameter of 0.5.
Finally, we re-analysed the data of project 2016.1.00585.S, extracted also from the ALMA public archive. These observations were performed on 2016 October, using 4 different spectral windows, all of them with a bandwidth of 937.5 MHz, one with a channel width of 244 kHz, and the others with channel widths of 488 kHz. The higher frequency resolution spectral window was centered at 345.816 GHz, while the others were centered at 345.361, 354.858, and 356.756 GHz. The bandpass and phase calibrator sources were J0538-4405 and J1047-6217, respectively. The final data cubes were obtained using the Hogbom algorithm of CASA, once again using Briggs weighting with the robust parameter set to 0.5. We used a pixel size of 20 mas in an image of pixels, which allows us to investigate the region centered on Car.
3 Results
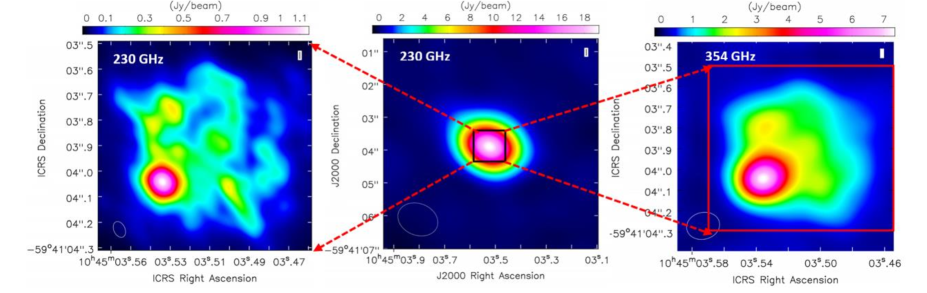
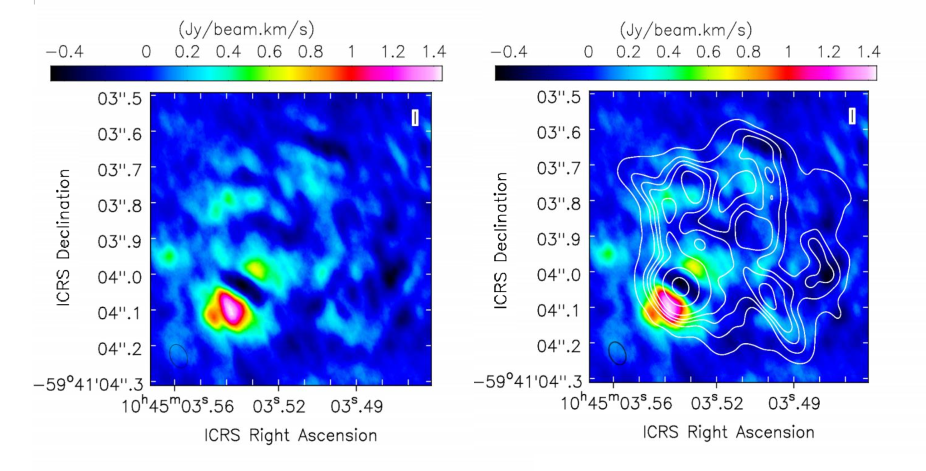
Figure 1 shows the continuum images of the three sets of observations discussed in this paper. The left panel image, at the frequency of 230 GHz, with resolution (), was obtained on 2017 November and was already presented by Abraham et al. (2020); the central panel image, at the same frequency but with lower resolution (), corresponds to ALMA observations obtained in 2015 April, as part of CO (2-1) observations (Smith et al. 2018). The right panel image, with resolution () and frequency 354 GHz, obtained on 2016 October, was discussed by Bordiu & Rizzo (2019). These images are crucial for the understanding of the absorption features that are discussed in the remaining of this paper. The flux densities at 230 GHz, integrated over all the emission regions, are Jy and Jy on 2015 April and 2017 November, respectively, and Jy at 354 GHz, on 2016 October. At the higher resolutions, it is possible to separate the compact source, coincident with the position of Car, from the extended emission NW of the binary source, coincident with the Weigelt Complex.
3.1 Absorption line at 231.28 GHz
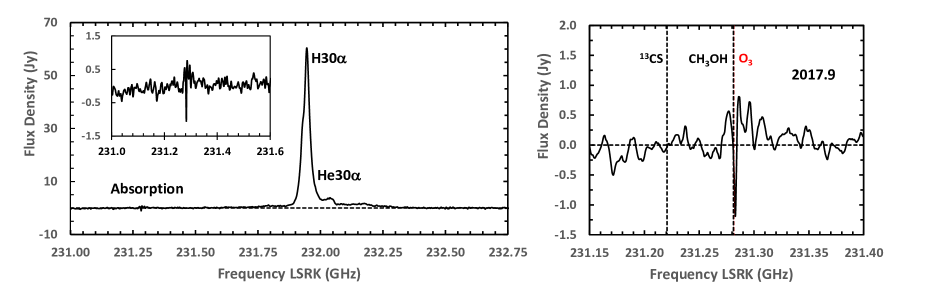
Figure 2 (left panel) presents the spectrum of Car with 1.26 km s-1 velocity resolution, obtained with ALMA on 2017 November, with () spatial resolution , integrated over the whole continuum emitting region shown in the left panel of Fig. 1. It shows the strong H30 and He30 recombination lines in emission and a weak absorption line at the frequency of 231.28 GHz, displayed on an enlarged flux density scale in the insert at the top left corner of the panel. The recombination lines were already discussed by Abraham et al. (2020): the H30 line was resolved in at least 16 compact components, with velocities ranging from to km s-1; they are located in a region NW of Car, known as the Weigelt Complex. Those are bright emission lines with no coincidence with any telluric line emission.
The right panel of Figure 2, shows the expanded spectrum of the 231.28 GHz absorption line integrated over the continuum emitting region. Morris et al. (2020) identified this absorption line, also present in observations of the CO disrupted torus surrounding Car (Smith et al. 2018), as the methanol transition H3COH (, with LSR velocity close to zero, although the 13CS (5-4) transition was also mentioned as a possible identification, in which case, the velocity of the absorbing cloud would be about -80 km s-1, while the velocity of Car in this reference frame is -19.7 km s-1. The vertical lines in the figure show the rest frequencies of the 13CS (5-4), H3COH ( and telluric O3 transitions.
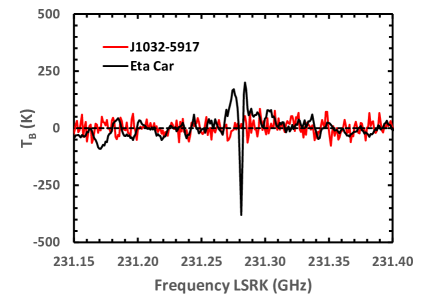
To check if the absorption line is the result of a faulty calibration, we analysed the phase calibrator J1032-5917, which is close to Car in the sky and obtained its continuum and spectral images. J1032-5917 and Car were observed almost simultaneously and used the same bandpass calibrator. As expected, the continuum image of J1032-5917 is not resolved; its flux density is Jy. The spectrum, together with that of Car is shown in Figure 3; both spectra were integrated over the same continuum emitting region shown in the left panel of Fig. 1; the vertical axis is now the brightness temperature , defined as:
| (1) |
where is the flux density in Jy beam-1, the frequency in GHz, and the major and minor axis of the elliptical beam in arcsec. We can see that although the noise levels in both spectra are similar, the absorption line is not present in the calibrator source.
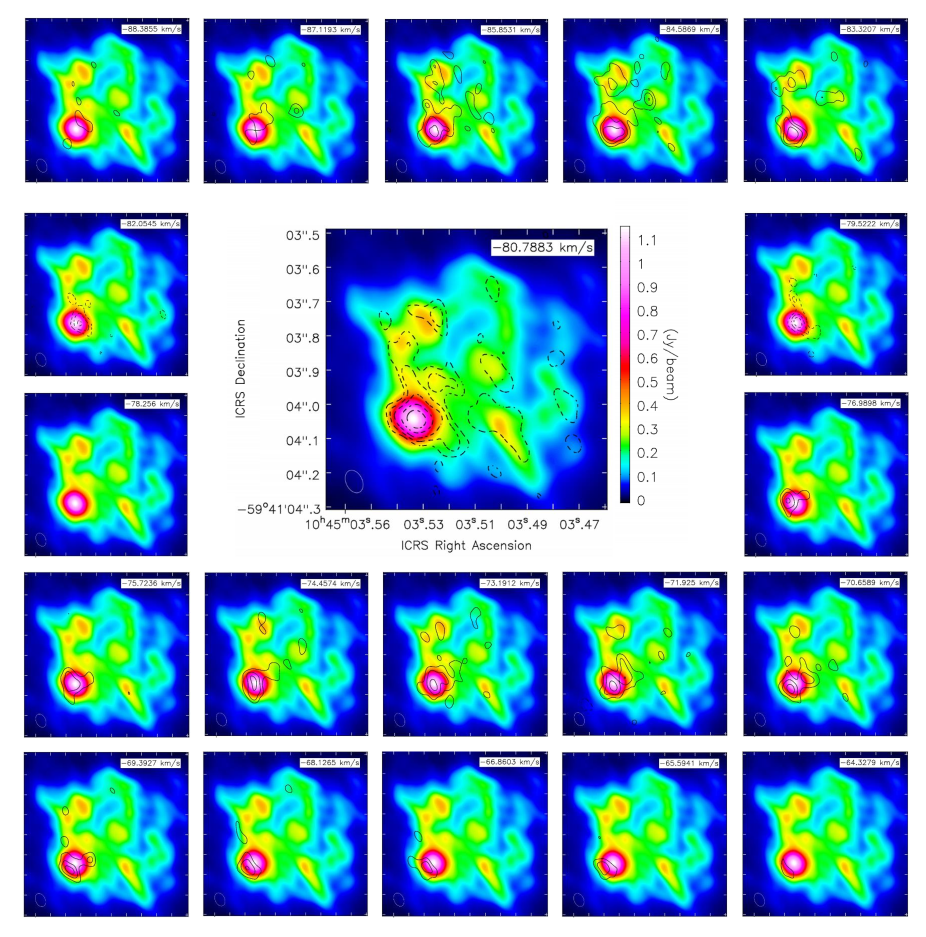
To further analyse the origin of the absorption line, in Figure 4 we present the intensity contour maps of each velocity channel in which the line is present in absorption or emission, superimposed to the 230 GHz continuum raster image. The image cube was centered arbitrarily at the frequency of the 13CS (5-4) line (zero velocity). Although we do not know it the line is intrinsic to the source, differences in velocity are used instead of differences in frequency because they are easier to understand.
Figure 5 presents intensity raster images of the absorption line, integrated between the velocities of and km s-1 (zero momentum). A noise level corresponding to mJy beam-1 was excluded from the integration. The image in the left panel shows a narrow absorption ridge, in the NE-SW direction; the image on the right panel also includes the contour map of the 230 GHz continuum emission, showing the position of the ridge relative to the continuum source.
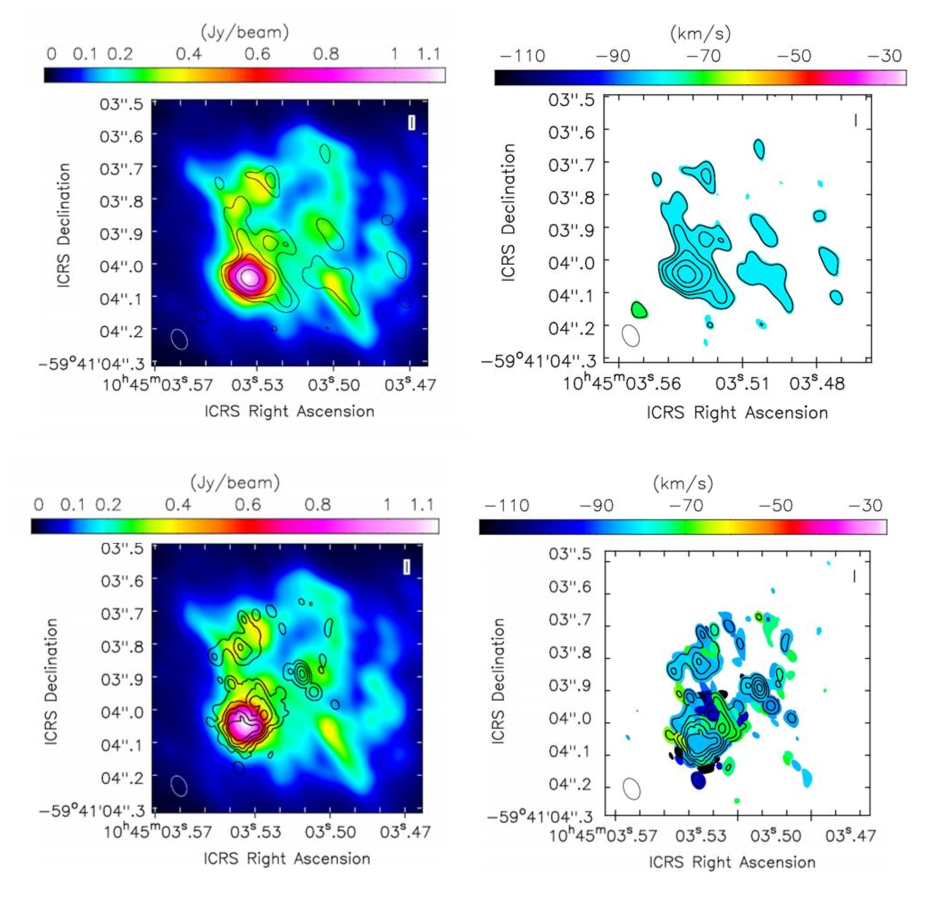
Since line emission and absorption may cancel out in the integrated intensity image, we obtained also images of minimum and maximum intensity representing absorption and emission respectively, and also images of the velocities at which these extreme intensities occur. Figure 6 left panel (top/bottom) presents the contour maps of the maximum intensity of the line in absorption/emission, superimposed to the raster image of the 230 GHz continuum. The right panels (top/bottom) of Figure 6 present the contour maps of the maximum intensity of the line in absorption/emission, superimposed to the raster images of the velocities corresponding to these maxima.
The agreement between the absorption contours at the centre of the absorption line ( km s-1) and the continuum image showed in figure 4 is remarkable, covering both Car and the Weigelt Complex region. The 231.28 GHz emission line intensity contours are only seen in front of the continuum source, implying that, if the lines are real, they originate in a cloud that only covers the continuum source.
The absorption line at 231.28 GHz was also found in observations obtained with ALMA on 2015 April (2015.3), with spatial resolution (). These observations were retrieved from the ALMA public archive and processed using a CLEAN window of and velocity resolution of 1.26 km s-1.
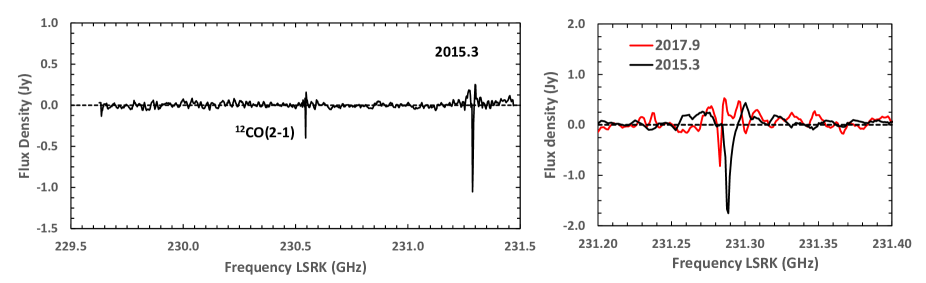
Figure 7 (left panel) presents the spectrum of the band centered at the frequency of the CO (2-1) line, with velocity resolution of 3 km s-1, integrated over the region that covers the continuum source (central panel of Fig. 1). The CO (2-1) and the 231.28 GHz lines can be seen in absorption at the centre and high frequency end of the band, respectively. The right panel of Figure 7 presents together the 231.28 GHz lines, observed on 2015.3 and on 2017.9, with 1.26 km s-1 velocity resolution. We can see that the line was wider on 2015.3 than on 2017.9, and that the central frequency of the lines differ in an amount that corresponds to approximately 8 km s-1.
3.2 Absorption line close to CO (2-1) and CO (3-2) lines
In this section we compare the absorption lines observed in front of the 230 and 354 GHz continuum (centre and right panel of Fig. 1), close to the frequency of the CO (2-1) and CO (3-2) transitions, respectively.
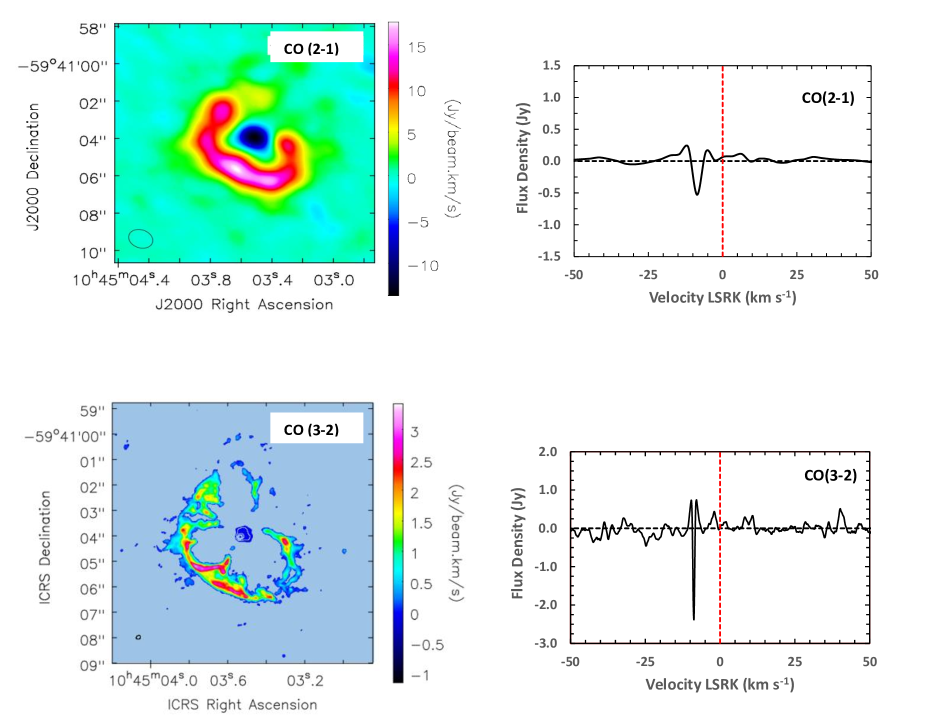
The top left panel of Figure 8 shows the raster image of the CO (2-1) transition, integrated over the whole spectrum (zero momentum); we can see the CO torus in emission and strong absorption in front of the central continuum source. The top right panel of Fig. 8 shows the absorption line, with a velocity resolution of 3 km s-1; the LSR velocity at the center of the line is -8.54 km s-1.
The CO (3-2) absorption line was reported by Bordiu & Rizzo (2019) as part of the study of the disrupted radius torus seen in emission. We re-analyzed the data and show the image of the CO (3-2) line, integrated over the whole spectrum (zero momentum) at the bottom left panel of Figure 8, and the absorption line, with velocity resolution of 1.3 km s-1 at the bottom right panel of the same figure. The LSR velocity at the center of the line is -8.74 km s-1, coincident with the velocity of the CO (2-1) transition observed about one year earlier.
3.3 The 354.90 and 354.93 GHz absorption line
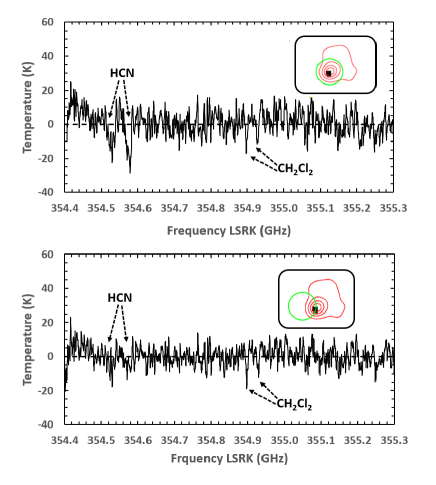
Besides the lines mentioned above, we also detected two narrow absorption lines in the band centered at 354.8 GHz, in data retrieved from ALMA public archive obtained on 2016 October. These data were used by Bordiu & Rizzo (2019) to study the HCN (4-3) transition, seen in emission in the radius torus that surrounds the Car binary system and also in absorption against the central continuum source, at the frequencies of 354.51 and 354.46 GHz. The absorption lines reported here are weak but very well defined; they are centered at the frequencies of 354.90 and 354.93 GHz with a line width of about 1.3 km s-1. These frequencies are close to two telluric lines of the of the methyl chloride CH2Cl2 molecule.
Spectra of the whole band are presented in Figure 9. They include the HCN (4-3) lines reported by Bordiu & Rizzo (2019) and the newly reported absorption lines. The top panel of Fig. 9 shows the spectrum integrated over the continuum emission region delimited by the green circle superimposed on the red 354 GHz continuum contours, on the insert at the top left of the panel. In this region, the HCN lines are stronger than the absorption lines reported here. The bottom panel shows the spectrum, integrated over the same area than that in the top panel, but in a position centered to the east of the compact continuum source, as shown by the green circle at the insert in the top left of the panel. We can see that the intensity of the absorption lines reported here remain the same as in the previous region, while the HCN line intensity had decreased, implying that if the reported lines are real, they probably originate in a more extended region than HCN.
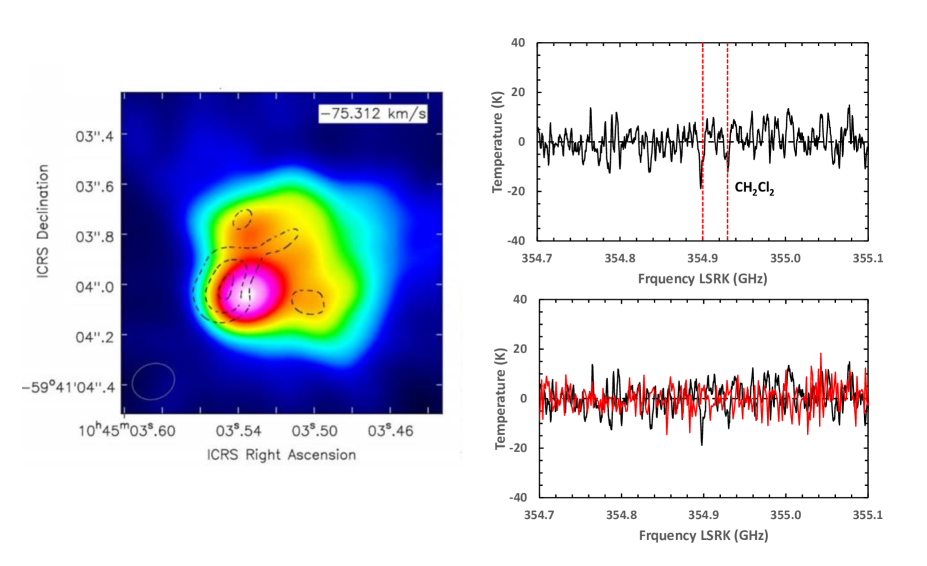
Figure 10 (left panel) shows the intensity contour map of the velocity channel in which 354.89 GHz line presents maximum absorption, superimposed on the 354 GHz continuum raster image. We can see that the absorption is stronger towards the the east of the compact continuum source, as already shown in the integrated spectra of Fig. 9. Since the 354.93 line is weaker it is not shown here; it is centered on the continuum source but it does not present any structure.
Once again, we analysed the spectrum of the phase calibrator source, observed almost simultaneously with Car. At the top right panel of Figure 10 we display the spectrum of the absorption lines detected in Car, showing the frequencies of the two transitions of the CH2Cl2 molecule and at the bottom right panel we show the spectrum of Car together with the spectrum of phase the calibrator source J1032-5917. Both sources used the same bandpass calibrator J0904-5735. Although the noise level in the phase calibrator and in Car are similar, the spectrum of the calibrator does not present any absorption feature that can be related to a telluric molecule.
4 Discussion
In Section 3 we presented images of the central region of Car in the 230 and 354 GHz continuum with different spatial resolutions: (), () and (), obtained on three different epochs, 2015.3, 2016.8 and 2017.9, respectively. We also showed their spectra, focusing on the presence of absorption lines with LSR frequencies close to the frequencies of telluric lines of the molecules O3, CO and CH2Cl2.
To understand the possible contamination of the target spectra by telluric lines, we must consider the calibration procedure used by ALMA. The observations of the target and phase calibrators are made in frequency division multiplexing mode (FDM), which allows frequency resolution of up to 3840 channels, but the bandpass calibrator is observed in time multiplexing mode (TDM), which provides only 128 frequency channels. Therefore, the bandpass correction does not take into account the contribution of all the individual channels, but only the mean value provided by the bandpass calibrator.
Hunter et al. (2018) investigated the effect of this calibration procedure when telluric lines are present, in particular the very strong ozone lines, and showed that they could contaminate the spectrum of a line-free source, specially when the the bandpass calibrator and the target source are observed at different elevations. To verify if this was the case in the observations discussed in this paper, we present in Table 1 the conditions at which the observations of the target, bandpass and phase calibrators were made (name of the bandpass and phase calibrators and elevation of the sources at the date, UTC and ST times of observations. We can see that the differences in elevation between the bandpass calibrators and the target were , and only on 2015.3, 2016.8 and 2017.9, respectively. Therefore, at least on the last epoch we would not expect to find the contamination related by (Hunter et al., 2018).
The definitive proof that the lines are from telluric origin rests on the evaluation of their topocetric frequencies at the time of the observations, which are easily obtained from the CASA software. These frequencies are presented in Table 2, where we show the LSRK and the corresponding topocentric (TOPO) frequencies at the centre of the absorption lines, the velocity corresponding to the difference between the two frequencies, which represents the earth velocity, as well as the frequencies of the corresponding tellutic lines and their difference with the topocentric frequency of the absorption lines.
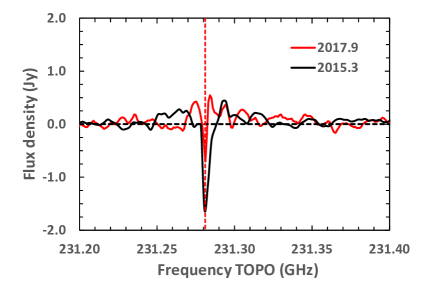
In the case of the 231.28 GHz line, the topocentric frequencies at the centre of the absorption lines at the two epochs coincide with the frequency of the O3 transition, while their LSRK frequencies were different. This can be also seen in Figure 11 that presents together the two lines, observed on 2015.3 and 2017.9, in the topocentric reference frame, showing that the difference in the LSRK frequency at the center of the lines shown in Fig. 7 was due to differences in the velocity of the earth relative to the LSRK, confirming their telluric origin.
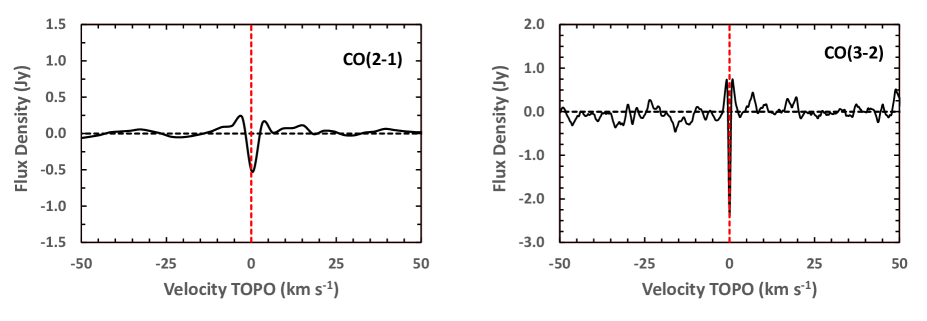
The CO (2-1) and CO (3-2) transitions, were observed on different epochs but presented similar velocities relative to the rest frequencies of the CO molecule in the LSRK reference system; their topocentric frequencies correspond exactly to the rest frequency of the respective transitions, which can be considered also a strong evidence of their telluric origin. Figure 12 presents the spectra of the two transitions in the topocentric velocity reference frame, showing that both lines are centered at zero velocity.
The two low intensity absorption lines observed at frequencies of 354.90 and 354.93 GHz were observed only on one epoch, but their topocentric frequencies coincide with the frequencies of two CH2Cl2 and CH2Cl2 transitions, which can also be considered a strong evidence of their telluric origin.
The frequencie of the two HCN absorption lines discussed by Bordiu & Rizzo (2019) are not close to any strong telluric line and their profiles are very different from those of the lines we are discussing in this paper, but the strongest reason to believe that they are real is that the frequency difference between them corresponds to the difference between two HCN transitios HCN (J=4-3, F = 3-4) and HCN (J=4-3, F=4-4, I=1e).
| Object | Bandpass | Phase | Target |
|---|---|---|---|
| Calibrator | Calibrator | ||
| Date | 3/04/2015 | ||
| Source | J1107-4449 | J1047-6217 | Car |
| RA (ICRS) | 11:07:08.69 | 10:47:42.94 | 10:45:03.54 |
| DEC (ICRS) () | -44:49:07.62 | -62: 17:14.65 | -59:41:04.05 |
| UTC | 3:38 | 3:48 | 3:48 |
| ST | 10:46 | 10:57 | 10:58 |
| El | 67.7 | 50.7 | 53.2 |
| Date | 24/10/2016 | ||
| Source | J0538-4405 | J1047-6217 | Car |
| RA (ICRS) | 05:38:50.36 | 10:47:42.94 | 10:45:03.54 |
| DEC (ICRS) () | -44:05:08.94 | -62:17:14.64 | -59:41:4.05 |
| UTC | 10:29 | 10:49 | 10:55 |
| ST | 07:07 | 07:26 | 07:32 |
| El | 62.6 | 38.2 | 40.3 |
| Date | 20/11/2017 | ||
| Source | J0904-5735 | J1032-5917 | Car |
| RA (ICRS) | 09:04:53.18 | 10:32:42.53 | 10:45:03.54 |
| DEC (ICRS) () | -57:35:05.78 | -59:17:57.12 | -59:41:04.05 |
| UTC | 11:21 | 11:35 | 11:26 |
| ST | 9:44 | 10:00 | 09:51 |
| El | 54.6 | 53.1 | 52.2 |
The last question that has to be answered is why, if the absorption lines are of telluric origin, they are not detected in the phase calibrator sources, as shown in Figs. 3 and 10 of Section 3, which show the spectra of Car and of the phase calibrator sources (quasars), which were observed almost simultaneously with the target source and with the same spectral resolution (FDM), but did not show any absorption line. The answer is that Car is a much stronger continuum source than the calibrators: 28 Jy at 230 GHz on 2017.9 compared with 0.2 Jy of the calibrator, and 33 Jy at 354 GHz on 2016.4, compared with 0.5 Jy of the calibrator. That also explains the coincidence between the absorption lines and the continuum emission maps. It should also be noticed that the target source, Car, is extended while the quasars are point sources, so that the comparison between them should be done at the level of flux density per beam. In Car, on 2017.9, the maximum intensity of the continuum image at 230 GHz was 1.1 Jy beam-1, while the maximum intensity at the centre of the absorption line was 0.054 Jy beam-1, that is about 5% of the continuum value. If the same ratio is applied to the 0.2 Jy beam-1 of the calibrator source, we obtain 0.01 Jy beam-1 for the absorption line, which coincides with the maximum observed noise. Moreover, when the spectrum of Car is integrated over the whole continuum emitting region, the systematic errors in the calibration procedure add up, resulting in 0.78 Jy for the total flux density of the absorption line, while the integration of the phase calibrator point source spectra remains the same.
| Line | Date Obs. | (LSRK) | (TOPO) | ||
|---|---|---|---|---|---|
| GHz | GHz | km s-1 | MHz | ||
| 231.28 GHz | 2015.3 | 231.2875 | 231.2806 | 8.98 | 0.9 |
| O3 | 231.2815 | ||||
| 231.28 GHz | 2017.9 | 231.2830 | 231.2812 | 2.30 | 0.3 |
| O3 | 231.2815 | ||||
| 230.54 GHz | 2015.3 | 230.5446 | 230.5382 | 8.58 | -0.2 |
| CO (2-1) | 230.5380 | ||||
| 345.80 GHz | 2016.8 | 345.8061 | 345.7962 | 8.54 | -0.2 |
| CO (3-2) | 345.7960 | ||||
| 354.90 GHz | 2016.8 | 354.8977 | 354.8868 | 8.84 | -0.2 |
| CH2Cl2 | 354.8870 | ||||
| 354.93 GHz | 2016.8 | 354.9275 | 354.9171 | 8.84 | 0.0 |
| CH2Cl2 | 354.9171 |
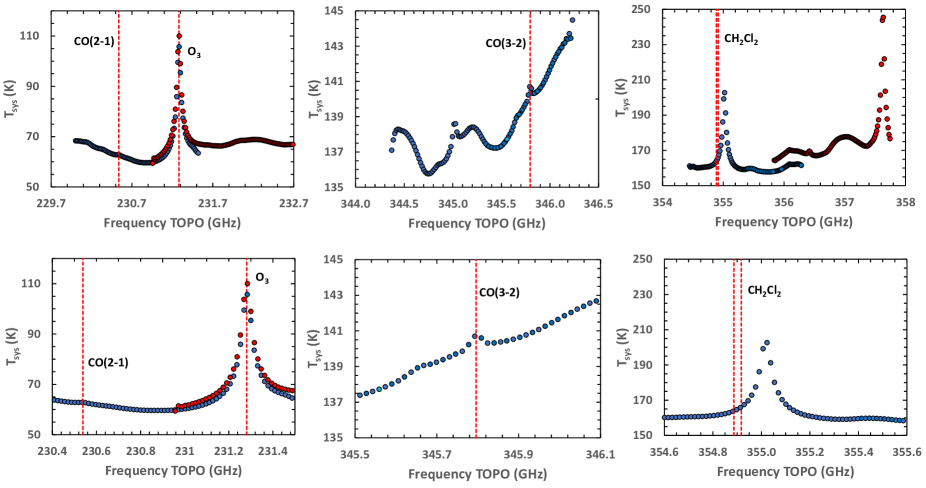
Finally, it is worth discussing the best way to identify if an absorption line detected in an ALMA cube is real or an artificial feature due to a faulty subtraction of the telluric lines. A step that certainly helps the analysis is looking carefully at the system temperature (Tsys). In Figure 13 we show the system temperature for the data discussed in this paper. To make those plots, we averaged the data through all antennas and during the entire observation. Since Car is a bright source, the observation did not take too long, and there were no significant changes in elevation. The dashed red lines indicate the topocentric frequencies of the absorption lines discussed in this paper. We can see that Tsys at the frequency of the the O3 lines is very large, but in others cases it does not have a pronounced change with frequency, as at the frequency of the CO(2-1) or CH2Cl2 lines. Therefore, the only direct way to verify if a line is telluric is to observe it at two epochs, in which the contribution of the earth velocity is different, and see if the LSR velocity of the line changes, while the topocentric velocity remains constant, as it was the case of the ozone line in Car. The availability of a list of the telluric lines modeled by the atmospheric calibration program would also help.
5 Conclusions
Images of the region responsible for the 231.28 GHz absorption line observed in front of the strong continuum source in Car, obtained by ALMA with high spatial resolution on 2017 November, show strong similarity with the continuum image, which includes the central source and the Weigelt Complex.
The fact that the frequency of the absorption line is very close to the frequency of of a strong telluric ozone line and the report of Hunter et al. (2018) about a possible inaccuracy in the calibration procedure in the presence of strong telluric lines, motivated a more profound study of the origin of the observed line, as well as of other lines in absorption detected in data retrieved from ALMA public archive. These lines were: 231.28 GHz and CO (2-1) observed on 2015 April, CO (3-2), 354.89 and 354.92 GHz observed on 2016 October.
Since the inaccuracy in the calibration affected in the same way the phase calibrator and the target ( Car) sources, we also obtained images and spectra of the phase calibrators; although the noise levels of their spectra were similar to those of the target source, no absorption lines were detected.
The definite proof of the telluric origin of the absorption lines came from the calculation of their topocentric frequencies, since their difference with the LSR frequencies reflect the velocity of the earth relative to the LSR, which depends on the epoch of the observation. In all cases the topocentric frequencies coincide with the rest frequencies of one the transitions: O3 , CO (2-1), CO (3-2), CH2Cl2 and CH2Cl2 . In particular, the 231.28 GHz absorption line was observed on two occasions: 2015.3 and 2017.9; the frequencies at maximum absorption differed in an amount corresponding to a velocity of about 8 km s-1, which was the difference in the earth velocities relative to the LSR on the two epochs.
We provide a simple explanation for the absence of absorption lines in the phase calibrator, observed almost simultaneously with Car and processed with the same calibration procedure. It relies on the fact that the intensity of Car (Jy beam -1) is much higher than that of the phase calibrator (quasar) and it is also extended, while the calibrator is not resolved. The result is that the possible absorption line falls into the noise level of the calibrator but is mach larger in Car, where it is further increased as the spectrum is integrated along the continuum emission region.
We conclude pointing out the importance of calibration in the interpretation of the spectra of sources with strong and spatially extended continuum emission at frequencies close to the frequencies of telluric lines, even if these lines are not as strong as O3 and the baseline calibrator is observed at elevations very close to those of the target source.
6 Data Availability
The data underlying this article are available in ADS/JAO.ALMA#2016.1.00585.S and ADS/JAO.ALMA2017.1.00725.S
Acknowledgements
This paper makes use of the following ALMA data: ADS/JAO.ALMA#2016.1.00585.S and ADS/JAO.ALMA2017.1.00725.S. ALMA is a partnership of ESO (representing its member states), NSF (USA) and NINS (Japan), together with NRC (Canada), MOST and ASIAA (Taiwan), and KASI (Republic of Korea), in cooperation with the Republic of Chile. The Joint ALMA Observatory is operated by ESO, AUI/NRAO and NAOJ. We are grateful to the referee for helpful suggestion and the ALMA help desk for their assistance. ZA and PPB acknowledge Brazilian agencies FAPESP (grant #2011/51676-9 and #2014/07460-0) and CNPq (grant #304242/2019-5)
References
- Abraham et al. (2005) Abraham, Z., Falceta-Gonçalves, D., Dominici, T. et al., 2005, A&A, 437, 977
- Abraham et al. (2020) Abraham, Z., Beaklini, P.P.B., Cox, P., Falceta-Gonçalves, D., Nyman, L-Å., 2020, MNRAS, 499, 2493 ¨
- Bordiu & Rizzo (2019) Bordiu, C., Rizzo, J. R., 2019, MNRAS, 490, 1570
- Clementel et al. (2014) Clementel, N., Madura, T. I., Cruip, C. J. H., Icke, V., Gull, T. R., 2014, MNRAS, 443, 2475
- Corcoran et al. (2001) Corcoran, M. F., Swank, J. H., Petre, R. et al., 2001, ApJ, 562, 1031
- Corcoran et al. (2017) Corcoran, M. F., Liburd, J., Morris, D., et al. 2017, ApJ, 838, 45
- Damineli (1996) Damineli, A., 1996, ApJ, 460, L49
- Damineli et al. (2000) Damineli A., Kaufer A., Wolf, B., Stahl, O., Lopes, D.F., Araújo F. X., 2000, ApJ, 528, L101
- Davidson & Humphreys (1997) Davidson, K., Humphreys, R. M., 1997, ARA&A, 35, 1
- Davidson et al. (1997) Davidson, K., Ebbets, D., Johansson, S. et al., 1997, AJ, 113, 335
- Duncan & White (2003) Duncan, R. A., White, S. M., 2003, MNRAS, 338, 425
- Falceta-Gonçalves, Jatenco-Pereira & Abraham (2005) Falceta-Gonçalves, D., Jatenco-Pereira, V., Abraham, Z., 2005, MNRAS, 357, 895
- Groh et al. (2012) Groh, J. H., Madura, T. I., Hillier, D. J. et al., 2012, ApJ, 759, L2
- Hillier et al. (2001) Hillier, D. J., Davidson, K., Ishibashi, K., Gull, T., 2001, ApJ, 553, 837
- Hillier et al. (2006) Hillier, D. J., Gull, T., Nielsen, K. et al., 2006, ApJ, 642, 1098
- Hunter et al. (2018) Hunter, T., Phillips, N., Broguiére, D., Gonzales, J., 2018, https://science.nrao.edu › alma-develop-old-022217
- Madura et al. (2012) Madura, T.I., Gull, T.R., Owocki, S.P., Groh, J.H., Okazaki, A.T., Russell, C.M., 2012, MNRAS, 420, 2064
- Madura et al. (2013) Madura et al., 2013, MNRAS, 436, 3820
- Mehner et al. (2010) Mehner, A., Davidson, K., Ferland, G. J. et al., 2010, ApJ, 710, 729
- Mehner et al. (2019) Menher, A. and al., 2019, A&A, 630, L6
- Morris et al. (2017) Morris, P.W., Gull, T.R., Hillier, D.J. et al., 2017, ApJ, 842, 79
- Morris et al. (2020) Morris, P. W. et al., 2020, ApJ, 802, 23
- Parkin, et al. (2011) Parkin, E, R., Pittard, J. M., Corcoran, Hamaguchi, K. 2011, ApJ, 726, 105
- Pittard & Corcoran (2002) Pittard, J.M., Corcoran, M.F., 2002, A&A, 383, 636
- Reitberger et al. (2015) Reitberger, K., Reimer, A., Reimer, O.,Takahashi, H., 2015, A&A, 577, 100
- Russel et al. (1987) Russel, R. W., Lynch, D. K., Hackwell, J. A., Rudy, R. J., Rossano, G. S., 1987, ApJ, 321, 937
- Russell et al. (2016) Russell, C. M., Corcoran, M. F., Hamaguchi, K. et al. 2016, MNRAS, 458, 2275
- Smette et al. (2015) Smette A., Sana H., Noll S., Horst H., Kausch W., Kimeswenger S., Barden M., et al., 2015, A&A, 576, A77
- Smith et al. (1995) Smith, C. H., Aitken, D. K., Moore, T. J. T., Roche, P. F., Puetter, R. C., Piña, R. K., 1995, MNRAS, 273, 354
- Smith, Ginsburg & Bally (2018) Smith, N., Ginsburg, A., Bally, J., 2018, MNRAS, 474, 4988
- Teodoro et al. (2016) Teodoro M., Damineli A., Heathcote B., Richardson N. D., Moffat A. F. J., 2016, ApJ, 819, 131
- Verner, Bruhweiler & Gull (2005) Verner, E.M., Bruhweiler, F., Gull, T., 2005, ApJ, 624, 973
- Weigelt & Ebersberger (1986) Weigelt, G., Ebersberger, J., 1986, A&A, 163, L5
- Whitelock et al. (2004) Whitelock, P.A., Feast, M.W.,Marang, F., Breedt, E., 2004, MNRAS, 352,447