Perfecting our set of spectrophotometric standard DA white dwarfs
Abstract
We verified for photometric stability a set of DA white dwarfs with Hubble Space Telescope magnitudes from the near-ultraviolet to the near-infrared and ground-based spectroscopy by using time-spaced observations from the Las Cumbres Observatory network of telescopes. The initial list of 38 stars was whittled to 32 final ones which comprise a high quality set of spectrophotometric standards. These stars are homogeneously distributed around the sky and are all fainter than 16.5 mag. Their distribution is such that at least two of them would be available to be observed from any observatory on the ground at any time at airmass less than two. Light curves and different variability indices from the Las Cumbres Observatory data were used to determine the stability of the candidate standards. When available, Pan-STARRS1, Zwicky Transient Facility and TESS data were also used to confirm the star classification. Our analysis showed that four DA white dwarfs may exhibit evidence of photometric variability, while a fifth is cooler than our established lower temperature limit, and a sixth star might be a binary. In some instances, due to the presence of faint nearby red sources, care should be used when observing a few of the spectrophotometric standards with ground-based telescopes. Light curves and finding charts for all the stars are provided.
1 Introduction
An era of deep imaging surveys of large areas of the sky has started with projects such as the Sloan Digital Sky Survey (SDSS), Pan-STARRS (PS), the Dark Energy Survey (DES), Skymapper, the Asteroid Terrestrial-impact Last Alert System (ATLAS), the All-Sky Automated Survey for Supernovae (ASAS-SN), the Zwicky Transient Facility (ZTF). Missions such as the Vera Rubin Observatory (VRO) and the Nancy Grace Roman Space Telescope are only a few of years away. Other facilities such as Gaia, Kepler and TESS report photometry of millions of stars to very high internal accuracy. All these projects have their own native photometric system, with some of them differing significantly. To make the astrophysical information across these missions and surveys commensurate with one another, they must be put on a common photometric system by relying on a set of calibration references.
Sub-percent global photometric standardization has been challenging in the past, but is now in high demand for several ongoing scientific studies. For instance, photometric calibration is the major source of uncertainty in the use of Type Ia supernovae as probes of the history of cosmic expansion to infer the properties of the dark energy (Betoule et al., 2014; Scolnic et al., 2015; Stubbs & Brown, 2015; Scolnic et al., 2019, 2021; Brout et al., 2021). Experiments that require accurate and reliable photo-redshift determination, such as weak lensing tomography and baryonic acoustic oscillation analysis with the Vera Rubin Observatory (Gorecki et al., 2014), are also limited by systematic uncertainties arising from their relative photometric calibration.
| Star | Name | Alternative name | Gaia DR3 ID | RAaaCoordinates are from Gaia DR3 at epoch precessed to , no proper motion applied. To get current coordinates apply the proper motions from 2016 and precess. | DECaaCoordinates are from Gaia DR3 at epoch precessed to , no proper motion applied. To get current coordinates apply the proper motions from 2016 and precess. | |||||
|---|---|---|---|---|---|---|---|---|---|---|
| (hh:mm:ss.s) | (dd:mm:ss.s) | (mas/yr) | (mas/yr) | mag | mag | mag | ||||
| Northern and Equatorial DAWDs | ||||||||||
| J0103-0020 | WDFS0103-00 | SDSSJ010322.19-002047.7 | 2536159496590552704 | 01:03:22.201 | -00:20:47.800 | 6.1960.382 | -6.5500.355 | 19.30 | 19.67 | 19.16 |
| J0228-0827 | WDFS0228-08 | SDSSJ022817.16-082716.4 | 5176546064064586624 | 02:28:17.183 | -08:27:16.301 | 10.9160.783 | 3.1510.539 | 19.97 | 20.07 | 19.82 |
| J0248+3345 | WDFS0248+33 | SDSSJ024854.96+334548.3 | 139724391470489472 | 02:48:54.965 | 33:45:48.244 | 4.0930.253 | -4.7590.205 | 18.52 | 18.74 | 18.42 |
| J0410-0630**This star was excluded from the final network of spectrophotometric standard DAWDs. See text for more details. | … | SDSSJ041053.632-063027.580 | 3196384966004896640 | 04:10:53.641 | -06:30:27.677 | 8.5770.279 | 9.7190.185 | 18.99 | 19.22 | 19.02 |
| J0557-1635**This star was excluded from the final network of spectrophotometric standard DAWDs. See text for more details. | … | WD0554-165 | 2991789869534666240 | 05:57:01.292 | -16:35:12.159 | -6.7470.099 | 4.2720.101 | 17.94 | 18.40 | 17.83 |
| J0727+3214 | WDFS0727+32 | SDSSJ072752.76+321416.1 | 892231562565363072 | 07:27:52.752 | 32:14:16.046 | -13.1510.168 | -6.9230.128 | 18.19 | 18.45 | 18.04 |
| J0815+0731 | WDFS0815+07 | SDSSJ081508.78+073145.7 | 3097940536010212736 | 08:15:08.782 | 07:31:45.775 | 5.5190.811 | -0.1900.733 | 19.93 | 20.25 | 19.79 |
| J1024-0032 | WDFS1024-00 | SDSSJ102430.93-003207.0 | 3830980604624181376 | 10:24:30.912 | -00:32:07.160 | -21.3010.388 | -5.6700.590 | 19.08 | 19.23 | 19.00 |
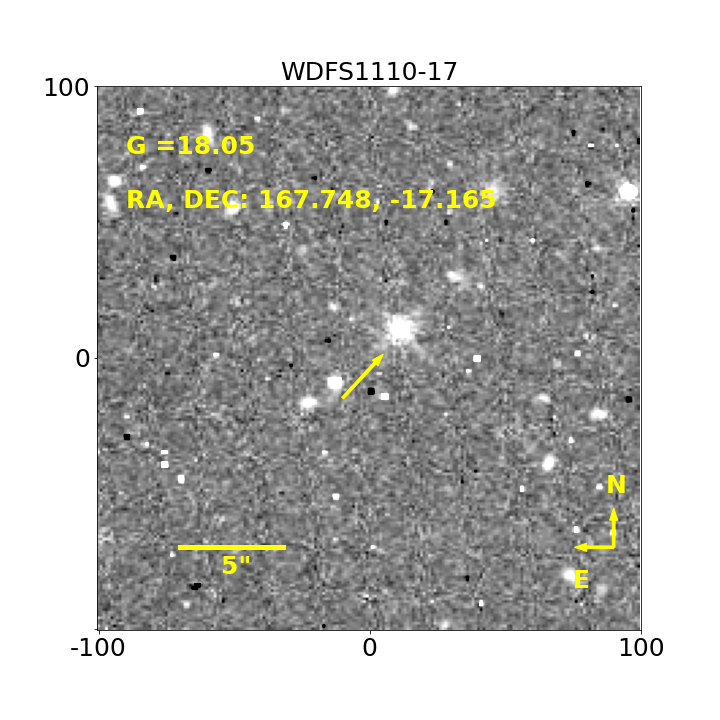
| J1110-1709 | WDFS1110-17 | SDSSJ111059.42-170954.2 | 3559181712491390208 | 11:10:59.436 | -17:09:54.308 | 5.4540.162 | -8.0150.136 | 18.05 | 18.37 | 17.91 |
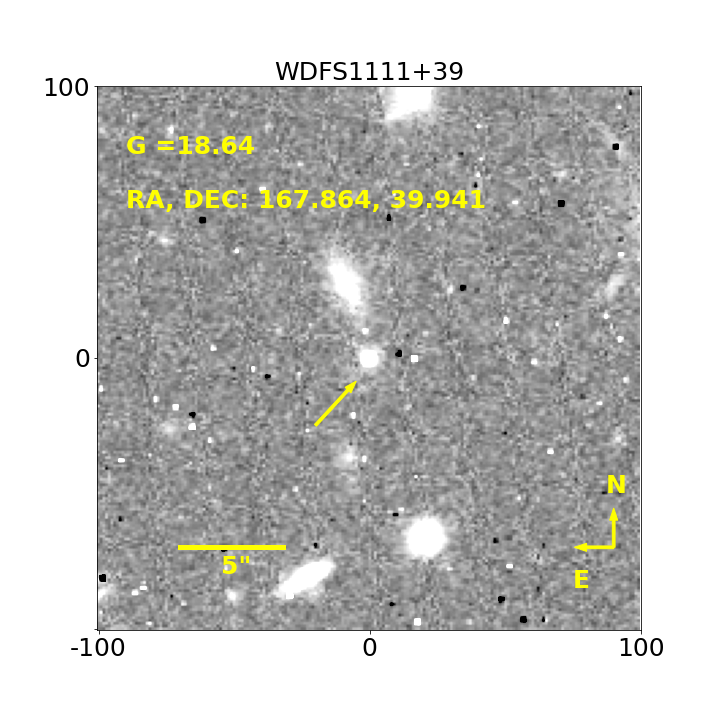
| J1111+3956 | WDFS1111+39 | SDSSJ111127.30+395628.0 | 765355922242992000 | 11:11:27.313 | 39:56:28.105 | 2.7340.231 | 2.9330.255 | 18.64 | 19.07 | 18.48 |
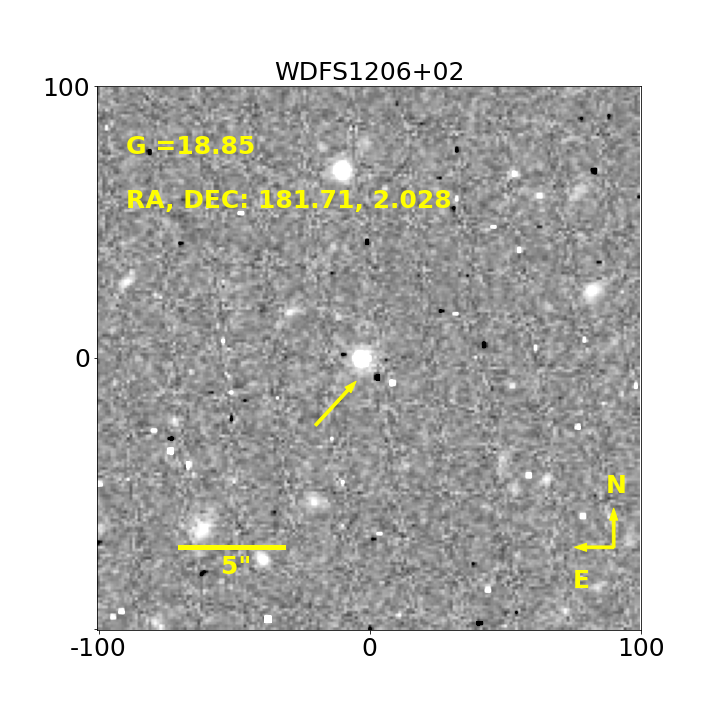
| J1206+0201 | WDFS1206+02 | SDSSJ120650.504+020143.810 | 3891742709551744640 | 12:06:50.410 | 02:01:42.138 | -5.0610.300 | -23.3670.149 | 18.85 | 19.07 | 18.75 |
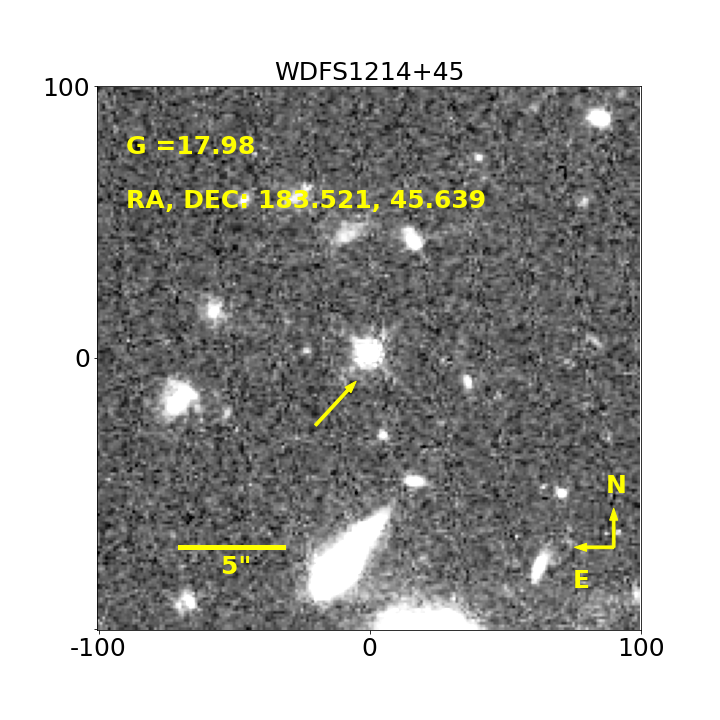
| J1214+4538 | WDFS1214+45 | SDSSJ121405.11+453818.5 | 1539041748873288704 | 12:14:05.111 | 45:38:18.626 | 0.2780.088 | 13.9250.104 | 17.98 | 18.23 | 17.84 |
| J1302+1012 | WDFS1302+10 | SDSSJ130234.43+101238.9 | 3734528631432609920 | 13:02:34.422 | 10:12:38.717 | -12.8560.132 | -16.8370.122 | 17.24 | 17.54 | 17.10 |
| J1314-0314 | WDFS1314-03 | SDSSJ131445.050-031415.588 | 3684543213630134784 | 13:14:45.046 | -03:14:15.685 | -3.9300.404 | -5.6590.265 | 19.31 | 19.74 | 19.25 |
| J1514+0047 | WDFS1514+00 | SDSSJ151421.27+004752.8 | 4419865155422033280 | 15:14:21.277 | 00:47:52.380 | 4.3500.059 | -26.8550.053 | 15.88 | 16.11 | 15.77 |
| J1557+5546 | WDFS1557+55 | SDSSJ155745.40+554609.7 | 1621657158502507520 | 15:57:45.380 | 55:46:09.361 | -11.6770.112 | -21.4780.126 | 17.69 | 18.04 | 17.53 |
| J1638+0047 | WDFS1638+00 | SDSSJ163800.360+004717.822 | 4383979187540364288 | 16:38:00.352 | 00:47:17.739 | -9.1710.320 | -2.7370.239 | 19.02 | 19.36 | 18.91 |
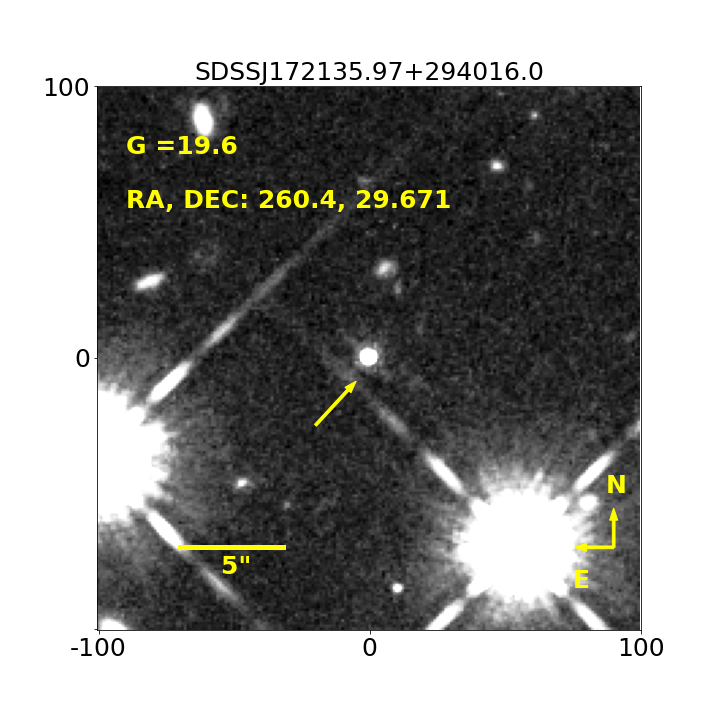
| J1721+2940**This star was excluded from the final network of spectrophotometric standard DAWDs. See text for more details. | … | SDSSJ172135.97+294016.0 | 4599419007715436928 | 17:21:35.951 | 29:40:16.178 | -20.9190.230 | 10.5360.26 | 19.60 | 19.50 | 19.69 |
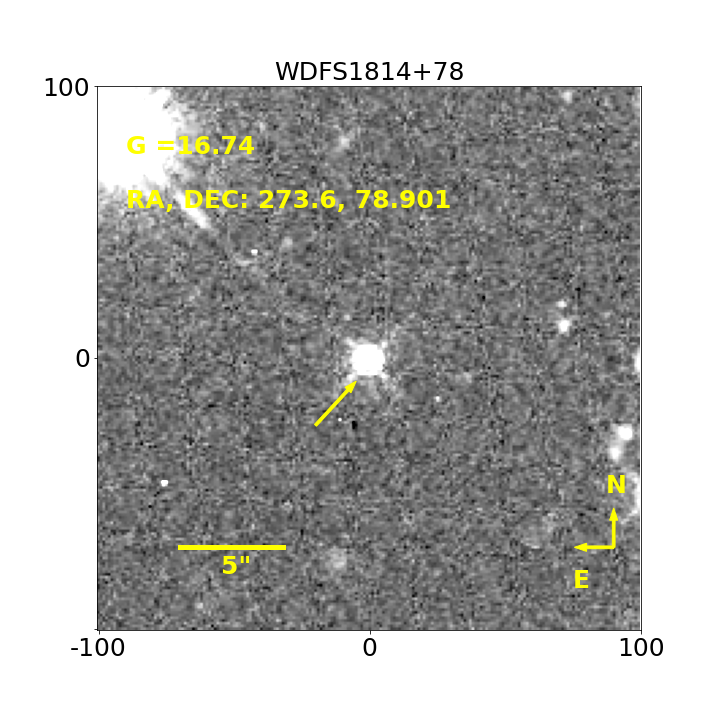
| J1814+7854 | WDFS1814+78 | SDSSJ181424.075+785403.048 | 2293913930823813888 | 18:14:24.078 | 78:54:03.084 | -10.7380.060 | 11.5350.057 | 16.74 | 17.03 | 16.61 |
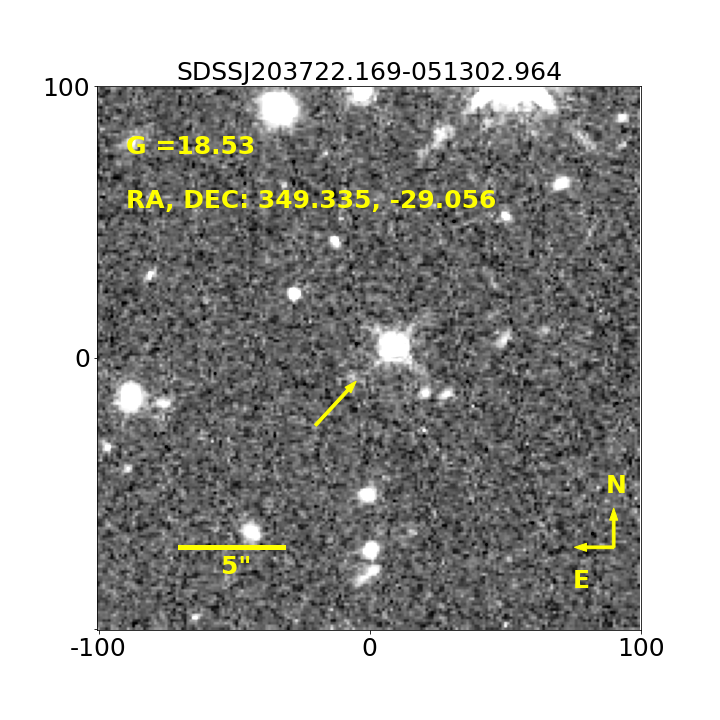
| J2037-0513**This star was excluded from the final network of spectrophotometric standard DAWDs. See text for more details. | … | SDSSJ203722.169-051302.964 | 6908492038494775680 | 20:37:22.173 | -05:13:03.023 | 3.1180.267 | -2.0000.206 | 19.11 | 19.40 | 19.04 |
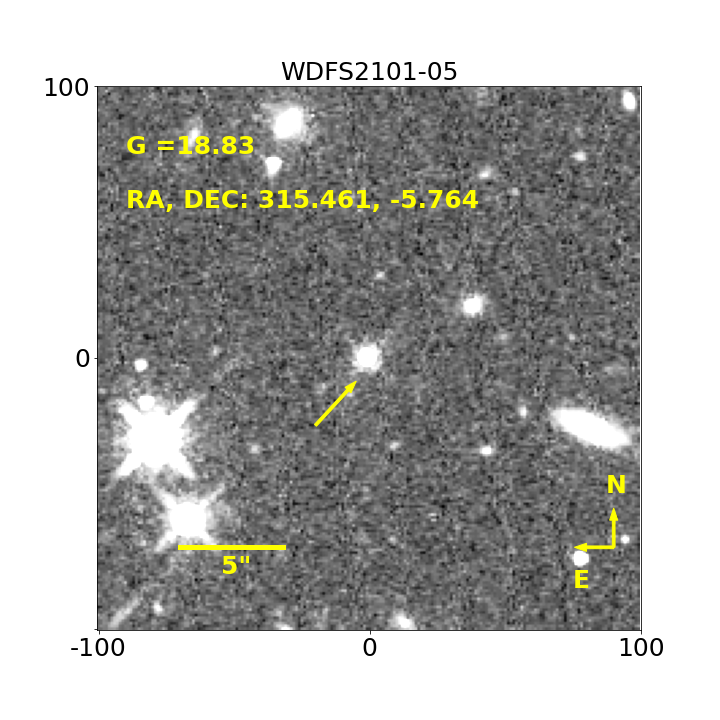
| J2101-0545 | WDFS2101-05 | SDSSJ210150.65-054550.9 | 6910475935427725824 | 21:01:50.667 | -05:45:51.159 | 9.9840.218 | -11.6940.210 | 18.83 | 19.10 | 18.74 |
| J2329+0011 | WDFS2329+00 | SDSSJ232941.330+001107.755 | 2644572064644349952 | 23:29:41.321 | 00:11:07.565 | -7.9820.189 | -14.9190.162 | 18.29 | 18.42 | 18.24 |
| J2351+3755 | WDFS2351+37 | SDSSJ235144.29+375542.6 | 2881271732415859072 | 23:51:44.274 | 37:55:42.569 | -16.4120.145 | -9.9410.107 | 18.23 | 18.50 | 18.12 |
| Southern DAWDs | ||||||||||
| J0122-3052 | WDFS0122-30 | ATLAS020.503022 | 5028544686500198144 | 01:22:00.725 | -30:52:03.950 | 20.6210.14 | -12.3030.135 | 18.66 | 19.01 | 18.53 |
| J0238-3602 | WDFS0238-36 | SSSJ023824 | 4953936951336477440 | 02:38:24.969 | -36:02:23.222 | 57.9930.078 | 13.7470.119 | 18.24 | 18.39 | 18.19 |
| J0419-5319**This star was excluded from the final network of spectrophotometric standard DAWDs. See text for more details. | … | WD0418-534 | 4779427928974390272 | 04:19:24.608 | -53:19:16.659 | -17.5870.048 | 27.1660.063 | 16.42 | 16.69 | 16.30 |
| J0458-5637 | WDFS0458-56 | SSSJ045822 | 4764189621230467584 | 04:58:23.133 | -56:37:33.434 | 143.5960.118 | 66.4860.13 | 17.96 | 18.25 | 17.85 |
| J0541-1930 | WDFS0541-19 | SSSJ054114 | 2967083052984612736 | 05:41:14.759 | -19:30:38.896 | 19.2480.126 | -26.9540.142 | 18.43 | 18.61 | 18.35 |
| J0639-5712 | WDFS0639-57 | SSSJ063941 | 3486471764460448512 | 06:39:41.468 | -57:12:31.164 | 17.5130.126 | 43.5760.151 | 18.37 | 18.70 | 18.27 |
| J0757-6049**This star was excluded from the final network of spectrophotometric standard DAWDs. See text for more details. | … | WD0757-606 | 5484605140287436416 | 07:57:50.637 | -60:49:54.634 | -4.5900.287 | 11.0670.223 | 18.95 | 19.15 | 18.89 |
| J0956-3841 | WDFS0956-38 | SSSJ095657 | 5290720695823013376 | 09:56:57.009 | -38:41:30.269 | -8.2690.084 | -46.0750.092 | 18.00 | 18.16 | 17.94 |
| J1055-3612 | WDFS1055-36 | SSSJ105525 | 5421579652019276160 | 10:55:25.356 | -36:12:14.731 | -21.3530.124 | 46.1340.119 | 18.20 | 18.45 | 18.12 |
| J1206-2729 | WDFS1206-27 | WD1203-272 | 5401230062610609920 | 12:06:20.354 | -27:29:40.639 | 3.0190.074 | 2.7960.081 | 16.67 | 16.93 | 16.54 |
| J1434-2819 | WDFS1434-28 | SSSJ143459 | 6222123588482712832 | 14:34:59.528 | -28:19:03.295 | -48.5590.206 | 18.6000.195 | 18.10 | 18.35 | 18.07 |
| J1535-7724 | WDFS1535-77 | WD1529-772 | 5779908502946006784 | 15:35:45.179 | -77:24:44.832 | -26.8810.055 | -43.7490.058 | 16.76 | 17.09 | 16.60 |
| J1837-7002 | WDFS1837-70 | SSSJ183717 | 6431766714636858240 | 18:37:17.906 | -70:02:52.513 | 10.3780.072 | -75.9890.106 | 17.91 | 18.08 | 17.85 |
| J1930-5203 | WDFS1930-52 | SSSJ193018 | 6646236009641999488 | 19:30:18.995 | -52:03:46.550 | 21.5460.123 | -33.2860.102 | 17.67 | 17.94 | 17.55 |
| J2317-2903 | WDFS2317-29 | WD2314-293 | 2378059688840742912 | 23:17:20.294 | -29:03:21.647 | 3.9910.146 | 25.0510.196 | 18.53 | 18.81 | 18.44 |
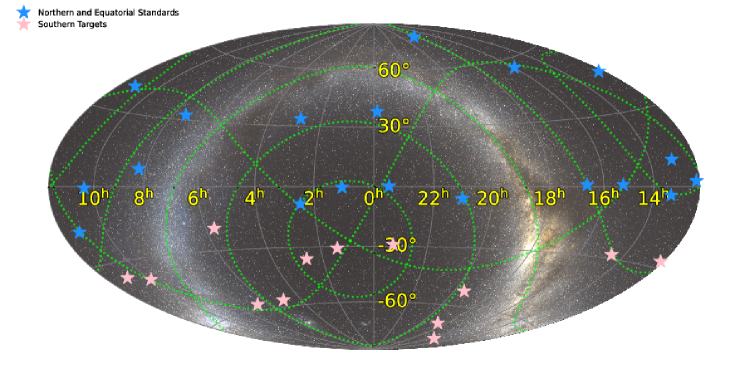
A few years ago we started a project, led by A. Saha, to create a network of all-sky spectrophotometric standard DA white dwarfs (DAWDs). The majority of these stars are fainter than V 18 mag, i.e., bright enough to provide a good signal-to-noise ratio while still avoiding saturation in existing and future deep surveys. We used Wide Field Camera 3 (WFC3) on the Hubble Space Telescope (HST) photometry collected in six filters from the near-ultra-violet (NUV) to the near-infrared (NIR) regime, ground-based spectroscopy and hydrogen atmosphere white dwarf (WD) models to provide theoretical Spectral Energy Distributions (SEDs) for all the DAWDs. 19 stars out of 23 candidates (blue stars in Fig. 1), distributed around the celestial equators and in the Northern hemisphere, were established as standards in Calamida et al. (2019, hereafter CA19) and Narayan et al. (2019, hereafter NA19). Their SEDs agree with the multi-band HST photometry to better than 1% (see Fig. 16 in NA19). These standards are tied to the HST photometric system, based on the spectrophotometry of the three CALSPEC primary DAWDs111http://www.stsci.edu/hst/observatory/crds/calspec.html (Bohlin, 2014; Bohlin et al., 2020).
More recently, we collected ground-based spectroscopy, presented in the current paper, for candidate WDs in the Southern celestial hemisphere; on the basis of their spectra, 15 of them were selected to be subsequently observed with HST222GO program 15113 (PI: Saha). A companion paper describes how 13 of these DAWDs will be established as spectrophotometric standards (Axelrod et al. 2022, in prep.).
Our final goal is providing an all-sky network of spectrophotometric standards so that at least two of these stars will be visible at any time from any observatory at an airmass less than two. The distribution of the established standards on the sky (19 in Northern hemisphere and around the celestial equators, and 13 in the Southern hemisphere) is shown in the Hammer-Aitoff projection of Fig. 1.
In addition to verifying consistency of the spectroscopy and HST photometry with WD atmosphere models, we have monitored all the candidate spectrophotometric standard DAWDs for variability by collecting time-spaced data with the Las Cumbres Observatory (LCO) network of telescopes333Proposals LCO2016B-007, LCO2017AB-002, LCO2018A-002, LCO2018B-001, LCO2019-B004 (PI: Matheson). In CA19 we already showed how these data allowed us to identify two candidate standard DAWDs in the Northern hemisphere, namely SDSSJ203722.169-051302.964 and WD0554-165, as not stable. These were then excluded from our network of standards (CA19, NA19). This manuscript will illustrate the detailed analysis of the photometric monitoring data collected with LCO for all the candidate spectrophotometric standard DAWDs.
The structure of the paper is as follows. In §2 we present our sample of spectrophotometric standard DAWDs and in §3 we illustrate the time-monitoring observations and the photometric reduction procedures. In §4 we describe the variability analysis and §5 lists the details for each of the DAWDs. We summarize the results in §6. The Appendix shows the light curves for all the DAWDs observed with LCO and finding charts based on HST NIR images.
2 The candidate spectrophotometric standard stars
DAWDs were selected from the SDSS (Adelman-McCarthy et al., 2008; Girven et al., 2012; Kleinman et al., 2013) and the Villanova catalog (McCook & Sion, 1999) to uniformly cover the sky around the celestial equators and in the Northern hemisphere (Fig. 1). For more details on the selection of these stars we refer the reader to CA19. In the Southern hemisphere, there are relatively few faint WDs with prior spectroscopic identifications. Therefore, we relied on published lists of probable WDs based on color and proper motions selection such as those of Gentile Fusillo et al. (2017) and Raddi et al. (2016, 2017), to establish candidate stars with suitable brightness and celestial placement. These works used photometry collected with the Very Large Telescope Survey Telescope (VST) ATLAS and VPHAS surveys and proper motions from the Absolute Proper motions Outside the Plane (Qi et al., 2015, APOP) catalogue to identify WD candidates. For more details on the selection process please see the aforementioned manuscripts.
The original sample for the Northern hemisphere consisted of 23 DAWDs for which we presented the analysis of the HST photometry and ground-based spectroscopy in CA19. Of these, 19 DAWDs were established as standards in NA19. For the Southern hemisphere, we collected spectroscopy for a sample of 48 candidate DAWDs and selected 15 of them to be observed with HST and LCO. 13 of these will be established as standards in Axelrod et al..
Table 1 lists the 38 (23 + 15) DAWDs of the original sample, with HST, ground-based spectra and LCO observations, and provides their name (with the designation plus the 4 digits of Gaia Data Release 3 (DR3, Gaia Collaboration et al. 2022) and coordinates at epoch precessed to ), a new name for the 32 (19 + 13) stars established as spectrophotometric standards, the alternative name, and the IDs, coordinates, proper motions and photometry from Gaia DR3. Gaia magnitudes are provided to illustrate the brightness range of our candidate spectrophotometric standards. A discussion on the comparison between Gaia DR3 magnitudes and synthetic Gaia magnitudes derived for our entire sample of DAWDs is deferred to Axelrod et al..
We assigned new names to the 32 established spectrophotometric standard DAWDs: these are composed of the White Dwarf Flux Standard (WDFS) designation and 4 digits of the and 2 of the coordinates from Gaia DR3 as their ID number. The new names are listed in the third column of Table 1.
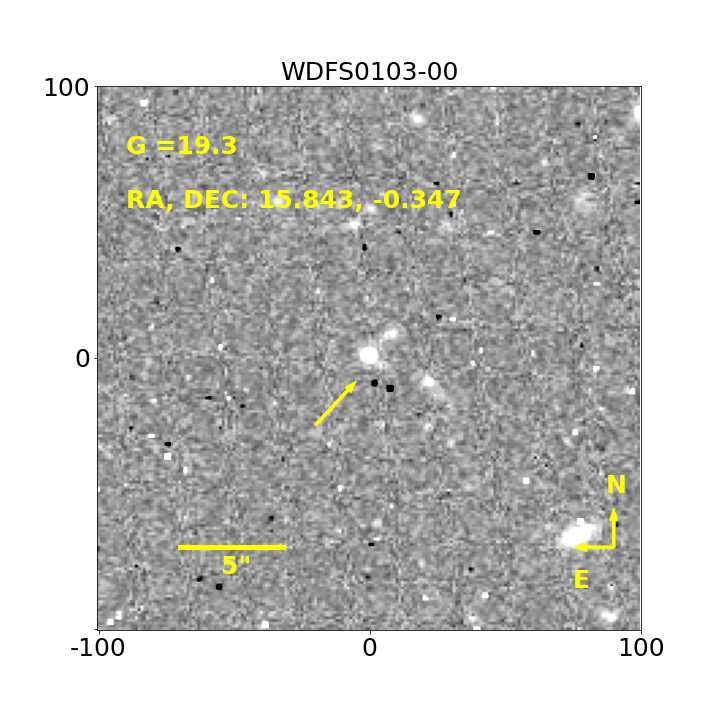
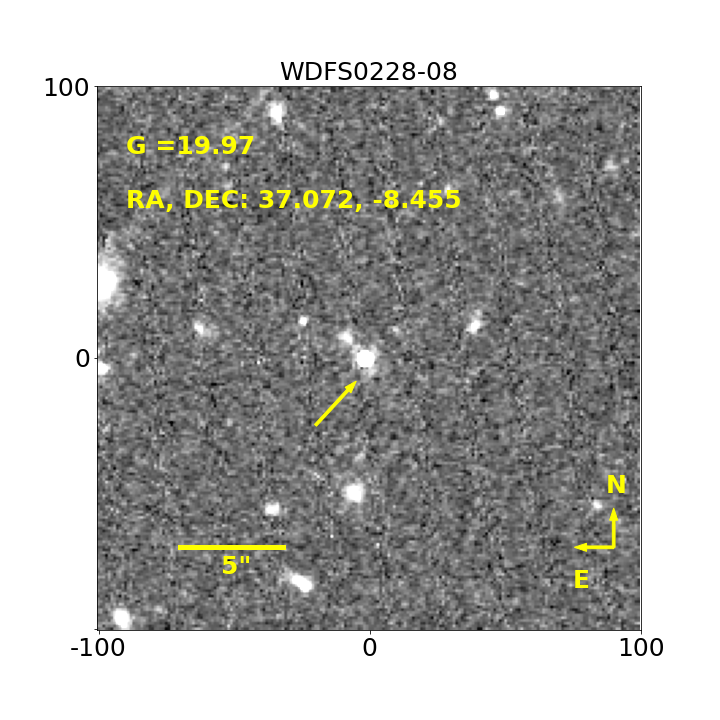
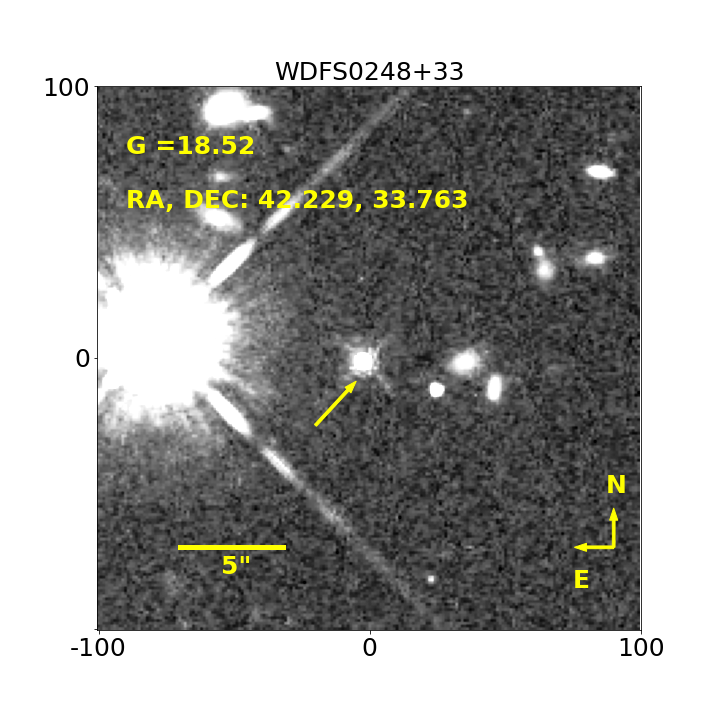
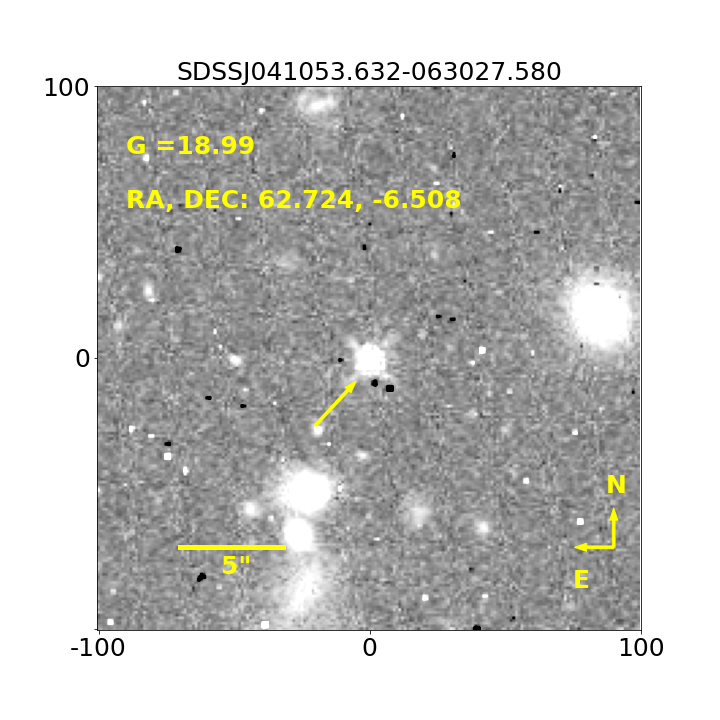
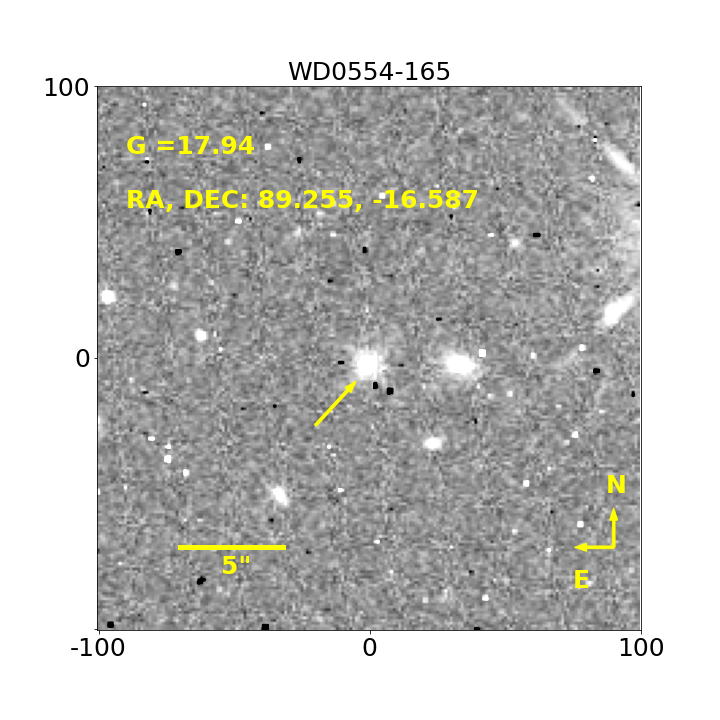
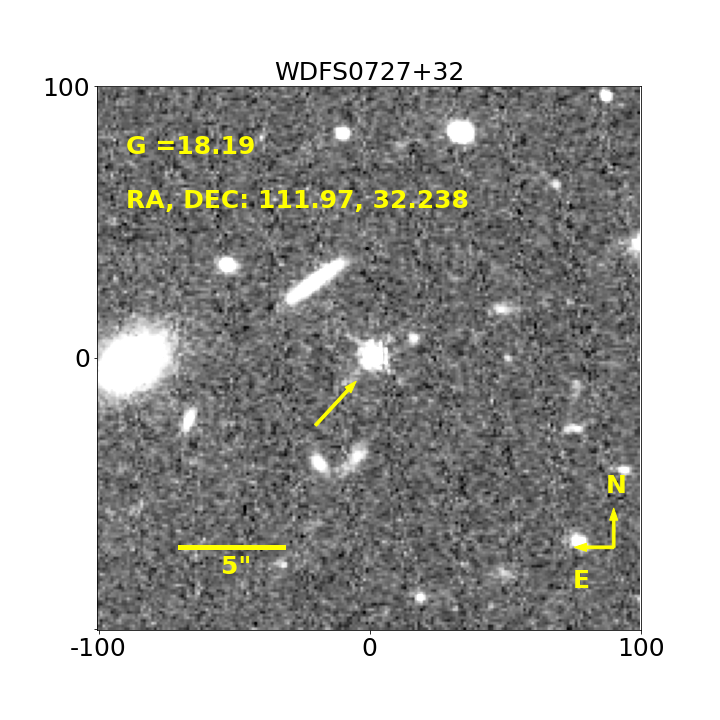
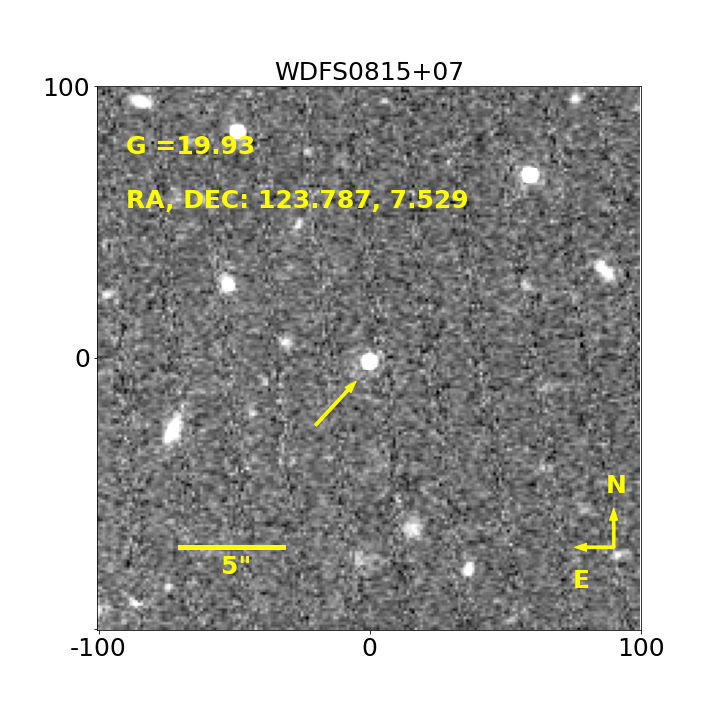
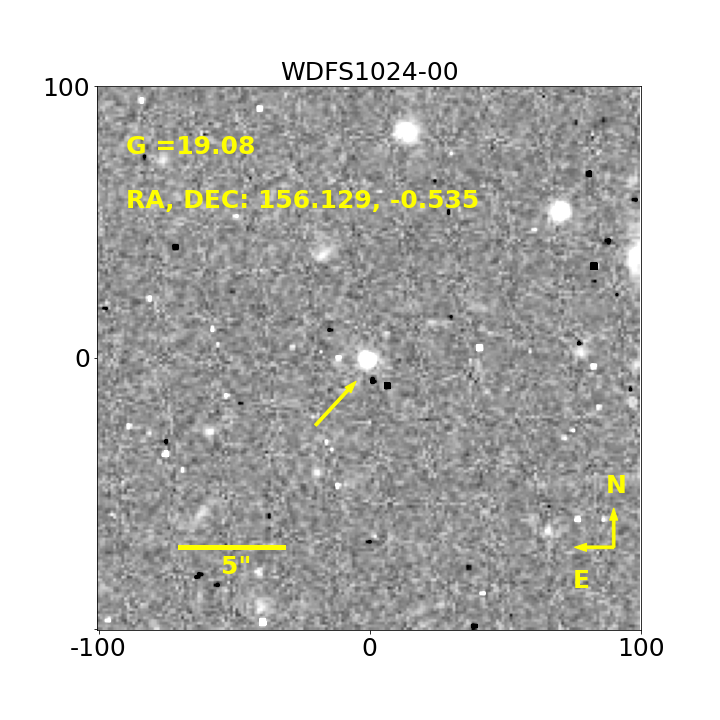
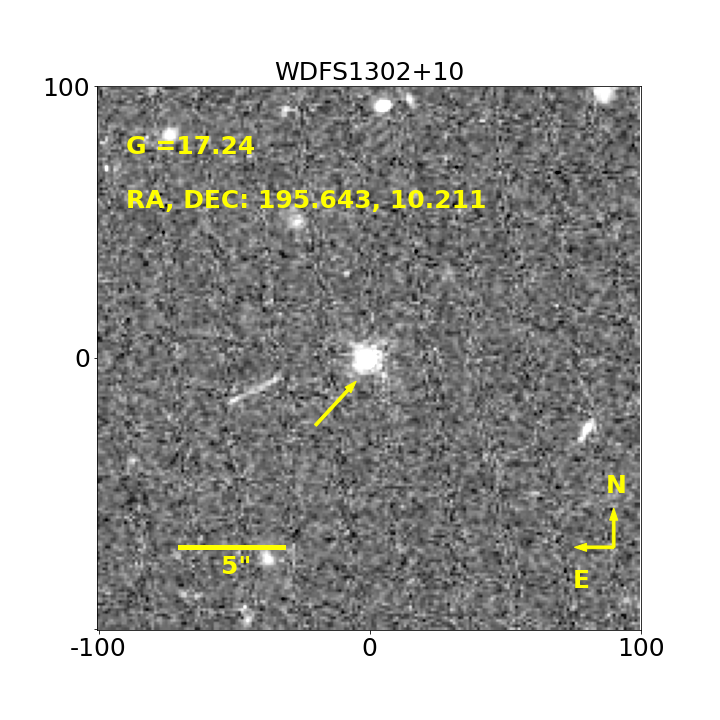
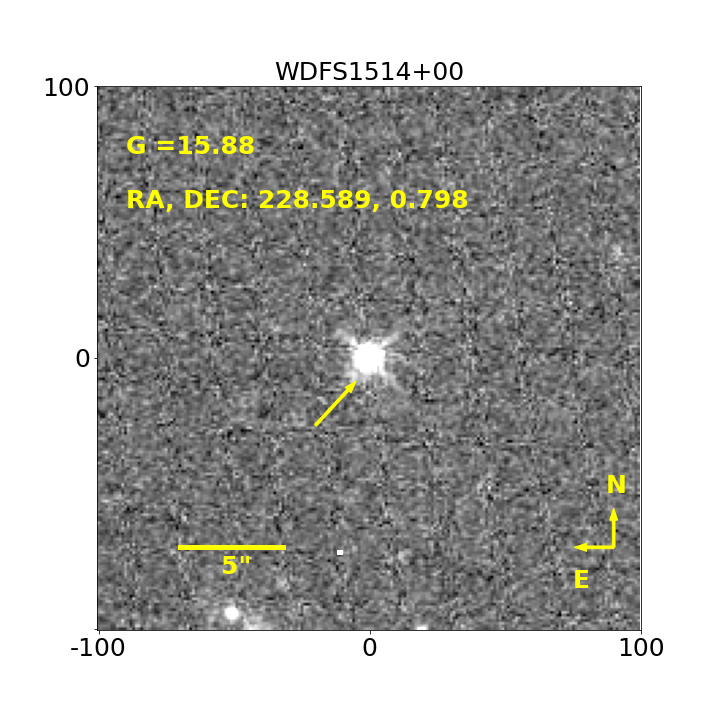
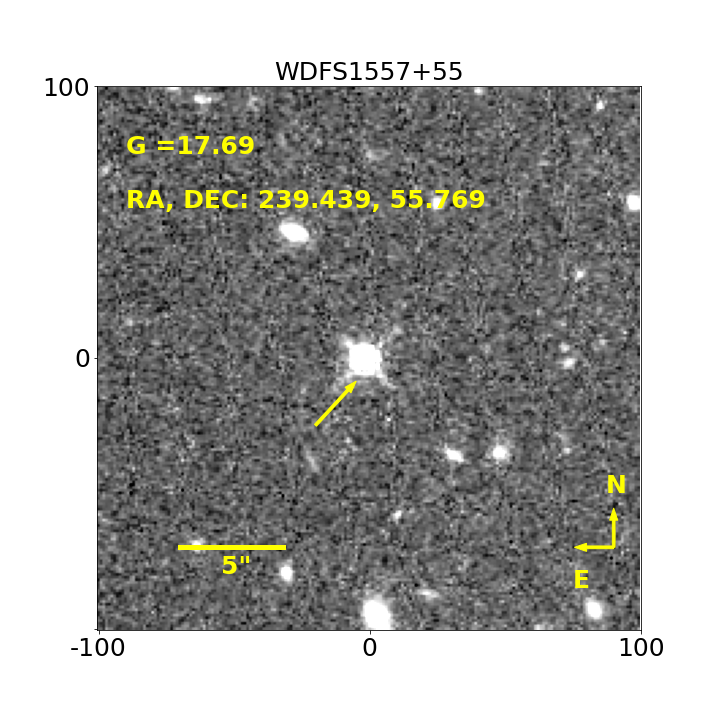
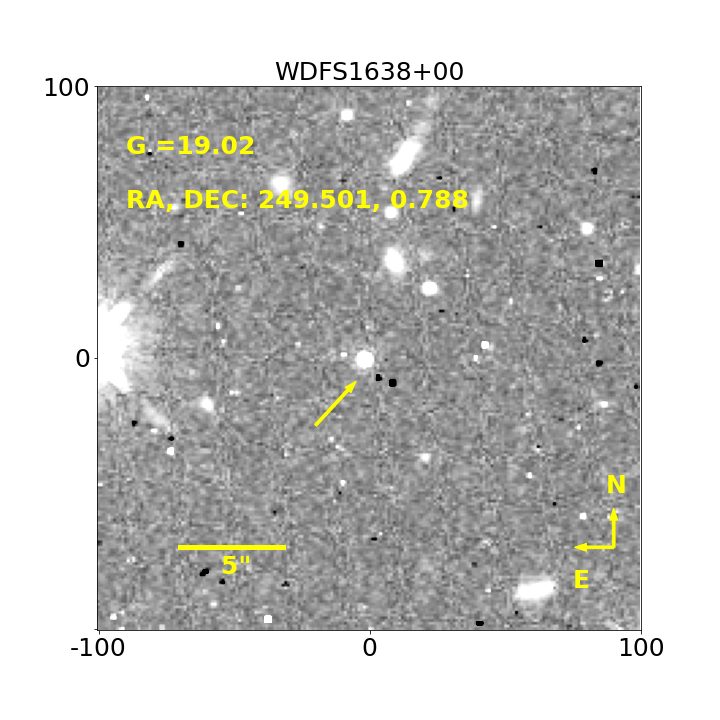
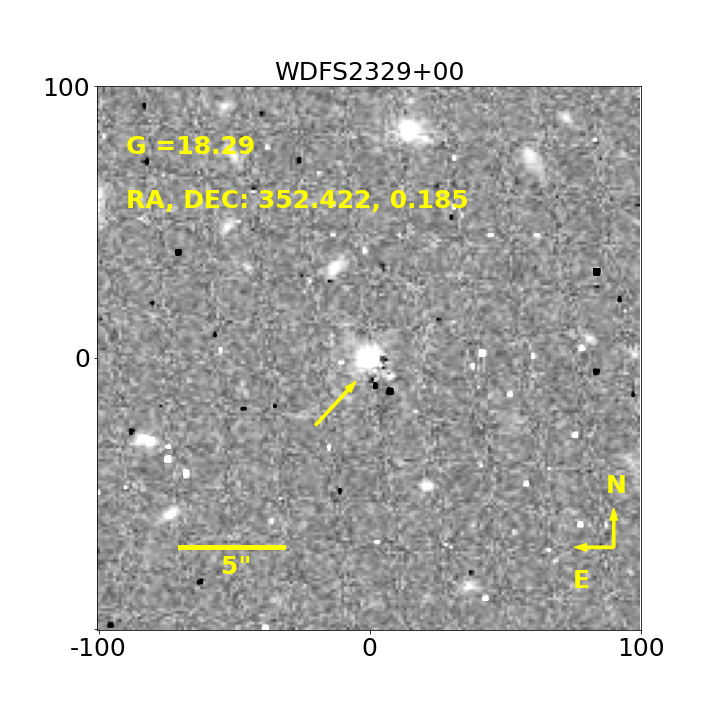
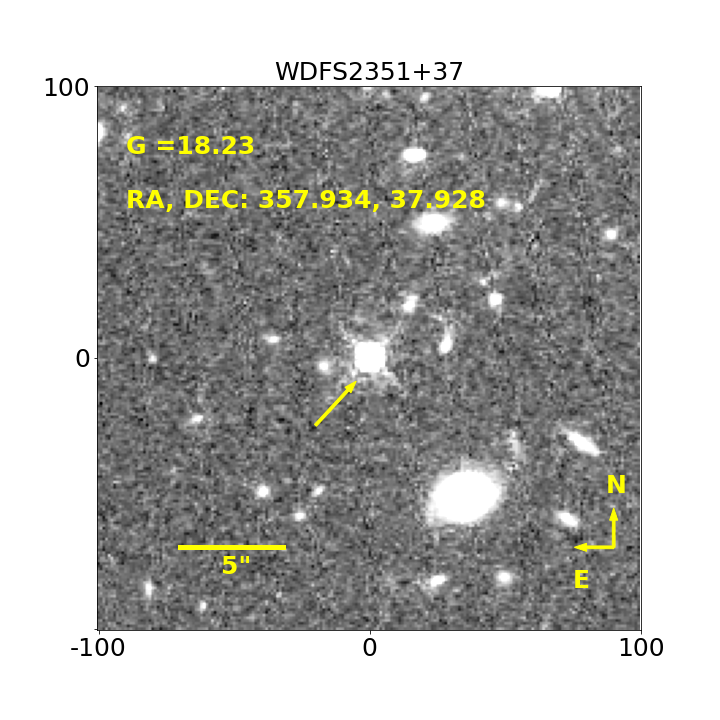
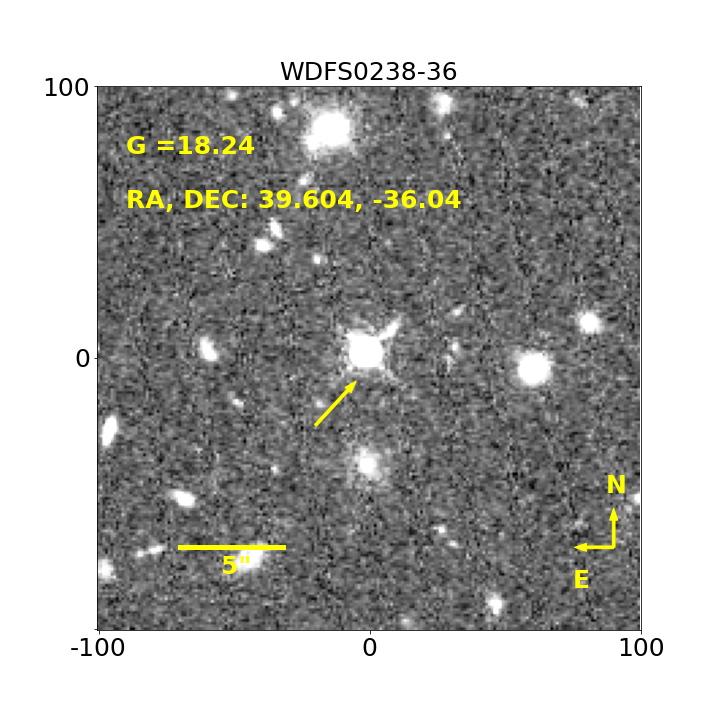
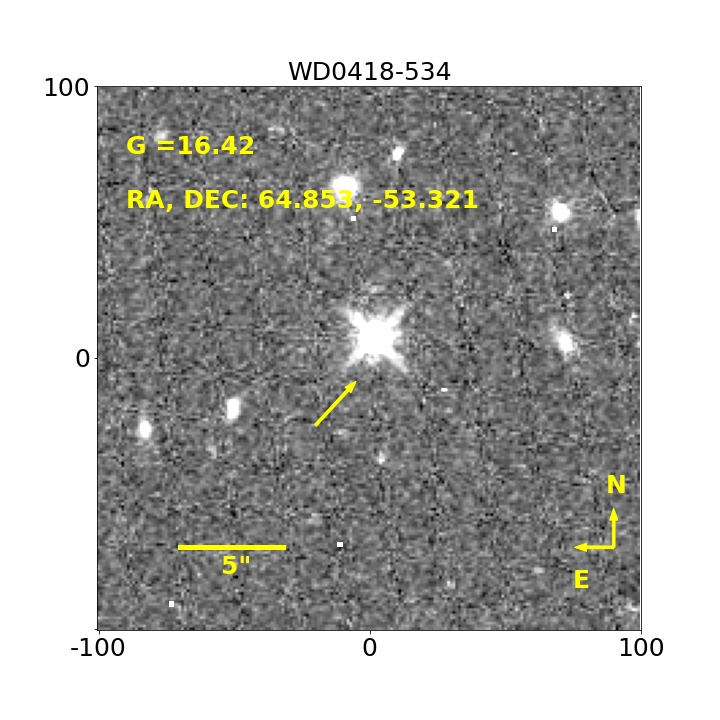
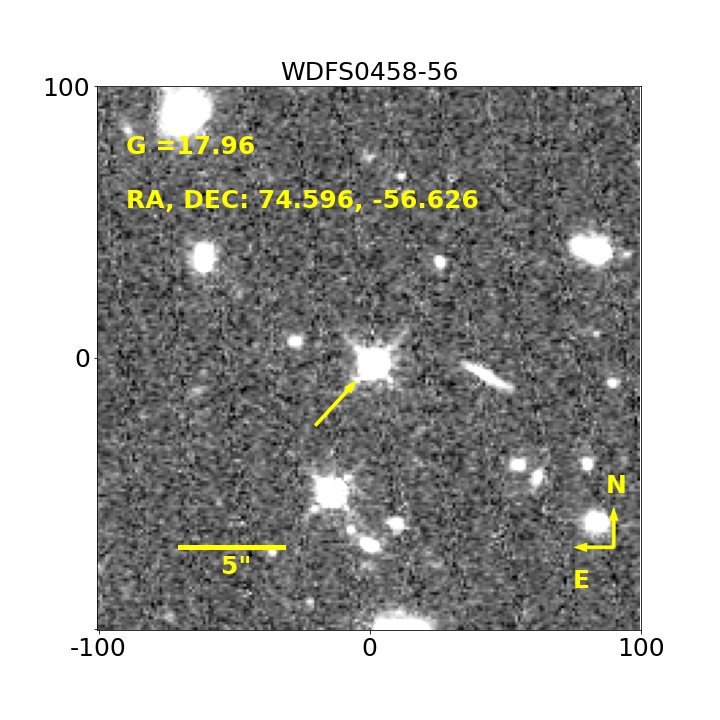
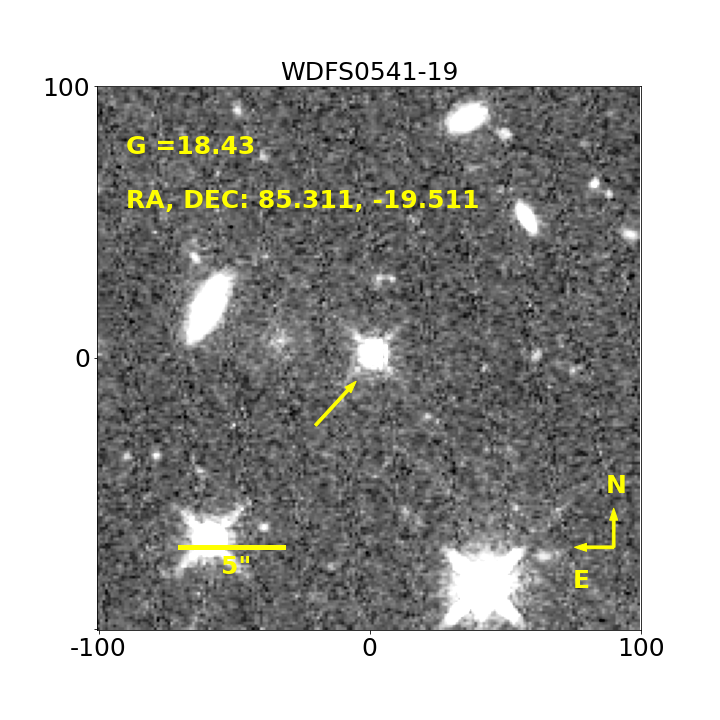
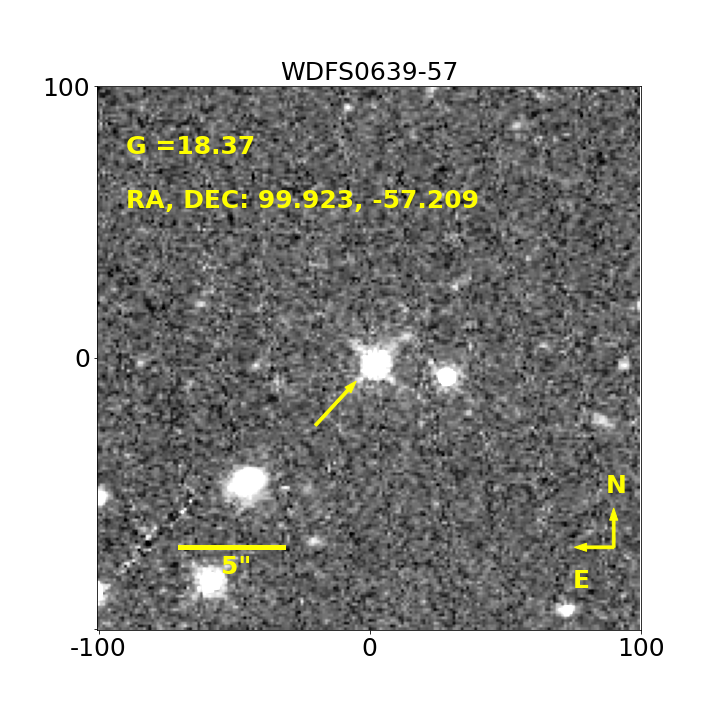
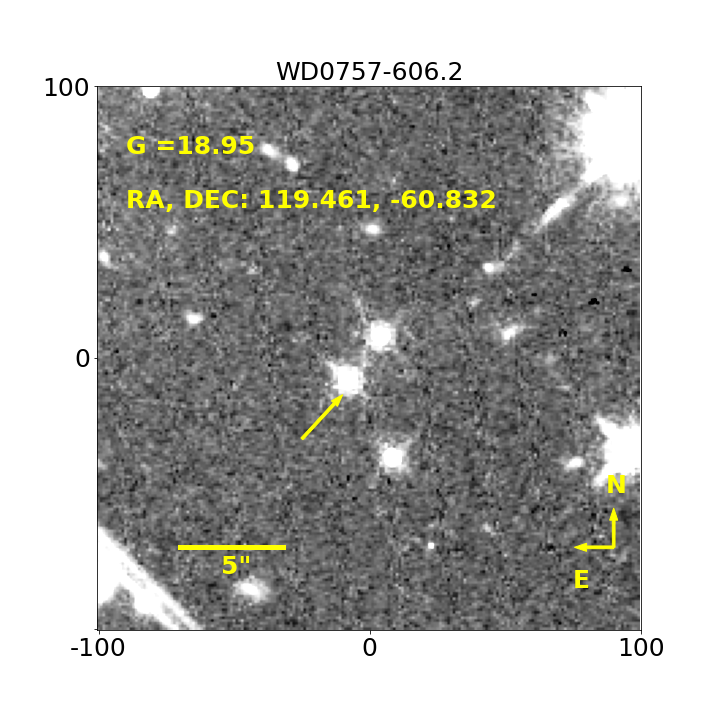
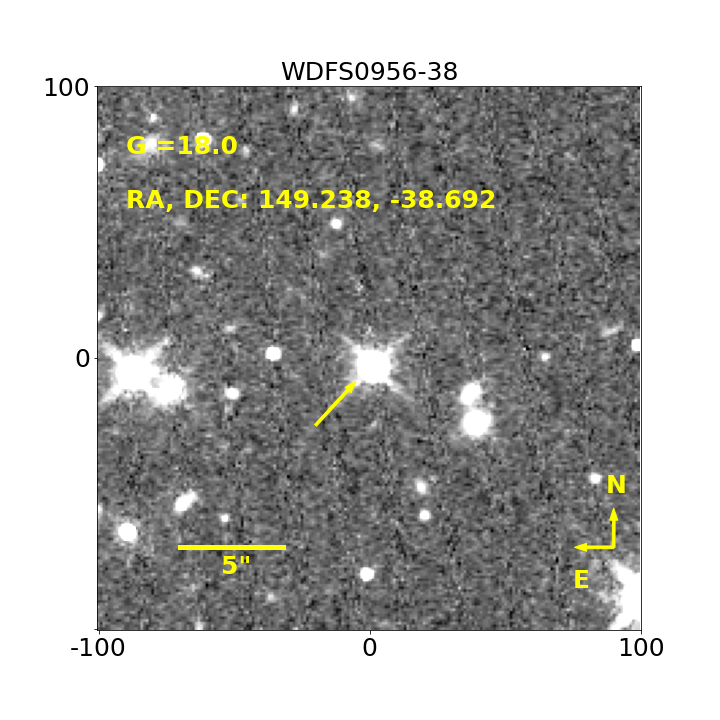
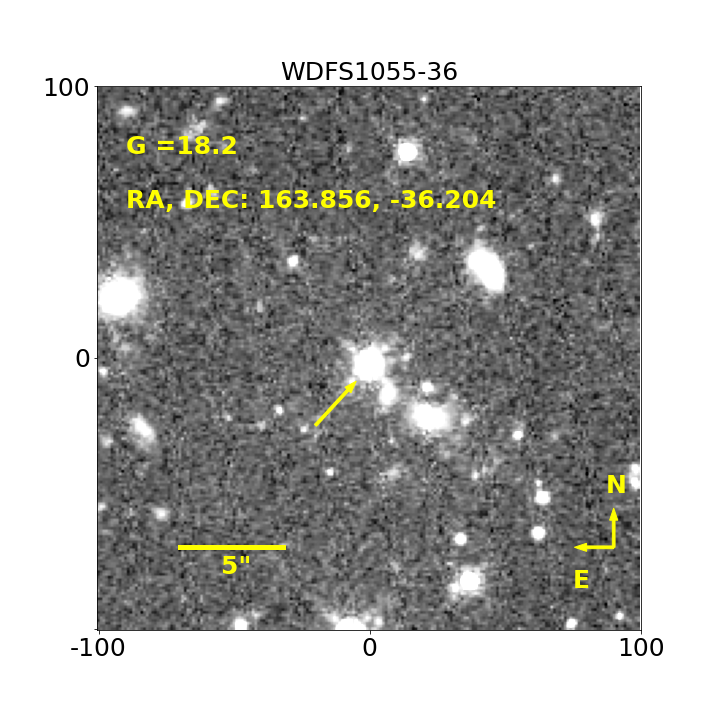
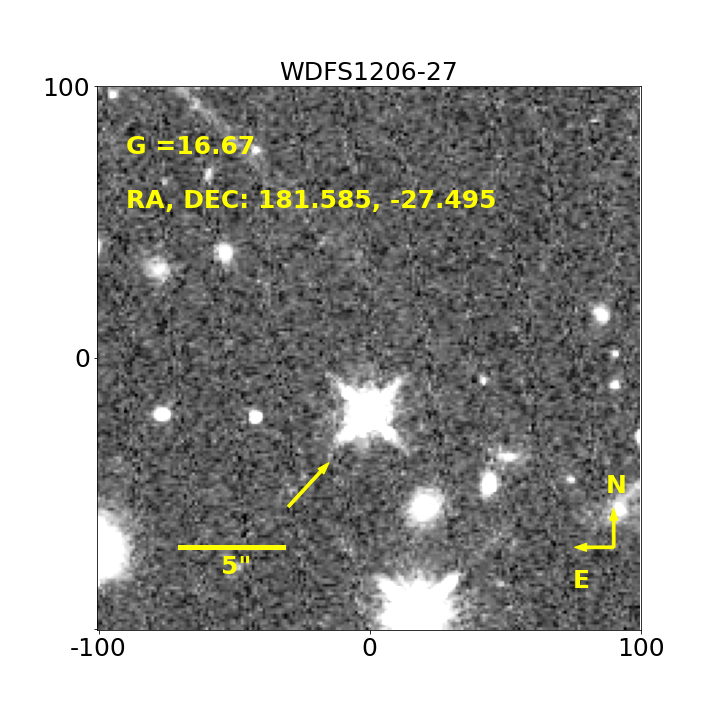
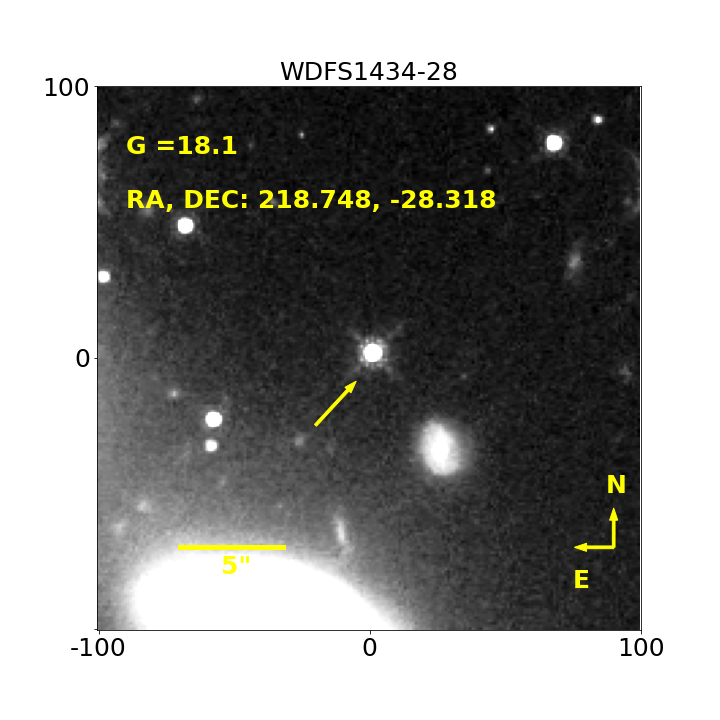
In the Appendix we provide finding charts for all the 38 DAWDs. These are based on HST images collected in the filter during our observing programs. We selected this filter since some possibly contaminant faint red sources become visible in the infrared regime.
2.1 Spectroscopy of the candidate spectrophotometric DAWDs
Spectra of the Northern sample of DAWDs were collected with the Gemini Multi-Object Spectrograph (GMOS, Hook et al., 2004) mounted on the Gemini North and South telescopes. However, due to issues with the quality of the GMOS spectra, further observations were collected with the Blue Channel spectrograph at the MMT Observatory. Details on these data and their reduction and analysis were presented in CA19.
Spectra of 48 Southern candidate WDs were obtained with the Goodman spectrograph (Clemens et al., 2004) on the 4m-SOAR telescope (NOIRLab). Exposures were collected for each star and some were observed multiple times between 2016 February and 2017 February. The log of the observations is provided in Table 2 and includes the star name (with the designation plus the 4 digits of Gaia DR3 and ), the alternative name, Gaia DR3 IDs and coordinates.
All the spectra were visually inspected and non-DA WD stars and stars with obvious spectroscopic peculiarities or magnetic activity were rejected. We ended up with 15 candidate spectrophotometric standard DAWDs that we observed with WFC3/HST and monitored for stability with LCO.
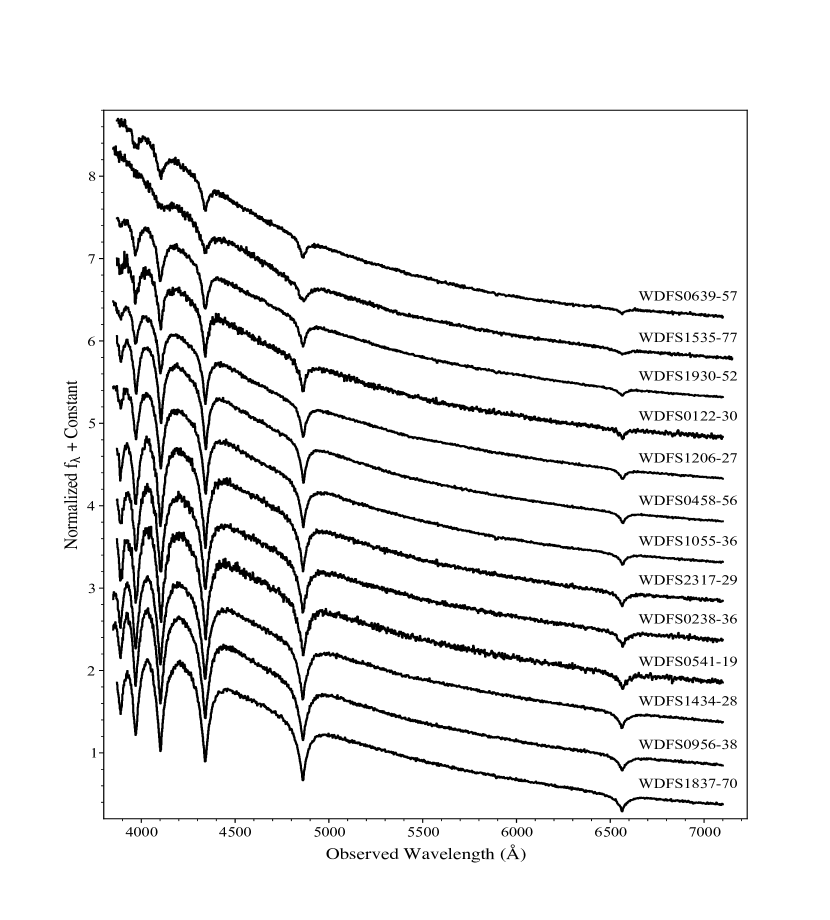
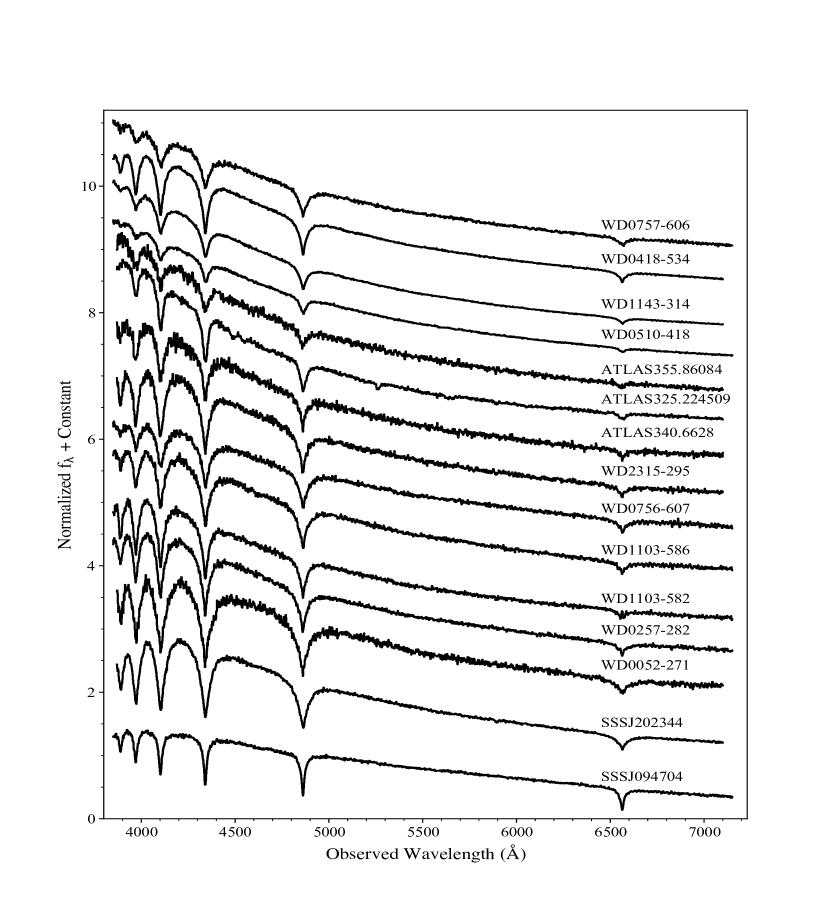
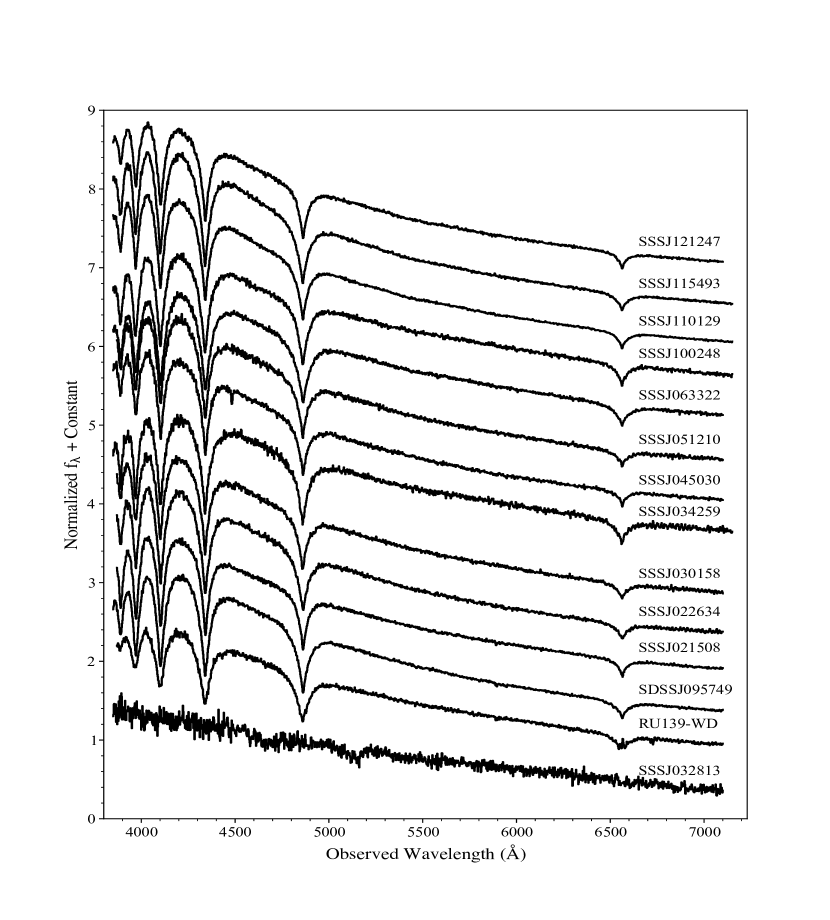
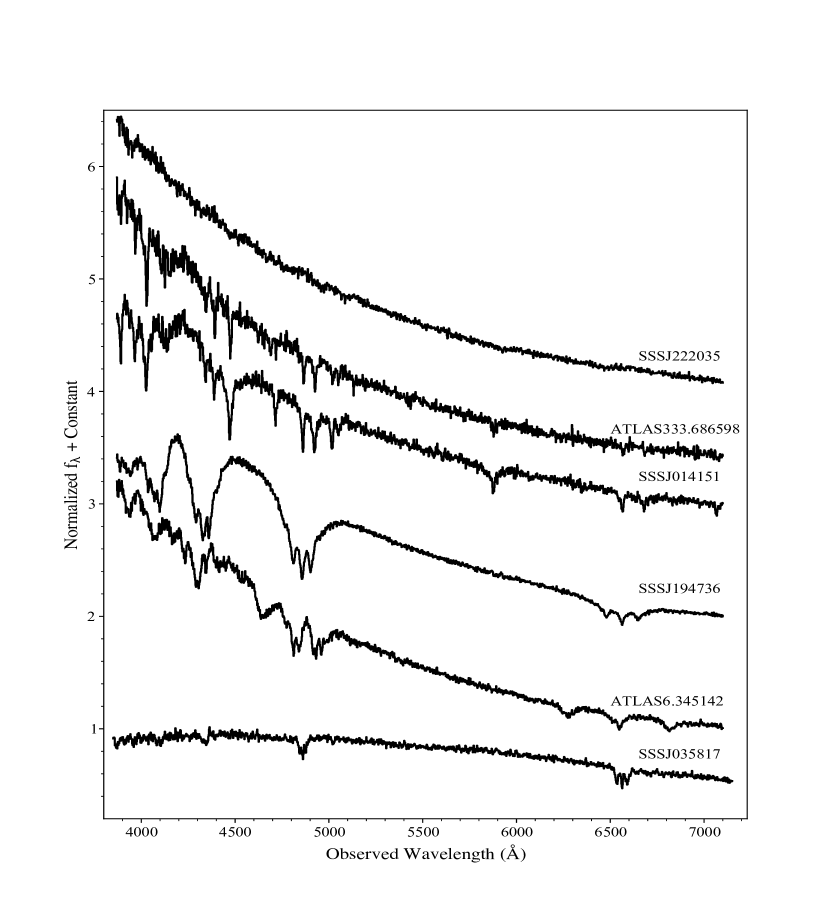
For the SOAR spectroscopic observations, we used the 107 slit, oriented at the parallactic angle, where possible. Spectra were reduced and processed by following the same technique used for the Northern DAWD sample as described in CA19. The final spectra have a typical range of 3850Å to 7100Å with an intrinsic dispersion of 1.99Å per pixel, re-binned to 2Å per pixel for the final spectra. Figs. 2, 3, 4, 5 show the spectra of all the candidate WDs that were observed in the Southern hemisphere. The first figure shows the 13 DAWDs with HST and LCO observations that were established as spectrophotometric standards, while the other three figures show objects that were discarded for various reasons. In particular, Fig. 5 displays six objects with unusual spectra: the top plot shows a strong blue featureless spectrum, possibly a hot DC WD, while the second and third ones are blue He-rich spectra, possibly DB degenerates. The remaining spectra in the figure show Zeeman splitting of the Balmer lines indicating magnetic degenerates.
| Star | Alternative name | Gaia DR3 ID | RAaaCoordinates are from Gaia DR3 at epoch precessed to , no proper motion applied. To get current coordinates apply the proper motions from 2016 and precess. | DECaaCoordinates are from Gaia DR3 at epoch precessed to , no proper motion applied. To get current coordinates apply the proper motions from 2016 and precess. | UT Date | Range | P.A. | Air. | Flux Std. | Exp. |
|---|---|---|---|---|---|---|---|---|---|---|
| (hh:mm:ss.s) | (dd:mm:ss.s) | (Å) | (∘) | (s) | ||||||
| J0122-3052 | ATLAS020.503022 | 5028544686500198144 | 01:22:00.725 | -30:52:03.950 | 2016-10-07 | 3870-7100 | 263.0 | 1.1 | Feige110 | 4x900 |
| J2140-3231 | ATLAS325.224509-32.5 | 6592388973858801920 | 21:40:53.887 | -32:31:17.381 | 2016-10-05 | 3870-7100 | 90.0 | 1.1 | Feige110 | 3x900 |
| J2214-2954 | ATLAS333.686598 | 6614900207422023168 | 22:14:44.788 | -29:54:37.641 | 2016-10-06 | 3870-7100 | 261.0 | 1.1 | Feige110 | 900 |
| J2242-2913 | ATLAS340.6628 | 6608532725132112768 | 22:42:39.087 | -29:13:16.348 | 2016-10-07 | 3870-7100 | 260.0 | 1.1 | Feige110 | 4x900 |
| J2343-3732 | ATLAS355.86084 | 6538080044408150784 | 23:43:26.600 | -37:32:36.724 | 2016-10-06 | 3870-7100 | 60.0 | 1.0 | Feige110 | 4x900 |
| J0025-2840 | ATLAS6.345142 | 2321781186172842624 | 00:25:22.838 | -28:40:33.944 | 2016-10-06 | 3870-7100 | 100.0 | 1.1 | Feige110 | 3x900 |
| J1800-2332 | RU139-WD | 4069124858877707776 | 18:00:42.030 | -23:32:38.652 | 2016-10-05 | 3870-7100 | 112.0 | 1.3 | Feige110 | 4x900 |
| J0141-6140 | SSSJ014151 | 4712803636068739456 | 01:41:51.827 | -61:40:48.350 | 2016-10-07 | 3870-7100 | 298.0 | 1.3 | Feige110 | 900 |
| J0215-6127 | SSSJ021508 | 4713619542415902336 | 02:15:08.335 | -61:27:30.571 | 2016-10-05 | 3870-7100 | 321.0 | 1.2 | Feige110 | 4x900 |
| J0226-2214 | SSSJ022634 | 5120586282330070784 | 02:26:34.644 | -22:14:22.824 | 2016-10-06 | 3870-7100 | 130.0 | 1.0 | Feige110 | 3x900 |
| J0238-3602 | SSSJ023824 | 4953936951336477440 | 02:38:24.969 | -36:02:23.222 | 2016-10-07 | 3870-7100 | 273.0 | 1.1 | Feige110 | 4x900 |
| J0301-2450 | SSSJ030158 | 5074738090560529792 | 03:01:58.400 | -24:50:44.068 | 2016-10-07 | 3870-7100 | 243.0 | 1.0 | Feige110 | 3x900 |
| J0328-2839 | SSSJ032813 | 5056979122346336384 | 03:28:13.113 | -28:39:25.621 | 2017-02-22 | 3850-7100 | 102.0 | 1.3 | Feige67 | 1000 |
| J0358-7559 | SSSJ035817 | 4628635093249821952 | 03:58:17.886 | -75:59:29.089 | 2016-10-07 | 3870-7100 | 243.0 | 1.0 | Feige110 | 3x900 |
| J0343-2556 | SSSJ034259 | 5082086886979911424 | 03:43:04.171 | -25:56:55.110 | 2016-02-12 | 3850-7150 | 60.0 | 1.1 | Feige67 | 2x900 |
| J0343-2556 | SSSJ034259 | 5082086886979911424 | 03:43:04.171 | -25:56:55.110 | 2016-02-12 | 3850-7150 | 60.0 | 1.2 | Feige67 | 3x1200 |
| J0358-7559 | SSSJ035817 | 4628635093249821952 | 03:58:17.886 | -75:59:29.089 | 2016-02-11 | 3850-7150 | 58.0 | 1.5 | Feige67 | 2x1200 |
| J0450-2846 | SSSJ045030 | 4879984623886489600 | 04:50:30.966 | -28:46:02.222 | 2017-02-23 | 3850-7100 | 100.0 | 1.1 | GD71 | 2x1200 |
| J0458-5637 | SSSJ045822 | 4764189621230467584 | 04:58:23.133 | -56:37:33.434 | 2016-10-06 | 3870-7100 | 339.0 | 1.1 | Feige110 | 3x900 |
| J0458-5637 | SSSJ045822 | 4764189621230467584 | 04:58:23.133 | -56:37:33.434 | 2017-02-22 | 3850-7100 | 58.0 | 1.2 | Feige67 | 3x1000 |
| J0512-3112 | SSSJ051210 | 4827685043344935168 | 05:12:10.898 | -31:12:59.861 | 2016-10-05 | 3870-7100 | 265.0 | 1.1 | Feige110 | 5x900 |
| J0541-1930 | SSSJ054114 | 2967083052984612736 | 05:41:14.759 | -19:30:38.896 | 2016-10-07 | 3870-7100 | 244.0 | 1.2 | Feige110 | 3x900 |
| J0633-7858 | SSSJ063322 | 5211173052478517120 | 06:33:22.458 | -78:58:19.125 | 2017-02-22 | 3850-7100 | 31.0 | 1.6 | Feige67 | 3x1200 |
| J0639-5712 | SSSJ063941 | 5484605140287436416 | 06:39:41.468 | -57:12:31.164 | 2016-10-07 | 3870-7100 | 303.0 | 1.2 | Feige110 | 3x900 |
| J0639-5712 | SSSJ063941 | 5484605140287436416 | 06:39:41.468 | -57:12:31.164 | 2017-02-23 | 3850-7100 | 24.0 | 1.2 | GD71 | 3x1200 |
| J0947-8458 | SSSJ094704 | 5191604494282635136 | 09:47:02.983 | -84:58:39.558 | 2016-02-10 | 3850-7150 | 5.0 | 1.7 | Feige67 | 4x1200 |
| J0956-3841 | SSSJ095657 | 5421579652019276160 | 09:56:57.009 | -38:41:30.269 | 2017-02-22 | 3850-7100 | 334.0 | 1.0 | Feige67 | 3x1200 |
| J0957-0019 | SSSJ095749 | 3833430797566676352 | 09:57:49.372 | -00:19:49.381 | 2017-02-23 | 3850-7100 | 136.0 | 1.5 | GD71 | 3x1200 |
| J1002-8031 | SSSJ100248 | 5201701240840634624 | 10:02:49.314 | -80:31:10.614 | 2016-02-12 | 3850-7150 | 348.0 | 1.6 | Feige67 | 2x1200 |
| J1002-8031 | SSSJ100248 | 5201701240840634624 | 10:02:49.314 | -80:31:10.614 | 2016-02-12 | 3850-7150 | 30.0 | 1.6 | Feige67 | 2x900 |
| J1055-3612 | SSSJ105525 | 5401230062610609920 | 10:55:25.356 | -36:12:14.731 | 2017-02-23 | 3850-7100 | 11.0 | 1.0 | GD71 | 3x1200 |
| J1101-3621 | SSSJ110129 | 5400333861851343616 | 11:01:29.850 | -36:21:04.362 | 2017-03-18 | 3850-7150 | 75.0 | 1.1 | … | 2x1200 |
| J1159-5008 | SSSJ115943 | 5370694601787409152 | 11:59:43.451 | -50:08:18.370 | 2017-03-18 | 3850-7150 | 334.0 | 1.1 | … | 2x1200 |
| J1212-4029 | SSSJ121247 | 6149314478246925056 | 12:12:47.130 | -40:29:46.827 | 2017-02-22 | 3850-7100 | 295.0 | 1.1 | Feige67 | 3x1200 |
| J1434-2819 | SSSJ143459 | 6222123588482712832 | 14:34:59.528 | -28:19:03.295 | 2017-02-22 | 3850-7100 | 257.0 | 1.1 | Feige67 | 3x1200 |
| J1837-7002 | SSSJ183717 | 6431766714636858240 | 18:37:17.906 | -70:02:52.513 | 2016-10-06 | 3870-7100 | 44.0 | 1.4 | Feige110 | 3x900 |
| J1930-5203 | SSSJ193018 | 6646236009641999488 | 19:30:18.995 | -52:03:46.550 | 2016-10-06 | 3870-7100 | 64.0 | 1.2 | Feige110 | 3x900 |
| J1947-3100 | SSSJ194736 | 6751474223204472576 | 19:47:36.361 | -31:00:39.385 | 2016-10-04 | 3870-7100 | 95.0 | 1.1 | Feige110 | 3x900 |
| J2023-4015 | SSSJ202344 | 6680866227868812288 | 20:23:44.526 | -40:15:21.092 | 2016-10-06 | 3870-7100 | 84.0 | 1.2 | Feige110 | 3x900 |
| J2220-4645 | SSSJ222035 | 6518394383932274432 | 22:20:36.053 | -46:45:52.384 | 2016-10-06 | 3870-7100 | 60.0 | 1.1 | Feige110 | 900 |
| J0054-2650 | WD0052-271 | 2344195005582967040 | 00:54:57.994 | -26:50:23.221 | 2016-10-05 | 3870-7100 | 106.0 | 1.0 | Feige110 | 3x900 |
| J0259-2805 | WD0257-282 | 5071554695160551040 | 02:59:23.254 | -28:05:33.327 | 2016-02-11 | 3850-7150 | 105.0 | 1.2 | Feige67 | 3x1200 |
| J0419-5319 | WD0418-534 | 4779427928974390272 | 04:19:24.680 | -53:19:16.659 | 2017-02-22 | 3850-7100 | 62.0 | 1.2 | Feige67 | 3x600 |
| J0512-4145 | WD0510-418 | 4812859061053900928 | 05:12:23.053 | -41:45:26.057 | 2016-02-10 | 3850-7150 | 40.0 | 1.0 | Feige67 | 4x600 |
| J0757-6054 | WD0756-607 | 5290719287073728128 | 07:57:03.112 | -60:54:52.622 | 2016-02-11 | 3850-7150 | 27.0 | 1.2 | Feige67 | 3x1200 |
| J0757-6049 | WD0757-606.2 | 5290720695823013376 | 07:57:50.637 | -60:49:54.634 | 2016-02-10 | 3850-7150 | 338.0 | 1.2 | Feige67 | 4x1200 |
| J1105-5852 | WD1103-586.1 | 5338652084186678400 | 11:05:35.811 | -58:52:26.385 | 2016-02-11 | 3850-7150 | 345.0 | 1.2 | Feige67 | 3x1200 |
| J1105-5829 | WD1103-582 | 5340167657872411520 | 11:05:53.071 | -58:29:31.090 | 2016-02-10 | 3850-7150 | 8.0 | 1.2 | Feige67 | 4x1200 |
| J1146-3141 | WD1143-314 | 3479327447141240320 | 11:46:18.107 | -31:41:01.612 | 2016-02-11 | 3850-7150 | 85.0 | 1.0 | Feige67 | 3x600 |
| J1146-3141 | WD1143-314 | 3479327447141240320 | 11:46:18.107 | -31:41:01.612 | 2017-02-23 | 3850-7100 | 96.0 | 1.2 | GD71 | 2x420 |
| J1206-2729 | WD1203-272 | 3486471764460448512 | 12:06:20.354 | -27:29:40.639 | 2016-02-11 | 3850-7150 | 105.0 | 1.0 | Feige67 | 3x600 |
| J1206-2729 | WD1203-272 | 3486471764460448512 | 12:06:20.354 | -27:29:40.639 | 2017-02-22 | 3850-7100 | 103.0 | 1.1 | Feige67 | 2x300 |
| J1535-7724 | WD1529-772 | 5779908502946006784 | 15:35:45.179 | -77:24:44.832 | 2016-02-12 | 3850-7150 | 320.0 | 1.6 | Feige67 | 2x900 |
| J2317-2903 | WD2314-293 | 2378059688840742912 | 23:17:20.294 | -29:03:21.647 | 2016-10-05 | 3870-7100 | 81.0 | 1.0 | Feige110 | 3x900 |
| J2317-2918 | WD2315-295 | 2330002990527676800 | 23:17:58.479 | -29:18:19.535 | 2016-10-07 | 3870-7100 | 261.0 | 1.1 | Feige110 | 3x900 |
Note. — Every row corresponds to a different visit. Observations are sorted by survey and by increasing values.
2.2 Stability of the spectrophotometric standard DAWDs
In order to assess the DAWDs as stable standards we monitored them by collecting time-spaced data with the LCO network of telescopes. WDs can vary due to several reasons, depending on their effective temperature, atmosphere abundance and presence of magnetic activity or of an unseen faint companion star.
Hydrogen-rich atmosphere WDs might present gravity-mode pulsations around 12,000 K (Fontaine & Brassard, 2008, ZZ Ceti pulsators). Our DAWDs were selected to have temperatures ( 20,000 K) outside the ZZ Ceti instability strip, so we do not expect them to be pulsators (note that SDSSJ172135.97+294016.0 was removed from the network of standards as its temperature is = 9,261 K, see CA19, NA19). Strong magnetic fields can also cause flux variations in WDs with a time scale from hours to days. These variations can be due to magnetically confined ”spots” of higher opacity modulating the stellar flux via stellar rotation (Dupuis et al., 2000; Holberg & Howell, 2011). Alternately, magnetic variations can be due to spots in the convective atmosphere (Brinkworth et al., 2004, 2013). However, our candidate standard DAWDs have effective temperatures above 20,000 K, and their atmosphere are fully radiative, so they should not vary due to the presence of spots. Furthermore, we excluded candidates with spectra showing Zeeman splitting of the Balmer lines indicative of the presence of a strong magnetic field (see Fig. 5).
On the other hand, the selected DAWDs could still vary due to the presence of an unseen faint companion star, for example, and we need to characterize the amount of flux variation, if present, before setting these stars as spectrophotometric standards.
A study by Hermes et al. (2017), based on precise Kepler time-series photometry, showed that 97% of apparently isolated WDs are stable, or show less than 1% flux variations, and they can be used as spectrophotometric standards. Hermes et al. sample included mostly DAWDs but also several helium- or carbon-dominated atmosphere WDs, with temperatures hotter than 8,000 K.
By comparing observations and binary population synthesis models, Toonen et al. (2017) studied the binarity of the almost complete local WD sample ( 20 pc). Assuming an initial binary fraction of 50%, these models show that most systems undergo a common envelope phase and subsequent merger with the final outcome of 70-80% of WDs being isolated. The remaining fraction of systems are probably on a wide orbit, as these binaries can more easily avoid the common envelope-merger phase, and can be observed as resolved binaries. These systems are usually separated by a few arcseconds. Our DAWDs are more distant than the local sample, 100 1000 pc, but WFC3 detectors’ spatial resolution would easily allow us to resolve the companions (pixel scales of 004 and 013 for the UVIS and the IR camera, respectively, resulting in separations of more than a dozen pixels in both cases). The same models from Toonen et al. (2017) predict a fraction of 0.5-1% of unresolved binaries. For most of these, the companion would be identified through spectroscopy, such as for SDSSJ203722.169-051302.964, where spectra showed an emission feature in the cores of the Balmer absorption lines, probably the result of a low-luminosity companion or some other activity associated with the DAWD. The variability of this star was also confirmed by the analysis of the LCO time-spaced observations (see discussion in §4). However, if the companion to the DAWD is a faint red dwarf, then current spectroscopy is not able to detect it, and not even imaging at the spatial resolution of HST. That is why we started a photometric monitoring campaign.
On the basis of the criteria used to select our set of DAWDs and the evidence from the WFC3 and spectroscopic data, we do not expect a large fraction of our candidate spectrophotometric standards to vary. However, these DAWDs have not yet been subject to a consistent and well-defined observational campaign to demonstrate a lack of variability at a wide range of time scales. WFC3 observations are obtained within a short time frame for each target, and so they are unsuitable as tests of variation. Ground-based surveys (SDSS, PanSTARRS, ATLAS) and space facilities (Kepler, TESS) also do not have the necessary temporal coverage or spatial resolution, and Gaia does not provide variability constraints on these stars yet.
3 Time-spaced observations
Time-spaced data for 23 candidate spectrophotometric standard DAWDs in the Northern hemisphere and around the celestial equators were collected with LCO starting in the fall of 2016 until the summer of 2017, for a total of 1 year of observations444LCO2016B-007 and LCO2017AB-002 (PI: Matheson). A few exposures were also collected in the first semester of 2018555LCO2018A-002 (PI: Matheson), to add more epochs to some targets. Observations for the 15 candidates in the Southern hemisphere were collected in a semester in 2018 and one in 2019666LCO2018B-001 and LCO2019-B004 (PI: Matheson).
Data consist of a sequence of exposures in the Sloan filter, separated by minutes up to a month in time. A minimum of 20 exposures for each target were collected, spread over 2-3 months at different time intervals, for a total of 1,400 images. The log of the observations is shown in Table 3.
In order to schedule our observations at the LCO observatory, we developed a python routine that calculates the observing window for each star on the different network telescopes during a selected semester and the optimal exposure time to reach a 100. This code is available on Github at the following URL777https://github.com/gnarayan/LCO_scheduler.
| Star | CodeaaTelescope code | RAbbCoordinates are at epoch J2000. | DECbbCoordinates are at epoch J2000. | MJD | Exposure time |
|---|---|---|---|---|---|
| (hh:mm:ss.s) | (dd:mm:ss.s) | (s) | |||
| WDFS1314-03 | fl15 | 13:14:45.050 | -03:14:15.64 | 57832.3508 | 304 |
| WDFS1314-03 | fl06 | 13:14:45.050 | -03:14:15.64 | 57832.1 | 304 |
| WDFS1314-03 | fl06 | 13:14:45.047 | -03:14:15.65 | 57960.7696 | 423 |
| WDFS1314-03 | fl04 | 13:14:45.050 | -03:14:15.64 | 57832.2853 | 304 |
| WDFS1314-03 | fl04 | 13:14:45.050 | -03:14:15.64 | 57832.2163 | 304 |
| WDFS1314-03 | fl14 | 13:14:45.050 | -03:14:15.64 | 57842.9781 | 304 |
| WDFS1314-03 | fl03 | 13:14:45.047 | -03:14:15.65 | 58143.3084 | 349 |
| WDFS1314-03 | fl03 | 13:14:45.047 | -03:14:15.65 | 58160.2109 | 349 |
| WDFS1314-03 | fl15 | 13:14:45.050 | -03:14:15.64 | 57832.3548 | 304 |
| WDFS1314-03 | fl15 | 13:14:45.050 | -03:14:15.64 | 57832.2018 | 304 |
| WDFS1314-03 | fl04 | 13:14:45.050 | -03:14:15.64 | 57832.2918 | 304 |
| WDFS1314-03 | fl06 | 13:14:45.050 | -03:14:15.64 | 57832.096 | 304 |
Note. — Table 3 is published in its entirety in the machine readable format. A portion is shown here for guidance regarding its form and content.
3.1 Data processing and reduction
We downloaded all images collected for our programs from the LCO archive. These are processed by the BANZAI pre-reduction pipeline888https://github.com/LCOGT/banzai. The pipeline performs a bad-pixel masking, bias and dark subtraction and a flat-field correction. It also provides an astrometric solution for the images and extracts aperture photometry for the sources by using Source Extractor (Bertin & Arnouts, 1996). For more details please refer to the LCO BANZAI pipeline web page999https://lco.global/observatory/data/BANZAIpipeline/.
Images were collected under different conditions, effectively being spread over different nights and months and utilizing different telescopes and observatories. All data were collected with the Sinistro 4K4K cameras mounted on the 1m-class network of telescopes. This includes Siding Spring (observatory code, COJ), Sutherland (CPT), Cerro Tololo Cerro Tololo Inter-American Observatory (LSC), McDonald (ELP). The Sinistro cameras provide a total field of view (FoV) of 26′26′ with a pixel scale of 0389. Seeing for the different observations for all DAWDs ranged between 17 to 25 on the images, with an average seeing 2″.
As a first step, the average Full-Width Half Maximum (FWHM) for each frame was derived from the available Source Extractor photometry. To exclude observations affected by poor observing conditions or bad focus, all the images with FWHM 7.5 pixels (29) were discarded.
We then performed aperture photometry with DAOPHOTIV (Stetson, 1987), using an aperture radius of 5 pixels, and the sky background calculated in an annulus with radii 7 and 20 pixels. Starting from the aperture photometry, we performed Point-Spread Function (PSF) photometry with DAOPHOTIV/ALLSTAR. An automatic pipeline was developed in python to run the different routines of DAOPHOT and derive a PSF for each image. The result is a sample of moderately bright, isolated and well-measured PSF stars per image. The pipeline also runs ALLSTAR, i.e., the PSF fitting routine, on all the images and produces a catalog with identified sources, coordinates and magnitudes for every single image. Images that failed the automatic procedure were individually visually inspected and checked for problems. Most frequently they were out of focus or affected by clouds.
As a second step, we identified the best image (smallest average FWHM) for a set of exposures for each target and established it as a reference frame. This process is needed to flux scale all the photometric catalogs and to register all the exposures to the same coordinate system. In order to derive transformations between the images we used DAOMATCH/DAOMASTER (Stetson, 1994) and created a master catalog for each FoV. We then used the code ALLFRAME (Stetson, 1994) to perform simultaneous PSF-fitting photometry on all images available for a target. ALLFRAME output catalogs were matched to derive light curves for all the stars in the observed FoV, including the DAWDs. Note that exposures for each target were flux scaled to the reference images to take into account effects due to the differences in the PSF, observing conditions and exposure times. It is important to note that we are interested in relative and not absolute photometry, and the derived light curves for our DAWDs and all stars in the same FoV are not calibrated.
We ended up with 38 final photometric catalogs, one for each DAWD star. On average, catalogs include 300-1,000 stars distributed over the FoV. The DAWDs were identified in the final photometric catalogs by searching around their position () within a radius of 0.001∘.
The data were also independently measured with the DoPHOT program (Schechter et al., 1993), using a process described in Saha et al. (2019). This produces a list of aperture corrected instrumental magnitudes for each image. The lists for all images in the band centered on any given target DAWD star were then matched by position (). A single zero-point adjustment in instrumental magnitudes was applied to each list, so that the error-weighted ensemble average instrumental magnitudes of all matched objects were made the same across all images/epochs centered on the DAWD star. This assumes that the majority of stars on the frame are non-variable, thus putting all instrumental magnitudes for any given DAWD star field on the same footing. The results were written into an SQL data-base. Then, for any star in the field, the variability can be tested by extracting its measurements at all epochs, as described in the following section.
4 Variability analysis
Measurements obtained with DoPHOT were used to calculate a reduced for each star in a given FoV as:
| (1) |
where are the individual measurements, is the mean weighted magnitude of each identified object, is the error on the individual measurements. The error estimates were those furnished by DoPHOT and propagated through the ensuing process. For robustness, for each star, multiple values of s were calculated using a bootstrap process. If, for instance, there were measurements available, we constructed a sample of measurements by randomly picking from the available measurements with replacement, and take the average of all the ensuing values. The resulting reduced s for each object in a given field was plotted against instrumental magnitude to visually de-trend the effects of miss-estimation of the errors and make variable objects stand out in this diagram.
Since the data were taken at various telescopes of the LCO network, we expect minor differences in the actual transmission curves and detector responses from telescope to telescope. Our DAWDs are expected to be much hotter than other stars in the FoV, so the consequent differences in the color response from one telescope to another can induce an excess variation to be seen for the DAWD stars, since the instrumental magnitudes from epoch to epoch were adjusted by matching their ensemble averages across the different exposures. In practice, this does appear as a large effect for observations obtained by one particular telescope at the Cerro Tololo Inter-American Observatory (observatory code LSC), identified as lsc1m004 in the image header. The DoPHOT based analysis described here clearly showed this discrepancy. Subsequently, measurements from this telescope were discarded from all final DoPHOT and DAOPHOT photometric catalogs. With this exclusion in place, the results from the different analysis methods are in general agreement, and lead to the star by star evaluations presented in Section 5.
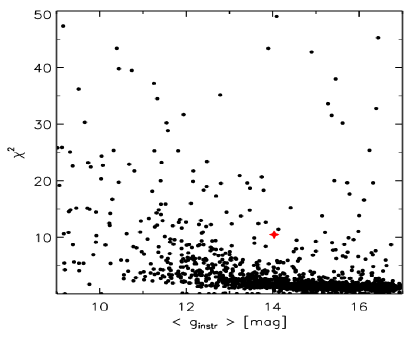
We also used the final DAOPHOT photometric catalogs to calculate a reduced for all the stars in the FoV. Fig. 6 shows the plotted versus instrumental magnitude for the FoV observed towards WD0554-165. The position of the DAWD on the diagram is shown with a red star. This plot shows that WD0554-165 has a larger compared to most of the stars observed in the same field, assumed not to be variables. However, to establish this DAWD as not stable, a more detailed analysis is needed.
Therefore, a sample of 10-20 stable comparison stars was selected for each of the DAWD set of observations. As a requirement, stable stars have a detection in every frame, a index smaller than the median of all stars in the FoV, sharpness of the PSF in the range -0.5 0.5 (to exclude extended objects and cosmic rays), and a proximity in instrumental magnitude to the target DAWD within 0.2 mag.
An absolute calibration of the photometry was not performed as described in the previous section. However, we need to take into account spurious flux variations due to instrumental and atmospheric effects (observations are performed with different telescopes and detectors and from different sites in different conditions). The light curves of the selected stable stars are then compared to the light curves of the DAWD in the same FoV. The variation around the mean of the stable star magnitudes was averaged and the average 1- dispersion was estimated. This dispersion is used as a variability threshold for the systematic observational and instrumental effects (see Fig. 7, 8 and the figures in the Appendix).
Fig. 7 shows the single epoch minus the weighted mean instrumental magnitude as a function of the Mid Julian Date (MJD) for WD0554-165 (black filled dots). Averaged magnitudes for a set of stable stars of comparable instrumental magnitude in the same FoV are also plotted as cyan filled dots. The selected comparison stars have a index less than 1.2, while WD0554-165 has an index of 10.5. WD0554-165 shows clear signs of variability, with a measurement 1- dispersion of 0.04 mag, four times larger compared to the stable star average dispersion of 0.01 mag (Fig. 7).
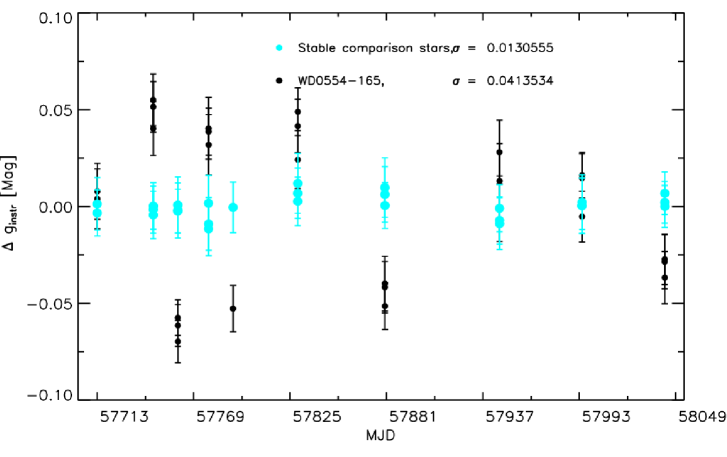
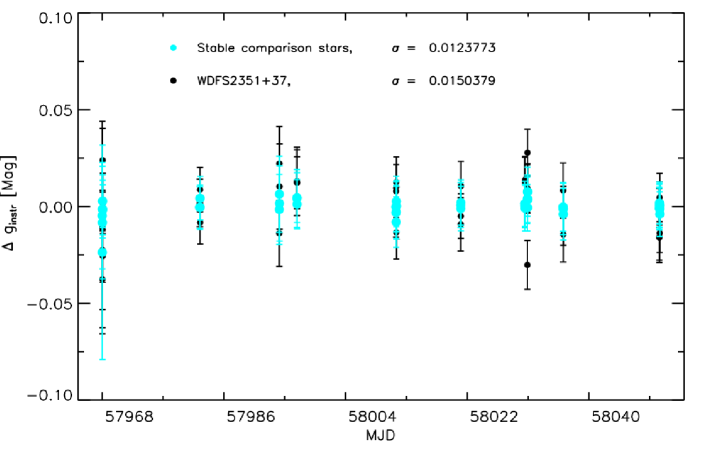
Fig. 8 shows the light curve plot for WDFS2351+37: its index is 1.0 and the dispersion of the measurement is 0.015 mag, of the same order as the measurement dispersion of the stable stars, 0.012 mag. This DAWD was considered stable and included in our spectrophotometric standard network.
The light curve for SDSSJ203722.169-051302.964 (see Fig. 30 in the Appendix), a candidate binary system from spectroscopic data, shows hints of variability with a index of 3.8 and a dispersion of the measurements of 0.04 mag, a factor of two larger than the comparison star average measurement dispersion, 0.02 mag.
Stars SDSSJ203722.169-051302.964 and WD0554-165 were excluded from our network of spectrophotometric standard DAWDs due to their variable nature (see also the discussion in CA19 and NA19).
4.1 Alternative variability indices
To further refine our variability analysis we also used two other variability indices, namely the interquartile range (IQR) and the von Neumann ratio (). These pair of indices were proved to be very effective when working with data affected by outliers and different kind of variability and periods (Sokolovsky et al., 2017), which is our case. However, these indices might be less effective when working with a limited sets of measurements as the LCO data we have for our DAWDs.
The two indices are defined as:
-
•
the IQR is calculated as the difference between the median value of the upper and the lower half of the data points, by excluding the 25% higher and lower values:
-
•
and the von Neumann index is calculated as:
(2)
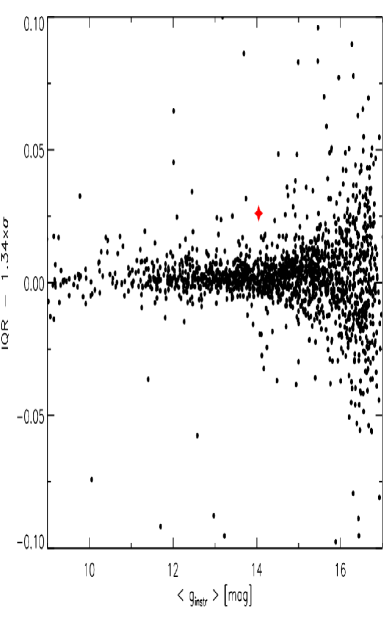
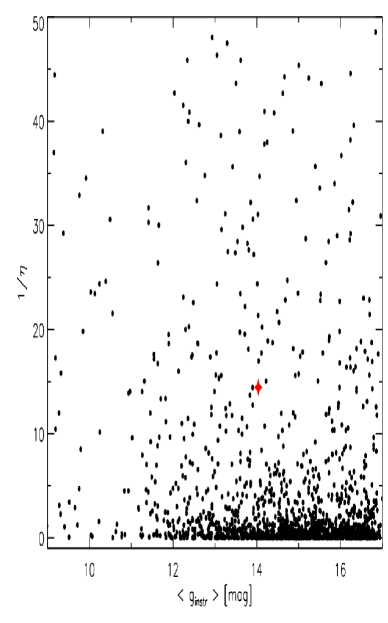
These variability indices were calculated for all the DAWDs, even those classified as variable with the index and the comparison stars or excluded for other reasons, and for all the stars in the FoV. Fig. 9 shows the difference between the IQR index and 1.34 (top panel), where is the dispersion of the measurements, and the 1/ index (bottom, the larger 1/ and the higher is the possibility that a star is variable) plotted versus the average instrumental magnitude () for the FoV observed towards WD0554-165. The position of the DAWD on the variability index plots is shown with a red star. The difference between IQR index and 1.34 seems consistent with values of most stars in the same FoV, while the 1/ index of WD0554-165 is 15, much higher compared to the average 1/ index for the other observed stars in the field, assumed not to be variables, i.e., 2.
| Star | IR excess | ||||||||
|---|---|---|---|---|---|---|---|---|---|
| mag | mag | ||||||||
| Northern and equatorial DAWDs | |||||||||
| WDFS0103-00aaWe warn the users that this standard star measurements could be affected by the presence of close red faint neighbors when observed from the ground. | 39 | 19.3010.003 | 0.03 | 2.1 | 0.03 | 0.28 | … | … | … |
| WDFS0228-08aaWe warn the users that this standard star measurements could be affected by the presence of close red faint neighbors when observed from the ground. | 40 | 19.9750.006 | 0.04 | 2.2 | 0.06 | 0.39 | … | … | … |
| WDFS0248+33 | 30 | 18.5210.002 | 0.03 | 1.5 | 0.03 | 0.11 | … | … | … |
| WDFS0727+32 | 21 | 18.1890.002 | 0.01 | 0.7 | 0.02 | 0.51 | … | … | … |
| WDFS0815+07 | 24 | 19.9320.005 | 0.03 | 1.0 | 0.05 | 0.60 | … | … | … |
| WDFS1024-00 | 20 | 19.0830.003 | 0.02 | 0.7 | 0.03 | 0.60 | … | … | … |
| WDFS1110-17aaWe warn the users that this standard star measurements could be affected by the presence of close red faint neighbors when observed from the ground. | 36 | 18.0480.001 | 0.03 | 4.3 | 0.05 | 6.78 | 0.28 | 1.65 | No |
| WDFS1111+39 | 17 | 18.6440.002 | 0.02 | 1.6 | 0.02 | 0.20 | … | … | … |
| WDFS1206+02 | 24 | 18.8500.002 | 0.02 | 1.1 | 0.02 | 1.74 | … | … | … |
| WDFS1214+45 | 6 | 17.9790.001 | 0.02 | 1.8 | 0.00 | 0.06 | … | … | … |
| WDFS1302+10 | 9 | 17.2390.001 | 0.04 | 9.0 | 0.06 | 4.71 | 0.07 | 1.38 | No |
| WDFS1314-03aaWe warn the users that this standard star measurements could be affected by the presence of close red faint neighbors when observed from the ground. | 18 | 19.3070.003 | 0.02 | 0.7 | 0.04 | 0.23 | 0.28 | 0.13 | … |
| WDFS1514+00aaWe warn the users that this standard star measurements could be affected by the presence of close red faint neighbors when observed from the ground. | 28 | 15.8840.001 | 0.03 | 6.0 | 0.04 | 1.60 | 0.05 | 42.95 | Upp. limit |
| WDFS1557+55 | 20 | 17.6910.001 | 0.02 | 1.3 | 0.03 | 4.09 | … | … | … |
| WDFS1638+00aaWe warn the users that this standard star measurements could be affected by the presence of close red faint neighbors when observed from the ground. | 12 | 19.0250.002 | 0.02 | 0.9 | 0.02 | 23.3 | 0.91 | 2.86 | … |
| WDFS1814+78 | 18 | 16.7450.001 | 0.01 | 1.0 | 0.01 | 0.33 | … | … | … |
| WDFS2101-05aaWe warn the users that this standard star measurements could be affected by the presence of close red faint neighbors when observed from the ground. | 17 | 18.8270.002 | 0.02 | 2.9 | 0.02 | 0.99 | 0.29 | 77.25 | Upp. limit |
| WDFS2329+00 | 26 | 18.2920.002 | 0.02 | 1.6 | 0.02 | 0.00 | … | … | … |
| WDFS2351+37 | 40 | 18.2350.002 | 0.01 | 1.0 | 0.02 | 0.52 | … | … | … |
| Southern DAWDs | |||||||||
| WDFS0122-30 | 18 | 18.6640.001 | 0.03 | 2.3 | 0.03 | 1.42 | … | … | … |
| WDFS0238-36aaWe warn the users that this standard star measurements could be affected by the presence of close red faint neighbors when observed from the ground. | 17 | 18.2360.001 | 0.03 | 6.8 | 0.03 | 8.29 | … | … | … |
| WDFS0458-56 | 32 | 17.9590.001 | 0.02 | 3.9 | 0.02 | 0.12 | … | … | … |
| WDFS0541-19aaWe warn the users that this standard star measurements could be affected by the presence of close red faint neighbors when observed from the ground. | 27 | 18.4330.002 | 0.03 | 3.2 | 0.03 | 0.09 | 0.18 | 33.01 | … |
| WDFS0639-57 | 10 | 18.3750.002 | 0.02 | 3.2 | 0.03 | 33.00 | … | … | … |
| WDFS0956-38 | 16 | 18.0020.001 | 0.02 | 3.1 | 0.04 | 0.14 | … | … | … |
| WDFS1055-36aaWe warn the users that this standard star measurements could be affected by the presence of close red faint neighbors when observed from the ground. | 14 | 18.1960.001 | 0.02 | 3.5 | 0.04 | 1.67 | 0.13 | 1.04 | … |
| WDFS1206-27aaWe warn the users that this standard star measurements could be affected by the presence of close red faint neighbors when observed from the ground. | 14 | 16.6670.001 | 0.02 | 7.7 | 0.02 | 0.73 | 0.07 | 16.68 | No |
| WDFS1434-28aaWe warn the users that this standard star measurements could be affected by the presence of close red faint neighbors when observed from the ground. | 21 | 18.1030.002 | 0.02 | 2.0 | 0.02 | 0.01 | 0.22 | 0.07 | … |
| WDFS1535-77aaWe warn the users that this standard star measurements could be affected by the presence of close red faint neighbors when observed from the ground. | 24 | 16.7650.001 | 0.02 | 1.9 | 0.12 | 1.30 | … | … | No |
| WDFS1837-70 | 9 | 17.91 0.001 | 0.02 | 1.3 | 0.01 | 11.72 | … | … | … |
| WDFS1930-52 | 17 | 17.6730.001 | 0.03 | 11.0 | 0.04 | 0.66 | … | … | Upp. limit |
| WDFS2317-29aaWe warn the users that this standard star measurements could be affected by the presence of close red faint neighbors when observed from the ground. | 20 | 18.5260.002 | 0.03 | 5.0 | 0.05 | 0.20 | … | … | … |
| Discarded DAWDs | |||||||||
| SDSSJ041053.632-063027.580 | 38 | 18.9900.002 | 0.03 | 2.7 | 0.04 | 0.02 | … | … | … |
| WD0554-165 | 27 | 17.9440.001 | 0.04 | 10.5 | 0.08 | 14.45 | 0.23 | 0.24 | … |
| SDSSJ172135.97+294016.0 | 27 | 19.5980.003 | 0.04 | 1.4 | 0.06 | 0.13 | … | … | … |
| SDSSJ203722.169-051302.964 | 15 | 19.1100.002 | 0.04 | 3.8 | 0.02 | 0.06 | … | … | … |
| WD0418-534 | 45 | 16.4200.001 | 0.03 | 16.4 | 0.04 | 2.98 | … | … | Upp. limit |
| WD0757-606 | 11 | 18.9530.002 | 0.02 | 1.0 | 0.03 | 0.02 | … | … | … |
4.2 ATLAS data
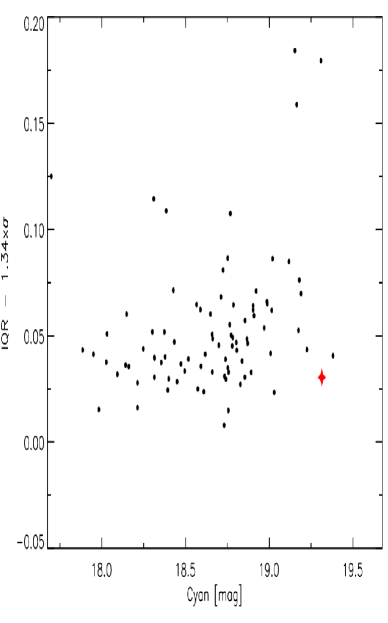
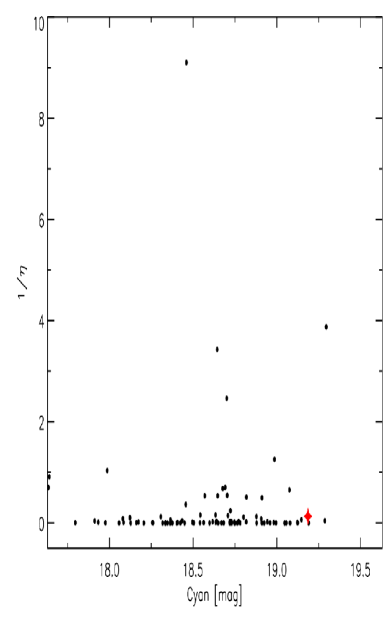
For a few DAWDs, the LCO light curves and the different variability indices were still inconclusive to classify them as fully stable stars. Therefore, we downloaded the Asteroid Terrestrial-impact Last Alert System (ATLAS, Heinze et al., 2018; Tonry et al., 2018) survey data, when available, for targets with declination north of 50°. In particular, we downloaded forced photometry in the cyan () and orange () filters for 7 DAWDs in the Northern hemisphere and 4 in the Southern one. We also retrieved ATLAS time-series photometry for a set of up to 100 stars with similar instrumental magnitudes as the DAWD (0.5 0.5) in the LCO FoV. We then calculated the IQR and variability indices for all the observed stars to be compared with the value of the DAWD. The two ATLAS variability indices are also listed in Table 4 when available. Fig. 10 shows the IQR compared to 1.34 and the index versus the ATLAS magnitudes for star WDFS1314-03 and 100 stars of similar LCO instrumental magnitude. Since we do not have the color information for stars in the LCO FoV, the selected comparison stars are generally brighter (and redder) than the DAWD in the ATLAS filters, as displayed in the figure. The top panel of Fig. 10 shows that the IQR index for WDFS1314-03 is consistent with the dispersion of the measurements and with that of stars of similar LCO instrumental magnitude, and the index (bottom panel) is similar to that of most stars in the FoV. WDFS1314-03 is found to be stable and kept in our network of standards. For more details about this DAWD please see Section 5.
4.3 TESS data
We also matched our sample of DAWDs with TESS archive and found data for 35 of them (WDFS0228-08, WDFS0815+07, and SDSSJ203722.169-051302.964 do not have available observations). All TESS data were reduced with the TESSreduce package, which produced flux calibrated difference imaged light curves (Ridden-Harper et al., 2021). Since calibrating TESS data between sectors remains unreliable, for each sector we subtracted the median flux of the sector from the DAWD light curve. Although this process limits the effects of cross sector calibration, it may flatten periods that last for longer than a sector ( days). We checked all the light curves for variability by using a Lomb-Scargle periodigram analysis. In the case of some DAWDs, the light curves contain residual flux from the periodic TESS scattered light background, and have issues with image alignment. DAWDs affected by these reduction artifacts contained periodic signals from the drift in image alignment and spikes in the background, substantially decreasing the of the observations. For these targets it is difficult to definitively asses the absence or presence of variability.
TESS data for the DAWDs span both the primary and extended missions, which have cadences of 30 minutes and 10 minutes, respectively. For consistency, we binned the light curves to a cadence of 30 minutes, and 1 hour to increase the . Analysis of this data does not show any significant sign of variability, or any peculiarities in the DAWD light curves. However, at the wavelength of the TESS filter (8,000 Å) and due to the instrument low spatial resolution (21″ per pixel), the light curves of the DAWDs might be contaminated by faint red neighbor stars. For more details on neighbor star contamination see the discussion in Section 5 and the NIR image cutouts in the Appendix.
4.4 PS1 and ZTF data
We matched almost all northern and equatorial DAWDs with Pan-STARRS1 (PS1) data release 2101010https://catalogs.mast.stsci.edu/panstarrs/ (Magnier et al., 2020) and ZTF data release 8111111We used the SNAD ZTF viewer for ZTF data (Malanchev et al., 2021) https://ztf.snad.space (Bellm et al., 2019) single epoch detection archives, except for WDFS1557+55. All ZTF matches have observations in the and filters, with most of the single filter light curves of the DAWDs having a modified index below . The only exception is the -band light curve for WDFS0815+07, with a index value of 5.9 due to a single bright outlier measurement. Most of the PS1 matches have observations in all five filters, , while the faint stars WDFS0103-00, WDFS0228-08, and WDFS0815+07, do not have any measurements in . Almost all light curves have modified index below . The two exceptions are the -band light curve of SDSSJ041053.632-063027.580, which shows a faint outlier observation making the index 36.7, and the brightest DAWD, WDFS1514+00, with for the and for the -band, possibly caused by an underestimate of the measurement uncertainties.
4.5 Near-infrared excess
For some of the brightest DAWDs that showed hints of variability based on some indices near-infrared (NIR) photometry from PS1, UKIRT, DENISE, VISTA and WISE was available and we downloaded it from the VOSA (Virtual Observatory SED Analyzer) database121212http://svo2.cab.inta-csic.es/theory/vosa/index.php (Bayo et al., 2008, see Table 4). For four stars, two in the Northern hemisphere (WDFS1110-17, WDFS1302+10) and two in the Southern (WDFS1206-2, WDFS1535-77), no clear NIR excess was identified. However, for other four DAWDs, two in the Northern hemisphere (WDFS1514+00, WDFS2101-05) and two in the Southern (WD0418-534, WDFS1930-52), an upper limit to the NIR excess was identified from WISE photometry. Fig. 11 shows the SED for star WDFS1514+00 with data from the ultraviolet to the NIR retrieved from VOSA (GALEX, SDSS, APASS, Gaia, DECam, PS1, DENIS, UKIRT, 2MASS, WISE). The three last points are WISE upper limit measurements. Therefore, it is not possible to confirm the presence of NIR excess for this DAWD neither to fully exclude it. The star is kept as part of our spectrophotometric standard and users should be aware of the possibility of NIR excess that could contaminate its measurements. However, the HST SED for this star does not show any indication for a NIR excess (NA19). For more details on neighbor star contamination for this DAWD please see the discussion in Section 5 and the NIR image cutouts in the Appendix.
Seven of these eight DAWDs were included in our set of spectrophotometric standards with the caveat that photometric measurements from ground-based observatory could be affected by the presence of red faint neighbors. WD0418-534 was excluded due to its potential variability and presence of infrared excess (for more details about these eight DAWDs please see Section 5 and Table 4).
5 Description of findings for each DAWD
In the following we describe results for the 38 DAWDs observed with LCO. All the light curves are shown in the Appendix. In the same section we provide finding charts for all the stars based on WFC3/HST images. Table 4 summarizes the results of the LCO time-spaced data analys and lists parameters for the 32 established spectrophotometric standard DAWDs. The discarded DAWDs are listed at the bottom of the same table. The distribution on the sky of the final network of 32 standards is shown in the Hammer-Aitoff projection of Fig. 1.
Northern and equatorial DAWDs
-
•
WDFS0103-00 The light curve of this star does not show signs of variability (see Fig. 12 in the Appendix). The index is 2.1 and the dispersion of the LCO photometric measurements is 0.03 mag (see Table 4, where the values is also listed), compared to the stable star dispersion of 0.02 mag. The WFC3 image for this star (see Fig. 48 in the Appendix) shows a neighbor faint red source at 5″ that could contaminate the LCO photometry. WDFS0103-00 is classified as a stable WD by Kleinman et al. (2013). On the basis of this evidence, we keep this DAWD in our sample of standard stars and warn the users about the close by faint red star when observing from ground-based observatories.
-
•
WDFS0228-08 The light curve of this star shows some hints of variability (Fig. 13). The index is 2.2, and the dispersion of the LCO measurements is 0.04 mag, compared to the stable star average dispersion of 0.03 mag. The WFC3 image (Fig. 48) shows a faint red source at 1″ distance. The source is not visible in the images and in the bluer WFC3-UVIS filters but could contaminate the LCO photometry. We do not exclude this DAWD from our sample of standards but we warn the users when observing this star from ground-based observatories due to the very close by red source.
-
•
WDFS0248+33 The light curve of this star does not show clear signs of variability (Fig. 14). The index is 1.5, with a dispersion of the measurements of 0.04 mag, compared to the stable star dispersion of 0.03 mag. This DAWD is included in our sample of standard stars. However, we caution the user about the high estimated reddening towards this stars, i.e., 0.30 mag.
-
•
SDSSJ041053.632-063027.580 The light curve of this star shows a few hints of variability (Fig. 15). The index is 2.7, with a dispersion of the measurements of 0.03 mag compared to the stable star average dispersion of 0.02 mag. The WFC3 image shows the presence of a few faint red sources at distances in the range 4–6″, and 4 luminous galaxies at about 10″distance (Fig. 48). The galaxies are also visible in the WFC3-UVIS images, but not in WFC3-UVIS images collected in bluer filters. This star was classified as a DA:ME from Kleinman et al. (2013), i.e., it has a faint M-dwarf companion. We then exclude this DAWD from our sample of standard stars (see also NA19).
-
•
WD0554-165 This star has already been discussed above and the light curve is shown in Fig. 7. We exclude it from our sample of standard stars.
-
•
WDFS0727+32 The light curve of this star does not show any sign of variability, with a index of 0.7 and a dispersion of the measurements of 0.01 mag compared to the stable star dispersion of 0.01 mag. This DAWD is included in our network of standard stars (Fig. 16).
-
•
WDFS0815+07 The light curve of this star does not show signs of variability, with a index of 1.0. However, the LCO photometry seems quite noisy, with a dispersion of the measurements of 0.03 mag, smaller compared to the average dispersion of the selected stable stars, 0.04 mag (Fig. 17). This DAWD is included in our network of standard stars.
-
•
WDFS1024-00 The light curve of this star does not show signs of variability, with a index of 0.7 and a dispersion of the measurements of 0.02 mag, comparable to the average dispersion of the selected stable stars, 0.02 mag (Fig. 18). We keep this DAWD in our network of standard stars.
-
•
WDFS1110-17 The light curve of this star shows some hints of variability. The index is 4.3, with a dispersion of the measurements of 0.03 mag, three times larger than the stable star average dispersion of 0.01 mag (Fig. 19). However, the IQR index from LCO and ATLAS photometry is low, 0.05 and 0.28, respectively, and comparable to the measurement dispersion and to the IQR index of all other stars in the FoV. The inverse of the von Neumann index based on LCO photometry is hight, 7, possibly due to the small number of measurements available (36). On the other hand, the inverse of the von Neumann index based on ATLAS photometry is 1.65, comparable to that of the other stars in the field. Furthermore, TESS, PS1 and ZTF do not show this DAWD as variable, and there is no evidence of IR excess. However, the WFC3 image shows the presence of a few faint red sources at 2, 3, and 3.5″ that could contaminate the LCO photometry (Fig. 48). Therefore, we do not exclude this DAWD from our sample of standards but we warn the users when observing the star from ground-based observatories due to the close by red sources.
-
•
WDFS1111+39 The light curve of this star does not show any sign of variability, with a index of 1.6 and a dispersion of the measurements of 0.02 mag, slightly larger than the stable star dispersion 0.01 mag (Fig. 20). This DAWD is included in our sample of standard stars.
-
•
WDFS1206+02 The light curve of this star does not show signs of variability with index of 1.1 and a dispersion of the measurements of 0.02 mag, comparable to the stable star dispersion 0.02 mag (Fig. 21). This DAWD is included in our sample of standard stars.
-
•
WDFS1214+45 The light curve of this star does not show any sign of variability, with a index of 1.8 and a dispersion of the measurements of 0.02 mag, comparable to the stable star dispersion 0.02 mag (Fig. 22). This DAWD is included in our sample of standard stars.
-
•
WDFS1302+10 The light curve of this star shows a few hints of variability, with = 9.0 and a dispersion of the measurements 0.04 mag, compared to the stable star dispersion, 0.02 mag (Fig. 23). The IQR index based on LCO and ATLAS photometry is 0.06 and 0.07, respectively, and comparable to the measurement dispersion. The index from the same datasets is 5 and 1.38, respectively. The relatively high von Neumann index based on LCO data might be due to the low (9) number of measurements available. TESS, PS1 and ZTF do not show this DAWD as variable, and there is no evidence of IR excess. Also, the WFC3 image does not show the presence of close by red sources (Fig. 48). Concluding, we keep this DAWD in our network of standard stars.
-
•
WDFS1314-03 The light curve of this star does not show signs of variability, with = 0.7 and a dispersion of the measurements of 0.02 mag, comparable to the stable star dispersion, 0.02 mag (Fig. 24). The IQR and the index based on LCO and ATLAS data are also small. However, the WFC3 image shows the presence of faint red neighbor at 0.8, 1, and 3″ that could contaminate the LCO photometry (Fig. 48). Therefore, we do not exclude this DAWD from our sample of standards but we warn the users when observing this star from ground-based observatories due to the close by red sources.
-
•
WDFS1514+00 The light curve of this star shows some level of variability, with a dispersion of the measurements of 0.03 mag compared to the stable star dispersion of 0.01 mag and a index of 6.0 (Fig. 25). On the other hand, the IQR index based on LCO and ATLAS photometry is low, 0.04 and 0.05, respectively, and comparable to the measurement dispersion. The based on these two datasets is 1.7 and 43, but it could be due to the low number of measurements available from LCO and contamination by neighbors in the ATLAS survey. The WFC3 image shows indeed the presence of faint red neighbors at 3 and 45 that could contaminate the photometry and there is hint for the presence of some IR excess, possibly due to the contamination (Fig. 48). TESS, PS1 and ZTF do not show this DAWD as variable, and on the basis of all the evidence, we do not exclude this star from our network of standards. However, we caution observers when using this DAWD from ground-based observatories due to the close by red sources.
-
•
WDFS1557+55 The light curve of this star does not show signs of variability, with a index of 1.3 and a dispersion of the measurements of 0.02 mag comparable to the stable star dispersion 0.02 mag (Fig. 26). This DAWD is included in our network of standard stars.
-
•
WDFS1638+00 The light curve of this star does not show signs of variability, with a index of 0.9 and a dispersion of the measurements of 0.02 mag as the stable star dispersion of 0.02 mag (Fig. 27). However, the WFC3 image shows the presence of faint red neighbors at 3 and 4″ that could contaminate LCO photometry (Fig. 49). These red sources are also visible in the images, but disappear in the WFC3-UVIS bluer filter images. This DAWD is not excluded from our network of standards. However, we warn observers when using this star from ground-based observatories due to the close by red sources.
-
•
SDSSJ172135.97+294016.0 The light curve of this star is quite noisy with a dispersion of the measurements of 0.04 mag, slightly larger to the stable star dispersion 0.03 mag, and = 1.4 (Fig. 28). This DAWD is excluded from our network of standard stars as a result of its lower (for more information see NA19).
-
•
WDFS1814+78 The light curve of this star does not show any sign of variability, with a = 1.0, and a dispersion of the measurements of 0.01 mag, comparable to the stable star dispersion 0.01 mag (Fig. 29). This DAWD is included in our network of standard stars.
-
•
SDSSJ203722.169-051302.964 This star has already been discussed above and the light curve is shown in the Appendix in Fig. 30. We exclude this DAWD from our sample of standard stars due to its binary nature.
-
•
WDFS2101-05 The light curve of this star shows some level of variability, and a index of 2.9 (Fig. 31). However, the dispersion of the measurements is 0.02 mag, slightly larger compared to the stable star dispersion of 0.01 mag, and the IQR and indices have low values comparable to the other stars in the FoV. The index calculated from ATLAS data is very high, but this photometry could be contaminated by neighbor stars. The WFC3 image shows indeed the presence of faint red neighbors at 2 and 5″ that could contaminate LCO and ATLAS photometry (Fig. 49). One of the sources is also visible in the WFC3-UVIS images. This DAWD is not excluded from our network of standards. However, we caution observers when using this star from ground-based observatories due to the close by red sources.
-
•
WDFS2329+00 The light curve of this star does not show clear signs of variability. The index is 1.6 and the dispersion of the measurements of 0.02 mag, same as the stable star dispersion 0.02 mag (Fig. 32). Moreover, the IQR and the indices do not highlight any peculiarities for this star. On the basis of this evidence, we keep this DAWD in our sample of standard stars.
-
•
WDFS2351+37 This DAWD has already been discussed above and the light curve is shown in Fig. 8, and it is included in our sample of standards.
Southern DAWDs
-
•
WDFS0122-30 The light curve of this star shows some level of variability, with a index of 2.3 (Fig. 33). However, the dispersion of the measurements of 0.03 mag, only slightly larger compared to the stable star dispersion 0.02 mag. Moreover, the IQR and the indices do not highlight any peculiarities for this star. This DAWD is included in our network of standard stars.
-
•
WDFS0238-36 The light curve of this star shows hints of variability, with a index of 6.8 and a dispersion of the measurements of 0.03 mag compared to the stable star dispersion 0.01 mag (Fig. 34). The IQR index is comparable to the measurement uncertainties, but the index is high compared to the other stars in the FoV. However, this could be due to the small number of LCO measurements (17). TESS, PS1 and ZTF do not show this DAWD as variable. However, the WFC3 images show the presence of a faint red source at 8″, also visible in the WFC3 images, that may contaminate the LCO photometry, since the quality of observing nights for this star were not very good (see also Table 4). Therefore, we keep this DAWD in our network of standards, but warn the users when observing this star from ground-based observatories due to the close by red sources.
-
•
WD0418-534 The light curve of this star shows signs of variability, with a index of 16.4 and a dispersion of the measurements of 0.03 mag compared to the stable star dispersion 0.01 mag (Fig. 35). The IQR index is compatible with the measurement uncertainties, but the index is slightly higher compared to the other stars in the FoV. Unfortunately, no ATLAS data are available for this DAWD. TESS, PS1 and ZTF do not show this star as variable. However, the stars might show some infrared excess, that could be due to unseen close by red source. In light of this evidence, we decided to exclude this DAWS from our network of standards.
-
•
WDFS0458-56 The light curve of this star shows hints of variability. The index is 3.9 but the dispersion of the measurements is 0.02 mag, slightly larger than the stable star dispersion 0.01 mag (Fig. 36). The IQR and indices are comparable to those of the other stars in the FoV. TESS, PS1 and ZTF do not show this star as variable. On the basis of this evidence, we keep this DAWD in our sample of standard stars.
-
•
WDFS0541-19 The light curve of this star shows hints of variability. The index is 3.2 but the dispersion of the measurements is 0.03 mag, slightly larger than the stable star dispersion 0.02 mag (Fig. 37). The IQR and indices are comparable to those of the other stars in the FoV, and TESS, PS1 and ZTF do not show this star as variable. However, calculated from ATLAS photometry is relatively high (33) but this could be due to contamination of the photometry from neighbor stars. The WFC3 images shows a very bright galaxy at 8″and a bright star at 12 ″that could contaminate ground-based photometry (Fig. 50). Therefore, we keep this DAWD in our network of standard stars. However, we warn observers when using this star from ground-based observatories due to the close by bright red sources.
-
•
WDFS0639-57 The light curve of this star shows hints of variability, with a index of 3.2 (Fig. 38). However, the dispersion of the measurements is 0.02 mag, slightly larger compared to the stable star dispersion 0.01 mag. The index for this star is quite high (33) compared to that of other stars in the FoV, but this is possibly due to the very low number of LCO measurements (10). TESS, PS1 and ZTF do not show this star as variable. On the basis of this evidence, we keep this DAWD in our network of standards.
-
•
WD0757-606 The light curve of this star does not show any sign of variability, with a index of 1.0 and a dispersion of the measurements of 0.02 mag, comparable to the stable star dispersion 0.02 mag (Fig. 39). However, this DAWD is in a open cluster, NGC 2516, 40″ from a very bright star (CD-60 1953), 9 mag, so its flux could be largely contaminated by the neighbor. Also, this star lies very close to the PSF area of an unidentified Rosat PSPC X-ray source (Chu et al., 2004). This DAWD is then excluded from our network of standards.
-
•
WDFS0956-38 The light curve of this star does not show clear signs of variability. The index is 3.1 but the dispersion of the measurements is 0.02 mag, slightly larger compared to the stable star dispersion 0.01 mag (Fig. 40). Also, IQR and indices are comparable to those of the other stars in the FoV, and TESS, PS1 and ZTF do not show this star as variable. Therefore, we keep this DAWD in our sample of standard stars.
-
•
WDFS1055-36 The light curve of this star shows a few signs of variability, with a index of 3.5. However, the dispersion of the measurements is 0.02 mag, slightly larger compared to the stable star dispersion 0.01 mag (Fig. 41). The IQR and indices from LCO and ATLAS photometry are comparable to those of the other stars in the FoV, and TESS, PS1 and ZTF do not show this star as variable. However, the WFC3 images shows the presence of faint red neighbors at 2, 3 and 4″that could contaminate LCO photometry (Fig. 50). Therefore, we keep this DAWD in our network of standard stars. However, we warn observers when using this star from ground-based observatories due to the close by red sources.
-
•
WDFS1206-27 The light curve of this star shows some level of variability, with a index of 7.7 and a dispersion of the measurements of 0.02 mag, more than 3 times larger than the stable star dispersion 0.005 mag (Fig. 42). However, IQR and indices are comparable to those of the other stars in the FoV. The calculated from ATLAS data is high compared to the values of stars in the field, but this could be due to neighbors contaminating the DAWD photometry. The WFC3 images show indeed the presence of a faint red source at 5″, also visible in the WFC3 images, that could contaminate the LCO and ATLAS photometry (Fig. 50). However, no infrared excess seems to be present. TESS, PS1 and ZTF do not show this star as variable. On the basis of this evidence, we keep this DAWD in our network of standards, and warn the users when observing this star from ground-based observatories due to the close by red sources.
-
•
WDFS1434-28 The light curve of this star does not show signs of variability, with a index of 2.0, and a dispersion of the measurements of 0.02 mag, compared to the stable star dispersion of 0.01 mag (Fig. 43). The IQR and indices based on LCO and ATLAS data are also comparable to those of the other stars in the FoV. The WFC3 images show the presence of bright galaxies at 5 and 12″(Fig. 50), also visible in the WFC3 images, that could contaminate ground-based photometry. Therefore, we include this DAWD in our network of standards and warn the users when observing this star from ground-based observatories due to the close by bright sources.
-
•
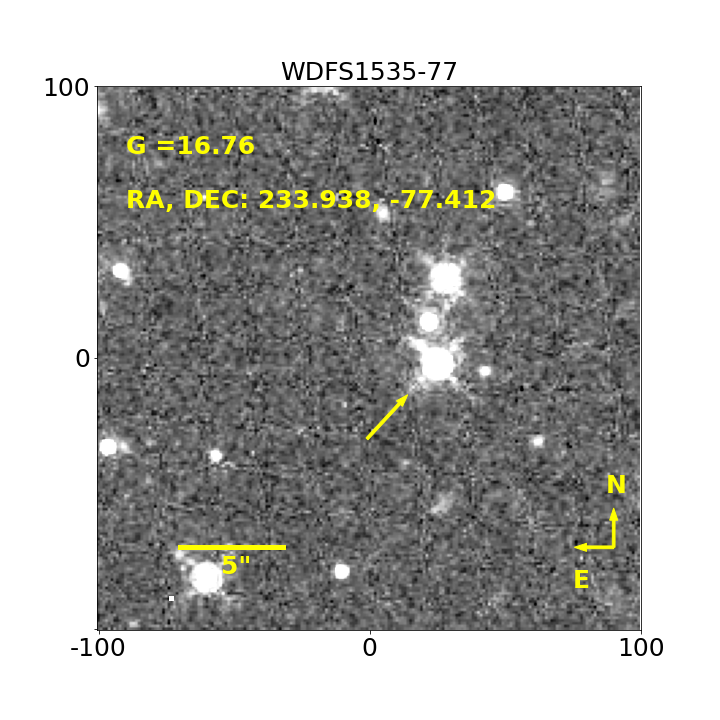
WDFS1535-77 The light curve of this star does not show signs of variability, with a index of 1.9, and a dispersion of the measurements of 0.01 mag, comparable to the stable star dispersion 0.01 mag (Fig. 44). The WFC3 images show the presence of a faint red source at about 5″, also visible in the WFC3 images, that could contaminate the LCO photometry (Fig. 50). However, no infrared excess seems to be present. Therefore, we keep this DAWD in our network of standards and warn the users when observing this star from ground-based observatories due to the close by red sources.
-
•
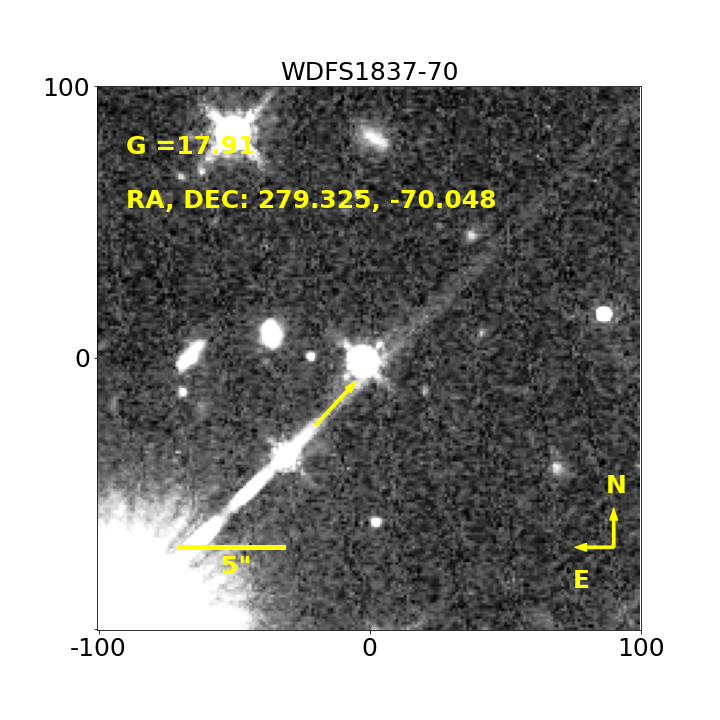
WDFS1837-70 The light curve of this star does not show any signs of variability, with a index of 1.3 and a dispersion of the measurements of 0.02 mag comparable to the stable star dispersion 0.02 mag (Fig. 45). This DAWD is included in our network of standard stars.
-
•
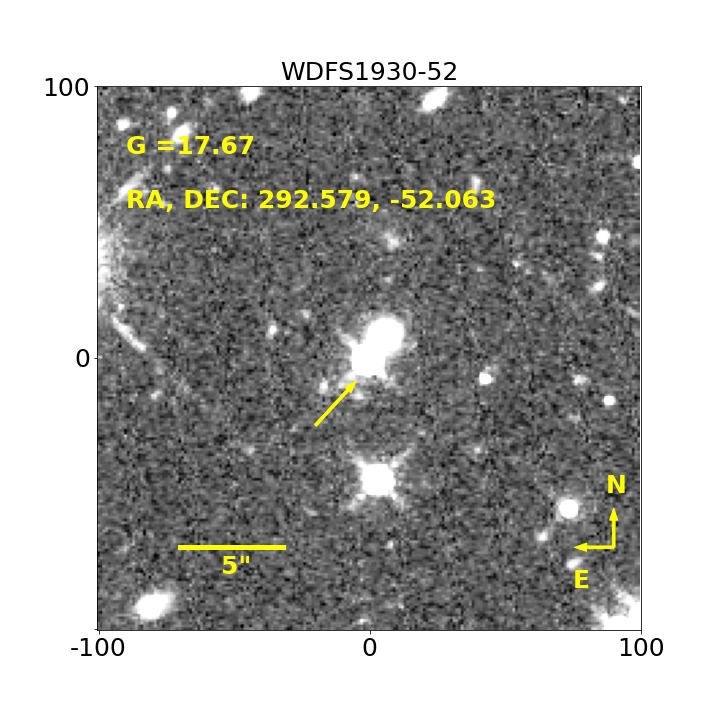
WDFS1930-52 The light curve of this star shows some level of variability, with a index of 11.0 and a dispersion of the measurements of 0.03 mag, three times larger than the stable star dispersion 0.01 mag (Fig. 46). However, the IQR and indices are comparable to those of the other stars in the FoV. Unfortunately, no ATLAS data are available for this stars but TESS, PS1 and ZTF do not show variability. There is an upper limit for the infrared excess of this stars, but there are no identified faint red neighbors in the WFC3 image. We then keep this DAWD in our network of standards (Fig. 50).
-
•
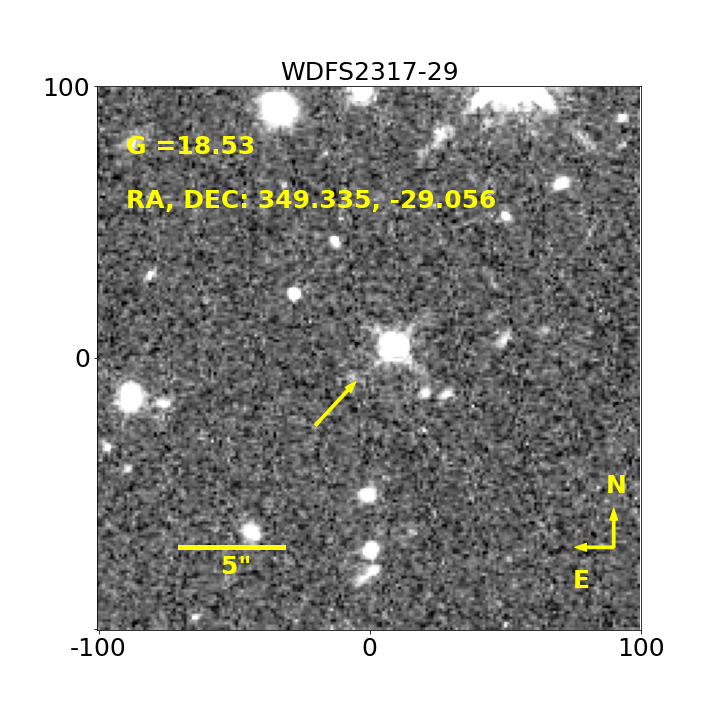
WDFS2317-29 The light curve of this star shows some level of variability, with a index of 5.0 and a dispersion of the measurements of 0.03 mag, three times larger compared to the stable star dispersion 0.01 mag (Fig. 47). However, the IQR and indices are comparable to those of the other stars in the FoV. Unfortunately, no ATLAS data are available for this stars but TESS, PS1 and ZTF do not show variability. The WFC3 image does show the presence of very faint red objects at 2, 3 and 5″that could contaminated LCO photometry (Fig. 50). This DAWD is then included in our network of standard stars with a warning to the users if observing it from the ground.
6 Summary and conclusions
In this manuscript we presented a photometric analysis to investigate the stability of a set of 38 DAWDs, out of which 32 were established as spectrophotometric standards. The summary of the variability analysis and the list of the selected standards is presented in Table 4. Their distribution on the sky is shown in Fig. 1.
All 38 DAWDs in our set have HST WFC3 UVIS and IR photometry, ground-based spectroscopy and LCO time-spaced data. HST photometric and spectroscopic data for 23 DAWDs distributed in the Northern hemisphere and around the celestial equators, and the reduction methods, were described in CA19. Final averaged and calibrated magnitudes on the HST photometric system, and and log for these 23 Northern DAWDs, were provided in that work.
Spectra of 48 candidate WDs in the Southern hemisphere were analyzed here and 15 stars were selected as DAWDs, while the others were discarded for being DC WDs, DB degenerates, peculiar or magnetized WDs. The selected 15 DAWDs were observed with WFC3/HST and the photometry for these stars, as well the methods used to derive the and log parameters, will be illustrated in Axelrod et al..
Time-spaced observations in the -band were collected with the LCO network of telescopes for all 38 DAWDs during 6 semesters in between 2016 and 2018. Our cadence implied observing each star at least 3 times per night for a few nights in a row and then repeating the same observations monthly during the semester. The observations could not always be collected due to weather and condition restrictions, so cadence varied according to the target. Data were pre-reduced with the LCO Banzai pipeline, while PSF photometry was performed by using a custom-made photometric pipeline that integrates Python with DAOPHOTIV/ALLSTAR and ALLFRAME. We derived photometric catalogs with average magnitudes and light curves for all stars identified in the FoV ( 26′ 26′) including the DAWDs. Note that no absolute calibration was performed since the goal of this analysis was to investigate the sample of candidate spectrophotometric standards for the presence of variability. However, light curves were corrected for differences in the observing conditions due to the usage of different detectors (the Sinistro cameras), different telescopes, and different observatories. Also, light curves were corrected for differences due to the observing conditions, such as seeing, cloud cover, and due to the different PSF used in the fits.
Photometry was also performed on the same dataset with DoPhot. This analysis allowed us to identify a color effect in the DAWD observations collected with the LCO telescope ”lmsc004” on the Cerro Tololo observing site. The measurements obtained from images collected with this telescope were excluded from the light curves of all the DAWDs.
Time-spaced photometry was analyzed by using several different variability indices, namely, a reduced , the von Neumann () index and the IQR index. These indices provided very similar results for most stars.
Moreover, for each target and FoV we selected a sample of stable stars, approximately in the same magnitude range of the DAWD, measured in all the available images, with a good quality PSF fit and shape parameter, and low . The average dispersion of the measurements for the stable stars is used as a threshold to help establishing the variability of the DAWD.
We also downloaded and used ATLAS time-series photometry in the cyan bandpass when available, i.e., for stars with declination larger than -50 degrees. We calculated the IQR and indices for all stars in the LCO FoV based on ATLAS photometry and used the indices for the DAWDs to help determining their stability.
TESS, PS1 and ZTF light curves for some of the DAWDs were also analyzed when available, and did not show any of the stars being variable. However, the low spatial resolution of these surveys and the redder filters used in some of the observations, limit the validity of these datasets for this kind of analysis.
We verified for the presence of IR excess by using WISE photometry available from the Virtual Observatory database for a few of the stars, and obtained upper limits for four DAWDs, out of which one star was excluded from our network, mainly on the basis of the variability detected from the LCO light curve.
In summary, two of the Northern DAWDs, namely SDSSJ203722.169-051302.964 and WD0554-1656, were excluded for the variability detected in their LCO light curves and, in the case of SDSSJ203722.169-051302.964 in the spectra, as also described in CA19 and NA19.
We then excluded SDSSJ172135.97+294016.0, due to its being lower than 20,000 K, which is the low temperature limit established to select our candidate standard DAWDs, and SDSSJ041053.632-063027.580, classified as a binary with a M-dwarf companion by Kleinman et al. (2013).
From the Southern hemisphere sample of DAWDs, WD0418-534 and WD0757-606 were excluded due to detected variability in the LCO light curves, and in the case of WD0757-606 also for the proximity of a very bright Be stars that could contaminate the ground-based and space observations.
The final list of established spectrophotometric standards includes 32 stars listed in Table 4 of this manuscript and their new names (WDFSXXXX-XX), Gaia DR3 coordinates and PMs are listed in Table 1. At the end of Table 4, the discarded DAWDs are also listed. These were not assigned a new name. Fig. 1 shows a Hammer-Aitoff projection of the sky with the distribution of the 32 established spectrophotometric standards. These are distributed homogeneously on the sky so that at least two of them would be available to be observed from any observatory on the ground at any time at airmass less than two.
Finding charts with positions and Gaia magnitudes for all the DAWDs are in the Appendix.
References
- Adelman-McCarthy et al. (2008) Adelman-McCarthy, J. K., Agüeros, M. A., Allam, S. S., et al. 2008, ApJS, 175, 297
- Bayo et al. (2008) Bayo, A., Rodrigo, C., Barrado Y Navascués, D., et al. 2008, A&A, 492, 277
- Bellm et al. (2019) Bellm, E. C., Kulkarni, S. R., Graham, M. J., et al. 2019, PASP, 131, 018002
- Bertin & Arnouts (1996) Bertin, E. & Arnouts, S. 1996, A&AS, 117, 393
- Betoule et al. (2014) Betoule, M., Kessler, R., Guy, J., et al. 2014, A&A, 568, A22
- Bohlin (2014) Bohlin, R. C. 2014, AJ, 147, 127
- Bohlin et al. (2020) Bohlin, R. C., Hubeny, I., & Rauch, T. 2020, AJ, 160, 21
- Brinkworth et al. (2013) Brinkworth, C. S., Burleigh, M. R., Lawrie, K., Marsh, T. R., & Knigge, C. 2013, ApJ, 773, 47
- Brinkworth et al. (2004) Brinkworth, C. S., Burleigh, M. R., Wynn, G. A., & Marsh, T. R. 2004, MNRAS, 348, L33
- Brout et al. (2021) Brout, D., Taylor, G., Scolnic, D., et al. 2021, arXiv e-prints, arXiv:2112.03864
- Calamida et al. (2019) Calamida, A., Matheson, T., Saha, A., et al. 2019, ApJ, 872, 199
- Chu et al. (2004) Chu, Y.-H., Guerrero, M. A., Gruendl, R. A., & Webbink, R. F. 2004, AJ, 127, 477
- Clemens et al. (2004) Clemens, J. C., Crain, J. A., & Anderson, R. 2004, in Society of Photo-Optical Instrumentation Engineers (SPIE) Conference Series, Vol. 5492, Ground-based Instrumentation for Astronomy, ed. A. F. M. Moorwood & M. Iye, 331–340
- Dupuis et al. (2000) Dupuis, J., Chayer, P., Vennes, S., Christian, D. J., & Kruk, J. W. 2000, ApJ, 537, 977
- Fontaine & Brassard (2008) Fontaine, G. & Brassard, P. 2008, PASP, 120, 1043
- Gentile Fusillo et al. (2017) Gentile Fusillo, N. P., Raddi, R., Gänsicke, B. T., et al. 2017, Monthly Notices of the Royal Astronomical Society, 469, 621
- Girven et al. (2012) Girven, J., Steeghs, D., Heber, U., et al. 2012, MNRAS, 425, 1013
- Gorecki et al. (2014) Gorecki, A., Abate, A., Ansari, R., et al. 2014, A&A, 561, A128
- Heinze et al. (2018) Heinze, A. N., Tonry, J. L., Denneau, L., et al. 2018, AJ, 156, 241
- Hermes et al. (2017) Hermes, J. J., Gänsicke, B. T., Gentile Fusillo, N. P., et al. 2017, MNRAS, 468, 1946
- Holberg & Howell (2011) Holberg, J. B. & Howell, S. B. 2011, AJ, 142, 62
- Hook et al. (2004) Hook, I. M., Jørgensen, I., Allington-Smith, J. R., et al. 2004, PASP, 116, 425
- Kleinman et al. (2013) Kleinman, S. J., Kepler, S. O., Koester, D., et al. 2013, ApJS, 204, 5
- Magnier et al. (2020) Magnier, E. A., Sweeney, W. E., Chambers, K. C., et al. 2020, ApJS, 251, 5
- Malanchev et al. (2021) Malanchev, K. L., Pruzhinskaya, M. V., Korolev, V. S., et al. 2021, MNRAS, 502, 5147
- McCook & Sion (1999) McCook, G. P. & Sion, E. M. 1999, ApJS, 121, 1
- Narayan et al. (2019) Narayan, G., Matheson, T., Saha, A., et al. 2019, ApJS, 241, 20
- Qi et al. (2015) Qi, Z., Yu, Y., Bucciarelli, B., et al. 2015, AJ, 150, 137
- Raddi et al. (2016) Raddi, R., Catalán, S., Gänsicke, B. T., et al. 2016, MNRAS, 457, 1988
- Raddi et al. (2017) Raddi, R., Gentile Fusillo, N. P., Pala, A. F., et al. 2017, MNRAS, 472, 4173
- Ridden-Harper et al. (2021) Ridden-Harper, R., Rest, A., Hounsell, R., et al. 2021, arXiv e-prints, arXiv:2111.15006
- Saha et al. (2019) Saha, A., Vivas, A. K., Olszewski, E. W., et al. 2019, The Astrophysical Journal, 874, 30
- Schechter et al. (1993) Schechter, P. L., Mateo, M., & Saha, A. 1993, PASP, 105, 1342
- Scolnic et al. (2021) Scolnic, D., Brout, D., Carr, A., et al. 2021, arXiv e-prints, arXiv:2112.03863
- Scolnic et al. (2015) Scolnic, D., Casertano, S., Riess, A., et al. 2015, ApJ, 815, 117
- Scolnic et al. (2019) Scolnic, D., Perlmutter, S., Aldering, G., et al. 2019, Astro2020: Decadal Survey on Astronomy and Astrophysics, 2020, 270
- Sokolovsky et al. (2017) Sokolovsky, K. V., Gavras, P., Karampelas, A., et al. 2017, MNRAS, 464, 274
- Stetson (1987) Stetson, P. B. 1987, PASP, 99, 191
- Stetson (1994) Stetson, P. B. 1994, PASP, 106, 250
- Stubbs & Brown (2015) Stubbs, C. W. & Brown, Y. J. 2015, Modern Physics Letters A, 30, 1530030
- Tonry et al. (2018) Tonry, J. L., Denneau, L., Heinze, A. N., et al. 2018, PASP, 130, 064505
- Toonen et al. (2017) Toonen, S., Hollands, M., Gänsicke, B. T., & Boekholt, T. 2017, A&A, 602, A16
Northern DAWD light curves
The light curves for all the 23 DAWDs in the Northern hemisphere and around the celestial equators are shown in Fig. 12 to 32. Plots are listed in order of increasing .
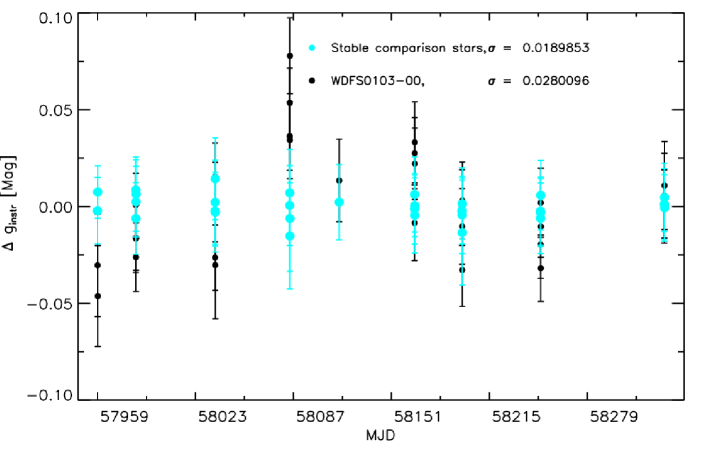
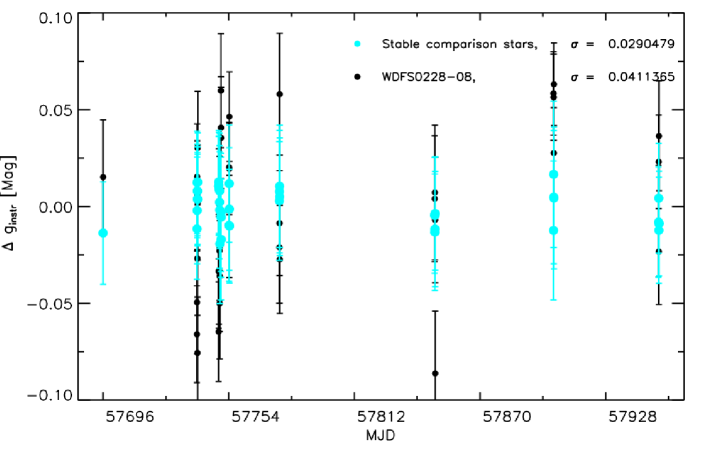
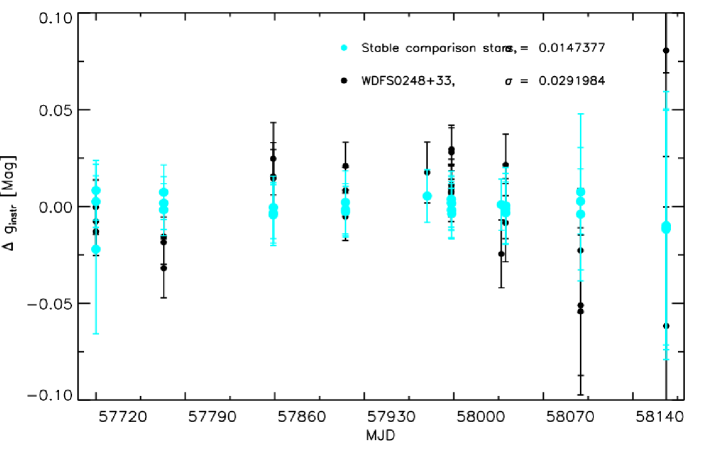
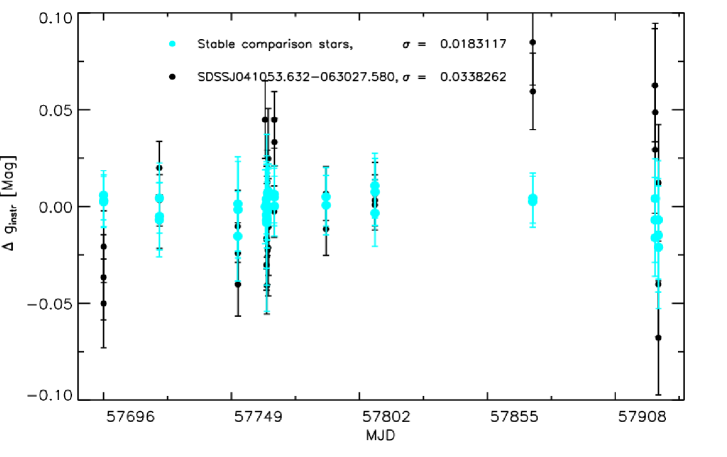
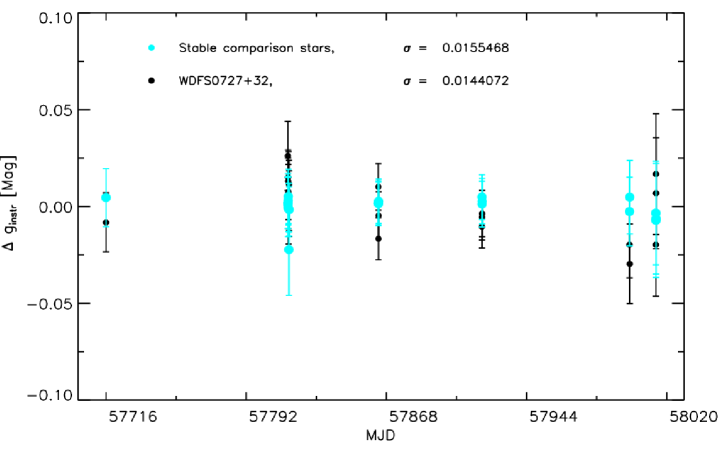
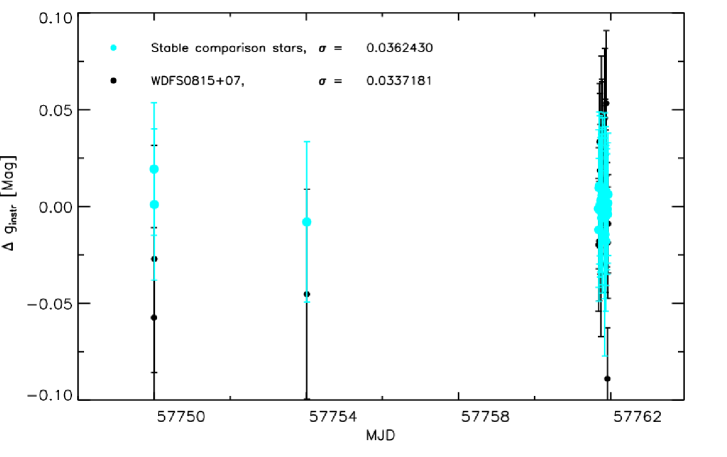
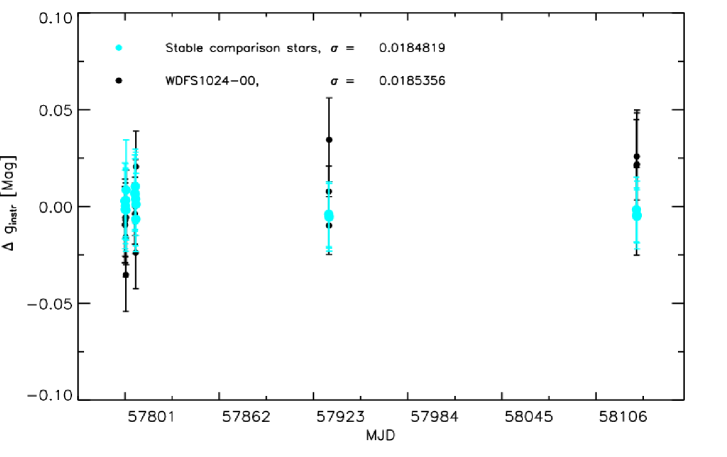
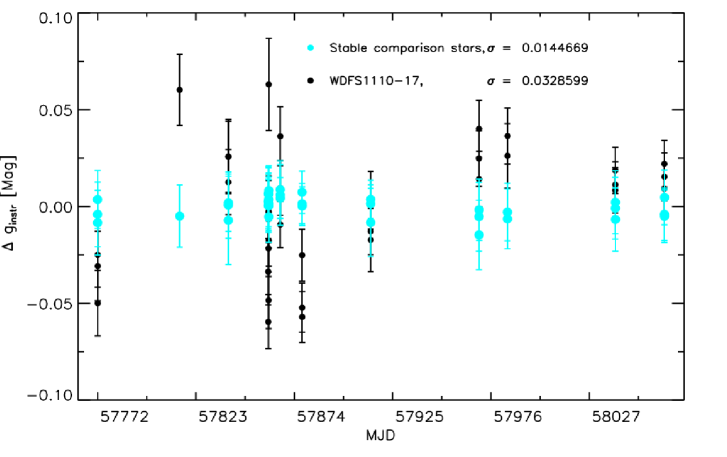
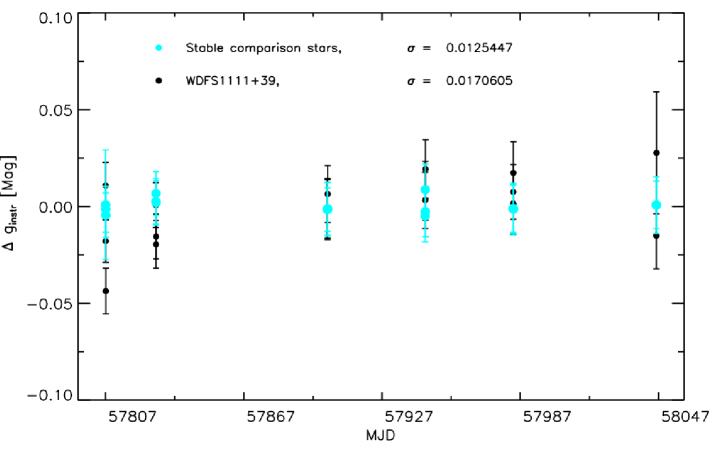
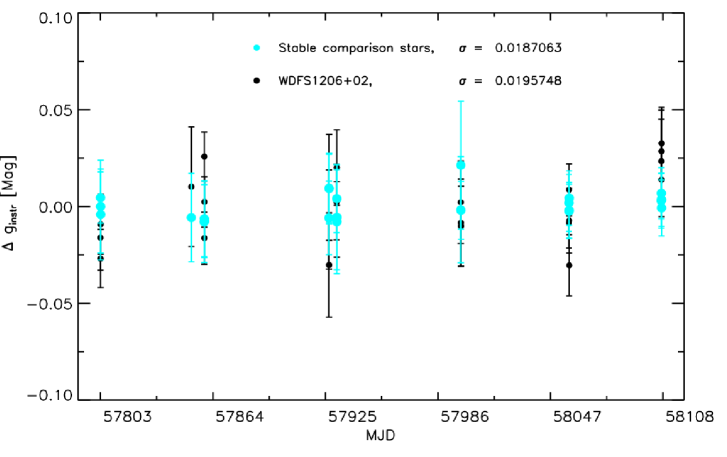
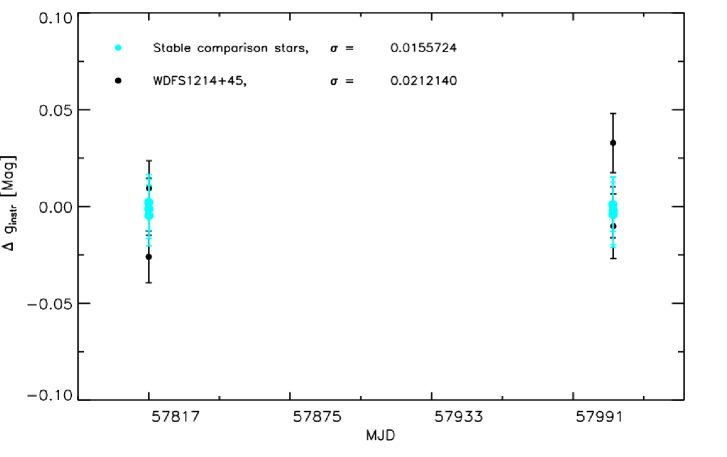
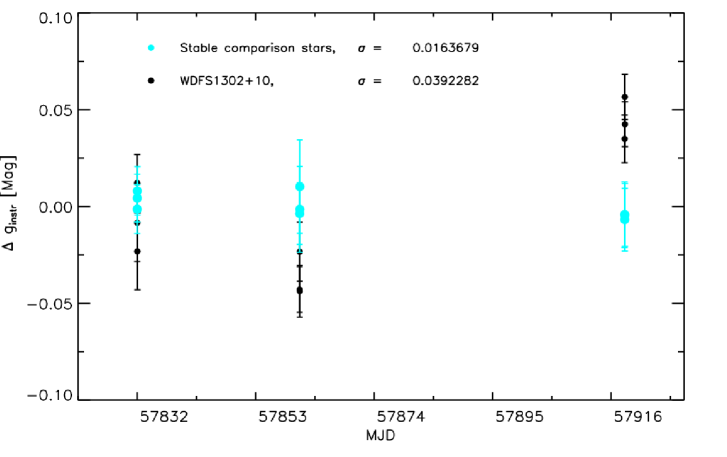
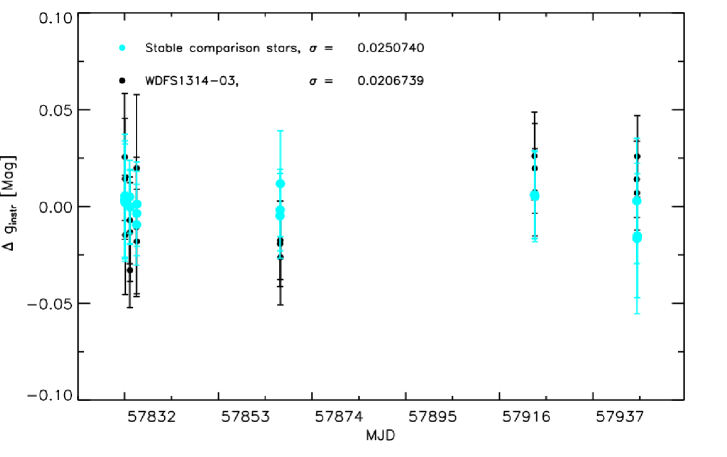
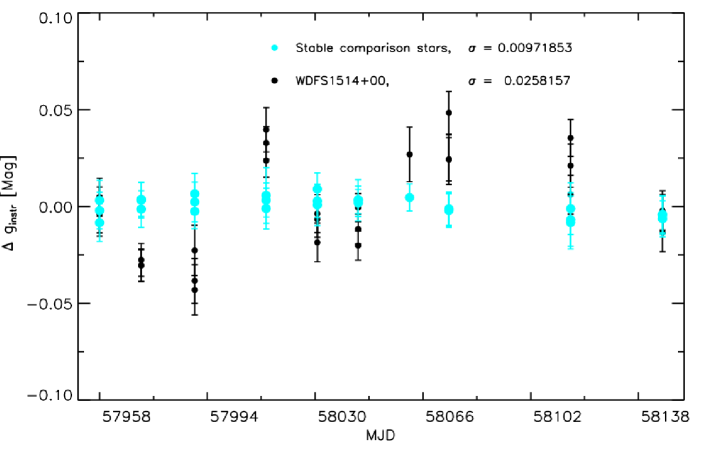
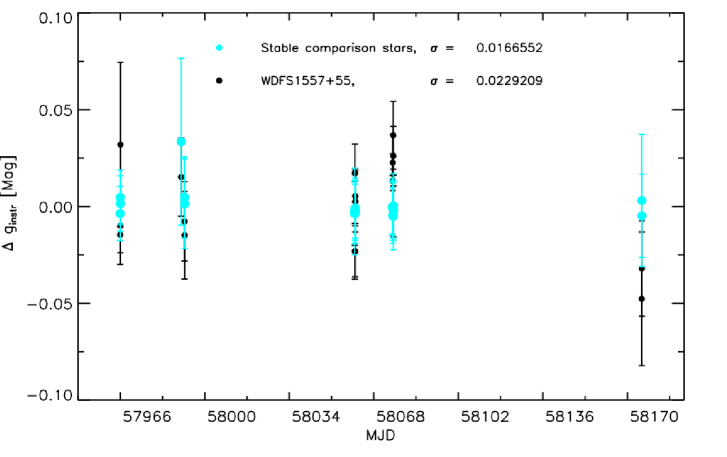
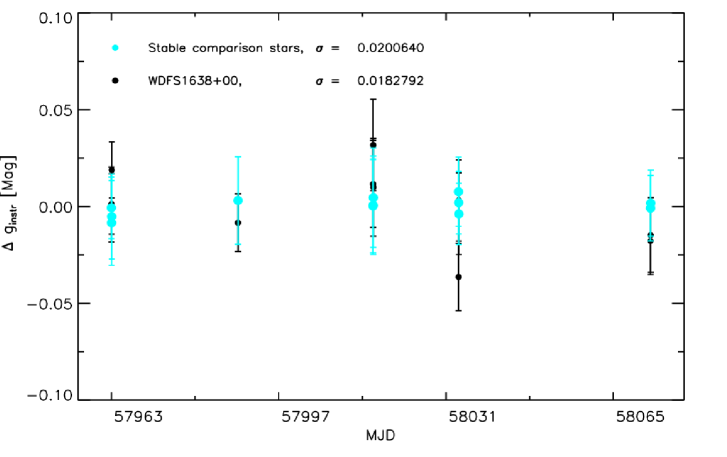
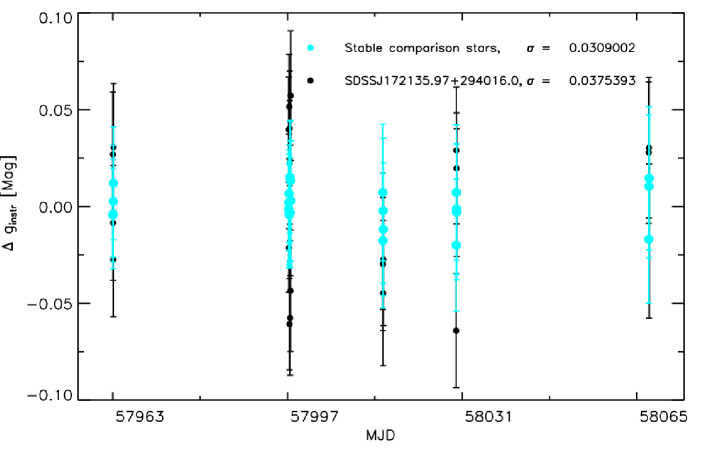
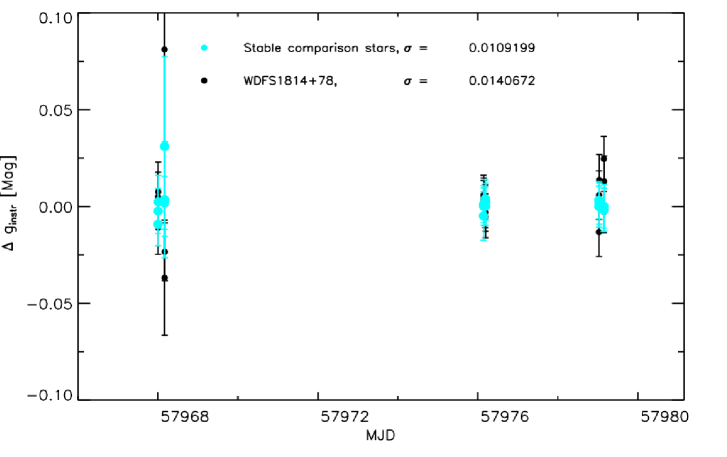
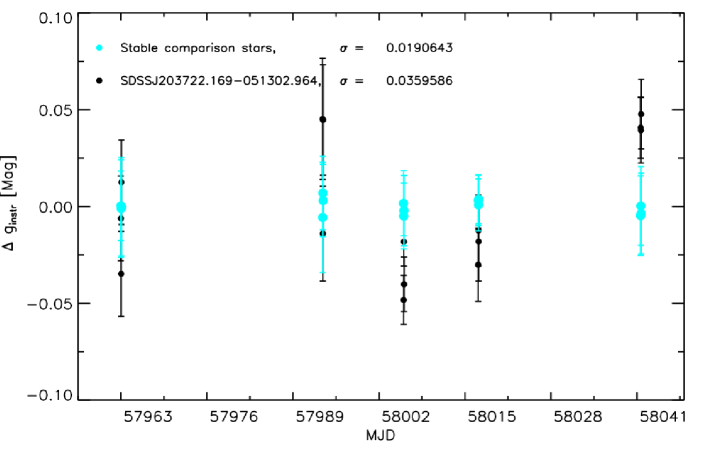
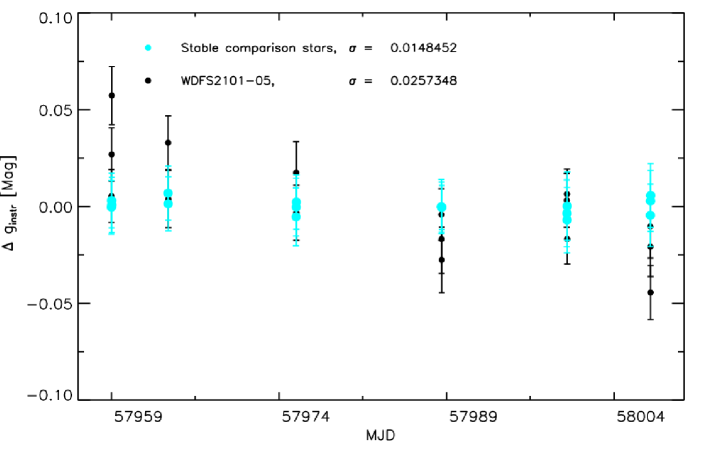
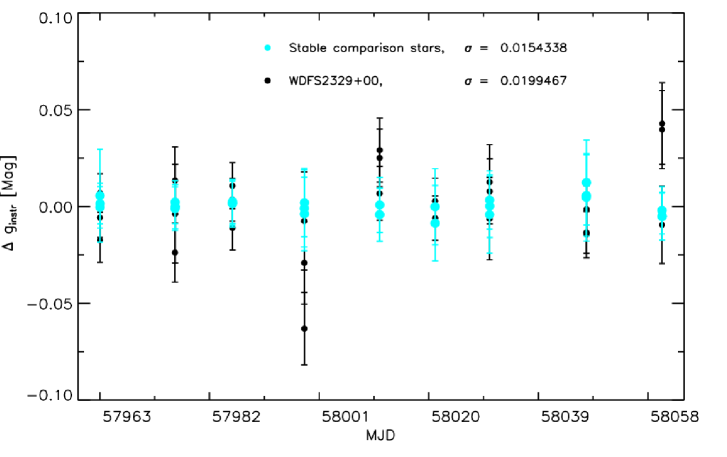
Southern DAWD light curves
The light curves for all the 15 DAWDs in the Southern hemisphere are shown in Fig. 33 to 47. Plots are listed in order of increasing .
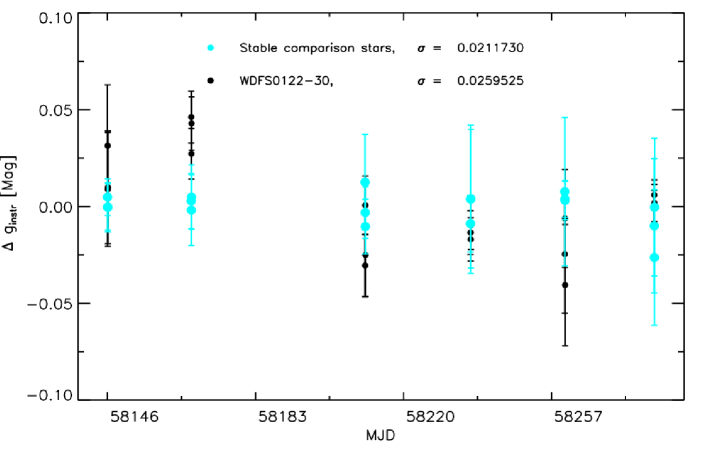
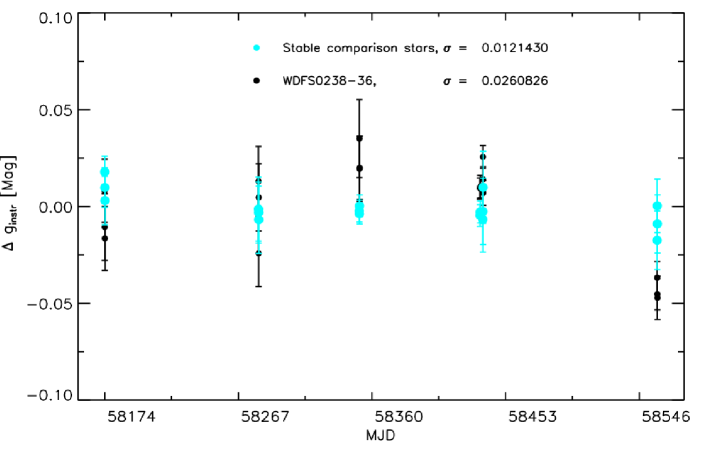
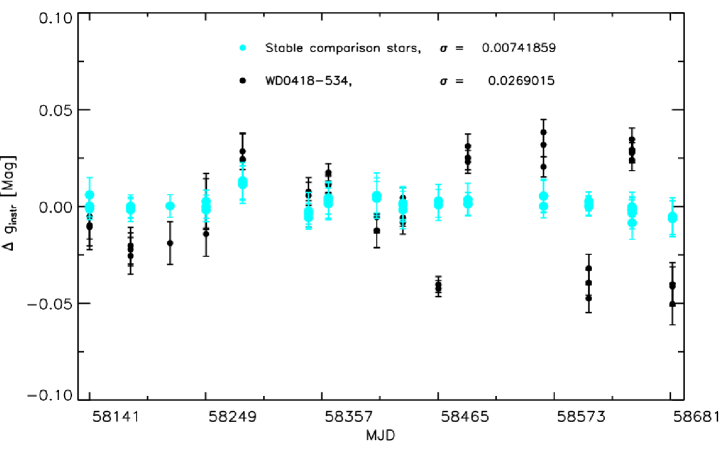
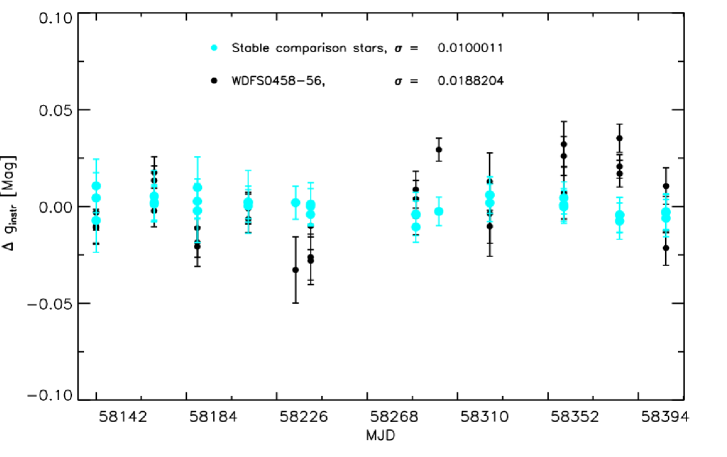
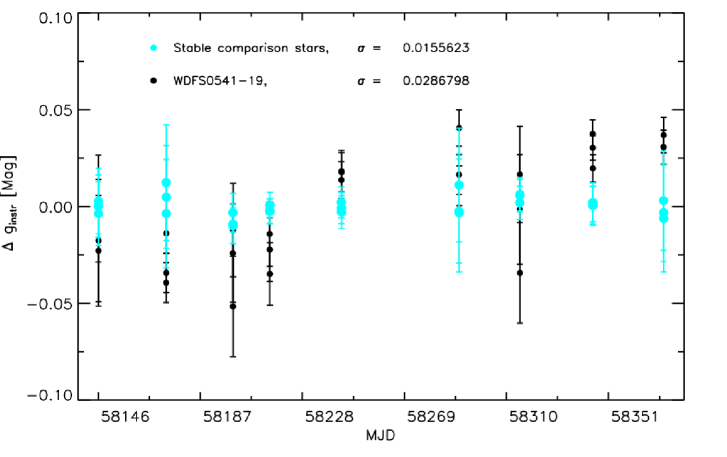
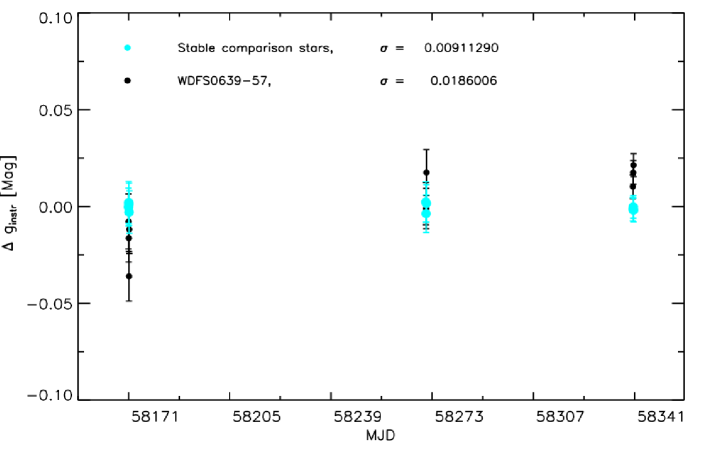
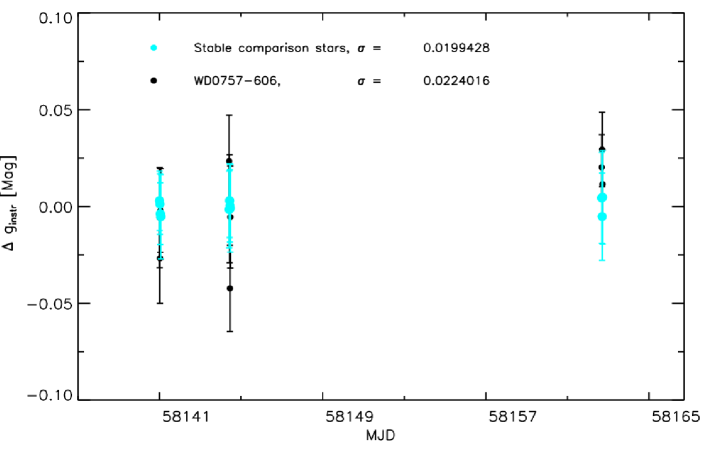
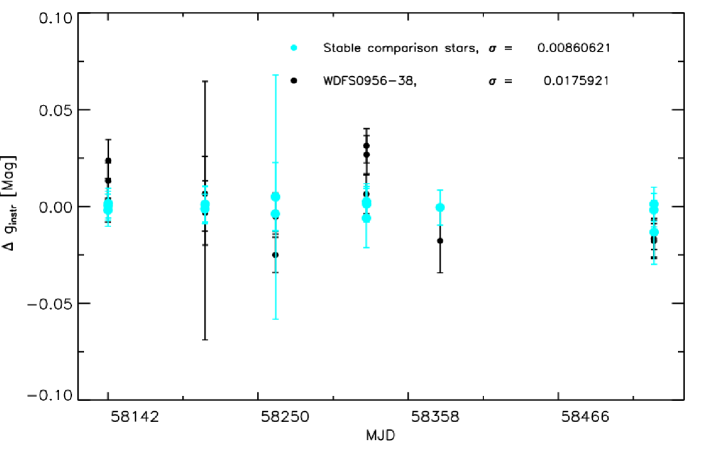
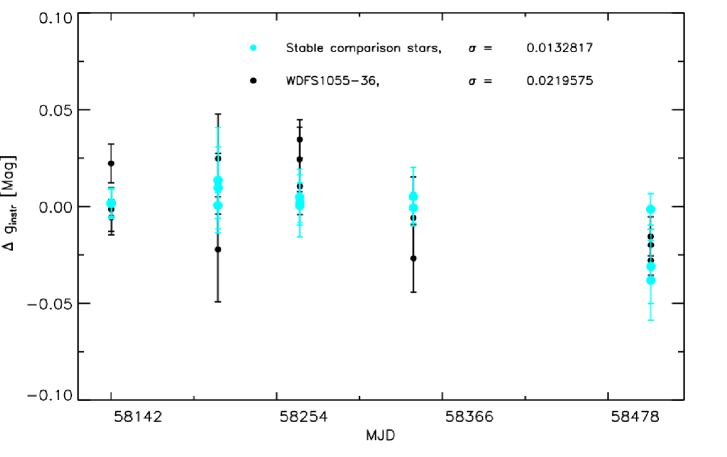
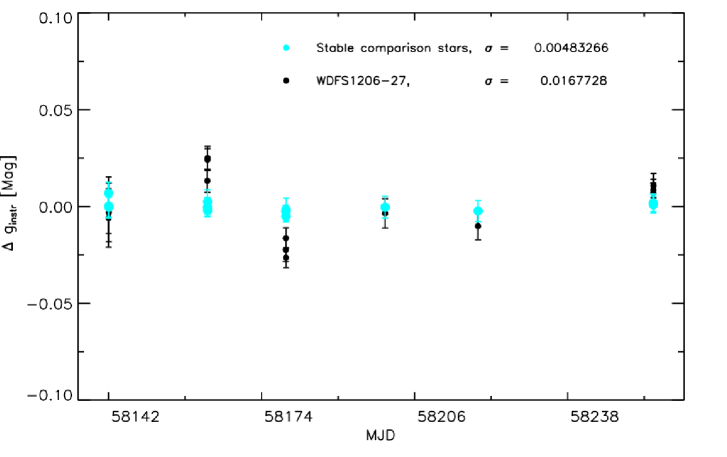
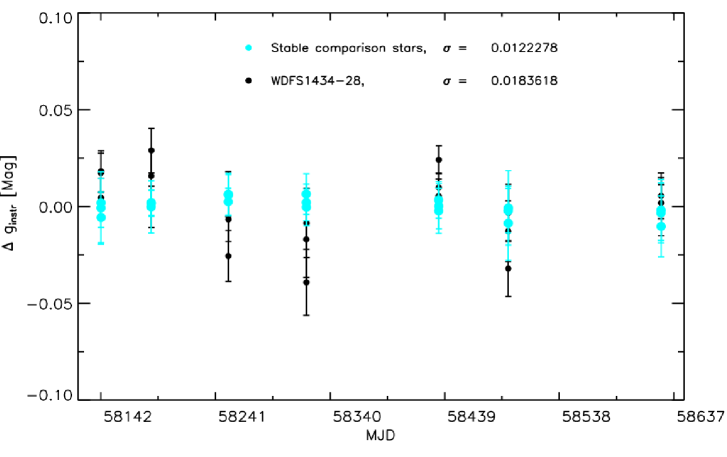
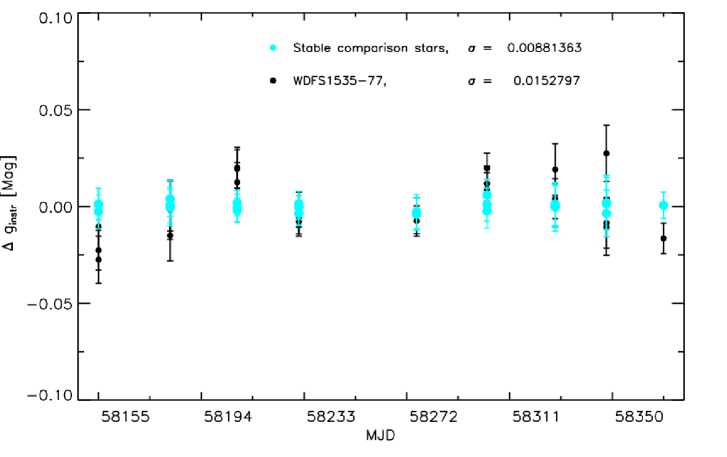
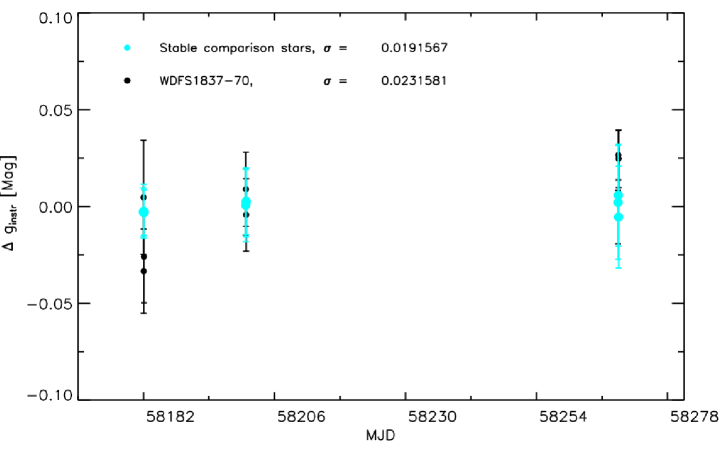
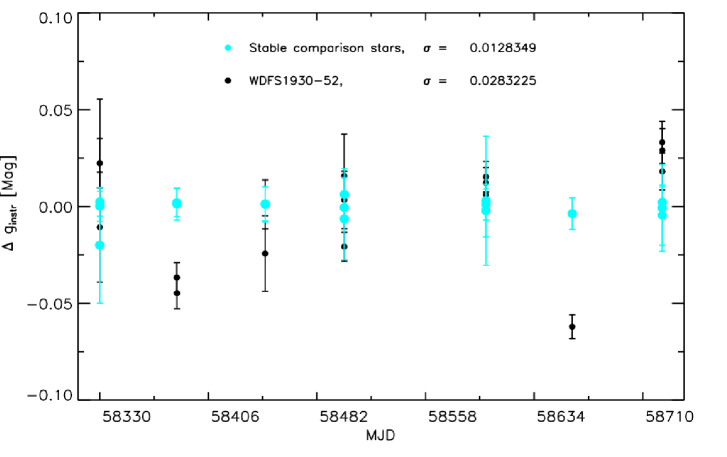
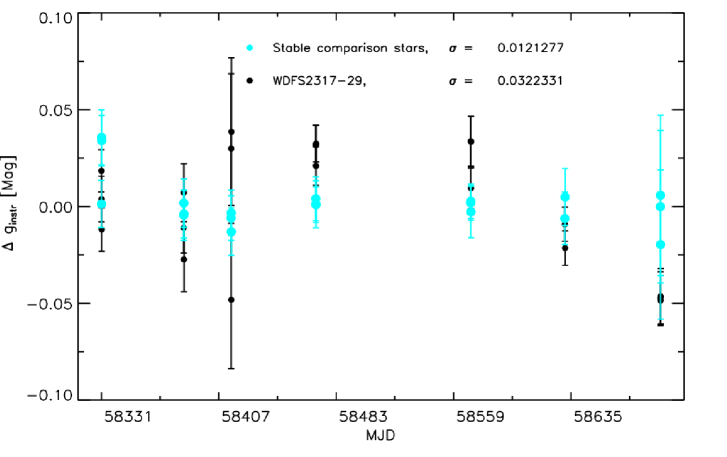
Finding charts
We provide here finding charts for the 23 Northern and the 15 Southern DAWDs. These are based on drizzled WFC3/HST images collected in the filter and cover a FoV of 26″26″. Some background objects and faint red dwarfs are visible in the NIR but are absent in the bluer WFC3/HST filter images and in the LCO g-band images. In particular, due to the larger pixel scale ( 039 vs 013/pixel) and to the seeing, these faint red objects, that could be as close as 05 - 2″ to the DAWDs, might contaminate the LCO light curves. These contaminants are difficult or impossible to separate and identify on the LCO -band images. Thus, we provide the following higher resolution NIR finding charts. In addition, we warn observers using ground-based facilities to be aware of potential NIR contamination for some of the DAWDs selected as standards. For more details see the discussion in Section 5 and Table 4.