marcojavarone@gmail.com††thanks: These authors contributed equally to this work.
marcojavarone@gmail.com††thanks: These authors contributed equally to this work.
marcojavarone@gmail.com
Disorder Unleashes Panic in Bitcoin Dynamics
Abstract
The behaviour of Bitcoin owners is reflected in the structure and the number of bitcoin transactions encoded in the Blockchain. Likewise, the behaviour of Bitcoin traders is reflected in the formation of bullish and bearish trends in the crypto market. In light of these observations, we wonder if human behaviour underlies some relationship between the Blockchain and the crypto market. To address this question, we map the Blockchain to a spin-lattice problem, whose configurations form ordered and disordered patterns, representing the behaviour of Bitcoin owners. This novel approach allows us to obtain time series suitable to detect a causal relationship between the dynamics of the Blockchain and market trends of the Bitcoin and to find that disordered patterns in the Blockchain precede Bitcoin panic selling. Our results suggest that human behaviour underlying Blockchain evolution and the crypto market brings out a fascinating connection between disorder and panic in Bitcoin dynamics.
Introduction - Blockchain satoshi01 ; antonopoulos01 is a distributed ledger technology introduced by Satoshi Nakamoto satoshi01 , rapidly expanding in many sectors of our society, the economy and industry.
Among the several applications, cryptocurrencies such as Bitcoin represent the most successful ones.
Bitcoin is a digital currency whose transactions get managed by a fully decentralised system that hinges on a blockchain. The latter has a data structure composed of a chain of blocks. Each block stores a set of transactions commonly verified by block creators termed miners in this context. Within the block size limit, the miners can receive an incentive to add as many transactions as possible.
Nevertheless, the chain of blocks keeps growing no matter the amount of executed transactions since, in principle, even blocks with no transactions can be mined and added to the chain.
Cryptographic protocols protect the Blockchain from double-spending javarone02 and other risks. Remarkably, while fiat money requires third-party authorities, such as banks, to verify transactions, Blockchain does not need any additional authority.
Over the years, many blockchains based on new tokens, such as Bitcoin (BTC), have been implemented. These tokens are also called cryptocurrencies, or cryptos, due to the underlying cryptographic mechanisms supporting and securing transactions.
Nowadays, a crypto ecosystem baronchelli01 ; gdmarzo01 ; tasca01 ; tessone03 which includes, for instance, Ethereum (ETH), XRP (XRP), Cardano (ADA), Bitcoin Cash (BCH), Solana (SOL), Dogecoin (DOGE), Bitcoin Satoshi Vision (BSV), and many other tokens, continuously grows.
Many cryptos of such an ecosystem get exchanged in the crypto market and accessed by several trading platforms. Like in financial markets, the crypto market shows positive (i.e. bullish) and negative (i.e. bearish) trends resulting from the behaviour of traders.
In summary, the behaviour of Bitcoin users, i.e. wallet owners, traders, and so on, is relevant for the evolution of the Blockchain and the crypto market.
But several questions remain unanswered in this complex socio-technical system: Does human behaviour underlie some relevant relationship between the Blockchain and the crypto market? The goal of this investigation is to face this question.
To this end, we map the Blockchain to a spin model, which allows assessing and measuring interactions with the crypto market.
Before moving to the details of the proposed model and related results, we remark that the Blockchain and cryptocurrencies constitute a modern and expanding research area.
Just to cite a few, previous investigations studied the Bitcoin price dynamics kristoufek01 ; blau01 ; amjad01 ; aalborg01 , the crypto network of transactions javarone01 ; tessone01 ; tessone02 ; tessone05 ; tessone06 ; tessone07 ; tessone08 , the predictive signals yum01 , using social data tessone04 ; garcia01 ; ortu01 ; marchesi02 and machine learning-based approaches marchesi01 ; baronchelli02 , and the interplay between the network of Bitcoin transactions and the crypto market kondor01 .
From Data to Model - Datasets used in this investigation refer to a time interval from 2013 to 2022, including about blocks and transactions. Blockchain data can be accessed at blockchain_explorer and crypto market data at btc_trend .
Blockchain data describe blocks and contain Bitcoin transactions and other parameters such as the Timestamp and the Blockheight. For instance, the Timestamp corresponds to the time a block gets ’mined’ (i.e. generated), whereas the Blockheight identifies the position of a block along the chain.
As above-mentioned, we define a spin model by mapping blocks to vectors (see also dai01 ). In particular, we consider the following parameters: the number of transactions, the number of inputs, and the number of outputs per block. The number of transactions per block has a self-explanatory meaning, while the other parameters, which refer to the structure of transactions antonopoulos01 , need further details. To this end, we describe a simple transaction between Alice and Bob. Alice owns BTC, collected from previous transactions, and wants to send BTC to Bob. She previously received: BTC, BTC, BTC, BTC, and BTC, each constituting an ’unspent transaction output’ (UTXO) for a motivation later clarified. To send BTC to Bob, she has to compose a transaction using a combination of UTXOs, e.g. choosing BTC, BTC, BTC, and BTC, whose summation equals BTC. The chosen UTXOs constitute the inputs of the new transaction. Then, noting that the UTXO summation is greater than the amount of Bitcoin Alice wants to send to Bob, the transaction has two outputs. The first output is addressed to Bob’s wallet (i.e. BTC), while the other is to Alice’s wallet (i.e. ). These two outputs, in turn, become UTXOs that the respective receivers (i.e. Bob and Alice) can use for future transactions. Detailed information about the microstructure of the Blockchain, i.e. the content of its blocks, can be accessed by anyone, albeit the Bitcoin owners’ identity remains preserved. Coming back to our model, using three parameters, each block gets represented by a -dimensional normalised vector B, and the Blockchain gets mapped to a one-dimensional lattice. The resulting structure resembles an -vector model stanley01 with . Now, we highlight that the content of blocks cannot change over time, as the Blockchain is an immutable ledger. Therefore, although new spin vectors add to the chain, those added in the past do not modify their configuration. Also, spin vectors forming the current chain do not affect spin vectors that will add in the future. In summary, the Blockchain does not evolve as an Ising-like model. However, that does not prevent defining a Hamiltonian function, for instance, by fixing an instant of time to consider a limited number of spin vectors. In addition, we may assume that the spin configuration we observe at a given time represents an equilibrium configuration obtained at some temperature. In general, the Hamiltonian of a spin model minimises at low temperatures as ordered spin patterns emerge. Similarly, it increases its value at high temperatures as disordered spin patterns show up.
As detailed below, the formation of ordered and disordered spin patterns offers valuable information to analyse the evolution of the Blockchain. Then, the Hamiltonian of the obtained spin model (see also welsh01 ) reads
| (1) |
with interaction weight whose value is set to if , and spin vector corresponding to the -th block of the chain (the index represents the Blockheight and goes from to ). The scalar products in equation 1 get close to when consecutive vectors, i.e. blocks, are similar, otherwise get close to . Note that the scalar product usually can range from to . However, according to the range of values of the selected block parameters, the scalar product can span the interval . Eventually, to include long-range interactions in the Hamiltonian, whose amplitude decays with the distance , Equation 1 gets re-written as follows:
| (2) |
with .
In doing so, each block interacts with all previous ones. However, the exponential term weights the interactions between blocks, decaying over long distances. Such a decay gets controlled by the parameter .
Using the single components which sum over in equation 2, we obtain a collection of spin configurations that form ordered and disordered patterns.
Lastly, we emphasise that the formation of ordered and disordered patterns in the -vector model can get exploited for studying the relationships between the Blockchain and trends of Bitcoin in the crypto market.
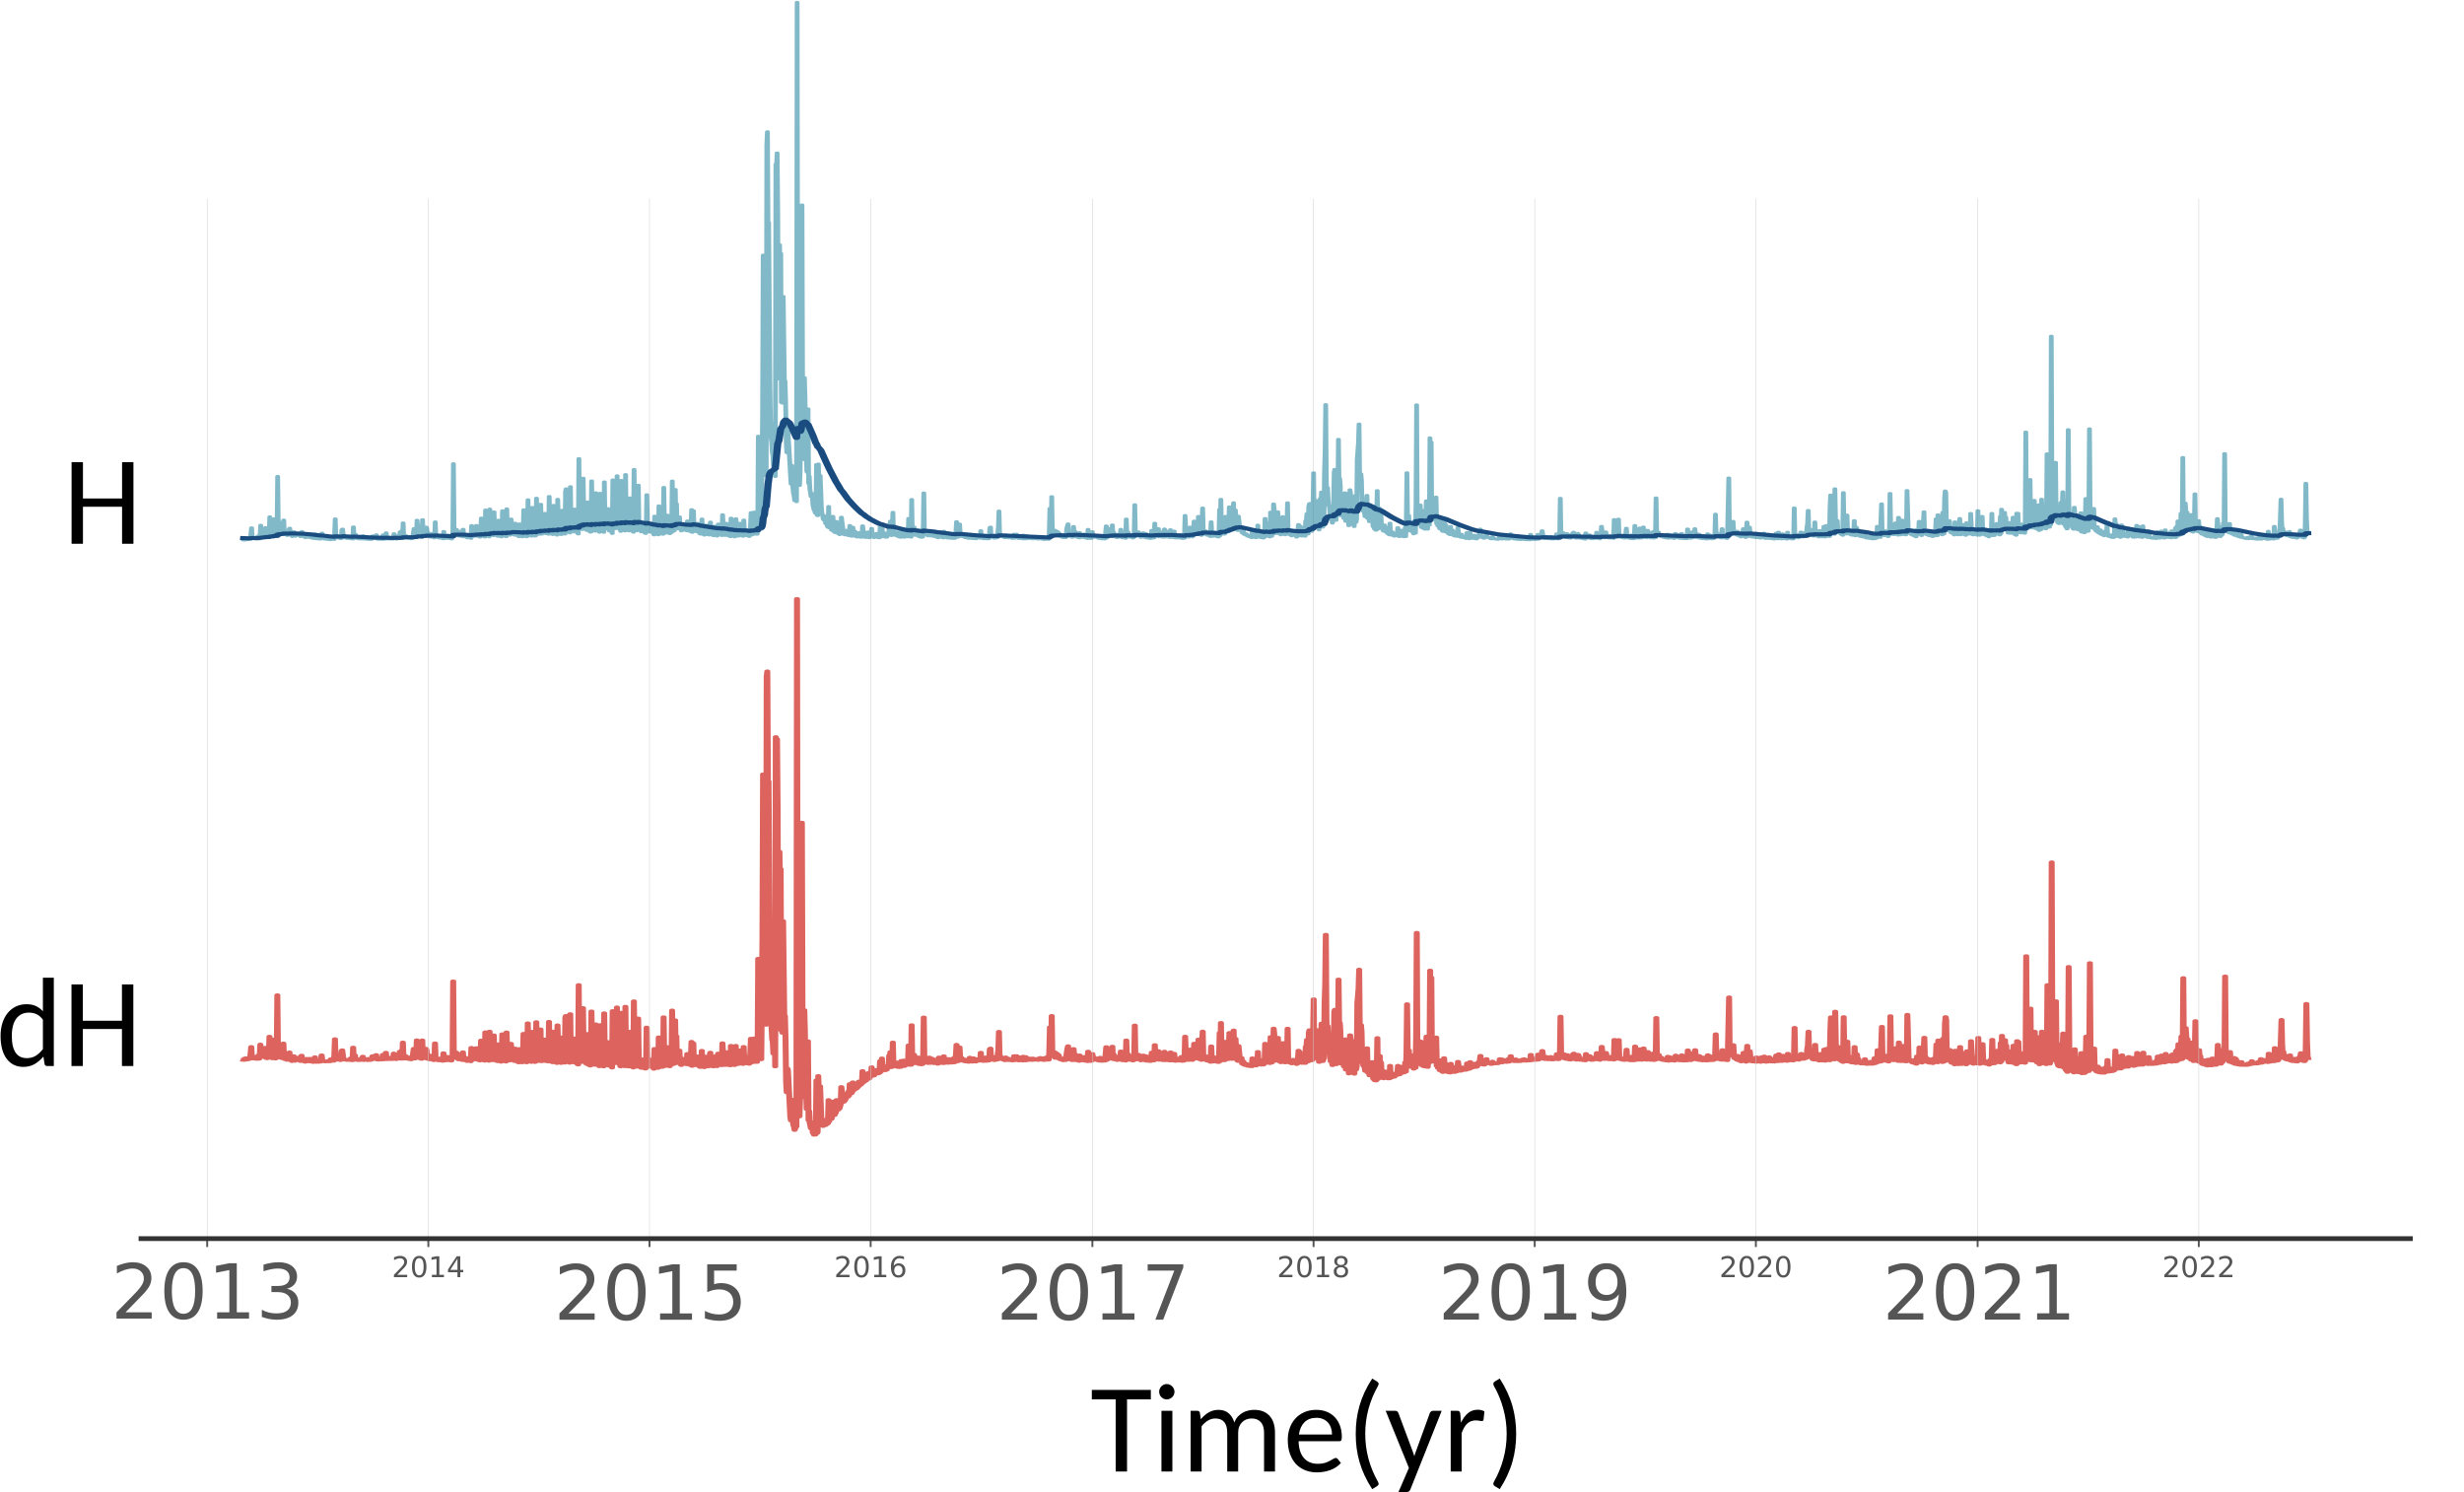
Results - The Hamiltonian defined in 2 can be decomposed in single contributions forming a time series, to which we refer to as . The latter, shown on the top of Figure 1, gets computed by setting a small enough to include only significant long-range interactions limited to the previous days.
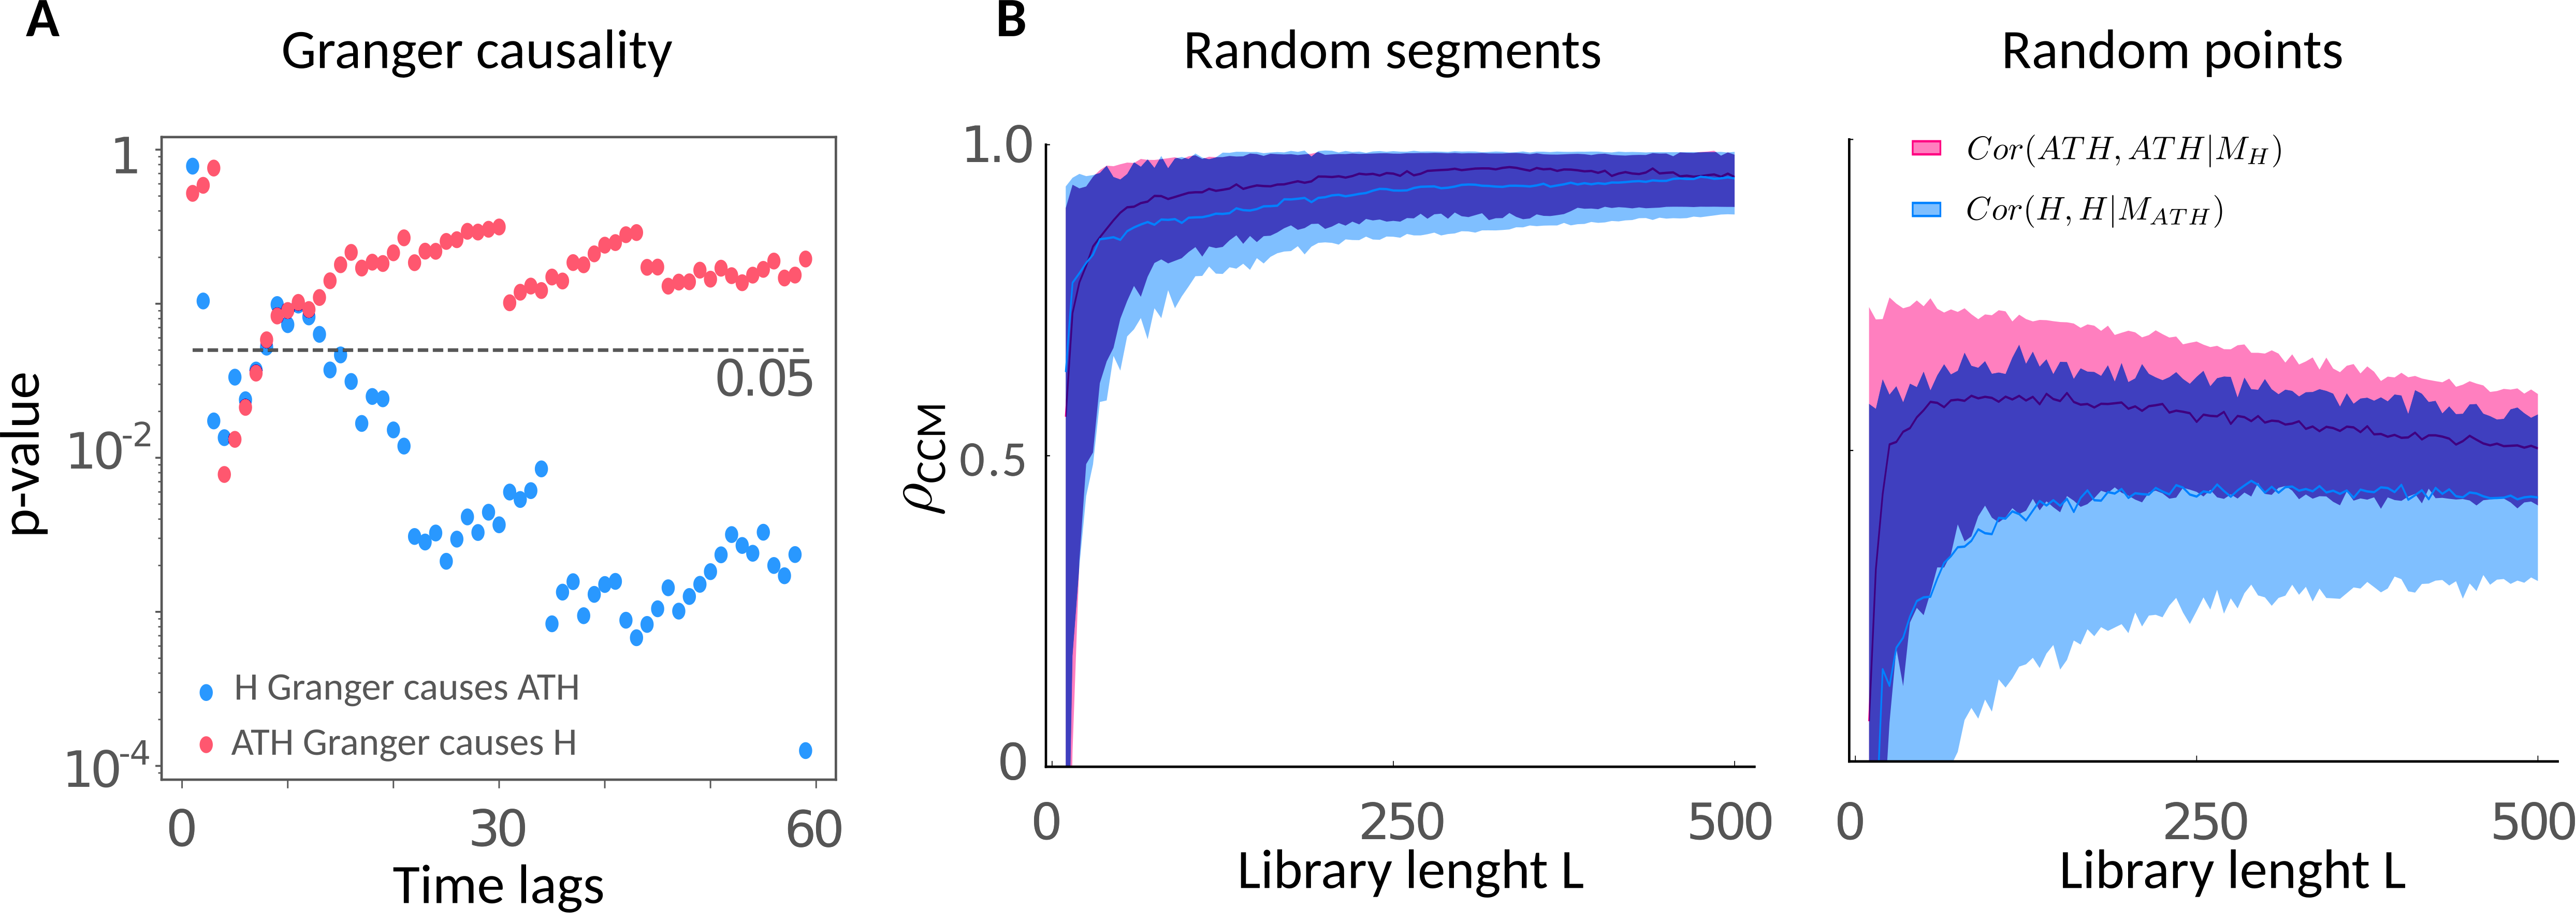
In addition, after applying an exponential moving average (EMA) to , we compute its time derivative. The resulting time series, i.e. , is shown at the bottom of Figure 1. Interestingly, signals in Figure 1 have a prominent peak temporally located around July 2015. After looking for the possible sources of such a peak, we found it corresponds to the Flood attack flood01 , a stress test performed for testing the Bitcoin network. Both and can get used for studying causal relationships with the crypto market and related phenomena. To this end, we focus on the ratio (i.e. Bitcoin in American Dollars) and work on the time series composed of samples of the percentual drawdown from the All-Time-High of the ratio. Notably, these samples equal every time Bitcoin overcomes its previous historical maximum. Accordingly, the time series related to the ratio, which we refer to as , and have the same range. To study the causal relationship between the Blockchain and the crypto market, we use only the time series, as and are strongly related. However, we anticipate that the time series becomes particularly relevant in the subsequent analysis. Accordingly, we now aim to infer a causal relationship between and , whose task constitutes a complex and old problem Cecconi . For this purpose, we consider approaches relying on statistics and dynamical systems theory. For the first case, i.e. approaches based on statistics, we perform the Granger causality test granger1969 . Given two variables, and , the Granger causality test compares the forecasting quality of future values of , of a standard ARMA model (Null-hypothesis), with the same ARMA having additional information on previous values of the variable . More in detail, is said to be Grange-cause of whether the quality of the forecasting using information over is significantly higher (p-value ) than the quality of the forecasting obtained without . The plot A in Figure 2 shows the result of this test, whose variables are and . In that figure, we report the p-value as a function of previous data points used in the fit of the ARMA model. Interestingly, the quality of the fit improves as the forecasting of exploits more information on , i.e. more historical data, suggesting a strong causal effect of over . The reverse is not the case since, according to the p-value, we have to accept the Null-Hypothesis, i.e. has no Granger causality over . For the sake of completeness, we also perform a Cross Convergent Mapping (CCM) sugihara01 ; Vinci test, which relies on dynamical systems theory and is deeply related to the Takens theorem and embedding theory Kantz . In this case, we look for a deterministic causality, which means that if two variables belong to the same dynamical system, one of them could be reconstructed by using the other (and vice versa) via a delayed embedding. Here, we consider the quality of the reconstruction of a variable through a second variable , which we refer to as . If such a quality increases with the number of data samples (defined as library length) the variable causally influences . Moreover, the faster the convergence to an asymptotic value of the CCM test, the stronger the dependence between the considered variables. A critical point of the CCM test lies in the sample selection to compose the library. So, following Luo , we perform the CCM test composing the library of samples by a random selection of contiguous segments and by a random selection of samples. Results are reported in the plot B of Figure 2. Here, we observe that both sampling strategies suggest a causal relationship between the two variables, i.e. and , in both directions.
We deem that the difference between the results obtained by the CCM test and the Granger causality test, i.e. a bi-directional causal relationship and a one-directional causal relationship, respectively, might be motivated considering that the Granger causality test can only detect linear causal relationships.
In light of the above result, we study whether the time series contains information to forecast Bitcoin trends in the crypto market.
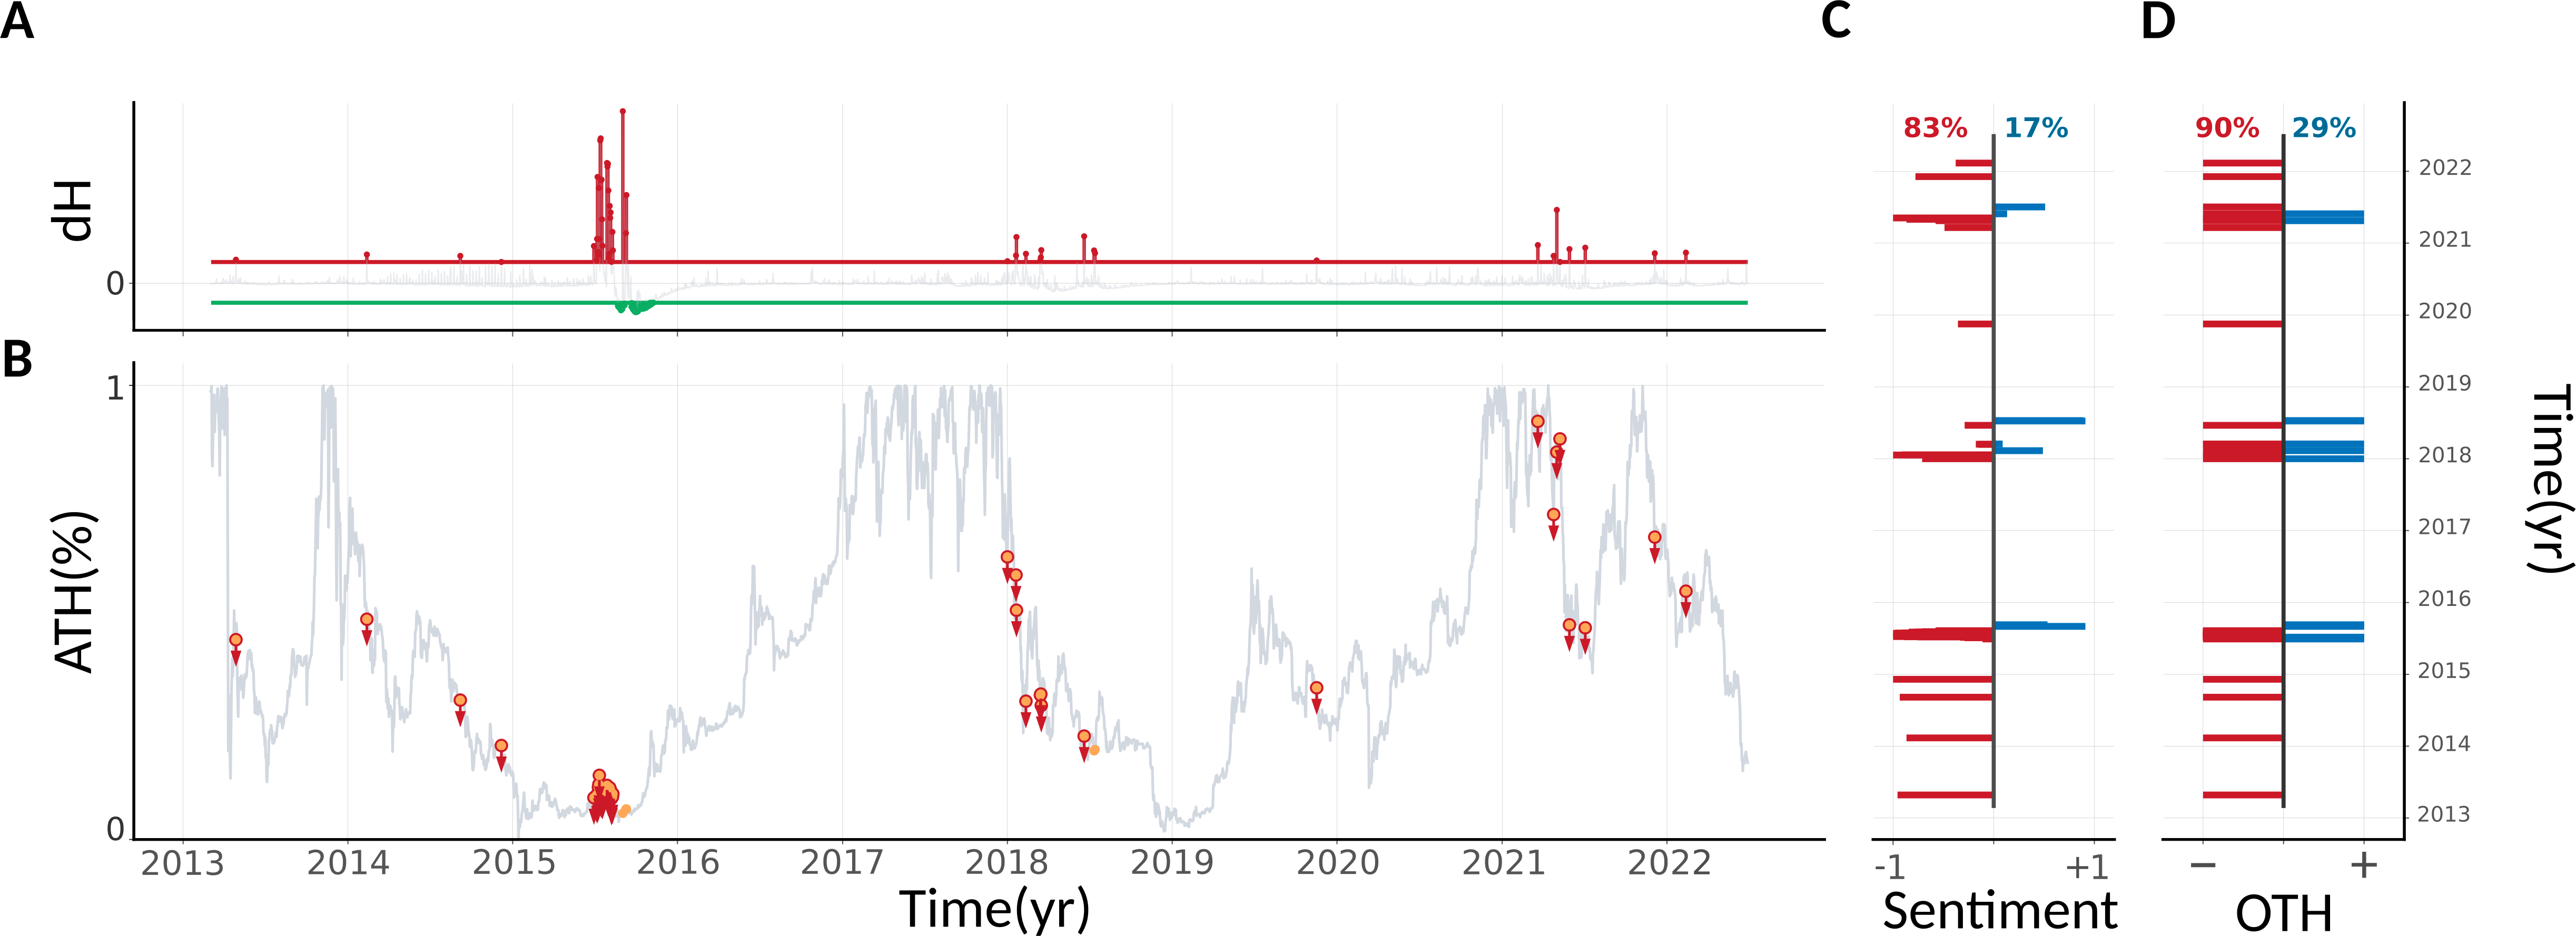
Remarkably, rapid variations of predate large fluctuations of . Therefore, the time series becomes particularly relevant for quantifying such phenomenon (Figure 3). More in detail, we observe that rapid increases in the time series (i.e. large positive fluctuations of ) can predict collapses in the value, while fast relaxations may indicate a local market recovery —see plot B in Figure 3. In addition, the of positive large fluctuations of are followed by a reduction of the value of at least (see plot D in Figure 3).
Conclusion - In summary, this work unveils relevant relationships between the dynamics of the Blockchain and the crypto market, focusing on the Bitcoin price. The investigation, motivated by observing that human behaviour affects both the dynamics of the Blockchain and those of the crypto market, exploits tools from statistical physics.
More specifically, we generated time series describing the evolution of the Blockchain via a spin-lattice model. Such time series allowed us to obtain the following results. Firstly, we detected a causal relationship between the Blockchain and the crypto market, and then we found Blockchain contains information to forecast some trends in Bitcoin price.
Remarkably, disordered patterns in the Blockchain, identified via the spin model, predate the phenomenon of Bitcoin panic selling, suggesting a fascinating connection between disorder and panic.
Before concluding, let us report a few observations about some previous investigations.
In aalborg01 , authors highlight the potential role of Bitcoin transactions in driving the Bitcoin trading volume and price. That is confirmed by our results, as we show that the number of Bitcoin transactions plays a role in forecasting the Bitcoin market trends.
In addition, some ideas and outcomes of our investigation remind works preis01 ; preis02 , which aimed at forecasting financial market trends by looking at Wikipedia and Google Trends analytics, respectively. Likewise, here we aim to foresee relevant phenomena in the crypto market, e.g. panic selling, by exploiting analytics data related to an external system, i.e. the Blockchain.
Finally, we deem the proposed model sheds light on relevant aspects of Bitcoin dynamics. Therefore, future works based on this investigation could address the behaviour of other cryptocurrencies and assess whether related results can support the design of trading strategies for the crypto market.
Acknowledgement
MAJ wishes to thank Marco Corradino for stimulating discussions and Mario Bortoli for helpful suggestions.
References
- (1) Nakamoto, S.: Bitcoin: A peer-to-peer electronic cash system. https://bitcoin.org/bitcoin.pdf, 2008
- (2) Antonopoulos, A. M.: Mastering Bitcoin: unlocking digital cryptocurrencies. O’Reilly Media, Inc., 2014.
- (3) Javarone, M. A., Wright, C. S.: Modeling a double-spending detection system for the bitcoin network. arXiv:1809.07678, 2018
- (4) ElBahrawy, A., Alessandretti, L., Kandler, A., Pastor-Satorras, R., Baronchelli, A.: Evolutionary dynamics of the cryptocurrency market. Royal Society open science, 4(11), 170623, 2017
- (5) de Marzo, G., Pandolfelli, F., Servedio, V. D.: Modeling innovation in the cryptocurrency ecosystem. Scientific Reports, 12(1), 1–12, 2022
- (6) Tasca P, Tessone CJ.: Taxonomy of blockchain technologies. Principles of identification and classification. Ledger, 4, 1–39, 2019
- (7) Spychiger F, Tasca P, Tessone C.J.: Unveiling the importance and evolution of design components through the “tree of blockchain”. Frontiers in Blockchain, 3:613476, 2021
- (8) Kristoufek, L.: What are the main drivers of the Bitcoin price? Evidence from wavelet coherence analysis. PloS one, 10(4), e0123923, 2015
- (9) Blau, B. M. : Price dynamics and speculative trading in bitcoin. Research in International Business and Finance, 41, 493-499,2017
- (10) Aalborg, H. A., Molnár, P., de Vries, J. E.: What can explain the price, volatility and trading volume of Bitcoin? Finance Research Letters, 29, 255-265, 2019
- (11) Amjad, M., Shah, D.: Trading bitcoin and online time series prediction. NIPS 2016 time series workshop - PMLR, 1–15, 2017
- (12) Javarone, M.A., Wright, C.S.: From Bitcoin to Bitcoin Cash: a network analysis. Proceedings of the 1st Workshop on Cryptocurrencies and Blockchains for Distributed Systems - ACM, 77–81, 2018
- (13) Vallarano, N., Tessone, C. J., Squartini, T.: Bitcoin Transaction Networks: an overview of recent results. Frontiers in Physics, 8 286, 2020
- (14) Lin, J. H., Primicerio, K., Squartini, T., Decker, C., Tessone, C. J.: Lightning Network: a second path towards centralisation of the Bitcoin economy. New Journal of Physics, 22(8), 083022, 2020
- (15) Campajola C, Cristodaro R, De Collibus FM, Yan T, Vallarano N, Tessone CJ. The evolution of centralisation on cryptocurrency platforms. 2022, arXiv:2206.05081, 2022
- (16) De Collibus FM, Partida A, Piškorec, M., Tessone CJ. Heterogeneous preferential attachment in key ethereum-based cryptoassets. Frontiers in Physics, 568, 2021
- (17) De Collibus FM, Piškorec, M., Partida, A., Tessone, CJ: The structural role of smart contracts and exchanges in the centralisation of ethereum-based cryptoassets. Entropy, 24(8),1048, 2022
- (18) Lin, J. H., Marchese, E., Tessone, C. J., Squartini, T.: The weighted Bitcoin Lightning Network. Chaos, Solitons & Fractals, 164, 2022
- (19) Yu, M.: Forecasting Bitcoin volatility: The role of leverage effect and uncertainty. Physica A: Statistical Mechanics and Its Applications, 533, 120707, 2019
- (20) Ortu, M., Uras, N., Conversano, C., Bartolucci, S., Destefanis, G.: On technical trading and social media indicators for cryptocurrency price classification through deep learning. Expert Systems with Applications, 198, 116804, 2022
- (21) Garcia, D., Tessone, C.J., Mavrodiev, P., Perony, N.: The digital traces of bubbles: feedback cycles between socio-economic signals in the Bitcoin economy Journal of the Royal Society Interface, 11(99), 20140623, 2014
- (22) Garcia, D., Schweitzer, F.: Social signals and algorithmic trading of Bitcoin. Royal Society open science, 2(9), 150288, 2015
- (23) Matta, M., Lunesu, I., Marchesi, M.: Bitcoin Spread Prediction Using Social and Web Search Media. UMAP workshops, 1–10, 2015
- (24) Cocco, L., Concas, G., Marchesi, M.: Using an artificial financial market for studying a cryptocurrency market. Journal of Economic Interaction and Coordination, 12(2), 345–365, 2017
- (25) Alessandretti, L., ElBahrawy, A., Aiello, L. M., Baronchelli, A.: Anticipating cryptocurrency prices using machine learning. Complexity, 2018
- (26) Kondor, D., Csabai, I., Szüle, J., Pósfai, M., Vattay, G.: Inferring the interplay between network structure and market effects in bitcoin. New Journal of Physics, 16(12), 125003, 2014
- (27) Blockchain.com missingLast Access: 20/09/2022, 2022
- (28) Glassnode Studio missingLast Access: 20/09/2022, 2022
- (29) Dai, D., Bao, F. S., Zhou, J., Chen, Y.: Block2vec: A deep learning strategy on mining block correlations in storage systems. 45th International Conference on Parallel Processing Workshops (ICPPW)-IEEE, 230–239, 2016
- (30) Stanley, H. E.: Dependence of critical properties on dimensionality of spins. Physical Review Letters, 20(12), 589, 1968
- (31) Welsh, D. J., Merino, C.: The Potts model and the Tutte polynomial. Journal of Mathematical Physics ,41(3), 1127–1152, 2000
- (32) July 2015 flood attack , Last Access: 20/09/2022, 2017
- (33) Cecconi, F., Cencini, M., Falcioni, M., Vulpiani, A.: Predicting the future from the past: An old problem from a modern perspective. American Journal of Physics, 80(11), 1001-1008, 2012
- (34) Granger, Clive WJ: Investigating causal relations by econometric models and cross-spectral methods. Econometrica: journal of the Econometric Society, 1969, 424–438, 1969
- (35) Sugihara, G., May, R., Ye, H., Hsieh, C. H., Deyle, E., Fogarty, M., Munch, S.: Detecting causality in complex ecosystems. Science, 338(6106), 496–500, 2012
- (36) Vinci, G.V., Benzi, R.: Economic complexity: Correlations between gross domestic product and fitness. Entropy, 20.10:766 (2018): 766.
- (37) Kantz, H., Schreiber, T.: Nonlinear time series analysis. Cambridge university press, 2004.
- (38) Luo, M., Kantz, H., Lau, N.-C., Huang, W., Zhou, Y.: Questionable dynamical evidence for causality between galactic cosmic rays and interannual variation in global temperature. Proc Natl Acad Sci, 2015
- (39) Moat, H. S., Curme, C., Avakian, A., Kenett, D. Y., Stanley, H. E., Preis, T.: Quantifying Wikipedia usage patterns before stock market moves. Scientific reports, 3(1), 1–5, 2013.
- (40) Preis, T., Moat, H. S., Stanley, H. E.: Quantifying trading behavior in financial markets using Google Trends. Scientific reports, 3(1), 1–6, 2013