Optical properties of SiV and GeV color centers in nanodiamonds under hydrostatic pressures up to 180 GPa
Abstract
We investigate the optical properties of silicon-vacancy (SiV) and germanium-vacancy (GeV) color centers in nanodiamonds under hydrostatic pressure up to 180 GPa. The nanodiamonds were synthetized by Si or Ge-doped plasma assisted chemical vapor deposition and, for our experiment, pressurized in a diamond anvil cell. Under hydrostatic pressure we observe blue-shifts of the SiV and GeV zero-phonon lines by 17 THz (70 meV) and 78 THz (320 meV), respectively. These measured pressure induced shifts are in good agreement with ab initio calculations that take into account the lattice compression based on the equation of state of diamond and that are extended to the case of the tin-vacancy (SnV) center. This work provides guidance on the use of group-IV-vacancy centers as quantum sensors under extreme pressures that will exploit their specific optical and spin properties induced by their intrinsic inversion-symmetric structure.
I Introduction
Quantum sensing consists in using quantum systems to perform measurement of given physical quantities [1]. Among the various systems that have been developed, the nitrogen-vacancy (NV) center in diamond has been used to demonstrate and implement a broad variety of sensing protocols, in particular for the measurement of magnetic and electric fields, and also for the detection of stress, temperature, mechanical vibrations, and fluctuating electromagnetic fields [2]. Due to the stiffness of the hosting diamond crystal, the NV center is also offering a powerful solution for probing matter at the extreme static pressures that are routinely achieved in a diamond anvil cell (DAC) consisting of two anvils that squeeze the sample between their flattened tips [3], as shown in Fig. 1a. In order to push the pressure limits, the pressure amplification of the DAC is optimized, essentially by reducing the culet diameter then putting a constraint on the sample size. For pressures above 100 GPa this leads to sample chambers of less than 50 m diameter and to the corresponding experimental difficulties in handling and signal detection. Using the optically detected magnetic resonance (ODMR) of the NV electronic spin that can be recorded by collecting the luminescence of the NV centers through the diamond anvil, recent works have shown the applicability of NV based optical magnetometry to micrometer sized samples under pressure and external magnetic fields [4, 5, 6]. Since the NV centers can be placed in close proximity to the sample, the NV based detection can be used to map the magnetic field distribution created by the sample magnetization, with a micrometer spatial resolution and with a sensitivity that remains mostly unaffected by the constraints on the sample size.
However the use of the NV center as a high pressure magnetic sensor suffers from some limitations, such as the implementation of the microwave excitation with the constraints associated to the DAC [5] or the detrimental influence of off-axis magnetic field that may prevent its practical use at high magnetic field [7]. These features are specific to the NV center and not to diamond in general. In particular the silicon-vacancy (SiV) and, to a somewhat lesser extent, germanium-vacancy (GeV) and tin-vacancy (SnV) centers in their negative charge state are alternative diamond point defects that have attracted considerable attention in the past decade [8]. These centers, commonly known as group-IV-vacancy (G4V) centers, share a nearly identical atomic structure. The reasons why G4V centers have potential advantages compared to the NV center are two-fold. First, G4V centers exhibit extraordinary spectral stability due to their intrinsic inversion-symmetric structure as shown in Fig. 1a [9, 10]. This property is associated to the point group symmetry of all G4V centers. Second, G4V centers offer the option of all-optical, microwave free, coherent control of their spin states [11, 12, 13, 14, 15, 16], allowing for applications where the use of microwave fields, as required for most NV-based sensing methods, is detrimental or technically challenging.
As a preliminary step to envisioning the use of G4V centers for high-pressure sensing, i.e. at pressures above the megabar, we report here the pressure dependence of the photoluminescence (PL) spectral properties of the SiV and GeV center at room temperature, using doped nanodiamonds in a DAC. The evolution of the PL center wavelength with pressure for these two G4V centers is well reproduced by ab initio density functional theory (DFT) calculation of the PL zero-phonon line (ZPL). In these calculations the pressure dependence is computed by varying the lattice parameter according to the equation of state of diamond that can be taken as a reference for the matrix hosting the point defect [17].
II Experimental set-up
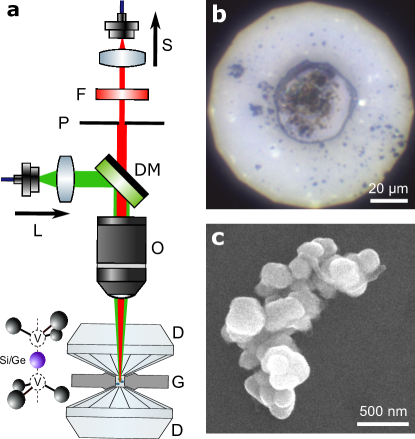
The pressure dependence of the G4V center PL spectra is investigated using nanodiamonds doped with SiV and GeV centers. The nanodiamonds were synthesized by plasma assisted chemical vapor deposition (CVD) while introducing inside the plasma a solid silicon or germanium source in the vicinity of a molybdenum holder [18]. The amount of SiV and GeV centers directly produced in the nanodiamonds can be controlled by adding N2 and O2 gases to the standard mixture of H2/CH4 used for the CVD diamond growth [19]. This method is well suited for the mass production of nanodiamonds doped with SiV or GeV centers. We estimate the incorporated color center density to a few tens of ppb, corresponding to several hundreds of color centers per nanodiamond with a typical size of about 200 nm. The nanodiamonds are then retrieved by rinsing the holder with ethanol. A drop of L of each of these solutions is then deposited on the flattened tips of diamond anvils. The anvils, made of synthetic ultrapure diamond, are cut with Almax-Boehler design [20]. The anvil tip is a (100) cristallographic plane and has a diameter of 100 m. After the evaporation of the ethanol solvent, clusters of the CVD-grown nanodiamonds appear on the tip, as shown in Figs. 1b and 1c.
The anvils are mounted in a non-magnetic DAC with a rhenium metallic gasket ensuring lateral confinement (Fig. 1a). The DAC is loaded with neon gas as the pressure transmitting medium. The soft neon environment, which becomes solid at [21], ensures the hydrostatic compression of the nanodiamonds. The pressure in the DAC can be continuously tuned using a metallic membrane that controls the load applied on the anvils [22]. The DAC is then integrated in a customized optical confocal microscope equipped with a microscope objective (0.35 numerical aperture and 18 mm working distance) that collects the PL of the G4V centers through the diamond anvil on which the nanodiamonds have been deposited.
III Spectroscopy of the silicon-vacancy center
PL spectra of seven clusters of SiV-doped nanodiamonds were recorded for increasing pressures up to 180 GPa where the failure of an anvil induced an irreversible decompression of the DAC. The PL was excited using a single-mode cw laser at 532 nm wavelength. A ruby crystal of micrometer size was introduced in the DAC as a pressure gauge [23]. The pressure in the DAC was simultaneously determined from the shifts of the ruby PL and of the first-order Raman mode of the diamond anvil under load, following the analysis described in Ref. [24].
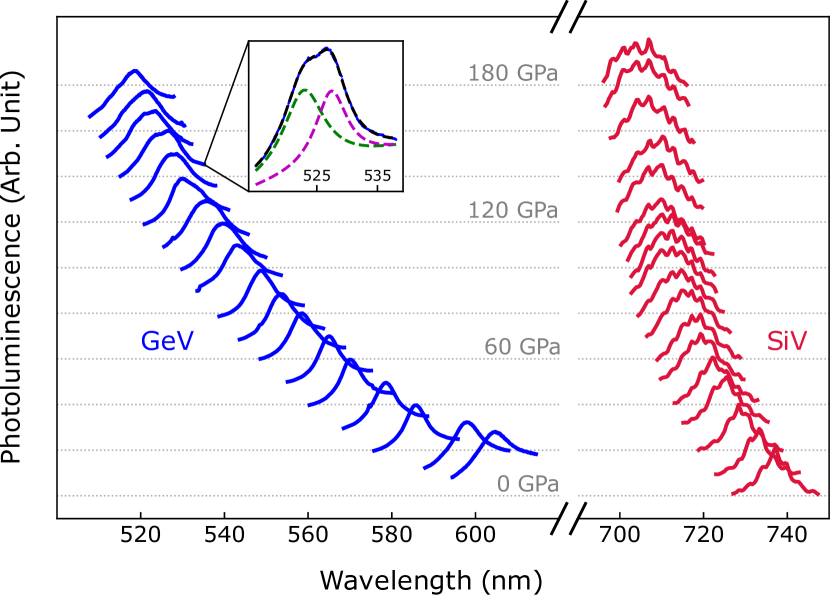
Fig. 2 shows the spectra recorded on one cluster of SiV-doped nanodiamonds for increasing pressure steps of about 10 GPa. The increase of pressure induces a blue shift of the PL line as expected from the enhanced confinement of the SiV electronic wavefunctions in the ground and excited states. The spectra are then fitted by a Lorentzian function in order to determine both the center emission wavelength and the linewidth. Recorded with a constant laser excitation power of 15 mW, the total PL intensity associated to a given nanodiamond slightly decreased with increasing pressure. We attribute this effect to the shift of the absorption spectrum, leading to a decrease of the absorption cross-section at 532 nm wavelength.
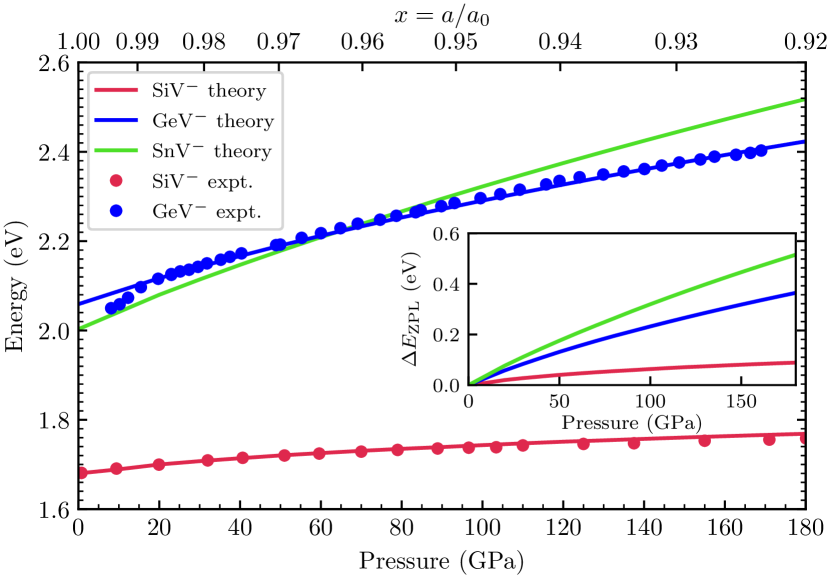
The pressure dependence of the center energy, averaged over the seven aggregates that were investigated, is shown on Fig. 3. We estimated the error of the pressure measurement as GPa below 79 GPa, where the pressure was accurately determined using the Ruby reference, and GPa for the Raman scattering pressure measurement that was used above 79 GPa. The statistical error of the SiV mean energy is about meV for 95% confidence interval. The graph also indicates the corresponding value of the lattice parameter inferred from the equation of state of diamond under hydrostatic condition [17]. The results are in good agreement with previous measurements where the pressure dependence of the SiV PL was measured up to 50 GPa using HPHT grown nanodiamonds loaded in a DAC [25]. Although the size of the anvil tip prevented us to record a significant number of points at the start of the pressure exploration, the shift as a function of pressure below 20 GPa is approximately linear with a slope of about 1 meV/GPa. This value agrees with independent measurements previously performed in this weak strain regime by bending a diamond cantilever that integrated a single SiV center [26].
Fig. 2 also shows that the pressure induced shift is associated to a broadening of the PL. Indeed the ab initio DFT calculation on the strain induced ZPL shift done in Ref. [27] showed that hydrostatic pressure results in a blue shift whereas uniaxial stress results in red shifts. The broad inhomogeneous distribution of the spectral properties of SiV centers that is observed in milled or CVD grown nanodiamonds was then explained by the uncontrolled strain environment compared to the highly reproducible properties of SiV centers designed by ion implantation in high quality bulk diamond crystals. Such inhomogeneities could be reduced by the synthesis of high-pressure high-temperature nanodiamonds with Si or Ge precursors [28, 29] or by improving the CVD growth process [30]. The PL linewidth also depends on the electron-phonon interaction. Since the electronic states are shifted and mixed by strain, the electron-phonon scattering might be affected (see e.g. Ref. [27]) then possibly contributing to a pressure-dependent homogeneous broadening of the PL spectrum.
IV Spectroscopy of the germanium-vacancy center
A similar and complementary experiment was performed by loading a DAC with GeV-doped nanodiamonds and recording the evolution of their PL with increasing pressures up to about 170 GPa. The DAC was prepared following the same procedure as previously without integrating a ruby crystal since its PL could induce a parasitic signal superimposed with the GeV PL. The pressure in the DAC was then determined from the first-order Raman mode associated to the compression of the diamond lattice, using the same analysis as in the SiV experiment [24].
Fig. 2 shows the spectra recorded on a given cluster of GeV-doped nanodiamonds, exhibiting a similar behavior as for the SiV-doped nanodiamonds. From 8 GPa to 93 GPa, the GeV centers were excited using a single-mode cw laser at 532 nm wavelength and with a power of 75 mW. Above this pressure, the laser excitation was switched to a single-mode cw laser at 488 nm wavelength in order to compensate the blue shift of the GeV absorption spectrum. The laser excitation power was 37 mW. The PL spectrum could then be recorded until the failure of the anvils that happened at 168 GPa. Note that above approximately 100 GPa, the PL line is split in two components as shown in the inset of figure 2. This splitting could be induced by the non-hydrostatic stress inside the nanodiamond which then breaks the symmetry that characterizes the G4V center [31, 32], similarly to previous measurements realized on the NV center [33]. The experimental spectra were then fitted by two Lorentzian functions and the PL center energy was taken as the average of the two center positions of this fit.
Fig. 3 shows the evolution of the PL center energy, averaged over the three clusters of GeV-doped nanodiamonds that were investigated, as a function of the pressure in the DAC. The pressure was determined with an uncertainty of GPa and the statistical error of the GeV mean energy is about meV for 95% confidence interval. The shift with pressure is about four times faster for the GeV center than for the SiV center.
V Ab initio study of ZPL energies as a function of pressure
V.1 Methodology
The electronic structure and the optical excitation energies of the G4V centers in diamond can be efficiently computed using the spin-polarized DFT formalism. In the molecular-orbital picture, the ground and excited states of these point defects can be expressed as single Slater determinant wavefunctions with respective electronic configurations of and [9]. Therefore, in the framework of Kohn–Sham DFT, the energy and geometric structure of the excited state can be calculated by employing the so-called delta-self-consistent-field (SCF) approximation, whereby one electron in the lower-lying occupied Kohn–Sham level is promoted to an empty level (see, e.g., Refs. [9, 10, 34]).
To describe the SiV and the GeV centers’ electronic structure and extend it to the case of the SnV center, we used the SCAN exchange–correlation functional [35] that belongs to the class of so-called meta-GGA functionals. This functional provides an accurate description of bulk diamond structural properties, yielding predictions of the diamond lattice constant and bulk modulus (based on the Rose–Vinet equation of state [36]) in close agreement with the experimental values [37] and [38]. The point defects were then modeled using supercells with 512 atomic sites, and the Brillouin zone was sampled at the point. We used the projector-augmented wave (PAW) approach [39] as implemented in the Vienna Ab-initio Simulation Package (VASP) [40] with a plane-wave energy cutoff of 600 eV. Calculations for non-zero stresses are then performed by modifying the lattice constant of the defected cell according to the equation of state of diamond [36, 17] using theoretical parameters calculated for bulk diamond.
V.2 Results
The ZPL energies at each pressure are calculated as the difference between the total energies of the excited and ground states using the SCF approximation. At zero pressure, we obtain ZPL energies of 1.57 eV, 2.00 eV, and 1.98 eV for the negatively charged SiV, GeV, and SnV centers, respectively. These values are slightly smaller than the experimentally measured ZPL energies of 1.68 eV, 2.06 eV, and 2.00 eV. Note that the accuracy of the SCF method with SCAN functional is close to that of the HSE functional [10], albeit at much lower computational costs.
The calculated ZPL values of G4V centers as a pressure function are shown in Fig. 3 by solid lines. For a meaningful comparison with an experiment, a constant offset is applied to the theoretical curves so that the ZPL energies at null pressure correspond to the reported experimental values. When aligned this way, the DFT results agree very well with the center energies that were previously measured for the SiV and the GeV centers in all the pressure range that was probed in the experiments.
The inset of Fig. 3 shows the relative change of theoretical ZPL energy (ZPL) for the three different G4V centers as a function of pressure. We see that the rate of change is more pronounced for heavier impurity atoms with higher atomic radii. Keeping in mind the similarity of the electronic structure of all G4V defects, this naturally prompts a question regarding the reason for this difference.
V.3 Single-particle picture
Inspection of Kohn–Sham molecular orbital states reveals that the trend can be explained qualitatively using a single-particle picture. Indeed the single-particle energies allow for a qualitative chemical insight since the excitation energy can be roughly approximated as a difference between unoccupied and occupied states.
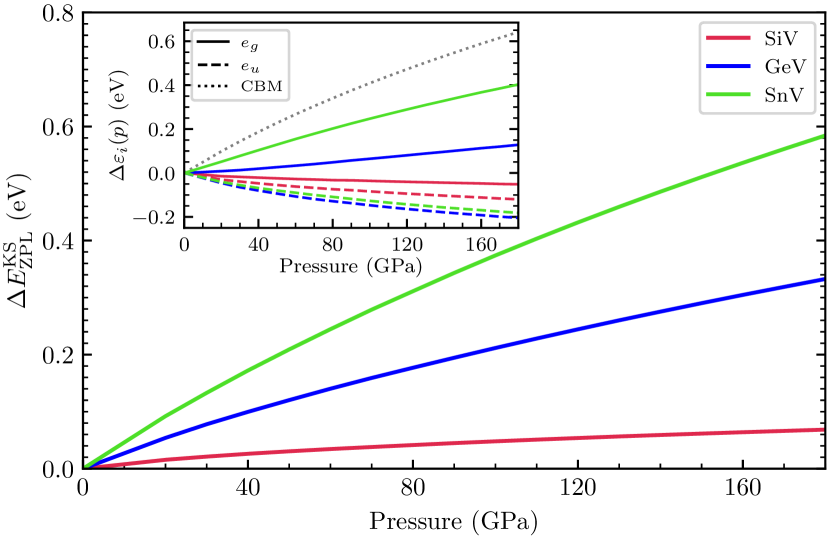
Fig. 4 shows the relative change of the ZPL as a function of pressure as calculated from a difference between and single-particle energies in the electronic ground state. To investigate the orbital energy response to strain, the inset of Fig. 4 shows the change of single-particle energies in the reference system of valence band maximum (VBM) . Here, is the Kohn–Sham energy of orbital at pressure , and is the orbital energy of VBM. One can observe that the major difference between all three G4V centers lies in the deformation potential of the orbital. Based on the argument that the VBM and conduction band minimum (CBM) states are of bonding and antibonding characters [41], one can deduce that orbital changes its nature from bonding to antibonding as we increase the atomic number of the group-IV atom. An extended analysis of the difference in the electronic structure and chemical bonding of G4V centers will be given in an upcoming study.
VI Summary and conclusion
We measured the pressure dependence of the SiV and GeV PL to about 180 GPa by integrating nanodiamonds in a DAC that were doped with Si or Ge impurities during their plasma-assisted growth. The experimental results are in good agreement with ab initio calculations that compute the pressure dependence of the ZPL of these G4V centers to the equation of state of diamond. This direct link suggests that SiV and GeV centers could be used as pressure calibration gauges, adding a new tool to the implementation of a practical pressure scale above the megabar [23].
The pressure dependence of the PL energies also reveals a difference between the G4V centers, being more rigidly bonded in the diamond crystal lattice for increasing atomic radii. These measurements are the first steps to determine the optical and magnetic properties of G4V centers under a broad set of parameters that could be explored by combining high pressure and low temperature: Jahn-Teller relaxation energies, spin-orbit splitting of the ground and excited states under the influence of high stress, orbital relaxation rate. Lastly, charge-neutral G4V centers, and in particular the
neutral SiV0 center [42], could be a complementary resource since these defects can host a coherent spin that can be optically addressed with near infrared light.
VII Acknowledgments
We are grateful to Paul Loubeyre for his insightful advices and comments, and to Florent Occelli for his constant help and availability in handling high pressure instrumentation. Funding: This work has received funding from the QuantERA II program under project no. 4991922368 SENSEXTREME (grant S-QUANTERA-22-1 from the Research Council of Lithuania), from the Agence Nationale de la Recherche under the project SADAHPT and the ESR/EquipEx+ program (grant number ANR-21-ESRE-0031), from the EMPIR program co-financed by the Participating States and the European Union’s Horizon 2020 research and innovation program (20IND05 QADeT), and from the Paris Île-de-France Région in the framework of DIM SIRTEQ. Computations were performed on the supercomputer GALAX of the Center for Physical Sciences and Technology, Lithuania, and on the High-Performance Computing Center “HPC Sauletekis” in the Faculty of Physics, Vilnius University. A.G. acknowledges the National Research, Development, and Innovation Office of Hungary (NKFIH) grant No. KKP129866 of the National Excellence Program of Quantum-coherent materials project and the Quantum Information National Laboratory supported by the Ministry of Innovation and Technology of Hungary. The work of BV was funded by a Ph.D. research grant from Délégation Générale de l’Armement. JFR acknowledges support from Institut Universitaire de France. Data and material availability: All experimental data described here are available at Zenodo [43].
VIII Appendix
| SiV center | GeV center | SnV center | |
| Measured | (0-20 GPa) | (20-40 GPa) | |
| Computed (below ) | 1.00 | 2.90 | 3.85 |
| Ref. [25] (below ) | 1.09 | ||
| Ref. [44] (below ) | 3.11 | ||
| Ref. [45] (below ) | 3.52 | ||
| Ref. [46] (DFT) | 1.1 | 3.2 | 3.5 |
Table 1 compares our measured and computed values of the linear dependence of the PL mean energies and ZPL energies in the low pressure regime (up to 20 GPa) with previously published values. The experimental values were obtained by integrating in a DAC powders of Si [25], Ge [44] and Sn [45] doped microcrystals that were synthetized from hydrocarbons at high pressures and high temperatures. The table also indicates the pressure shift that was previously computed using the Quantum ESPRESSO package implemented with a computational periodic supercell consisting of 83 atomic sites [46].
References
- Degen et al. [2017] C. L. Degen, F. Reinhard, and P. Cappellaro, Reviews of Modern Physics 89, 035002 (2017), 1611.02427 .
- Rondin et al. [2014] L. Rondin, J.-P. Tetienne, T. Hingant, J.-F. Roch, P. Maletinsky, and V. Jacques, Reports on Progress in Physics 77, 056503 (2014).
- Eremets [1996] M. I. Eremets, High Pressure Experimental Methods (Oxford University Press, Oxford, 1996).
- Hsieh et al. [2019] S. Hsieh, P. Bhattacharyya, C. Zu, T. Mittiga, T. J. Smart, F. Machado, B. Kobrin, T. O. Höhn, N. Z. Rui, M. Kamrani, S. Chatterjee, S. Choi, M. Zaletel, V. V. Struzhkin, J. E. Moore, V. I. Levitas, R. Jeanloz, and N. Y. Yao, Science 366, 1349 (2019).
- Lesik et al. [2019] M. Lesik, T. Plisson, L. Toraille, J. Renaud, F. Occelli, M. Schmidt, O. Salord, A. Delobbe, T. Debuisschert, L. Rondin, P. Loubeyre, and J.-F. Roch, Science 366, 1359 (2019).
- Yip et al. [2019] K. Y. Yip, K. O. Ho, K. Y. Yu, Y. Chen, W. Zhang, S. Kasahara, Y. Mizukami, T. Shibauchi, Y. Matsuda, S. K. Goh, and S. Yang, Science 366, 1355 (2019).
- Tetienne et al. [2012] J.-P. Tetienne, L. Rondin, P. Spinicelli, M. Chipaux, T. Debuisschert, J.-F. Roch, and V. Jacques, New Journal of Physics 14, 103033 (2012).
- Thiering and Gali [2020] G. Thiering and A. Gali, in Diamond for Quantum Applications Part 1, Semiconductors and Semimetals, Vol. 103, edited by R. Mendelsohn and J. E. Neumann (Academic Press, 2020) Chap. 1, pp. 1–36.
- Gali and Maze [2013] A. Gali and J. R. Maze, Physical Review B 88, 235205 (2013), 1310.2137 .
- Thiering and Gali [2018] G. Thiering and A. Gali, Physical Review X 8, 021063 (2018), 1804.07004 .
- Pingault et al. [2014] B. Pingault, J. N. Becker, C. Schulte, C. Arend, C. Hepp, T. Godde, A. I. Tartakovskii, M. Markham, C. Becher, and M. Atatüre, Physical Review Letters 113, 263601 (2014).
- Becker et al. [2016] J. N. Becker, J. Görlitz, C. Arend, M. Markham, and C. Becher, Nature Communications 7, 13512 (2016), 1603.00789 .
- Siyushev et al. [2017] P. Siyushev, M. H. Metsch, A. Ijaz, J. M. Binder, M. K. Bhaskar, D. D. Sukachev, A. Sipahigil, R. E. Evans, C. T. Nguyen, M. D. Lukin, P. R. Hemmer, Y. N. Palyanov, I. N. Kupriyanov, Y. M. Borzdov, L. J. Rogers, and F. Jelezko, Physical Review B 96, 081201 (2017), 1612.02947 .
- Becker et al. [2018] J. N. Becker, B. Pingault, D. Groß, M. Gündoğan, N. Kukharchyk, M. Markham, A. Edmonds, M. Atatüre, P. Bushev, and C. Becher, Physical Review Letters 120, 053603 (2018), 1708.08263 .
- Weinzetl et al. [2019] C. Weinzetl, J. Görlitz, J. N. Becker, I. A. Walmsley, E. Poem, J. Nunn, and C. Becher, Physical Review Letters 122, 063601 (2019), 1805.12227 .
- Debroux et al. [2021] R. Debroux, C. P. Michaels, C. M. Purser, N. Wan, M. E. Trusheim, J. A. Martínez, R. A. Parker, A. M. Stramma, K. C. Chen, L. d. Santis, E. M. Alexeev, A. C. Ferrari, D. Englund, D. A. Gangloff, and M. Atatüre, Physical Review X 11, 041041 (2021), 2106.00723 .
- Occelli et al. [2003] F. Occelli, P. Loubeyre, and R. Letoullec, Nature Materials 2, 151 (2003).
- Feudis et al. [2020] M. D. Feudis, A. Tallaire, L. Nicolas, O. Brinza, P. Goldner, G. Hétet, F. Bénédic, and J. Achard, Advanced Materials Interfaces 7, 1901408 (2020).
- Tallaire et al. [2019] A. Tallaire, O. Brinza, M. De Feudis, A. Ferrier, N. Touati, L. Binet, L. Nicolas, T. Delord, G. Hétet, T. Herzig, S. Pezzagna, P. Goldner, and J. Achard, ACS Applied Nano Materials 2, 5952 (2019).
- Boehler and Hantsetters [2004] R. Boehler and K. D. Hantsetters, High Pressure Research 24, 391 (2004).
- Vos et al. [1991] W. L. Vos, J. A. Schouten, D. A. Young, and M. Ross, The Journal of Chemical Physics 94, 3835 (1991).
- Letoullec et al. [1988] R. Letoullec, J. P. Pinceaux, and P. Loubeyre, High Pressure Research 1, 77 (1988).
- Shen et al. [2020] G. Shen, Y. Wang, A. Dewaele, C. Wu, D. E. Fratanduono, J. Eggert, S. Klotz, K. F. Dziubek, P. Loubeyre, O. V. Fat’yanov, P. D. Asimow, T. Mashimo, R. M. M. Wentzcovitch, and other members of the IPPS task, High Pressure Research 40, 1 (2020).
- Akahama and Kawamura [2004] Y. Akahama and H. Kawamura, Journal of Applied Physics 96, 3748 (2004).
- Lyapin et al. [2018a] S. Lyapin, I. Ilichev, A. Novikov, V. Davydov, and V. Agafonov, Nanosystems: Physics, Chemistry, Mathematics 9, 55 (2018a).
- Meesala et al. [2018] S. Meesala, Y.-I. Sohn, B. Pingault, L. Shao, H. A. Atikian, J. Holzgrafe, M. Gündoğan, C. Stavrakas, A. Sipahigil, C. Chia, R. Evans, M. J. Burek, M. Zhang, L. Wu, J. L. Pacheco, J. Abraham, E. Bielejec, M. D. Lukin, M. Atatüre, and M. Lončar, Physical Review B 97, 205444 (2018).
- Lindner et al. [2018] S. Lindner, A. Bommer, A. Muzha, A. Krueger, L. Gines, S. Mandal, O. Williams, E. Londero, A. Gali, and C. Becher, New Journal of Physics 20, 115002 (2018).
- Davydov et al. [2014] V. A. Davydov, A. V. Rakhmanina, S. G. Lyapin, I. D. Ilichev, K. N. Boldyrev, A. A. Shiryaev, and V. N. Agafonov, JETP Letters 99, 585 (2014).
- Nguyen et al. [2018] C. T. Nguyen, R. E. Evans, A. Sipahigil, M. K. Bhaskar, D. D. Sukachev, V. N. Agafonov, V. A. Davydov, L. F. Kulikova, F. Jelezko, and M. D. Lukin, Applied Physics Letters 112, 203102 (2018), 1708.05419 .
- Isa et al. [2022] F. Isa, M. Joliffe, B. Wouterlood, N. H. Ho, T. Volz, A. Bendavid, and L. J. Rogers, arXiv (2022), 2208.08075 .
- Hughes and Runciman [1967] A. E. Hughes and W. A. Runciman, Proceedings of the Physical Society 90, 827 (1967).
- Hepp et al. [2014] C. Hepp, T. Müller, V. Waselowski, J. N. Becker, B. Pingault, H. Sternschulte, D. Steinmüller-Nethl, A. Gali, J. R. Maze, M. Atatüre, and C. Becher, Physical Review Letters 112, 036405 (2014).
- Grazioso et al. [2013] F. Grazioso, B. R. Patton, P. Delaney, M. L. Markham, D. J. Twitchen, and J. M. Smith, Applied Physics Letters 103, 101905 (2013).
- Londero et al. [2018] E. Londero, G. Thiering, L. Razinkovas, A. Gali, and A. Alkauskas, Phys. Rev. B 98, 035306 (2018).
- Sun et al. [2015] J. Sun, A. Ruzsinszky, and J. P. Perdew, Phys. Rev. Lett. 115, 036402 (2015).
- Vinet et al. [1987] P. Vinet, J. R. Smith, J. Ferrante, and J. H. Rose, Phys. Rev. B 35, 1945 (1987).
- Hao et al. [2012] P. Hao, Y. Fang, J. Sun, G. I. Csonka, P. H. T. Philipsen, and J. P. Perdew, Physical Review B 85, 014111 (2012).
- Zouboulis et al. [1998] E. S. Zouboulis, M. Grimsditch, A. K. Ramdas, and S. Rodriguez, Physical Review B 57, 2889 (1998).
- Blöchl [1994] P. E. Blöchl, Physical review B 50, 17953 (1994).
- Kresse and Furthmüller [1996] G. Kresse and J. Furthmüller, Phys. Rev. B 54, 11169 (1996).
- Harrison [2012] W. A. Harrison, Electronic structure and the properties of solids: The physics of the chemical bond (Courier Corporation, 2012).
- Rose et al. [2018] B. C. Rose, D. Huang, Z.-H. Zhang, P. Stevenson, A. M. Tyryshkin, S. Sangtawesin, S. Srinivasan, L. Loudin, M. L. Markham, A. M. Edmonds, D. J. Twitchen, S. A. Lyon, and N. P. de Leon, Science 361, 60 (2018), 1706.01555 .
- Vindolet et al. [2022] B. Vindolet et al., Replication data for: Optical properties of SiV and GeV color centers in nanodiamonds under hydrostatic pressures up to 180 GPa, Zenodo https://doi.org/10.5281/zenodo.7086416 (2022), online; accessed 16 September 2022.
- Lyapin et al. [2018b] S. G. Lyapin, A. A. Razgulov, A. P. Novikov, E. A. Ekimov, and M. V. Kondrin, Nanosystems: Physics, Chemistry, Mathematics 9, 67 (2018b).
- Razgulov et al. [2021] A. Razgulov, S. Lyapin, A. Novikov, and E. Ekimov, Diamond and Related Materials 116, 108379 (2021).
- Ekimov et al. [2019] E. A. Ekimov, S. G. Lyapin, A. A. Razgulov, and M. V. Kondrin, Journal of Experimental and Theoretical Physics 129, 855 (2019).