Gamma-ray observations of MAXI J1820+070 during the 2018 outburst
Abstract
MAXI J1820+070 is a low-mass X-ray binary with a black hole as a compact object. This binary underwent an exceptionally bright X-ray outburst from March to October 2018, showing evidence of a non-thermal particle population through its radio emission during this whole period. The combined results of 59.5 hours of observations of the MAXI J1820+070 outburst with the H.E.S.S., MAGIC and VERITAS experiments at energies above 200 GeV are presented, together with Fermi-LAT data between 0.1 and 500 GeV, and multiwavelength observations from radio to X-rays. Gamma-ray emission is not detected from MAXI J1820+070, but the obtained upper limits and the multiwavelength data allow us to put meaningful constraints on the source properties under reasonable assumptions regarding the non-thermal particle population and the jet synchrotron spectrum. In particular, it is possible to show that, if a high-energy gamma-ray emitting region is present during the hard state of the source, its predicted flux should be at most a factor of 20 below the obtained Fermi-LAT upper limits, and closer to them for magnetic fields significantly below equipartition. During the state transitions, under the plausible assumption that electrons are accelerated up to GeV, the multiwavelength data and the gamma-ray upper limits lead consistently to the conclusion that a potential high-energy and very-high-energy gamma-ray emitting region should be located at a distance from the black hole ranging between and cm. Similar outbursts from low-mass X-ray binaries might be detectable in the near future with upcoming instruments such as CTA.
keywords:
stars: individual: MAXI J1820+070 – gamma rays: general – stars: black holes – X-rays: binaries1 Introduction
X-ray binaries are systems in which a compact object – either a black hole (BH) or a neutron star – accretes matter from a companion star. In low-mass X-ray binaries, the companion mass is below , and accretion on to the compact object normally takes place through an accretion disk generated by the Roche lobe overflow mechanism (e.g. Remillard & McClintock, 2006). Typically, low-mass X-ray binaries with a BH (BH-LMXBs) also feature transient jets launched from the BH, which are powered by the accretion process, the magnetic field, the BH rotation, or a combination of them (see Romero et al., 2017, and references therein). These jets can efficiently accelerate charged particles, potentially up to GeV or TeV energies, and emit non-thermal radiation from radio to gamma rays as a result of the radiative cooling of the accelerated particles (see e.g., Mirabel & Rodríguez, 1999; Fender & Muñoz-Darias, 2016, for a review on jets in X-ray binaries).
Most of the time, BH-LMXBs are in a quiescent state until they undergo periodic outbursts likely triggered by variations in the properties of the accretion disk that result in a change of the mass accretion rate on to the BH (e.g. Fender & Belloni, 2012). During one of these outbursts, that may last for several months, the luminosity of a BH-LMXB increases by several orders of magnitude. A BH-LMXB can be detected in a soft state (SS) or a hard state (HS) based on the hardness of its X-ray spectrum during one of these outbursts. At the beginning of the outburst, a BH-LMXB is typically in the HS, in which the X-rays exhibit a hard-spectrum component. This emission likely originates in a hot corona around the BH, where inverse Compton (IC) scattering of low-energy photons coming from the accretion disk takes place. The HS also features jet synchrotron emission, which is mostly seen at radio and infrared wavelengths, although it may also be responsible for a significant contribution to the X-ray output of the system (e.g. Fender & Muñoz-Darias, 2016). As the outburst continues, the source will transition to the SS. In this state, most of the X-rays are of thermal origin, emitted by the hot inner regions of the accretion disk. Also, radio emission fades away, indicating a lack of jet activity (although weak jets may still be present and remain undetected). In a typical outburst, a BH-LMXB normally completes the HS–SS–HS cycle, going through short-lived intermediate states during the HS–SS and SS–HS transitions. As happened with the triggering of the outburst, the changes in the spectral states of BH-LMXBs are probably produced by variations in the accretion disk properties. During the state transitions, especially the HS–SS one, discrete blobs of plasma moving away from the BH can sometimes be resolved in radio, rather than the continuous jets typical of the HS (see Fender & Belloni, 2012, and references therein for a more detailed description of the states of BH-LMXBs).
With one possible exception, no high-energy (HE, above 100 MeV) or very-high-energy (VHE, above 100 GeV) gamma-ray emission is detected from BH-LMXBs (Ahnen et al., 2017a; H.E.S.S. Collaboration et al., 2018). The possible exception to this is the excess at HE of V404 Cygni during an outburst in 2015 (Loh et al. 2016; Piano et al. 2017; although we note the lack of a significant excess reported by a recent reanalysis of the Fermi-LAT data; Harvey et al. 2021). A firm detection of BH-LMXBs at HE or VHE would enable a better physical characterisation of these systems in terms of their magnetic field, particle acceleration mechanisms and maximum particle energy, or gamma-ray absorption processes, among others. We note that LMXBs hosting a neutron star have been detected at HE (see, e.g., Harvey et al., 2022). In these systems, the gamma-ray emission likely originates in processes involving the neutron star, which are therefore not applicable in a BH scenario (e.g., Strader et al., 2016, and references therein).
For high-mass X-ray binaries, there is already evidence for gamma-ray emission. HE gamma rays are detected from systems like Cygnus X-1 and Cygnus X-3, likely originating from the jets in both cases (see Zanin et al., 2016; Fermi LAT Collaboration et al., 2009; Tavani et al., 2009; Zdziarski et al., 2018). HE emission is also detected from regions of SS433 far from the central binary, where the jets terminate interacting with the supernova remnant around the source (Fang et al., 2020; Li et al., 2020). On the other hand, the VHE detection of high-mass X-ray binaries is still elusive (Aleksić et al., 2010, 2015; Ahnen et al., 2017b; Archambault et al., 2013; Archer et al., 2016), with the exception of SS433 (and excluding gamma-ray binaries from this source class). For this source, the HAWC Collaboration detected photons with energies of TeV originating in regions very far from the binary system, although not spatially coincident with the HE-emitting sites. The post-trial detection significance ranged from to depending on the analysed region, and reached for a joint fit of the interaction regions (Abeysekara et al., 2018).
MAXI J1820+070 (RA = , Dec = ; Galactic coordinates = , = ) is a BH-LMXB discovered in the optical band on 2018 March 6 (MJD 58184.1) by the All-Sky Automated Survey for Supernovae (ASAS-SN; Tucker et al. 2018), and on March 11 (MJD 58188.5) was also detected in X-rays by the Monitor of All-sky X-ray Image (MAXI; Kawamuro et al. 2018). Soon after its discovery, MAXI J1820+070 showed an exceptionally high X-ray flux peaking at times that of the Crab Nebula (e.g., Del Santo & Segreto, 2018; Shidatsu et al., 2019). A distance to the source of kpc was determined from radio parallax (Atri et al., 2020), which is consistent with the distance of kpc obtained from Gaia DR3 data (Bailer-Jones et al., 2021). Jet activity was detected from MAXI J1820+070 in the form of radio and infrared emission, which classifies the source as a microquasar (e.g., Bright et al., 2020; Rodi et al., 2021). The Lorentz factor of the jet during the HS was estimated to be from radio-to-optical data, the upper and lower limits of this range being determined from constraints on the jet power and the pair production rate, respectively (Zdziarski et al., 2022). For discrete ejections taking place in the HS–SS transition, a Lorentz factor of was obtained (using a distance to the source of 2.96 kpc; Atri et al., 2020). The jet inclination was measured to be from radio observations (Wood et al., 2021), and its half-opening angle in the HS was found to be (Zdziarski et al., 2022). Using optical polarisation observations, the jet misalignment with respect to the perpendicular to the orbital plane was measured to be at least (with a confidence level; Poutanen et al., 2022). An orbital period of h was determined from optical spectroscopic observations (Torres et al., 2019). The BH and stellar masses were constrained through further spectroscopy measurements to a 95% confidence interval of and , respectively, for orbital inclinations between and (Torres et al., 2020). The parameters above yield an orbital semi-major axis of cm. An estimate of the donor star parameters is discussed in Mikołajewska et al. (2022).
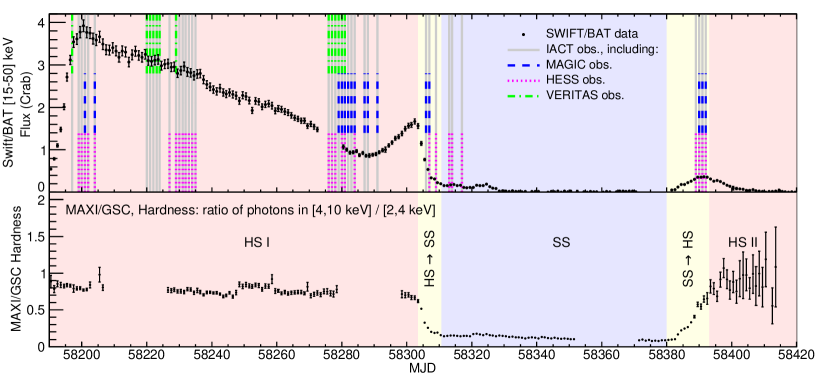
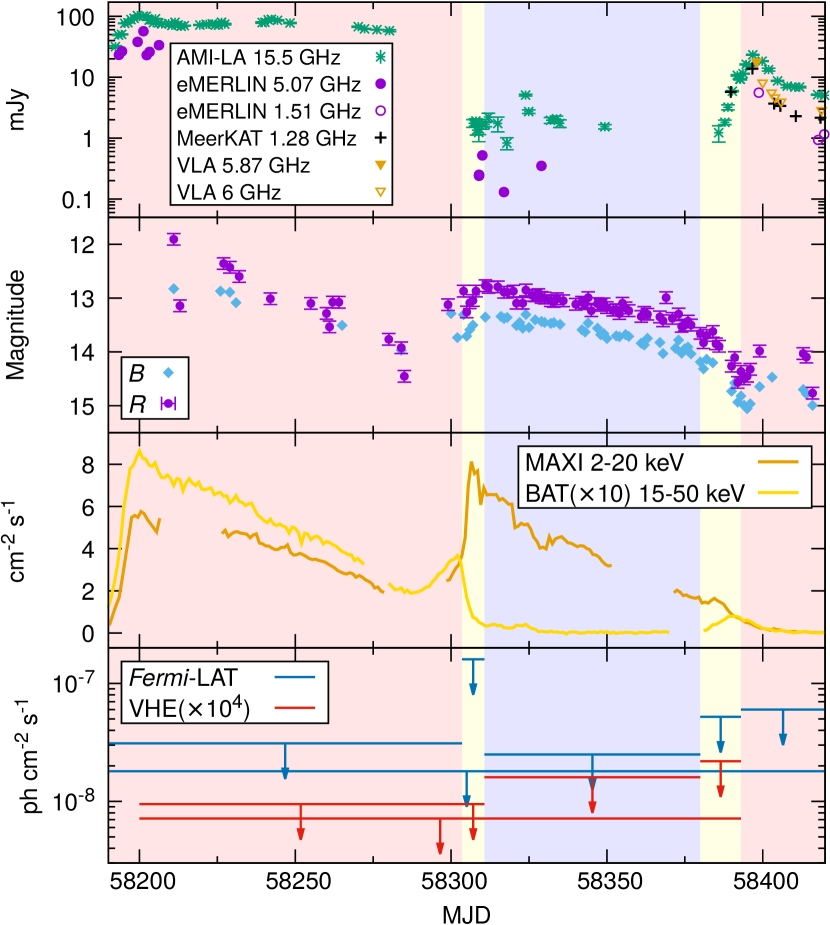
MAXI J1820+070 remained in the HS from the beginning of the outburst in March until early July (2018), when it began its transition to the SS. This source state lasted until late September, when MAXI J1820+070 started transitioning back to the HS shortly before becoming quiescent and putting an end to the outburst, which lasted a total of months. During its outburst, MAXI J1820+070 was observed with a wide variety of instruments at radio (e.g., Atri et al., 2020; Bright et al., 2020), near infrared (e.g. Sánchez-Sierras & Muñoz-Darias, 2020), optical (e.g., Veledina et al., 2019; Torres et al., 2019; Shidatsu et al., 2019), and X-ray (e.g., Roques & Jourdain, 2019; Shidatsu et al., 2019; Buisson et al., 2019; Fabian et al., 2020; Chakraborty et al., 2020; Zdziarski et al., 2021a) frequencies. We make use of the results of Shidatsu et al. (2019) to define the exact dates of the beginning and end of each source state, based on the MAXI Gas Slit Camera (MAXI/GSC) hardness ratio (i.e., the flux ratio of high-energy to low-energy X-rays) between the keV and keV photon fluxes. These dates are shown in Table 1. The evolution of the X-ray state of MAXI J1820+070 can be seen in the bottom panel of Fig. 1, which shows its hardness ratio from MAXI/GSC data.
| Source state | Start | End | Start | End |
|---|---|---|---|---|
| [MJD] | [MJD] | [Gregorian] | [Gregorian] | |
| Hard State I | 58189.0 | 58303.5 | 12 Mar. 2018 | 4 Jul. 2018 |
| HS SS | 58303.5 | 58310.7 | 4 Jul. 2018 | 11 Jul. 2018 |
| Soft State | 58310.7 | 58380.0 | 11 Jul. 2018 | 19 Sep. 2018 |
| SS HS | 58380.0 | 58393.0 | 19 Sep. 2018 | 2 Oct. 2018 |
| Hard State II | 58393.0 | 58420.0 | 2 Oct. 2018 | 29 Oct. 2018 |
In this work, we present the results of combined observations, by the H.E.S.S., MAGIC and VERITAS collaborations, of VHE gamma rays from MAXI J1820+070, the brightest BH-LMXB in X-rays ever observed. In order to give a more complete picture of the source, Fermi-LAT data in HE gamma rays are also included, as well as multiwavelength observations from radio to X-rays. This work is structured as follows: Section 2 describes the HE and VHE observations and data analysis for each telescope. Section 3 presents the results of this work, for which a discussion is given in Section 4. Finally, we conclude with a summary in Section 5.
2 Observations and data analysis
2.1 H.E.S.S., MAGIC and VERITAS data
MAXI J1820+070 was observed during its 2018 outburst with the H.E.S.S., MAGIC and VERITAS Imaging Atmospheric Cherenkov Telescope (IACT) arrays. H.E.S.S. is an array of five IACTs located in the Khomas Highland, Namibia (S, E, 1800 m above sea level). It comprises four telescopes with a 12-m diameter dish and a Field of View (FoV) of (for a description, see Aharonian et al., 2006a), and one telescope with a 28-m diameter dish and a FoV (Bolmont et al., 2014). H.E.S.S. investigates gamma rays in the energy range from GeV (H. E. S. S. Collaboration et al., 2018) to TeV (Abdalla et al., 2021). MAGIC (Aleksić et al., 2016a) is a stereoscopic system of two IACTs located at the Roque de los Muchachos Observatory in La Palma, Spain (N, W, 2200 m above sea level). The telescopes have a FoV, and are equipped with a primary dish with a diameter of 17 m. MAGIC can detect gamma rays from GeV (MAGIC Collaboration et al., 2020b) to TeV (MAGIC Collaboration et al., 2020a). VERITAS is an array of four IACTs located at the Fred Lawrence Whipple Observatory in southern Arizona, USA (N, W, 1270 m above sea level; Weekes et al., 2002). Each telescope covers a FoV of , collecting light from a 12-m diameter reflector. VERITAS is sensitive to gamma-ray photons ranging from GeV to TeV. The performance of VERITAS is described in Park et al. (2015).
The MAGIC and H.E.S.S. observations were performed from March to October 2018, covering the initial HS of the source, the beginning of the SS, and the state transitions. The VERITAS data were collected from March to June, when the source was in the HS. After data quality cuts, 26.3 h, 22.5 h and 10.7 h of effective observation time (defined as the exposure time corrected for dead-time losses) remains for H.E.S.S., MAGIC and VERITAS, respectively, for a combined total of 59.5 h. The data sample was divided according to the X-ray state (or transition) of the source as defined in Sect. 1. A summary of the observations, including their zenith angle, is shown in Table 2. The observation dates of each telescope are shown in Table 5, and they are also represented in Fig. 1 superimposed on the hard X-ray light curve (LC) of the source.
| Source state | Experiment | Time [h] | Zenith angle (median) [deg] |
|---|---|---|---|
| Hard State | H.E.S.S. | 17.9 | 30 – 61 (33) |
| MAGIC | 14.2 | 21 – 58 (34) | |
| VERITAS | 10.7 | 20 – 39 (28) | |
| HS SS | H.E.S.S. | 4.0 | 30 – 38 (32) |
| MAGIC | 4.9 | 21 – 48 (27) | |
| Soft State | H.E.S.S. | 2.6 | 30 – 34 (31) |
| SS HS | H.E.S.S. | 1.8 | 37 – 53 (43) |
| MAGIC | 3.4 | 28 – 56 (41) | |
| TOTAL | H.E.S.S. | 26.3 | 30 – 61 (33) |
| MAGIC | 22.5 | 21 – 58 (32) | |
| VERITAS | 10.7 | 20 – 39 (28) |
The low-level data analyses of H.E.S.S., MAGIC and VERITAS were performed using standard collaboration procedures, each of them including an independent cross-check (i.e., an independent analysis, performed with a different software pipeline, that yielded compatible results with the main analysis). These low-level analyses comprise, among others, calibration and image cleaning procedures, methods to separate atmospheric showers triggered by gamma rays from those triggered by hadrons, and gamma-ray energy and direction reconstruction (see de Naurois & Rolland 2009; Holler et al. 2015 for the H.E.S.S. main analysis; Parsons & Hinton 2014 for the H.E.S.S. cross-check; Aleksić et al. 2016b for MAGIC; Daniel et al. 2008 for the VERITAS main analysis; and Maier & Holder 2017 for the VERITAS cross-check). The VHE emission was assumed point-like (since it is expected to come from regions close to the binary system, with angular sizes smaller than the instruments’ resolutions), and the signal region was defined by a radius of , or around the source position for H.E.S.S., MAGIC and VERITAS, respectively. In order to maximise the source effective observation time, and thus the probability of detection, a joint analysis of the data from the three experiments was also done (see Appendix B). No significant signal was detected from the individual or combined data sets, regardless of the energy range considered. The gamma-ray upper limits (ULs) in different energy bins were computed following a maximum-likelihood ratio test as described in Appendix B, both for the individual and combined data sets. We also refer the reader to MAGIC Collaboration et al. (2018) for a similar method. A confidence level (C.L.) of 0.95 was used, and a global flux systematic uncertainty of 30% was taken for each experiment, which accounts for the systematic error in both the flux normalisation and the energy scale (see e.g. Aleksić et al., 2012). The choice of a common value of the systematic uncertainty for the three experiments is motivated by the similar values of the systematic errors among them (see Aharonian et al., 2006a; Aleksić et al., 2016b; Adams et al., 2022, for the estimation of systematic errors in H.E.S.S., MAGIC and VERITAS, respectively). The VHE gamma-ray spectrum was assumed to follow a power law with spectral index , i.e. , where is the number of gamma-ray photons and is their energy. This spectral shape is chosen as it resembles what has been observed for other binary systems detected at VHE (e.g. Aharonian et al., 2006b; Albert et al., 2006; Adams et al., 2021), since similar particle acceleration mechanisms and non-thermal emission processes of VHE gamma rays are expected to occur in MAXI J1820+070.
2.2 Fermi-LAT data
The Large Area Telescope (LAT) (Atwood et al., 2009) is a pair-conversion detector on the Fermi Gamma-Ray Space Telescope. It consists of a tracker and a calorimeter, each of them made of a array of modules, an anticoincidence detector that covers the tracker array, and a data acquisition system with a programmable trigger. The Fermi-LAT is located at a low-Earth orbit with 90 min period and normally operates in survey mode, with a sr FoV. Such an observational strategy allows the instrument to cover the whole sky in approximately 3 h. The data selected for the analysis presented in this paper cover the period MJD 58189 – 58420. The GeV data were analysed with the latest available fermitools v. 2.0.8 with P8R3_V3 response functions (SOURCE photon class; maximum zenith angle of ).
A standard binned likelihood analysis (Mattox et al., 1996) of the data taken from a -radius region of interest (ROI) around the MAXI J1820+070 position was performed111See e.g. https://fermi.gsfc.nasa.gov/ssc/data/analysis/scitools/binnededisp_tutorial.html. The analysis is based on the fitting of a spatial and spectral model of the sky region around the source of interest to the data. The model of the region included all sources from the 4FGL DR3 catalogue (Abdollahi et al., 2020) as well as components for isotropic and galactic diffuse emissions given by the standard spatial and spectral templates iso_P8R3_SOURCE_V3_v1.txt and gll_iem_v07.fits.
The spectral template for each 4FGL source in the region was selected according to the catalogue model. The normalisations of the spectra of these sources, as well as the normalisations of the Galactic diffuse and isotropic backgrounds, were assumed to be free parameters during the fit. MAXI J1820+070 was modelled as a point-like source with a power-law spectrum. Following the recommendation of the Fermi-LAT collaboration, our analysis is performed with the energy dispersion handling enabled. To minimise the potential effects from the sources present beyond the considered ROI, we additionally included into the model all the 4FGL sources up to beyond the ROI, with all the spectral parameters fixed to the catalogue values. The parameters used for the Fermi-LAT analysis are summarised in Table 3.
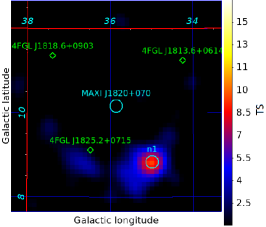
In order to check the quality of the considered model of the region at the initial step of the analysis, we built a test-statistics (TS) map showing the TS value of a point-like source not present in the model located in a given pixel of the map. The TS map obtained is shown in the left panel of Fig. 2. The map illustrates that the selected model describes the region well in the energy and time ranges considered. We note the presence of a TS residual at RA , Dec (with a positional uncertainty of ), marked as n1 on the map. This residual is positionally coincident with PSR J1823+0550 (PSR B1821+05). We modelled this source as a point-like source with a power-law spectrum, , with being the flux normalisation. The best-fit parameters in the selected time range and in the GeV energy band are ph cm-2 s-1 MeV-1 at 1 GeV, and . We included this source to the considered model of the region with a free normalisation and the index fixed to the best-fit value. After all these steps, MAXI J1820+070 was not detected with the binned likelihood analysis for the time period considered (assuming a power-law spectrum model with a free spectral index), and is therefore not present at the TS map of Fig. 2.
In what follows, the Fermi-LAT flux upper limits for MAXI J1820+070 were calculated at a C.L. with the help of the IntegralUpperLimit module provided as a part of standard Fermi-LAT data analysis software for a power-law index fixed to , as for the VHE data analysis (and also similar to what is observed for high-mass microquasars in the Fermi-LAT energy range, see, e.g., Zanin et al., 2016; Zdziarski et al., 2018).
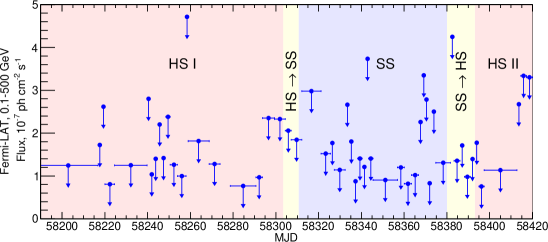
In order to search for a possible short-timescale variability observed in several microquasars detected up to GeV energies, we computed the light curve of the source with variable (adaptive) time binning (e.g., Lott et al., 2012). Namely, we selected a time bin duration such that each bin receives 16 photons in the GeV energy range and in a radius of around the MAXI J1820+070 position. This resulted in 55 time bins in the total time range considered with an average duration of days (minimum: 1 day, maximum: 27 days). Such time bin selection allows us to identify the shortest possible periods during which the source potentially could be detected with up to a significance. A similar approach was found to be effective for a search of short flares during the periods of strong GeV variability of PSR B1259-63 in the analysis of Chernyakova et al. (2020, 2021). The performed analysis did not result in the detection of MAXI J1820+070 in any of the time bins, and the resulting ULs are shown in the right panel of Fig. 2.
| Parameter | Value |
|---|---|
| Response functions | P8R3_V3 |
| evclass | |
| evtype | |
| zmax | |
| Spatial bin width | |
| Energy bins per decade | |
| edisp_bins | |
| Energy range | 0.1 – 500 GeV |
| ROI (free) | |
| ROI (fixed) | – |
| Catalogue | 4FGL-DR3 |
| Background (galactic) | gll_iem_v07.fits |
| Background (isotropic) | iso_P8R3_SOURCE_V3_v1.txt |
| Likelihood analysis optimiser | NEWMINUIT |
| Time ranges | 542505605 – 562464005 (TOTAL) |
| 542505605 – 552398405 (HS I) | |
| 552398405 – 553020485 (HS–SS) | |
| 553020485 – 559008005 (SS) | |
| 559008005 – 560131205 (SS–HS) | |
| 560131205 – 562464005 (HS II) |
2.3 Additional multiwavelength data
Data from several radio telescopes at different frequencies are taken from Bright et al. (2020). Optical data are taken from Celma (2019), in which observations performed with the Joan Oró Telescope (TJO; Colomé et al., 2010) and Swift Ultraviolet/Optical Telescope (Swift/UVOT; Roming et al., 2005) are reported. The optical fluxes are obtained from images taken with the 5 Johnson-Cousins filters (with central wavelengths around 366, 435, 548, 635 and 880 nm, respectively from the to filters), and they are already corrected for interstellar extinction with values ranging from 0.2 to 0.6 mag (see Fitzpatrick, 1999; Celma, 2019, and references therein). Public LCs from MAXI/GSC (Matsuoka et al., 2009) and Swift Burst Alert Telescope (Swift/BAT Krimm et al., 2013) are also included.
For the spectral energy distributions (SEDs) of MAXI J1820+070, International Gamma-Ray Astrophysics Laboratory (INTEGRAL Winkler et al., 2003) data are added to that of the previously mentioned instruments, based on results by Roques & Jourdain (2019) from MJD 58206 to 58246, during the first half of the HS. Data from the Neutron star Interior Composition Explorer (NICER, Gendreau et al., 2012) are also used. NICER is designed to study neutron stars via soft X-ray timing spectroscopy and has been operating from the International Space Station since 2017. It observed for 109 h, 21.8 h and 4.56 h during the HS, the HS–SS transition and SS–HS transition, respectively. Pre-processed event files were retrieved through the HEASARC database. Re-processing and filtering were done using standard criteria with the nicerl2 task from the NICERDAS software available in the HEAsoft distribution222https://heasarc.gsfc.nasa.gov/docs/software/lheasoft/ (v6.26). Spectra were extracted using the extractor function from the ftools package. Error bars account only for the statistical uncertainty on detector counts, namely ±1 standard deviation of a Poisson distribution. Energy and gain calibrations were performed using the HEASARC Calibration Database version XTI(20200722). To avoid telemetry saturation, the fraction of active modules had to be adjusted. This was taken into account considering that each module contributes equally to the effective area. The fluxes were corrected for interstellar extinction using a hydrogen column density of cm-2 (Dziełak et al., 2021).
3 Results
The observations of MAXI J1820+070 reported in this work do not show any significant emission in either HE or VHE gamma rays, regardless of the source state. The computed integral flux ULs for Fermi-LAT data and the combined dataset of H.E.S.S., MAGIC and VERITAS are shown in Table 4 for each X-ray state. The former are calculated for photon energies MeV, while the latter are computed at GeV for the HS, the HS–SS transition, the SS and the whole sample, and at GeV for the SS–HS transition. The increase in energy threshold of the last data set is due to a higher average zenith angle of the observations, which does not allow electromagnetic showers triggered by lower energy gamma rays to be detected. We note that the VHE UL for the SS, shown here for completeness, may not be representative of the whole source state, since it only covers the very first days of the SS (see the top panel of Fig. 1).
Fig. 3 presents the ULs on the VHE differential flux obtained for 5 different energy bins and each source state for which observations were performed (excluding the poorly-covered SS). Both individual and combined ULs are shown in each case. For the SS–HS transition, the lowest energy bin is not computed due to the increased energy threshold of the corresponding observations. The differences between individual ULs in the same energy bin originate from the different instrument sensitivities and observation times, as well as from statistical fluctuations (see Appendix B). Except in the case of significant differences between the individual ULs, the combined ULs are tighter than any of the individual ones.
| Fermi-LAT UL | IACT UL | |
| Source state | ( GeV) | ( GeV) |
| [ph cm-2 s-1] | [ph cm-2 s-1] | |
| Hard State I | ||
| HS SS | ||
| Soft State | ||
| SS HS | ||
| Hard State II | ||
| TOTAL |
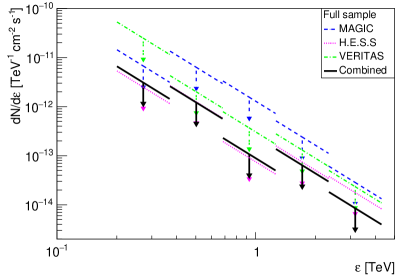
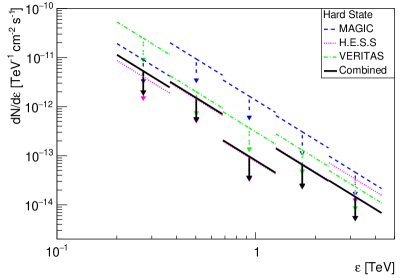
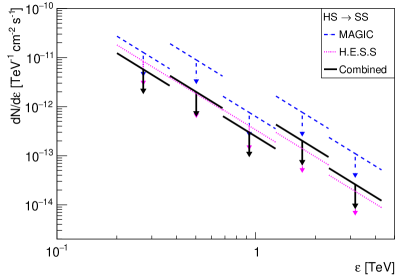
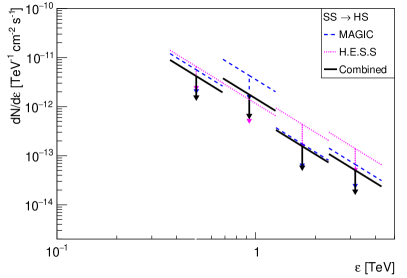
Fig. 4 shows the LCs of MAXI J1820+070 at different frequencies, with the gamma-ray LC corresponding to the ULs in Table 4. The radio fluxes in the top panel include both the core emission from the jet regions close to the binary system, and the radiation emitted by discrete ejections launched during the HS–SS transition. Core emission is dominant during the source HS, while the ejections dominate throughout the SS, during which no core emission is detected (see Bright et al., 2020, for the details). The optical fluxes in the second panel are obtained from a total set of 16457 images distributed over 113 different nights between March and November 2018 (Celma, 2019). The X-ray LCs in the third panel are obtained from the daily fluxes of MAXI J1820+070 from MAXI/GSC (for 2 keV keV) and Swift-BAT (for 15 keV keV). The gaps represent the periods when the source was not observed with these instruments.
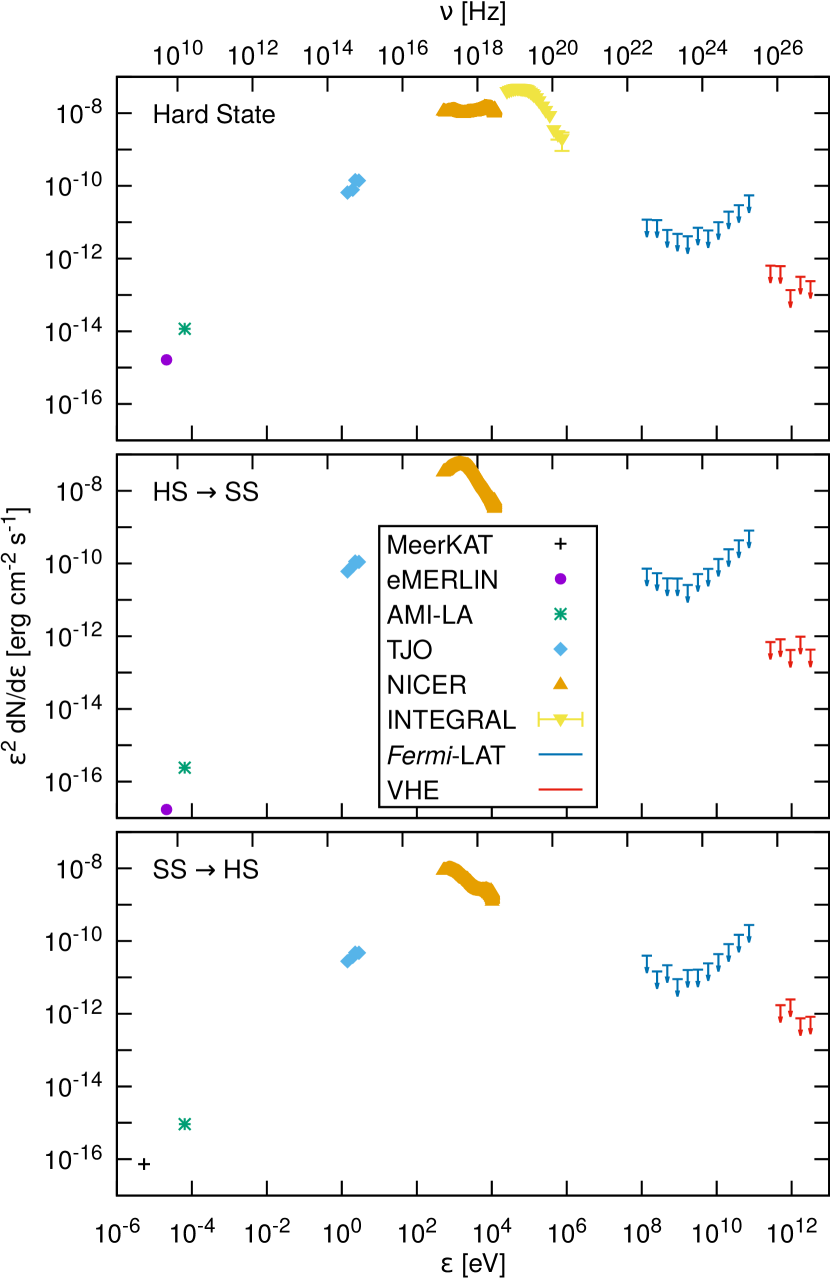
The SEDs of MAXI J1820+070, averaged for those source states well represented by the VHE data, are shown in Fig. 5. We note that the jump between NICER and INTEGRAL data in the top panel is just an effect of the different time coverage of the observations. While NICER data are averaged over the whole duration of the HS, INTEGRAL data only cover roughly the first half of it (see Sect. 2.3), when the average X-ray flux was higher.
4 Discussion
In this section, we provide a short description of multiwavelength measurements of MAXI J1820+070 from radio to X-rays. Based on some assumptions regarding the extrapolation of the jet synchrotron spectrum and the distribution (energy dependence and maximum energy) of the non-thermal particles, we estimate the expected jet emission in HE and VHE gamma rays analytically. This expected emission is then compared to the measured ULs, and used to constrain the properties of a potential gamma-ray emission region in MAXI J1820+070.
4.1 Multiwavelength overview of the source
Radio emission from MAXI J1820+070 provides evidence for jet activity during the whole 2018 outburst. This emission is dominated by a steady jet in the HS, a discrete blob in the HS–SS transition (the emission of which is also dominant throughout the SS as the blob moves away from the binary system), and a jet rebrightening during the SS–HS transition (Bright et al., 2020). Without accounting for blob emission during the SS, the radio and hard X-ray fluxes have similar behaviours: they decrease slowly through the HS, have a steep decrease in the HS–SS transition, are practically undetectable during the SS, and increase again in the SS–HS transition. This is expected from the standard picture of BH-LMXBs, where steady radio jets in the HS coexist with a hard X-ray emitting corona, both of them disappearing in the SS. During the HS, synchrotron emission from the jet is likely the dominant contribution to the SED up to infrared frequencies, beyond which the spectrum becomes dominated by disk and coronal emission (Rodi et al., 2021; Tetarenko et al., 2021; Zdziarski et al., 2021b). We nonetheless note that the jets in LMXBs may still contribute significantly up to hard X-rays through their synchrotron emission (e.g. Markoff et al., 2005).
Regarding the contribution from the star to the overall SED, MAXI J1820+070 had a magnitude of 17.4 in the filter – with a central wavelength around 460 nm – before the outburst (Wenger et al., 2000; Gaia Collaboration, 2018), which is at least 3 magnitudes above the magnitude during the flare (from the filters shown in the second panel of Fig. 4, the filter is the closest one to the filter). This means that the optical flux of MAXI J1820+070 during the flare was at least about 15 times larger than before the outburst. Nonetheless, this increase in flux cannot be exclusively associated to the brightening of the accretion disk, since the stellar luminosity can also increase during the outburst owing to the heating of the stellar surface produced by the X-ray emission close to the BH (e.g. de Jong et al., 1996). Assuming a stellar radius of cm equal to that of the Roche lobe, the solid angle of the star as seen by the BH is sr. This means that the optical luminosity of the X-rays reprocessed in the stellar surface should be about 2 orders of magnitude below the X-ray luminosity. This optical luminosity is comparable to what is observed from the whole system (see Fig. 5), so we can conclude that the stellar contribution to the optical flux of MAXI J1820+070 may be significant.
4.2 Analytical estimates
For the estimates performed in this section, the particles responsible for the non-thermal emission are assumed to be only electrons (and positrons), although we note that hadrons might contribute to the overall emission of the system (see, e.g., Bosch-Ramon & Khangulyan, 2009, for typical electron and proton cooling timescales in microquasar environments). These electrons are likely accelerated up to relativistic energies close to the BH, and different acceleration mechanisms may play a role (see, e.g., Bosch-Ramon & Rieger, 2012, for a description of different processes that can contribute to particle acceleration). The non-thermal emission of the electrons is assumed to come from their synchrotron and IC cooling. The derived jet inclination and speed in MAXI J1820+070 make the counter-jet emission significantly more deboosted than that from the jet. The discussion can therefore be focused on the jet emission, and the counter-jet contribution can be neglected. In the following, primed quantities refer to the reference frame moving with the jet flow, while unprimed ones refer to quantities in the laboratory frame or as seen by the observer.
4.2.1 A steady jet in the hard state
Some jet properties during the initial HS of the source were constrained by Zdziarski et al. (2022) based on the radio to optical emission. In particular, the synchrotron break frequency (above which the emission becomes optically thin) is measured to be GHz. They also find that for a jet Lorentz factor of , the onset of the jet synchrotron emission comes from a distance to the BH of cm, where the magnetic field is G if equipartition between the magnetic and particle energy densities is assumed (the equipartition condition approximately corresponds to the minimum energy requirement for synchrotron radiation, which happens for a magnetic energy of times the particle one; e.g., Longair, 1981).
To estimate the gamma-ray emission of the source, we assume that gamma rays are produced by IC scattering of photons coming from the accretion disk or the corona by jet electrons. This means that the target photons reach the jet mainly from behind, which is very likely the case for X-rays in MAXI J1820+070, and is also approximately the case for optical photons. Given the conditions in the source, the estimates can be done in the context of the Thompson regime, which is approximately valid at the adopted energies (, see below), and simplifies the calculations (e.g., Longair, 1981). In this regime, IC is more efficient and the energy gain of the scattered photons is proportional to the square of the electron Lorentz factor .
For HE gamma rays, a characteristic energy of MeV is taken, which would be the result of the IC scattering towards the observer of target X-ray photons with typical energies of keV by MeV electrons (). These are reference values for which data at the target photon energy are available, although target photons with energies similar to the chosen ones would also contribute to the IC emission around MeV. The electrons with energy emit synchrotron photons with an observed frequency of GHz. The observed flux density at this frequency (extrapolated from the infrared data in Zdziarski et al., 2022) is mJy. The observed IC flux of the electrons with energy can then be estimated as:
| (1) |
where and are the IC and synchrotron cooling rates in cgs units, respectively. The energy density of the target photon field with luminosity erg s-1 is (valid as long as the target photons reach the jet from behind; Dermer & Schlickeiser, 1994). Equation (1) yields a predicted IC energy flux at MeV of erg cm-2 s-1, about a factor of 20 smaller than the obtained ULs at this energy (see upper panel of Fig. 5). We note that the predicted energy flux increases with the ratio of particle-to-magnetic energy density as , as long as the corresponding is in the optically thin regime (see the dependency of with the energy density fraction in Zdziarski et al., 2022, and how this changes the values of and ). For example, taking a value of raises the expected energy flux to erg cm-2 s-1, a factor of higher than in equipartition and only times smaller than the ULs.
Regarding the VHE emission, an extrapolated power-law electron distribution is assumed, i.e. , with being the number of electrons per energy unit. This distribution is taken up to GeV, which is the energy required to emit VHE gamma rays with GeV through IC with optical target photons. In order not to contradict the observations, a soft injection index of is required for the high-energy electrons (with energies above those responsible for the infrared emission reported in Zdziarski et al. 2022). Otherwise, the observed MeV fluxes would be violated by the synchrotron emission of the electrons with hundreds of GeV, and the VHE ULs would be violated by the expected IC emission of these electrons. On the other hand, using yields an expected VHE emission that falls at least 2 orders of magnitude below the obtained UL for the lowest VHE bin in Fig. 5. Therefore, the obtained VHE ULs are not so constraining as the HE ones in the source HS.
4.2.2 Discrete ejections during the state transitions
For the HS–SS transition, Bright et al. (2020) determined that the radio emission was dominated by a discrete blob of plasma. The estimates in this section assume, for both state transitions333We note that the blob model may not hold for the SS–HS transition, although it is still used for the sake of simplicity and due to the lack of much information for this source state., a one-zone spherical radio emitter in the flow frame with the Lorentz factor and inclination values reported in Sect. 1. The non-thermal electrons responsible for this synchrotron radio emission are taken as reference to obtain the expected IC emission in the source. We use the spectral shape derived from the two radio points in Fig. 5, which indicates a self-absorbed synchrotron emission at the observed frequencies. Therefore, the break frequency should be located at a frequency higher than GHz. On the other hand, for the HS–SS transition this frequency has to be lower than GHz if , since otherwise the optical fluxes would be violated by the blob synchrotron emission. For simplicity, a break frequency of GHz is used in both state transitions: if were lower, the limits derived below would be less restrictive, and more restrictive otherwise.With the Doppler boosting factor of the blob being , the break frequency value in the flow frame is , and the extrapolated flux density at is . The distance to the source can be used to constrain the magnetic field and radius of the radio-emitting blob through the following relation in cgs units (derived from Eq. 6.38 in Pacholczyk, 1970):
| (2) |
We note that, due to the high inclination of the system, is approximately equal to measured in the direction of the observer. The magnetic field is parametrized through the fraction of magnetic to particle energy density:
| (3) |
where is the proper volume of the emitting region, and is the energy budget of the non-thermal electrons in the blob. Taking an electron distribution with between MeV and GeV yields
| (4) |
with being a normalisation constant. The values of , and are not strongly constrained by the observations, but Eq. (4) is not very sensitive to the exact values of and as long as . Additionally, the optically thin synchrotron spectral luminosity can be related to the particle distribution as:
| (5) |
Taking an equipartition magnetic field with , Eqs. (2) to (5) provide the following results for the radio emitter in the HS–SS (SS–HS) transition: a radius of cm ( cm), a non-thermal energy budget of erg ( erg), and a magnetic field of G ( G).
The same reference energy as in the HS is taken for the HE emission through IC, i.e. MeV, which results from the scattering of keV photons by MeV electrons. For the VHE emission, a characteristic energy of GeV ( GeV) is chosen for the HS–SS (SS–HS) transition. These gamma-ray photons are the result of the scattering of disk target photons with typical energies of eV by GeV ( GeV) electrons. Observational evidence of non-thermal electrons is available only for energies below 10 MeV in the flow frame, since the electrons in this energy range are responsible for the emission up to GHz. Therefore, an extension of the electron distribution up to the required and is assumed with a power-law shape with index . Reaching such particle energies is not unreasonable for the equipartition magnetic field obtained above, since high acceleration efficiencies are not required to reach those energies. The most constraining efficiency needed is for GeV, with being the acceleration timescale.
To estimate the expected IC emission, a similar method to the one developed for the HS is used, following Eq. (1), where and are now the characteristic synchrotron frequency of the electrons with each of the aforementioned energies, and , and the corresponding extrapolated flux at , respectively. This sets a minimum distance of the potential gamma-ray emitter to the BH through the dependence of the target photon energy density with this distance. If the emitter were closer to the BH (and the accretion disk), would be so high that the gamma-ray ULs would be violated by the IC emission of the blob. For the HS–SS (SS–HS) transition, the derived distances of the potential HE and VHE emitters to the BH are cm ( cm) and cm ( cm). The radio emitter size constraints impose that is likely larger, at least a few times cm. Conversely, both and cannot be more than several times the radio emitter size, the exact value depending on the blob expansion velocity, since that would increase the emitter size to the point that the synchrotron radio emission would become optically thin below .
Both the potential HE and VHE emitter distances derived above are sufficiently large for the blob gamma-ray emission to be unaffected by gamma-gamma absorption with the external photons from the disk and the corona (this also applies to the HS emitter studied in Sect. 4.2.1). Also, for the values of and obtained, the energy density of the synchrotron soft X-ray photons (emitted as long as the electrons reach high-enough energies) should be comparable to that of the X-rays coming from the corona and/or the disk. Moreover, the energy density of the synchrotron optical photons should also be comparable to that of the disk optical photons. Therefore, synchrotron self-Compton should be responsible for a significant fraction of any HE and VHE emission of MAXI J1820+070.
5 Summary and conclusions
Observations of the exceptionally bright X-ray source MAXI J1820+070 have been performed with the H.E.S.S., MAGIC and VERITAS experiments in VHE gamma rays. These data complement Fermi-LAT observations of HE gamma rays, as well as additional multiwavelength data from radio to X-rays. The latter show the expected behaviour for a typical BH-LMXB, indicating a source following the usual HS–SS–HS cycle during an outburst.
Radio emission throughout the whole outburst provides evidence for the presence of jets with a population of non-thermal particles (electrons and possibly positrons) emitting via the synchrotron mechanism. Based on the study performed by Zdziarski et al. (2022), the estimated HE emission during the HS could be not far below the obtained ULs if the magnetic field is well below equipartition. Additionally, for a spherical blob-like radio emitter during the state transitions, significant constraints to a potential gamma-ray emitter in the source can be set using reasonable assumptions for the synchrotron transition frequency and the spectrum of the emitting electrons. For an equipartition magnetic field, the potential HE emitter should be located at a distance from the BH between a few and a few cm. If electrons are efficiently accelerated up to energies of GeV in the flow frame, a putative VHE emitter should also be located in a similar region, between cm and cm. Having the emitter closer than the region defined by these limits would violate the gamma-ray observations. Conversely, if the emitter is farther than this region, its emission would not be consistent with the observed optically-thick radio spectrum. The relatively narrow range of allowed distances during the transitions, and the inferred gamma-ray fluxes in the HS, indicate that the HE and VHE gamma-ray flux of MAXI J1820+070 (and possibly other BH-LMXBs showing evidence for non-thermal emission) might not be too far from being detectable with the current instrument sensitivities, (as the strong hint for V404 Cygni at HE may exemplify) and might be detectable for especially bright outbursts, or with future gamma-ray telescopes like the Cherenkov Telescope Array (Paredes et al., 2013; Cherenkov Telescope Array Consortium et al., 2019).
It should be noted that observations in the GHz band during the state transitions would be very useful to constrain the non-thermal emitter properties by means of establishing the transition frequency between the optically thin and optically thick synchrotron regimes, as well as determining whether non-thermal particles are accelerated up to at least a few hundred MeV or not. Upcoming MeV missions, like the All-sky Medium Energy Gamma-ray Observatory (AMEGO; McEnery et al., 2019) or e-ASTROGRAM (de Angelis et al., 2017), will also be useful to bridge the MeV gap in observations of outbursts in X-ray binaries.
Author contribution statement
All authors have read and approved the manuscript and contributed in one or several of the following ways: design, construction, maintenance and operation of the instruments used to acquire the data; preparation and/or evaluation of the observation proposals; data acquisition, processing, calibration and/or reduction; production of analysis tools and/or related Monte Carlo simulations. Notable individual contributions in alphabetical order from MAGIC collaboration members include: J. Hoang - MAGIC analysis cross-check; E. Molina - project leadership, coordination of the MAGIC observations, MAGIC data analysis, theoretical interpretation, paper drafting and editing; M. Ribó - triggering and initial coordination of the MAGIC observations, establishment of the agreement to work with the other collaborations and contact with the multiwavelength community. Contributions from authors outside of the MAGIC, H.E.S.S. and VERITAS collaborations include: V. Bosch-Ramon - theoretical interpretation; C. Celma - TJO data analysis, Swift/UVOT data analysis; M. Linares - TJO data analysis, Swift/UVOT data analysis; D.M. Russell - TJO data analysis, Swift/UVOT data analysis; G. Sala - TJO data analysis.
Given the wide array of contributions from many individuals over decades to bring H.E.S.S. and VERITAS to fruition – including to design the instruments, to build them, to maintain them, to operate them, and to develop analysis software – in addition to the efforts needed to obtain, analyse, and interpret the data for a particular scientific study, it is the policy of both the H.E.S.S. and the VERITAS Collaborations not to attempt to summarise the contributions of individual members.
Acknowledgements
MAGIC acknowledgements: MAGIC would like to thank the Instituto de Astrofísica de Canarias for the excellent working conditions at the Observatorio del Roque de los Muchachos in La Palma. The financial support of the German BMBF, MPG and HGF; the Italian INFN and INAF; the Swiss National Fund SNF; the grants PID2019-104114RB-C31, PID2019-104114RB-C32, PID2019-104114RB-C33, PID2019-105510GB-C31, PID2019-107847RB-C41, PID2019-107847RB-C42, PID2019-107847RB-C44, PID2019-107988GB-C22 funded by MCIN/AEI/ 10.13039/501100011033; the Indian Department of Atomic Energy; the Japanese ICRR, the University of Tokyo, JSPS, and MEXT; the Bulgarian Ministry of Education and Science, National RI Roadmap Project DO1-400/18.12.2020 and the Academy of Finland grant nr. 320045 is gratefully acknowledged. This work was also been supported by Centros de Excelencia “Severo Ochoa” y Unidades “María de Maeztu” program of the MCIN/AEI/ 10.13039/501100011033 (SEV-2016-0588, SEV-2017-0709, CEX2019-000920-S, CEX2019-000918-M, MDM-2015-0509-18-2) and by the CERCA institution of the Generalitat de Catalunya; by the Croatian Science Foundation (HrZZ) Project IP-2016-06-9782 and the University of Rijeka Project uniri-prirod-18-48; by the DFG Collaborative Research Centers SFB1491 and SFB876/C3; the Polish Ministry Of Education and Science grant No. 2021/WK/08; and by the Brazilian MCTIC, CNPq and FAPERJ.
HESS acknowledgements: The support of the Namibian authorities and of the University of Namibia in facilitating the construction and operation of H.E.S.S. is gratefully acknowledged, as is the support by the German Ministry for Education and Research (BMBF), the Max Planck Society, the German Research Foundation (DFG), the Helmholtz Association, the Alexander von Humboldt Foundation, the French Ministry of Higher Education, Research and Innovation, the Centre National de la Recherche Scientifique (CNRS/IN2P3 and CNRS/INSU), the Commissariat à l’énergie atomique et aux énergies alternatives (CEA), the U.K. Science and Technology Facilities Council (STFC), the Irish Research Council (IRC) and the Science Foundation Ireland (SFI), the Knut and Alice Wallenberg Foundation, the Polish Ministry of Education and Science, agreement no. 2021/WK/06, the South African Department of Science and Technology and National Research Foundation, the University of Namibia, the National Commission on Research, Science & Technology of Namibia (NCRST), the Austrian Federal Ministry of Education, Science and Research and the Austrian Science Fund (FWF), the Australian Research Council (ARC), the Japan Society for the Promotion of Science, the University of Amsterdam and the Science Committee of Armenia grant 21AG-1C085. We appreciate the excellent work of the technical support staff in Berlin, Zeuthen, Heidelberg, Palaiseau, Paris, Saclay, Tübingen and in Namibia in the construction and operation of the equipment. This work benefited from services provided by the H.E.S.S. Virtual Organisation, supported by the national resource providers of the EGI Federation.
VERITAS acknowledgements: VERITAS is supported by grants from the U.S. Department of Energy Office of Science, the U.S. National Science Foundation and the Smithsonian Institution, by NSERC in Canada, and by the Helmholtz Association in Germany. This research used resources provided by the Open Science Grid, which is supported by the National Science Foundation and the U.S. Department of Energy’s Office of Science, and resources of the National Energy Research Scientific Computing Center (NERSC), a U.S. Department of Energy Office of Science User Facility operated under Contract No. DE-AC02-05CH11231. We acknowledge the excellent work of the technical support staff at the Fred Lawrence Whipple Observatory and at the collaborating institutions in the construction and operation of the instrument.
We would also like to thank the referee for his/her constructive and useful comments, which were helpful to improve the manuscript. E. Molina acknowledges support from MCIN through grant BES-2016-076342. V. Bosch-Ramon acknowledges financial support from the State Agency for Research of the Spanish Ministry of Science and Innovation under grant PID2019-105510GB-C31 and through the “Unit of Excellence María de Maeztu 2020-2023” award to the Institute of Cosmos Sciences (CEX2019-000918-M). V. Bosch-Ramon is Correspondent Researcher of CONICET, Argentina, at the IAR. M. Linares has received funding from the European Research Council (ERC) under the European Union’s Horizon 2020 research and innovation programme (grant agreement No. 101002352). G. Sala acknowledges support from the Spanish MINECO grant PID2020-117252GB-I00.
We acknowledge the Fermi-LAT collaboration for making available the data and the analysis tools used in this work. This research has made use of MAXI data provided by RIKEN, JAXA and the MAXI team. This work also made use of data supplied by the UK Swift Science Data Centre at the University of Leicester. We also used data from the The Joan Oró Telescope (TJO) of the Montsec Astronomical Observatory (OAdM), which is owned by the Catalan Government and operated by the Institute for Space Studies of Catalonia (IEEC). We would also like to thank Sera Markoff, Phil Uttley, and our colleagues from the X-ray, optical/infrared, and radio communities, for the very fruitful exchanges we had on MAXI J1820+070 during the observational campaign.
Data availability
Part of the data underlying this article are available in the article and in its online supplementary material. In particular, MAXI/GSC data were obtained from http://maxi.riken.jp/star_data/J1820+071/J1820+071.html; Swift/BAT data were downloaded from https://swift.gsfc.nasa.gov/results/transients/weak/MAXIJ1820p070; NICER data were retrieved from https://heasarc.gsfc.nasa.gov/docs/archive.html, and the corresponding calibration data were downloaded from https://heasarc.gsfc.nasa.gov/docs/heasarc/caldb/data/nicer/xti/index/cif_nicer_xti_20200722.html; and Fermi-LAT data were downloaded from https://fermi.gsfc.nasa.gov/cgi-bin/ssc/LAT/LATDataQuery.cgi. The rest of the data will be shared on reasonable request to the corresponding authors.
References
- Abdalla et al. (2021) Abdalla H., et al., 2021, A&A, 653, A152
- Abdollahi et al. (2020) Abdollahi S., et al., 2020, ApJS, 247, 33
- Abeysekara et al. (2018) Abeysekara A. U., et al., 2018, Nature, 562, 82
- Adams et al. (2021) Adams C. B., et al., 2021, ApJ, 923, 241
- Adams et al. (2022) Adams C. B., et al., 2022, A&A, 658, A83
- Aharonian et al. (2006a) Aharonian F., et al., 2006a, A&A, 457, 899
- Aharonian et al. (2006b) Aharonian F., et al., 2006b, A&A, 460, 743
- Ahnen et al. (2017a) Ahnen M. L., et al., 2017a, MNRAS, 471, 1688
- Ahnen et al. (2017b) Ahnen M. L., et al., 2017b, MNRAS, 472, 3474
- Albert et al. (2006) Albert J., et al., 2006, Science, 312, 1771
- Aleksić et al. (2010) Aleksić J., et al., 2010, ApJ, 721, 843
- Aleksić et al. (2012) Aleksić J., et al., 2012, A&A, 539, L2
- Aleksić et al. (2015) Aleksić J., et al., 2015, A&A, 576, A36
- Aleksić et al. (2016a) Aleksić J., et al., 2016a, Astroparticle Physics, 72, 61
- Aleksić et al. (2016b) Aleksić J., et al., 2016b, Astroparticle Physics, 72, 76
- Archambault et al. (2013) Archambault S., et al., 2013, ApJ, 779, 150
- Archer et al. (2016) Archer A., et al., 2016, ApJ, 831, 113
- Atri et al. (2020) Atri P., et al., 2020, MNRAS, 493, L81
- Atwood et al. (2009) Atwood W. B., et al., 2009, ApJ, 697, 1071
- Bailer-Jones et al. (2021) Bailer-Jones C. A. L., Rybizki J., Fouesneau M., Demleitner M., Andrae R., 2021, AJ, 161, 147
- Bolmont et al. (2014) Bolmont J., et al., 2014, Nuclear Instruments and Methods in Physics Research Section A: Accelerators, Spectrometers, Detectors and Associated Equipment, 761, 46–57
- Bosch-Ramon & Khangulyan (2009) Bosch-Ramon V., Khangulyan D., 2009, International Journal of Modern Physics D, 18, 347
- Bosch-Ramon & Rieger (2012) Bosch-Ramon V., Rieger F. M., 2012, in Astroparticle. pp 219–225 (arXiv:1110.1534), doi:10.1142/9789814405072_0033
- Bright et al. (2020) Bright J. S., et al., 2020, Nature Astronomy, 4, 697
- Buisson et al. (2019) Buisson D. J. K., et al., 2019, MNRAS, 490, 1350
- Celma (2019) Celma C., 2019, Bachelor’s thesis, Universitat Politècnica de Catalunya, https://upcommons.upc.edu/handle/2117/176980?locale-attribute=en
- Chakraborty et al. (2020) Chakraborty S., Navale N., Ratheesh A., Bhattacharyya S., 2020, MNRAS, 498, 5873
- Cherenkov Telescope Array Consortium et al. (2019) Cherenkov Telescope Array Consortium et al., 2019, Science with the Cherenkov Telescope Array. World Scientific, doi:10.1142/10986
- Chernyakova et al. (2020) Chernyakova M., Malyshev D., Mc Keague S., van Soelen B., Marais J. P., Martin-Carrillo A., Murphy D., 2020, MNRAS, 497, 648
- Chernyakova et al. (2021) Chernyakova M., et al., 2021, Universe, 7, 242
- Colomé et al. (2010) Colomé J., Ribas I., Francisco X., Casteels K., Fernández D., Isern J., Palau X., Torra J., 2010, Advances in Astronomy, 2010, 183016
- de Angelis et al. (2017) de Angelis A., et al., 2017, Experimental Astronomy, 44, 25
- de Jong et al. (1996) de Jong J. A., van Paradijs J., Augusteijn T., 1996, A&A, 314, 484
- de Naurois & Rolland (2009) de Naurois M., Rolland L., 2009, Astroparticle Physics, 32, 231–252
- Daniel et al. (2008) Daniel M. K., Archer A., Benbow W., Bird R., Brill A., collaboration V., 2008, in International Cosmic Ray Conference. pp 1325–1328 (arXiv:0709.4006)
- Del Santo & Segreto (2018) Del Santo M., Segreto A., 2018, The Astronomer’s Telegram, 11427, 1
- Dermer & Schlickeiser (1994) Dermer C. D., Schlickeiser R., 1994, ApJS, 90, 945
- Dziełak et al. (2021) Dziełak M. A., De Marco B., Zdziarski A. A., 2021, MNRAS, 506, 2020
- Fabian et al. (2020) Fabian A. C., et al., 2020, MNRAS, 493, 5389
- Fang et al. (2020) Fang K., Charles E., Blandford R. D., 2020, ApJ, 889, L5
- Fender & Belloni (2012) Fender R., Belloni T., 2012, Science, 337, 540
- Fender & Muñoz-Darias (2016) Fender R., Muñoz-Darias T., 2016, The Balance of Power: Accretion and Feedback in Stellar Mass Black Holes. Springer International Publishing Switzerland, p. 65, doi:10.1007/978-3-319-19416-5_3
- Fermi LAT Collaboration et al. (2009) Fermi LAT Collaboration et al., 2009, Science, 326, 1512
- Fitzpatrick (1999) Fitzpatrick E. L., 1999, PASP, 111, 63
- Gaia Collaboration (2018) Gaia Collaboration 2018, VizieR Online Data Catalog, p. I/345
- Gendreau et al. (2012) Gendreau K. C., Arzoumanian Z., Okajima T., 2012, in Takahashi T., Murray S. S., den Herder J.-W. A., eds, Society of Photo-Optical Instrumentation Engineers (SPIE) Conference Series Vol. 8443, Space Telescopes and Instrumentation 2012: Ultraviolet to Gamma Ray. p. 844313, doi:10.1117/12.926396
- H. E. S. S. Collaboration et al. (2018) H. E. S. S. Collaboration et al., 2018, A&A, 620, A66
- H.E.S.S. Collaboration et al. (2018) H.E.S.S. Collaboration et al., 2018, A&A, 612, A10
- Harvey et al. (2021) Harvey M., Rulten C. B., Chadwick P. M., 2021, MNRAS, 506, 6029
- Harvey et al. (2022) Harvey M., Rulten C., Chadwick P., 2022, in 37th International Cosmic Ray Conference. 12-23 July 2021. Berlin. p. 621 (arXiv:2107.07215)
- Holler et al. (2015) Holler M., Balzer A., Chalmé-Calvet R., de Naurois M., Zaborov D., 2015, Photon Reconstruction for H.E.S.S. Using a Semi-Analytical Shower Model (arXiv:1509.02896)
- Kawamuro et al. (2018) Kawamuro T., et al., 2018, The Astronomer’s Telegram, 11399, 1
- Krimm et al. (2013) Krimm H. A., et al., 2013, The Astrophysical Journal Supplement Series, 209, 14
- Li et al. (2020) Li J., Torres D. F., Liu R.-Y., Kerr M., de Oña Wilhelmi E., Su Y., 2020, Nature Astronomy, 4, 1177
- Loh et al. (2016) Loh A., et al., 2016, MNRAS, 462, L111
- Longair (1981) Longair M. S., 1981, High energy astrophysics. Cambridge University Press
- Lott et al. (2012) Lott B., Escande L., Larsson S., Ballet J., 2012, A&A, 544, A6
- MAGIC Collaboration et al. (2018) MAGIC Collaboration et al., 2018, A&A, 612, A14
- MAGIC Collaboration et al. (2020a) MAGIC Collaboration et al., 2020a, A&A, 635, A158
- MAGIC Collaboration et al. (2020b) MAGIC Collaboration et al., 2020b, A&A, 643, L14
- Maier & Holder (2017) Maier G., Holder J., 2017, in 35th International Cosmic Ray Conference (ICRC2017). p. 747 (arXiv:1708.04048)
- Markoff et al. (2005) Markoff S., Nowak M. A., Wilms J., 2005, ApJ, 635, 1203
- Matsuoka et al. (2009) Matsuoka M., et al., 2009, PASJ, 61, 999
- Mattox et al. (1996) Mattox J. R., et al., 1996, ApJ, 461, 396
- McEnery et al. (2019) McEnery J., et al., 2019, in Bulletin of the American Astronomical Society. p. 245 (arXiv:1907.07558)
- Mikołajewska et al. (2022) Mikołajewska J., Zdziarski A. A., Ziółkowski J., Torres M. A. P., Casares J., 2022, ApJ, 930, 9
- Mirabel & Rodríguez (1999) Mirabel I. F., Rodríguez L. F., 1999, ARA&A, 37, 409
- Pacholczyk (1970) Pacholczyk A. G., 1970, Radio astrophysics. Nonthermal processes in galactic and extragalactic sources. W. H. Freeman & Company
- Paredes et al. (2013) Paredes J. M., et al., 2013, Astroparticle Physics, 43, 301
- Park et al. (2015) Park N., Archer A., Benbow W., Bird R., Brill A., collaboration V., 2015, in 34th International Cosmic Ray Conference (ICRC2015). p. 771 (arXiv:1508.07070)
- Parsons & Hinton (2014) Parsons R. D., Hinton J. A., 2014, Astroparticle Physics, 56, 26
- Piano et al. (2017) Piano G., Munar-Adrover P., Verrecchia F., Tavani M., Trushkin S. A., 2017, ApJ, 839, 84
- Poutanen et al. (2022) Poutanen J., et al., 2022, Science, 375, 874
- Remillard & McClintock (2006) Remillard R. A., McClintock J. E., 2006, ARA&A, 44, 49
- Rodi et al. (2021) Rodi J., Tramacere A., Onori F., Bruni G., Sànchez-Fernàndez C., Fiocchi M., Natalucci L., Ubertini P., 2021, ApJ, 910, 21
- Rolke et al. (2005) Rolke W. A., López A. M., Conrad J., 2005, Nuclear Instruments and Methods in Physics Research A, 551, 493
- Romero et al. (2017) Romero G. E., Boettcher M., Markoff S., Tavecchio F., 2017, Space Sci. Rev., 207, 5
- Roming et al. (2005) Roming P. W. A., et al., 2005, Space Sci. Rev., 120, 95
- Roques & Jourdain (2019) Roques J.-P., Jourdain E., 2019, ApJ, 870, 92
- Sánchez-Sierras & Muñoz-Darias (2020) Sánchez-Sierras J., Muñoz-Darias T., 2020, A&A, 640, L3
- Shidatsu et al. (2019) Shidatsu M., Nakahira S., Murata K. L., Adachi R., Kawai N., Ueda Y., Negoro H., 2019, ApJ, 874, 183
- Strader et al. (2016) Strader J., Li K.-L., Chomiuk L., Heinke C. O., Udalski A., Peacock M., Shishkovsky L., Tremou E., 2016, ApJ, 831, 89
- Tavani et al. (2009) Tavani M., et al., 2009, Nature, 462, 620
- Tetarenko et al. (2021) Tetarenko A. J., et al., 2021, MNRAS, 504, 3862
- Torres et al. (2019) Torres M. A. P., Casares J., Jiménez-Ibarra F., Muñoz-Darias T., Armas Padilla M., Jonker P. G., Heida M., 2019, ApJ, 882, L21
- Torres et al. (2020) Torres M. A. P., Casares J., Jiménez-Ibarra F., Álvarez-Hernández A., Muñoz-Darias T., Armas Padilla M., Jonker P. G., Heida M., 2020, ApJ, 893, L37
- Tucker et al. (2018) Tucker M. A., et al., 2018, ApJL, 867, L9
- Veledina et al. (2019) Veledina A., et al., 2019, A&A, 623, A75
- Weekes et al. (2002) Weekes T. C., et al., 2002, Astroparticle Physics, 17, 221
- Wenger et al. (2000) Wenger M., et al., 2000, A&AS, 143, 9
- Wilks (1938) Wilks S. S., 1938, Ann. Math. Statist., 9, 60
- Winkler et al. (2003) Winkler C., et al., 2003, A&A, 411, L1
- Wood et al. (2021) Wood C. M., et al., 2021, MNRAS, 505, 3393
- Zanin et al. (2016) Zanin R., Fernández-Barral A., de Oña Wilhelmi E., Aharonian F., Blanch O., Bosch-Ramon V., Galindo D., 2016, A&A, 596, A55
- Zdziarski et al. (2018) Zdziarski A. A., et al., 2018, MNRAS, 479, 4399
- Zdziarski et al. (2021a) Zdziarski A. A., Dziełak M. A., De Marco B., Szanecki M., Niedźwiecki A., 2021a, ApJ, 909, L9
- Zdziarski et al. (2021b) Zdziarski A. A., et al., 2021b, ApJ, 914, L5
- Zdziarski et al. (2022) Zdziarski A. A., Tetarenko A. J., Sikora M., 2022, The Astrophysical Journal, 925, 189
Appendix A Observation dates
| Date | Date | H.E.S.S. | MAGIC | VERITAS |
|---|---|---|---|---|
| [MJD] | [Gregorian] | |||
| 58197 | 20 Mar. 2018 | |||
| 58199 | 22 Mar. 2018 | |||
| 58200 | 23 Mar. 2018 | |||
| 58201 | 24 Mar. 2018 | |||
| 58202 | 25 Mar. 2018 | |||
| 58204 | 27 Mar. 2018 | |||
| 58220 | 12 Apr. 2018 | |||
| 58221 | 13 Apr. 2018 | |||
| 58222 | 14 Apr. 2018 | |||
| 58223 | 15 Apr. 2018 | |||
| 58224 | 16 Apr. 2018 | |||
| 58227 | 19 Apr. 2018 | |||
| 58229 | 21 Apr. 2018 | |||
| 58230 | 22 Apr. 2018 | |||
| 58231 | 23 Apr. 2018 | |||
| 58232 | 24 Apr. 2018 | |||
| 58233 | 25 Apr. 2018 | |||
| 58234 | 26 Apr. 2018 | |||
| 58235 | 27 Apr. 2018 | |||
| 58276 | 7 Jun. 2018 | |||
| 58277 | 8 Jun. 2018 | |||
| 58278 | 9 Jun. 2018 | |||
| 58279 | 10 Jun. 2018 | |||
| 58280 | 11 Jun. 2018 | |||
| 58281 | 12 Jun. 2018 | |||
| 58282 | 13 Jun. 2018 | |||
| 58283 | 14 Jun. 2018 | |||
| 58284 | 15 Jun. 2018 | |||
| 58287 | 18 Jun. 2018 | |||
| 58288 | 19 Jun. 2018 | |||
| 58291 | 22 Jun. 2018 | |||
| 58306 | 7 Jul. 2018 | |||
| 58307 | 8 Jul. 2018 | |||
| 58309 | 10 Jul. 2018 | |||
| 58313 | 14 Jul. 2018 | |||
| 58314 | 15 Jul. 2018 | |||
| 58317 | 18 Jul. 2018 | |||
| 58389 | 28 Sep. 2018 | |||
| 58390 | 29 Sep. 2018 | |||
| 58391 | 30 Sep. 2018 | |||
| 58392 | 1 Oct. 2018 |
Appendix B VHE gamma-ray flux computation
For each experiment and energy bin, the low-level data analysis yields: the number of gamma-ray events recorded in the direction of the source (ON region) and in control regions with only background events (OFF regions), and , respectively; the exposure ratio of the OFF to ON regions, ; the effective observation time of the source after data quality cuts, ; and the effective collection area averaged over the considered energy interval, . We assume a power-law distribution for the gamma rays coming from the source, i.e. dd, where is the number of gamma-ray photons, is the flux normalisation constant, is the gamma-ray energy, and is the spectral index. With this, the expected number of gamma rays coming from the source in the energy interval , can be expressed as
| (6) |
In order to obtain the range of values of compatible with the observed quantities, the value of is fixed, and a maximum likelihood method is performed as described by Rolke et al. (2005). We define a Poissonian likelihood function as
| (7) |
where the terms correspond, from left to right, to the statistical distributions of a Poissonian signal, a Poissonian background, and a detection efficiency with a Gaussian uncertainty. The factors and , which are treated as nuisance parameters, are the expected number of background events in the signal region, and the expected detector efficiency, respectively. The parameters and are the estimates for the efficiency and its standard deviation, respectively. Fixing allows us to account for the relative systematic uncertainty of the instrument by equating it to the value of .
With the likelihood function defined, we find the values , and that maximise , which can be obtained analytically for the likelihood function expressed in Eq. (7). The null hypothesis is then tested versus the alternative hypothesis through a likelihood ratio test statistic:
| (8) |
where and are the values that maximise for a given . According to the Wilks theorem (Wilks, 1938), under the null hypothesis the distribution of the quantity converges to a distribution with 1 degree of freedom for large enough statistics. This allows us to find the range of compatible with the observations in the energy bin , , i.e., being , the null hypothesis is excluded at a level. Finally, the upper end of this range of is translated to an upper limit in flux (with a confidence level) through the assumed spectral shape.
The method explained above works for the flux computation of each individual experiment. In order to merge H.E.S.S., MAGIC and VERITAS data into a single flux measurement, a joint likelihood function is defined as the product of the individual likelihoods defined in Eq. (7):
| (9) |
Given that the data of each experiment are independent from each other, the maximisation procedure can be done individually for each instrument. Therefore, with the joint likelihood defined in Eq. (9), we have
| (10) |
for each value of , and the null hypothesis is rejected or not according to the same criteria as in the individual case.
MAGIC Collaboration:
1 Japanese MAGIC Group: Institute for Cosmic Ray Research (ICRR), The University of Tokyo, Kashiwa, 277-8582 Chiba, Japan
2 Instituto de Astrofísica de Canarias and Dpto. de Astrofísica, Universidad de La Laguna, E-38200, La Laguna, Tenerife, Spain
3 National Institute for Astrophysics (INAF), I-00136 Rome, Italy
4 Università di Udine and INFN Trieste, I-33100 Udine, Italy
5 Max-Planck-Institut für Physik, D-80805 München, Germany
6 Università di Padova and INFN, I-35131 Padova, Italy
7 Institut de Física d’Altes Energies (IFAE), The Barcelona Institute of Science and Technology (BIST), E-08193 Bellaterra (Barcelona), Spain
8 Technische Universität Dortmund, D-44221 Dortmund, Germany
9 Croatian MAGIC Group: University of Zagreb, Faculty of Electrical Engineering and Computing (FER), 10000 Zagreb, Croatia
10 IPARCOS Institute and EMFTEL Department, Universidad Complutense de Madrid, E-28040 Madrid, Spain
11 Centro Brasileiro de Pesquisas Físicas (CBPF), 22290-180 URCA, Rio de Janeiro (RJ), Brazil
12 University of Lodz, Faculty of Physics and Applied Informatics, Department of Astrophysics, 90-236 Lodz, Poland
13 Instituto de Astrofísica de Andalucía-CSIC, Glorieta de la Astronomía s/n, 18008, Granada, Spain
14 Deutsches Elektronen-Synchrotron (DESY), D-15738 Zeuthen, Germany
15 ETH Zürich, CH-8093 Zürich, Switzerland
16 Università di Pisa and INFN Pisa, I-56126 Pisa, Italy
17 Universitat de Barcelona, ICCUB, IEEC-UB, E-08028 Barcelona, Spain
18 Armenian MAGIC Group: A. Alikhanyan National Science Laboratory, 0036 Yerevan, Armenia
19 Centro de Investigaciones Energéticas, Medioambientales y Tecnológicas, E-28040 Madrid, Spain
20 Department for Physics and Technology, University of Bergen, Norway
21 INFN MAGIC Group: INFN Sezione di Catania and Dipartimento di Fisica e Astronomia, University of Catania, I-95123 Catania, Italy
22 INFN MAGIC Group: INFN Sezione di Torino and Università degli Studi di Torino, I-10125 Torino, Italy
23 INFN MAGIC Group: INFN Sezione di Bari and Dipartimento Interateneo di Fisica dell’Università e del Politecnico di Bari, I-70125 Bari, Italy
24 Croatian MAGIC Group: University of Rijeka, Faculty of Physics, 51000 Rijeka, Croatia
25 Universität Würzburg, D-97074 Würzburg, Germany
26 University of Geneva, Chemin d’Ecogia 16, CH-1290 Versoix, Switzerland
27 Finnish MAGIC Group: Finnish Centre for Astronomy with ESO, University of Turku, FI-20014 Turku, Finland
28 Departament de Física, and CERES-IEEC, Universitat Autònoma de Barcelona, E-08193 Bellaterra, Spain
29 Japanese MAGIC Group: Physics Program, Graduate School of Advanced Science and Engineering, Hiroshima University, 739-8526 Hiroshima, Japan
30 Armenian MAGIC Group: ICRANet-Armenia at NAS RA, 0019 Yerevan, Armenia
31 Croatian MAGIC Group: University of Split, Faculty of Electrical Engineering, Mechanical Engineering and Naval Architecture (FESB), 21000 Split, Croatia
32 Croatian MAGIC Group: Josip Juraj Strossmayer University of Osijek, Department of Physics, 31000 Osijek, Croatia
33 Japanese MAGIC Group: Department of Physics, Tokai University, Hiratsuka, 259-1292 Kanagawa, Japan
34 Università di Siena and INFN Pisa, I-53100 Siena, Italy
35 Saha Institute of Nuclear Physics, A CI of Homi Bhabha National Institute, Kolkata 700064, West Bengal, India
36 Inst. for Nucl. Research and Nucl. Energy, Bulgarian Academy of Sciences, BG-1784 Sofia, Bulgaria
37 Japanese MAGIC Group: Department of Physics, Yamagata University, Yamagata 990-8560, Japan
38 Finnish MAGIC Group: Space Physics and Astronomy Research Unit, University of Oulu, FI-90014 Oulu, Finland
39 Japanese MAGIC Group: Department of Physics, Kyoto University, 606-8502 Kyoto, Japan
40 Japanese MAGIC Group: Institute for Space-Earth Environmental Research and Kobayashi-Maskawa Institute for the Origin of Particles and the Universe, Nagoya University, 464-6801 Nagoya, Japan
41 Croatian MAGIC Group: Ruđer Bošković Institute, 10000 Zagreb, Croatia
42 INFN MAGIC Group: INFN Sezione di Perugia, I-06123 Perugia, Italy
43 INFN MAGIC Group: INFN Roma Tor Vergata, I-00133 Roma, Italy
44 Japanese MAGIC Group: Department of Physics, Konan University, Kobe, Hyogo 658-8501, Japan
45 also at International Center for Relativistic Astrophysics (ICRA), Rome, Italy
46 now at University of Innsbruck, Institute for Astro and Particle Physics
47 also at Port d’Informació Científica (PIC), E-08193 Bellaterra (Barcelona), Spain
48 now at Ruhr-Universität Bochum, Fakultät für Physik und Astronomie, Astronomisches Institut (AIRUB), 44801 Bochum, Germany
49 also at University of Innsbruck, Institute for Astro- and Particle Physics
50 also at Dipartimento di Fisica, Università di Trieste, I-34127 Trieste, Italy
51 also at University of Lodz, Faculty of Physics and Applied Informatics, Department of Astrophysics, 90-236 Lodz, Poland
52 also at INAF Trieste and Dept. of Physics and Astronomy, University of Bologna, Bologna, Italy
H.E.S.S. Collaboration:
53 University of Namibia, Department of Physics, Private Bag 13301, Windhoek 10005, Namibia
54 Dublin Institute for Advanced Studies, 31 Fitzwilliam Place, Dublin 2, Ireland
55 Max-Planck-Institut für Kernphysik, P.O. Box 103980, D 69029 Heidelberg, Germany
56 Landessternwarte, Universität Heidelberg, Königstuhl, D 69117 Heidelberg, Germany
57 Aix Marseille Université, CNRS/IN2P3, CPPM, Marseille, France
58 Laboratoire Leprince-Ringuet, École Polytechnique, CNRS, Institut Polytechnique de Paris, F-91128 Palaiseau, France
59 Centre for Space Research, North-West University, Potchefstroom 2520, South Africa
60 Instytut Fizyki Ja̧drowej PAN, ul. Radzikowskiego 152, 31-342 Kraków, Poland
61 DESY, D-15738 Zeuthen, Germany
62 School of Physics, University of the Witwatersrand, 1 Jan Smuts Avenue, Braamfontein, Johannesburg, 2050 South Africa
63 Université Paris Cité, CNRS, Astroparticule et Cosmologie, F-75013 Paris, France
64 Department of Physics and Electrical Engineering, Linnaeus University, 351 95 Växjö, Sweden
65 Institut für Physik, Humboldt-Universität zu Berlin, Newtonstr. 15, D 12489 Berlin, Germany
66 Laboratoire Univers et Théories, Observatoire de Paris, Université PSL, CNRS, Université Paris Cité, 92190 Meudon, France
67 Sorbonne Université, Université Paris Diderot, Sorbonne Paris Cité, CNRS/IN2P3, Laboratoire de Physique Nucléaire et de Hautes Energies, LPNHE, 4 Place Jussieu, F-75252 Paris, France
68 Université Savoie Mont Blanc, CNRS, Laboratoire d’Annecy de Physique des Particules - IN2P3, 74000 Annecy, France
69 IRFU, CEA, Université Paris-Saclay, F-91191 Gif-sur-Yvette, France
70 Astronomical Observatory, The University of Warsaw, Al. Ujazdowskie 4, 00-478 Warsaw, Poland
71 University of Oxford, Department of Physics, Denys Wilkinson Building, Keble Road, Oxford OX1 3RH, UK
72 Université Bordeaux, CNRS, LP2I Bordeaux, UMR 5797, F-33170 Gradignan, France
73 Institut für Physik und Astronomie, Universität Potsdam, Karl-Liebknecht-Strasse 24/25, D 14476 Potsdam, Germany
74 Friedrich-Alexander-Universität Erlangen-Nürnberg, Erlangen Centre for Astroparticle Physics, Erwin-Rommel-Str. 1, D 91058 Erlangen, Germany
75 Institut für Astro- und Teilchenphysik, Leopold-Franzens-Universität Innsbruck, A-6020 Innsbruck, Austria
76 Universität Hamburg, Institut für Experimentalphysik, Luruper Chaussee 149, D 22761 Hamburg, Germany
77 Obserwatorium Astronomiczne, Uniwersytet Jagielloński, ul. Orla 171, 30-244 Kraków, Poland
78 Institute of Astronomy, Faculty of Physics, Astronomy and Informatics, Nicolaus Copernicus University, Grudziadzka 5, 87-100 Torun, Poland
79 Nicolaus Copernicus Astronomical Center, Polish Academy of Sciences, ul. Bartycka 18, 00-716 Warsaw, Poland
80 Institut für Astronomie und Astrophysik, Universität Tübingen, Sand 1, D 72076 Tübingen, Germany
81 Department of Physics and Astronomy, The University of Leicester, University Road, Leicester, LE1 7RH, United Kingdom
82 GRAPPA, Anton Pannekoek Institute for Astronomy, University of Amsterdam, Science Park 904, 1098 XH Amsterdam, The Netherlands
83 Laboratoire Univers et Particules de Montpellier, Université Montpellier, CNRS/IN2P3, CC 72, Place Eugène Bataillon, F-34095 Montpellier Cedex 5, France
84 School of Physical Sciences, University of Adelaide, Adelaide 5005, Australia
85 Yerevan Physics Institute, 2 Alikhanian Brothers St., 375036 Yerevan, Armenia
86 Department of Physics, Konan University, 8-9-1 Okamoto, Higashinada, Kobe, Hyogo 658-8501, Japan
87 Kavli Institute for the Physics and Mathematics of the Universe (WPI), The University of Tokyo Institutes for Advanced Study (UTIAS), The University of Tokyo, 5-1-5 Kashiwa-no-Ha, Kashiwa, Chiba, 277-8583, Japan
88 RIKEN, 2-1 Hirosawa, Wako, Saitama 351-0198, Japan
89 Department of Physics, Rikkyo University, 3-34-1 Nishi-Ikebukuro, Toshima-ku, Tokyo 171-8501, Japan
90 Department of Physics, University of the Free State, PO Box 339, Bloemfontein 9300, South Africa
91 Kapteyn Astronomical Institute, University of Groningen, Landleven 12, 9747 AD Groningen, The Netherlands
VERITAS Collaboration:
92Department of Physics and Astronomy, University of Alabama, Tuscaloosa, AL 35487, USA
93Physics Department, Columbia University, New York, NY 10027, USA
94DESY, Platanenallee 6, 15738 Zeuthen, Germany
95Center for Astrophysics Harvard & Smithsonian, Cambridge, MA 02138, USA
96Department of Physics and Astronomy, Barnard College, Columbia University, NY 10027, USA
97Physics Department, California Polytechnic State University, San Luis Obispo, CA 94307, USA
98Department of Physics and Astronomy, Iowa State University, Ames, IA 50011, USA
99Department of Physics, Washington University, St. Louis, MO 63130, USA
100Department of Astronomy and Astrophysics, 525 Davey Lab, Pennsylvania State University, University Park, PA 16802, USA
101Department of Physics and Astronomy, Purdue University, West Lafayette, IN 47907, USA
102Department of Physics and Astronomy and the Bartol Research Institute, University of Delaware, Newark, DE 19716, USA
103School of Physics and Astronomy, University of Minnesota, Minneapolis, MN 55455, USA
104Department of Physics, California State University - East Bay, Hayward, CA 94542, USA
105School of Physics and Center for Relativistic Astrophysics, Georgia Institute of Technology, 837 State Street NW, Atlanta, GA 30332-0430
106Santa Cruz Institute for Particle Physics and Department of Physics, University of California, Santa Cruz, CA 95064, USA
107Department of Physics and Astronomy, University of Utah, Salt Lake City, UT 84112, USA
108Department of Physics and Astronomy, University of Iowa, Van Allen Hall, Iowa City, IA 52242, USA
109Department of Physics and Astronomy, DePauw University, Greencastle, IN 46135-0037, USA
110Physics Department, McGill University, Montreal, QC H3A 2T8, Canada
111School of Physics, National University of Ireland Galway, University Road, Galway, Ireland
112School of Physics, University College Dublin, Belfield, Dublin 4, Ireland
113Department of Physics and Astronomy, Ball State University, Muncie, IN 47306, USA
114Department of Physics, Anderson University, 1100 East 5th Street, Anderson, IN 46012
115Department of Physics and Astronomy, University of California, Los Angeles, CA 90095, USA
116Department of Physics, Queen’s University, Kingston, ON K7L 3N6, Canada
117Institute of Physics and Astronomy, University of Potsdam, 14476 Potsdam-Golm, Germany
118Department of Physical Sciences, Munster Technological University, Bishopstown, Cork, T12 P928, Ireland
119Department of Physics, Indiana University-Purdue University Indianapolis, Indianapolis, IN 46202, USA
120 Departament de Física, Universitat Politècnica de Catalunya (UPC), E-08019 Barcelona, Spain
121 Institutt for Fysikk, Norwegian University of Science and Technology, Trondheim, Norway
122 Center for Astro, Particle and Planetary Physics, New York University Abu Dhabi, PO Box 129188, Abu Dhabi, UAE
123 Institut d’Estudis Espacials de Catalunya (IEEC), E-08034 Barcelona, Spain