Features of hadronic and deconfined matter from AGS to LHC energies
Abstract
Previous extensive studies on the dependence of the average transverse momentum, its slope as a function of the hadron mass and the average transverse expansion on the particle multiplicity per unit rapidity and unit transverse overlap area of the colliding partners are extended to the ratio of the energy density to the entropy density.
The behaviour of the ratio between the average transverse momentum and the square root of the particle multiplicity per unit rapidity and unit transverse overlap area as a function of collision energy for a given centrality or as a function of centrality for a given collision energy supports the predictions of CGC and percolation based approaches. The dependence of the ratio of the energy density to the entropy density at different collision centralities for A-A collisions from AGS, SPS, RHIC and LHC energies is presented. The trend of this ratio towards a plateau at the highest RHIC energies followed by a steep rise at LHC energies is in agreement with theoretical predictions made 40 years ago that indicate this behaviour as a signature of a phase transition. This pattern strongly depends on the collision geometry, converging towards the dependence that characterizes the pp minimum bias (MB) collisions for the most peripheral A-A collisions. Expected similarities between pp and Pb-Pb collisions at LHC energies are confirmed.
I Introduction
The unprecedented amount of experimental information obtained at AGS, SPS, RHIC up to the highest energies from LHC supports the theoretical predictions made about 50 years ago on the possibility to produce very hot and dense matter in heavy ion collisions [1]. Using QCD asymptotic freedom properties, a transition from the hadronic phase to a high density ”quark soup” [2, 3] or ”quark-gluon plasma” [4] following the ”quark liberation” idea [3] is expected. The first estimates of the transition from a gas of free nucleons to hadronic matter and subsequently to deconfined matter as a function of density were done within the percolation approach [5, 6]. Studying the production mechanism and properties of tiny pieces of deconfined matter as a function of temperature and density is a difficult task to the extent that the highly inhomogeneous initial state, finite size effects, and violent dynamical evolution must be taken into account to obtain a unique explanation of the experimental observations. That is why a clean and unambiguous experimental signature of deconfinement using collisions with heavy ions is rather difficult to be established. Theoretical approaches, which combine sound hypotheses for different snapshots of the formation and evolution of the system produced in heavy ion collisions starting with the initial phase described in the Color Glass Condensate (CGC) approach [7, 8, 9, 10], followed by the process of equilibration described on the basis of the QCD kinetic theory method and the hydrodynamic expansion were recently developed [11]. The correlation between the multiplicity of particles and the average transverse momentum () has been proposed as a signature of the transition from hadronic to deconfined matter [12]. Such phenomenological models predict an increase followed by a plateau of as a function of entropy density, caused by the mixed phase corresponding to the transition from pure hadronic matter to deconfined matter. At even larger entropy density the starts to increase again. Following this idea and existing information on the average transverse mass () of charged hadrons identified in A-A collisions at AGS, SPS, and RHIC, a saturation of as a function of the charged particle multiplicity per unit rapidity for the most central collisions was evidenced [13]. In this study the was estimated using an exponential parameterization of the experimental spectra. Recently, including more information obtained at RHIC in the Beam Energy Scan (BES) program for Au-Au collisions and LHC data for the Pb-Pb collision at = 2.76 TeV [14] the correlation (-ln() for the most central collisions was studied for identified hadrons under the hypothesis that ( can be an approximation of the system temperature while ln () of its entropy. is the rest mass of the particle. A dependence on mass was clearly observed. The saturation range in ln() decreases and () increases again more violently going from pions to protons. It is worth mentioning that collective expansion and suppression phenomena can contribute in such a correlation to the observed trend. A similar prediction was obtained by including the relativistic hydrodynamic evolution of the quark-gluon plasma [15, 16]. In these works it was suggested that the correlation between the ratio of the energy density to entropy density is also sensitive to the transition from hadronic to deconfined matter. The energy density per unit transverse overlap area can be estimated using the Bjorken invariance, while the entropy density per unit transverse overlap area, assuming an isentropic expansion, is proportional to the particle multiplicity per unit rapidity and unit transverse overlap area. A similar correlation, using the charged particle multiplicity and the transverse energy per unit pseudorapidity ( for the most central collisions, with the assumption that ln() and a rather small dependence of the transverse overlap area () on the collision energy, was plotted using experimental information from SIS18 up to the highest energy from RHIC [17], the results from the LHC for the Pb-Pb collision at = 2.76 TeV being included once the data became available [18]. As predicted by the above mentioned models a plateau at the highest energies at RHIC and a strong increase at the LHC energy were evidenced. The - correlations for the most central collisions were shown for data measured by the PHENIX Collaboration at RHIC energies [19]. The - correlations for different centralities were represented for data measured by the STAR Collaboration at BES energies [20]. Theoretical predictions show that the energy over entropy versus entropy correlation is more sensitive to the equation of state than the average transverse mass versus multiplicity density one [21].
In the present paper, the results for the - correlation as a function of centrality in A-A collisions at different energies and a comparison with pp minimum bias and pp as a function of at LHC energies are presented. Results based on published data obtained in Au-Au collisions at AGS and RHIC and Pb-Pb collisions at SPS and LHC, in terms of - for the most central collisions are presented in Section II. Section III is dedicated to similar studies as a function of centrality for RHIC and LHC energies. In Section IV the core contribution in such correlations is presented. The dependence on / of the Bjorken energy density times the interaction time for central collisions and as a function of centrality is presented in Section V. The comparison of A-A with MB pp collisions at the same energies and for different charged particle multiplicities at LHC energies is discussed in Section VI. Conclusions are presented in Section VII.
II correlation for central A-A collisions
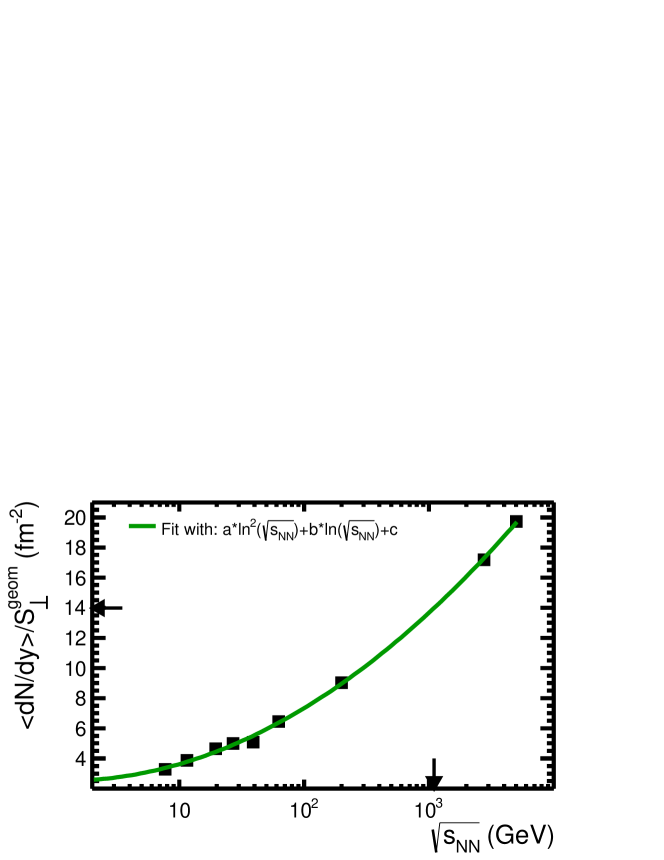
In our previous studies [22, 23, 24] it was shown that the particle multiplicity per unit rapidity and unit transverse overlap area, a good estimate of the entropy density, turns out to be a scaling observable which governs the behaviour of the average transverse expansion for identified charged hadrons and hyperons, independent on the size of the colliding systems and even for pp collisions at LHC energies. For collision energies higher than =39 GeV the scaling was also evident for the slope of as a function of mass. While such scaling also occurs below =39 GeV up to the mid-central collisions, a slight deviation of 10% relative to the higher energies is observed towards central collisions. As far as concerns , a very good scaling is observed for the identified charged hadrons at the RHIC energies. The linear dependence of on holds also for LHC energies, with a slightly different offset relative to the RHIC energies and a tendency towards saturation at the most central collisions. The geometrical transverse overlap area () of the two colliding nuclei for a given incident energy and centrality was estimated on the basis of a Glauber Monte-Carlo (MC) approach [25, 26, 27, 28] as explained in [22] where its values were compiled. They are used in the estimates made in the present paper. Using also the experimental values for positive pions, kaons and protons and compiled in [22], in Fig. 1a is represented the ratio as a function of collision energy for different centralities while in Fig. 1b as a function of centrality () for different collision energies.
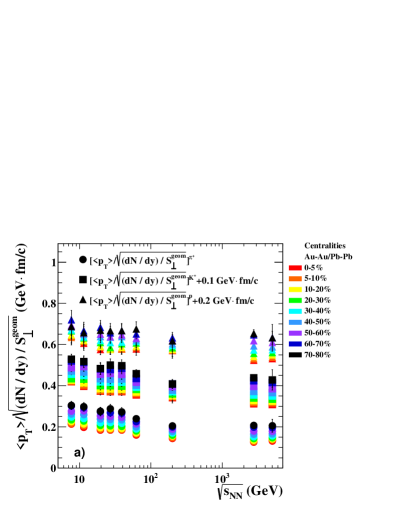
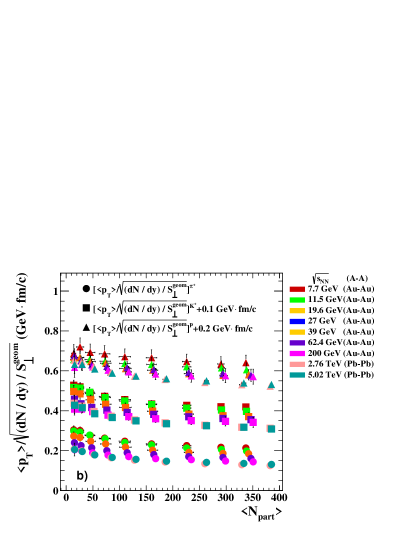
As can be seen in Fig. 1, the ratio between the average transverse momentum and the square root of the hadron multiplicity per unit rapidity and unit transverse overlap area of the colliding nuclei decreases towards central collisions and higher energies, thus supporting the predictions based on colour fields description of the small x degrees of freedom [7, 10, 29, *Ianc2, 31, *KLN2, *KLN3, *KLN4, *KLN5, *KLN6], local parton-hadron duality picture (LPHD) [37] and dimensionality argument [38, 39].
A similar behaviour is predicted by the string percolation scenario, inspired by CGC [40, 41]. In a string percolation approach [41]:
| (1) |
| (2) |
The colour reduction factor:
| (3) |
where , the 2-dimensional transverse density of strings, is given by , being the string radius and R the radius of the transverse overlap region. is the average number of strings, and are the average particle density and respectively the average transverse momentum squared of a single string. Therefore, / is decreasing with centrality for a given collision energy and with collision energy for a given centrality. The effects of the strong longitudinal colour fields on the identified charged hadrons and hyperons distributions in pp collisions at =7 TeV have also been investigated within the framework of the HIJING/B v2.0 model [42]. The experimental ratios of the distributions at different charged particle multiplicities to the one corresponding to the MB pp collision, each of them normalized to the corresponding charged particle density, were well reproduced using an increased strength of the colour field, characterized by the effective values of the string tension, from low to high charged particle multiplicity. These results pointed out the necessity of introducing a multiplicity (or energy density) dependence for the effective value of the string tension. They also show that at the LHC energies the global features of the interactions are mainly determined by the properties of the initial chromoelectric flux tubes, the system size playing a minor role. A rough estimate of the gluon number density and occupation number in the early stage of relativistic heavy ion collisions, following [43], gives values by 2.3 (2.9) higher at =2.76 TeV (5.02 TeV) Pb-Pb central collisions relative to Au-Au central collisions at =200 GeV. For the largest charged particle multiplicity in pp collisions at 7 TeV the values are a bit larger than those corresponding to Pb-Pb central collisions at =5.02 TeV. The parton density evolution as a function of x and , addressed more than 35 years ago [44] was experimentally confirmed at HERA [45]. The rise of the structure function at low x is still visible at small values of [46, 47] where the perturbative QCD does not work anymore. Therefore, rich and short-lived partonic cascades become visible as the collision energy increases, the string density and the percolation probability increasing too. The approaches mentioned above, predict an increase of the average transverse momentum at the same particle multiplicity per unit rapidity and unit transverse overlap area with collision energy and system size independence of the global features evidenced at LHC energies, the properties of the initial color electromagnetic flux tubes playing the main role.
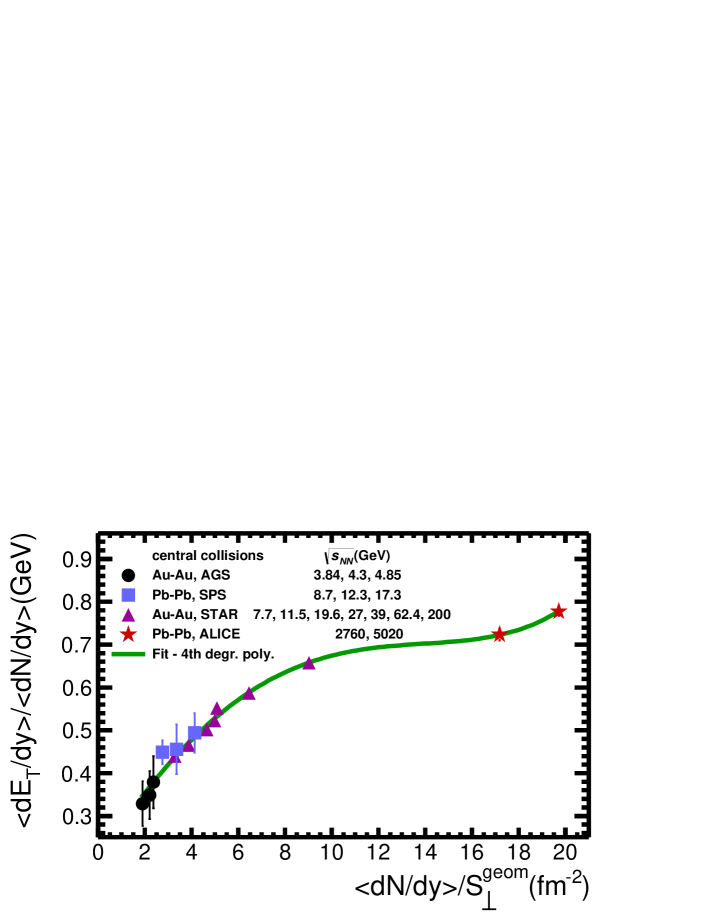
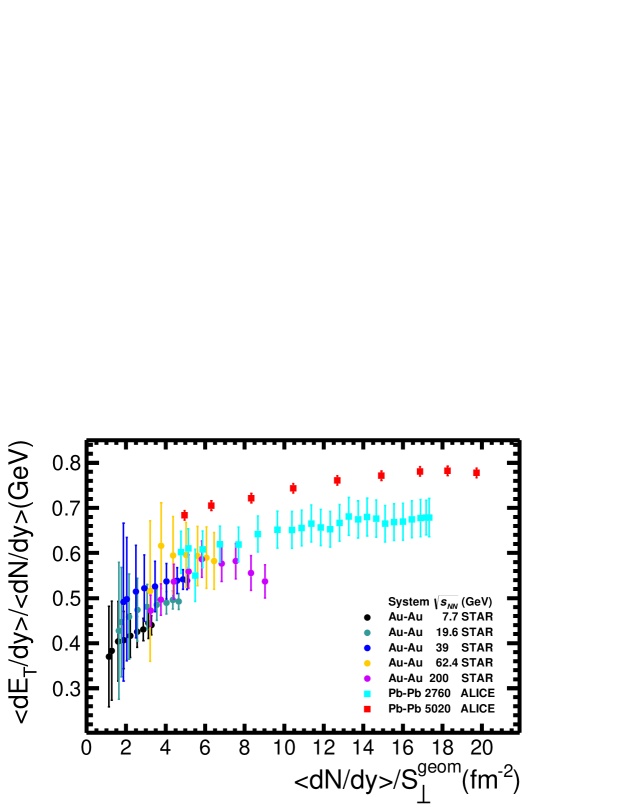
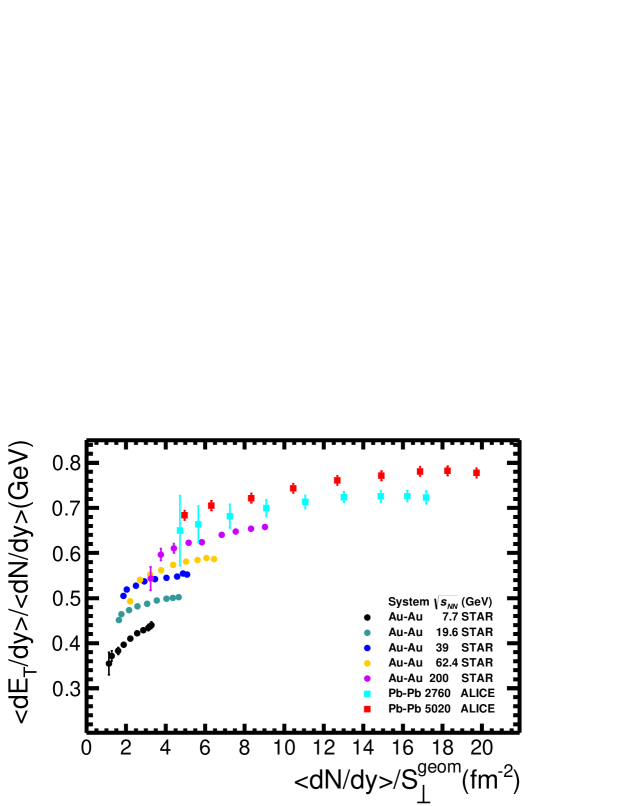
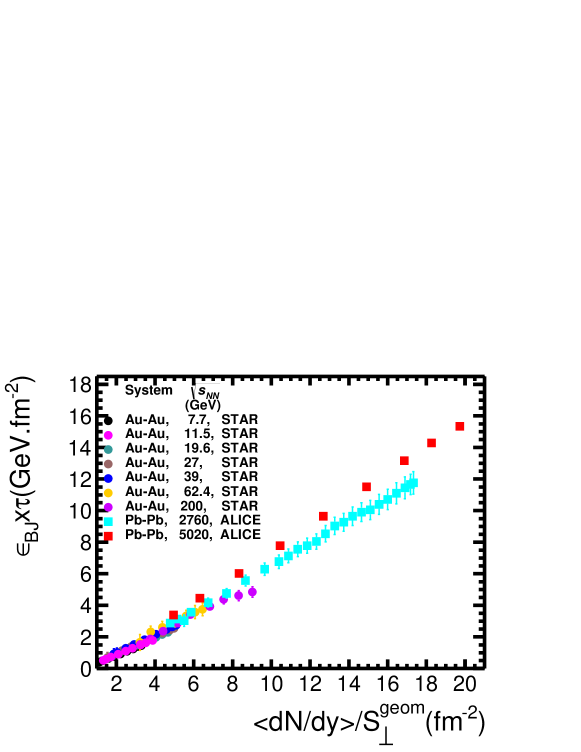
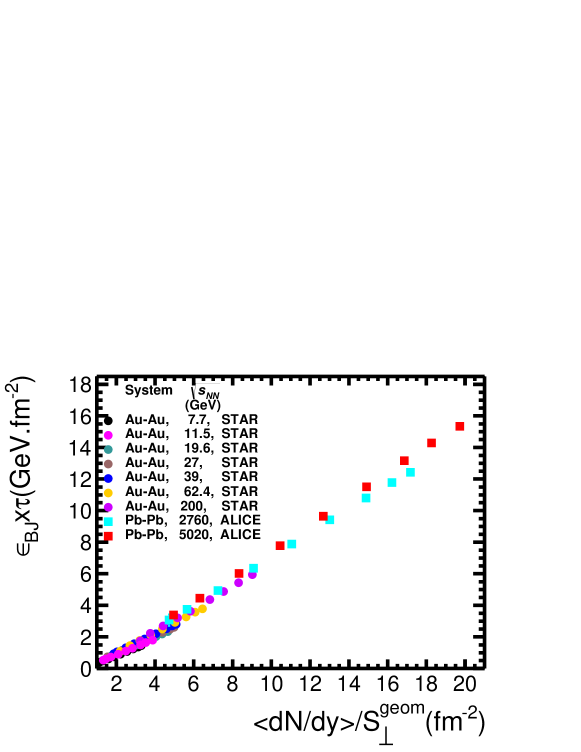
The - correlation for the most central A-A collisions using the experimental information collected over the years starting from AGS up to the LHC energies, is presented in Fig. 2. In the case of RHIC and LHC, experimental data from the STAR and ALICE collaborations were used mainly due to the availability in terms of measured spectra for light-flavor hadrons. The transverse energy per unit rapidity was considered in two ways. In case I (upper plot of Fig. 2) published measured values were used when they were available, while in case II (bottom plot of Fig. 2) an approximation similar to that from [48] was applied for the calculation. For the AGS and SPS energies the values and the scaling factor for to y transition at midrapidity were taken from [17] for all cases. For the BES energies the STAR data from [20] were used in case I. It should be noted that these were obtained from the transverse momentum spectra measured up to particles. For higher energies, STAR data regarding reported for Au-Au at = 62.4 GeV in [49] and [50] and respectively at = 200 GeV in [51] as well as the results of the transverse energy measurement for Pb-Pb at = 2.76 TeV from [18] were considered.
In case II, the full formula used to approximate was:
| (4) |
When the particle spectra were available, the average transverse mass was calculated. For Pb-Pb at = 5.02 TeV in the case of strange and multi-strange particles for which the transverse momentum distributions have not yet been published, the approximation was used. In accordance with the convention made in calorimetric measurements, was replaced by for baryons and for antibaryons.
In both cases the particle multiplicity per unit rapidity, dN/dy was estimated according to:
| (5) |
The experimental data in terms of transverse momentum spectra, yields and average transverse momenta were taken from: [52] (AGS and SPS), [14, 53] (Au-Au, BES), [48, 54] (Au-Au at = 62.4 GeV), [48, 55, 56] (Au-Au at = 200 GeV), [57, 58, 59, *ALICE42] (Pb-Pb at = 2.76 TeV) and [61, 62, 63, 64] (Pb-Pb at = 5.02 TeV).
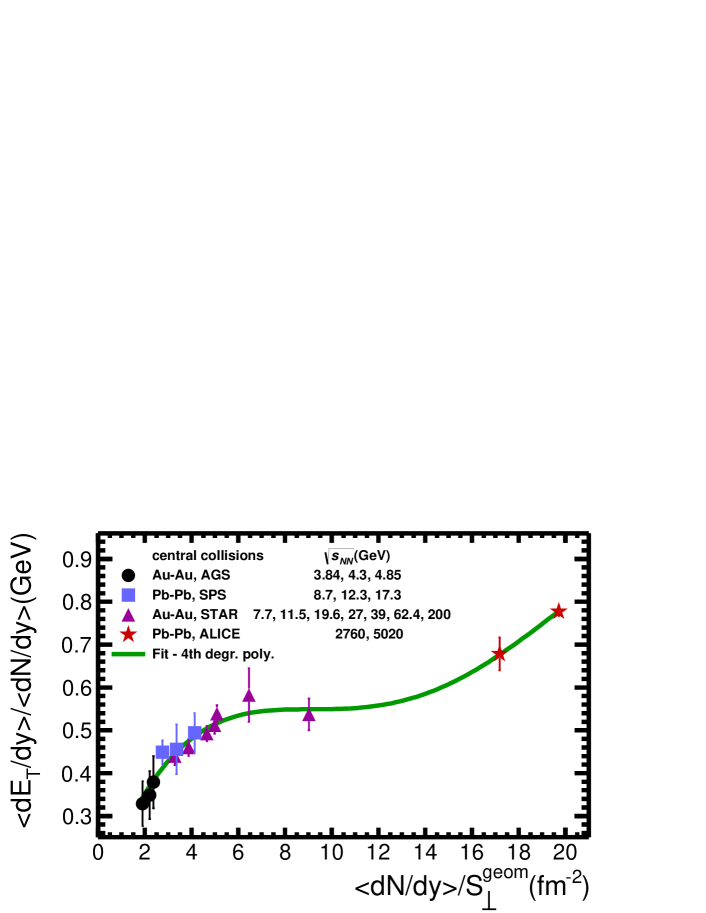
Eqs. 4 and 5 were applied so that the same particles and anti-particles to be taken into consideration in both formulas depending, from system to system and case to case, on the most complete published experimental information. With the increase of the collision energy, the contribution of strange and multi-strange particles in the formulas becomes more and more important. Thus, for Au-Au at = 62.4 and = 200 GeV and Pb-Pb at both LHC energies, the contribution of particles was also considered as explained in [65, 18]. In Fig. 2, as a function of for the most central collisions is shown.
The continuous lines in the figures, used to guide the eye, are the results of the fits of experimental points using a degree polynomial. increases with from AGS to SPS and RHIC energies, up to =39 GeV. Above =39 GeV the slope changes and a tendency towards saturation is evident. Even if the gap in the collision energy between =200 GeV, the highest one at RHIC, and the LHC energies is rather large, it is obvious that the result of the extrapolation of the trend of experimental data from low energies is below the real values of the experimental data corresponding to =2.76 TeV and 5.02 TeV LHC energies. The second rise taken at the inflection point in case II (Fig.2-bottom plot) corresponds approximately to the rise point, at the end of the plateau, in case I (Fig.2-upper plot), being around =1100 GeV, as deduced from the representation of in Fig.3. As it will be seen in Section V, this value agrees with the one corresponding to similar trends evidenced in the behaviour of the slope of the dependence of the Bjorken energy density times the interaction time on the entropy density, as a function of the collision energy. Experimental measurements between =200 GeV and 2760 GeV, missing for the moment, would be of real interest in this context.
Less influenced by processes such as collective expansion, suppression or kinematic cuts, the behaviour of such a representation supports the theoretical predictions that identify it as a signature of the phase transition [15, 16]. The obvious rise at LHC energies could be the result of the combined contributions of a higher temperature of the deconfined medium and a higher percolation probability in the regions of high density colour electromagnetic fields.
III - correlation for different centralities at RHIC and LHC energies
The - correlation depending on the centrality for several collision energies is shown in Fig. 4 where the difference between the upper and bottom plots is the same as in Fig. 2, explained in the previous chapter.
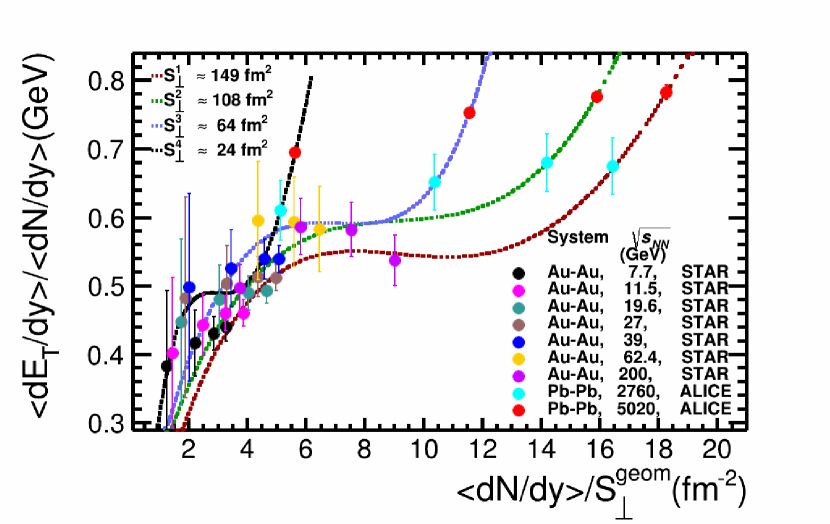
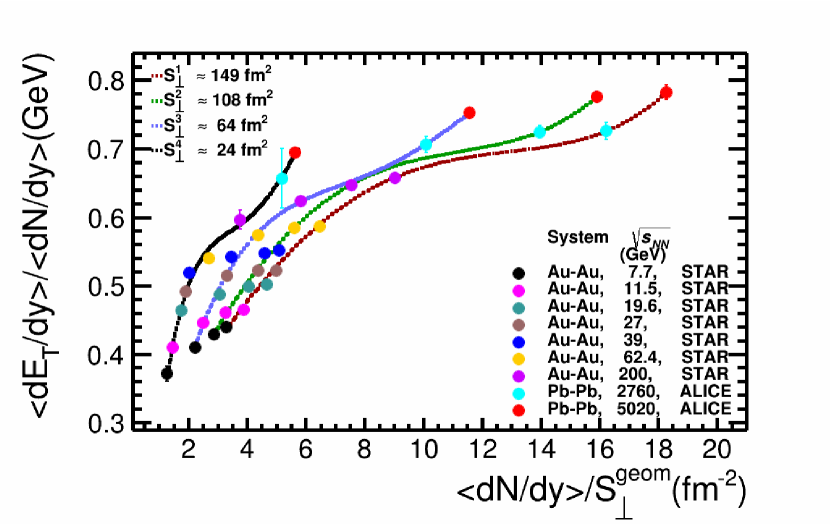
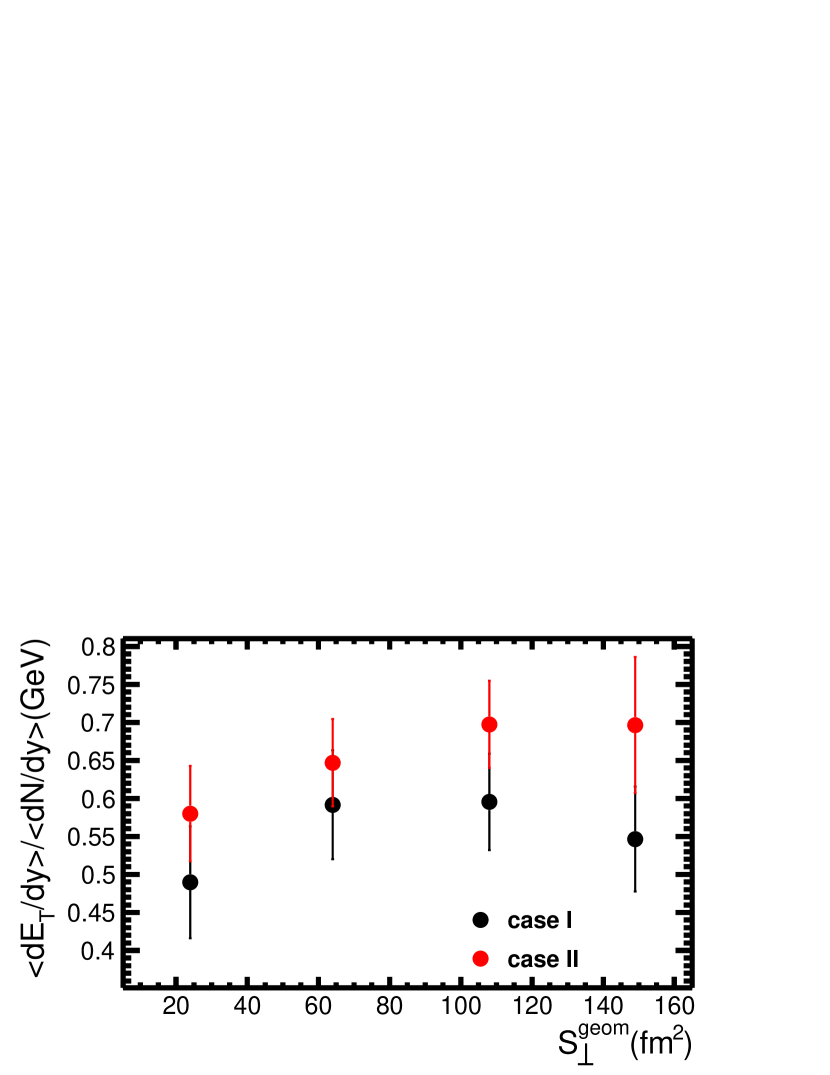
A close to linear dependence of as a function of can be seen. The offsets are different, increasing with the collision energy. The - correlations for Au-Au at =62.4 GeV [49, 50] and 200 GeV [51] based on calorimetry measurements (case I) do not follow the general trend what is not observed in case II (Fig. 4, bottom). In Fig. 5 are shown the - correlations for the overlap transverse areas 24, 64, 108 and 149 . The lines represent the result of fitting the corresponding points with a 4th degree polynomial. A clear dependence on the size of the transverse overlap area is observed. The rise in at RHIC energies becomes steeper and the range in , corresponding to a close to a plateau trend decreases from central to peripheral collisions [22] and is expected to converge towards the values corresponding to minimum bias pp collisions in the same energy range, once the contribution from nucleons suffering single collisions becomes predominant. At each inflection point of the fit lines, the corresponding value, related to the temperature of the mixed phase up to the pressure contribution, was estimated. The representation of these values as a function of shows a decrease from the central collisions to the peripheral ones, as can be seen in Fig. 6.
Such a volume dependence was predicted for the Chiral phase transition, the critical temperature decreasing towards smaller volume [66, 67]. It is worth mentioning that a volume dependence has also been observed in the magnetic phase transition [68]. The pressure term in the equation of state could also contribute to the observed trend. Therefore, theoretical models taking into account all possible contributions such to reproduce the experimental trend are required.
IV -( correlation
In a simple core-corona picture different observables in heavy ion collisions as a function of centrality and collision energy can be seen as the result of the combination between the contribution coming from the interactions of nucleons undergoing only single collisions (corona) and that coming from the multiple interactions of the rest of the nucleons (core).
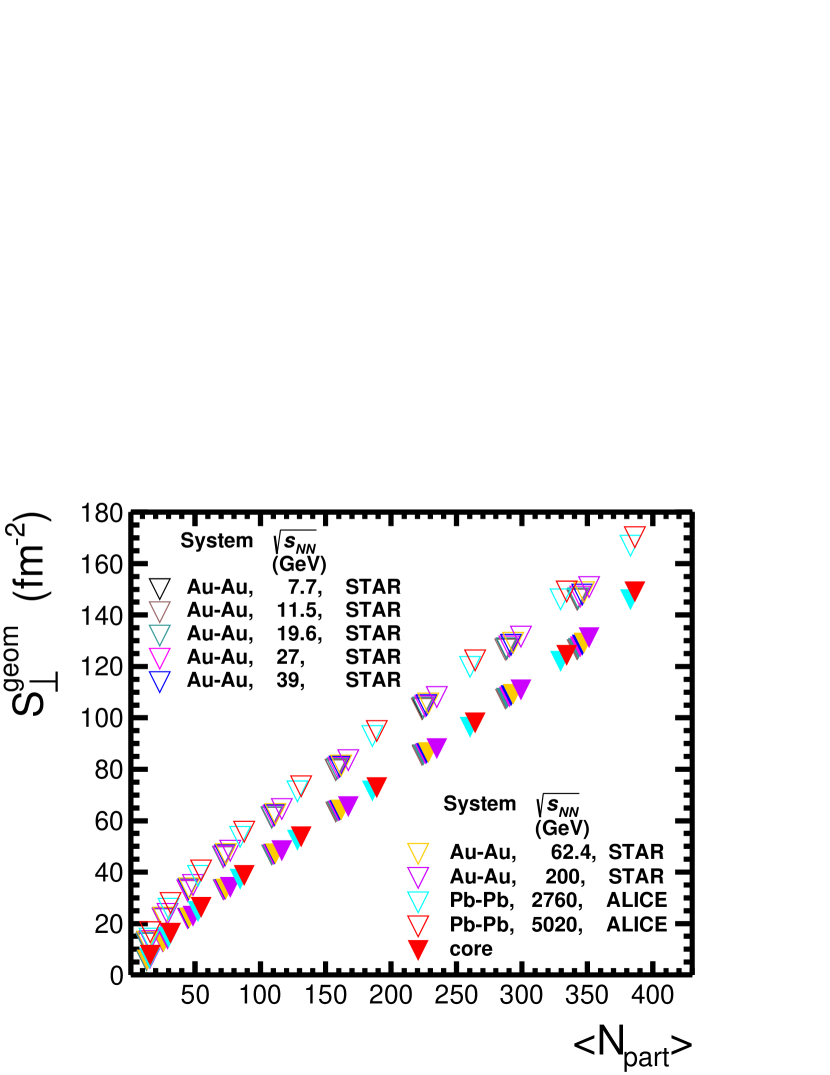
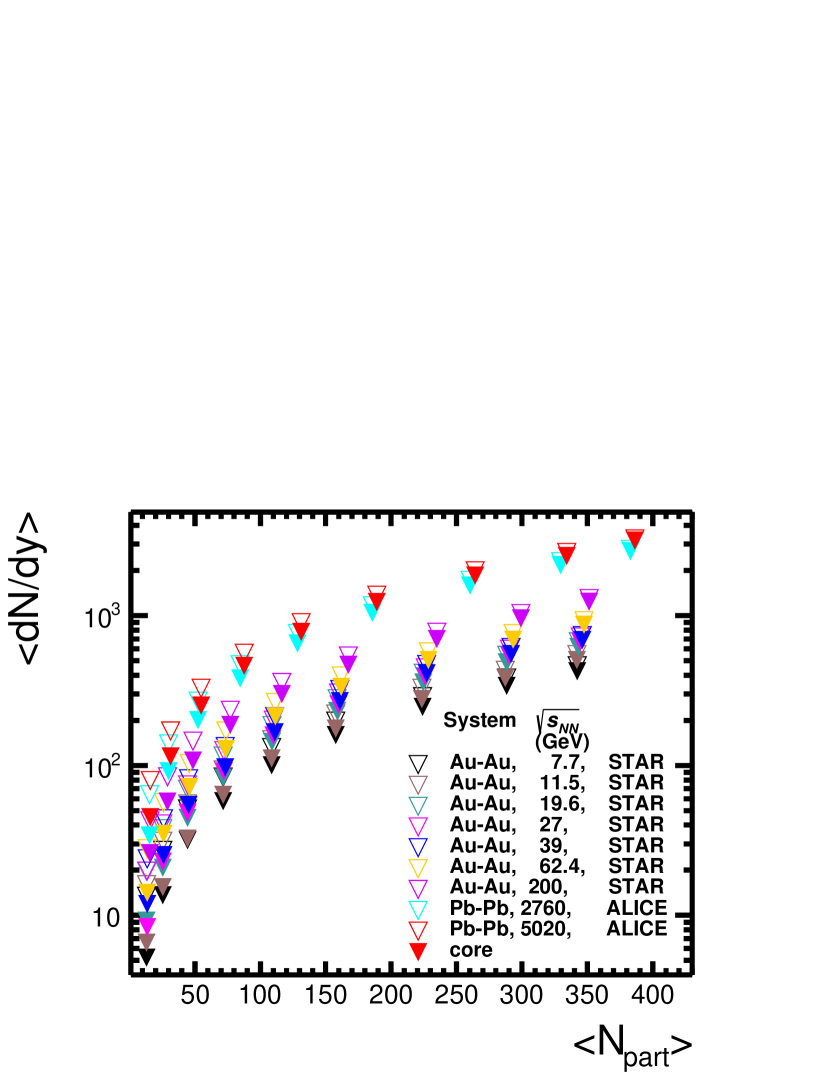

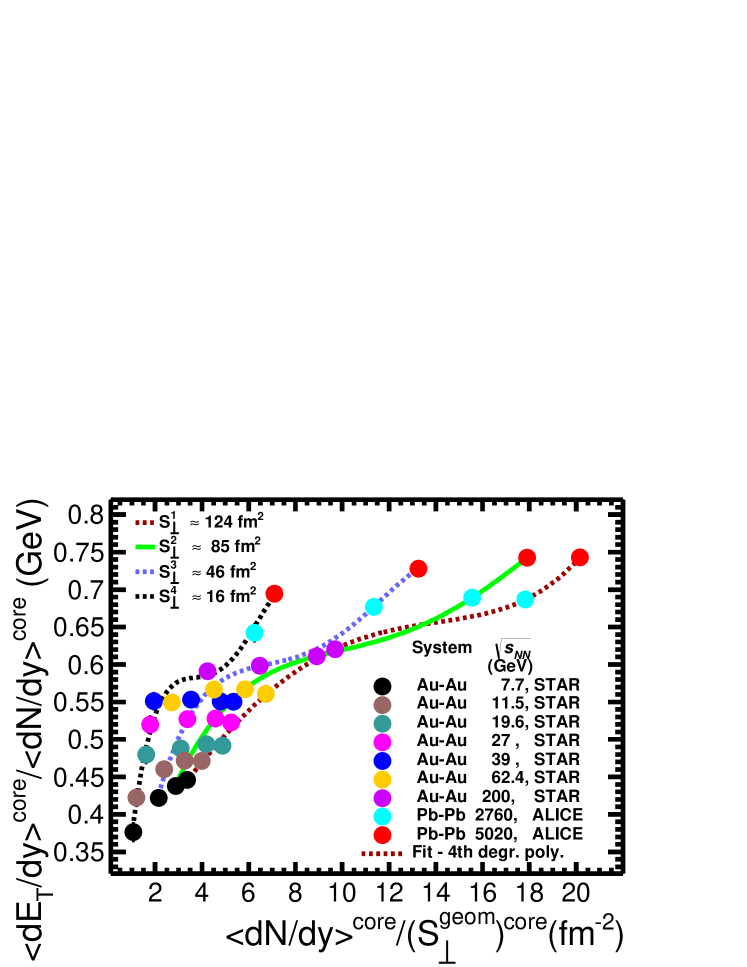
The dependence on the collision energy and centrality of the core-corona relative weight and its influence on different observables has been studied based on different approaches [69, 70, 71, 72, *Aich2, *Aich3, 75, 76, 77, 78]. The transverse overlap areas corresponding to interacting nucleons suffering more than a single collision () were estimated within the Glauber Monte-Carlo approach and compiled in [22]. Their dependence is presented in Fig. 7. As far as the spectra are not yet published for all hadrons measured in MB pp collisions, the studies, whose results are presented in this chapter, were done by using yields and average transverse mass values only for , , p and and the corresponding neutral hadrons in Eqs. 4 and 5 for both cases, i.e. total and core. The core corresponding yield and for a given species have been estimated by subtracting from the spectra for A-A at a given centrality the corresponding spectra measured in the MB pp collision at the same energy, weighted with the number of nucleons suffering only single collisions [78]. total and corresponding to the core contribution values are shown in Fig. 8 as a function of total . As expected, the corona contribution decreases from peripheral towards central collisions. The total - and core - ( correlations for four corresponding overlap areas are presented in Fig. 9 upper and bottom plots, respectively. Although they look similar, the dependence on the fireball transverse area is more clearly observed especially at lower values of the transverse overlap area, the tendency towards saturation being enhanced for the core contribution.
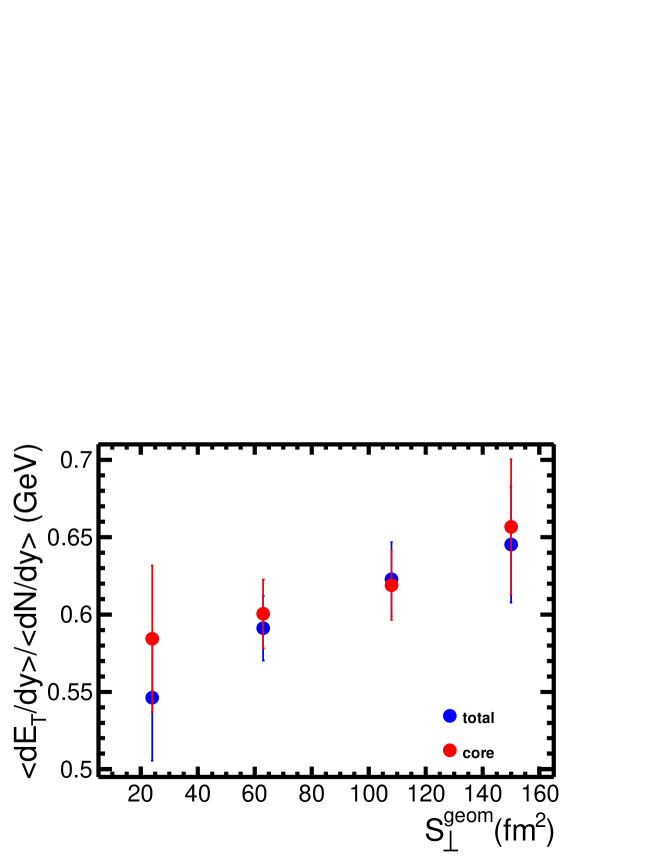
The quantitative difference can be followed in Fig. 10 where are represented the values corresponding to the inflection points of the fit lines for the four values of , total and core. The decrease from central to peripheral collisions is similar with the trend presented in the previous chapter where all hadrons were considered. As expected, the main difference between total and core is at peripheral collisions. Nevertheless, the decrease of values corresponding to the inflection points from central (larger ) to peripheral (lower ) is also present when only the core contribution is considered.
V Bjorken energy density as a function of
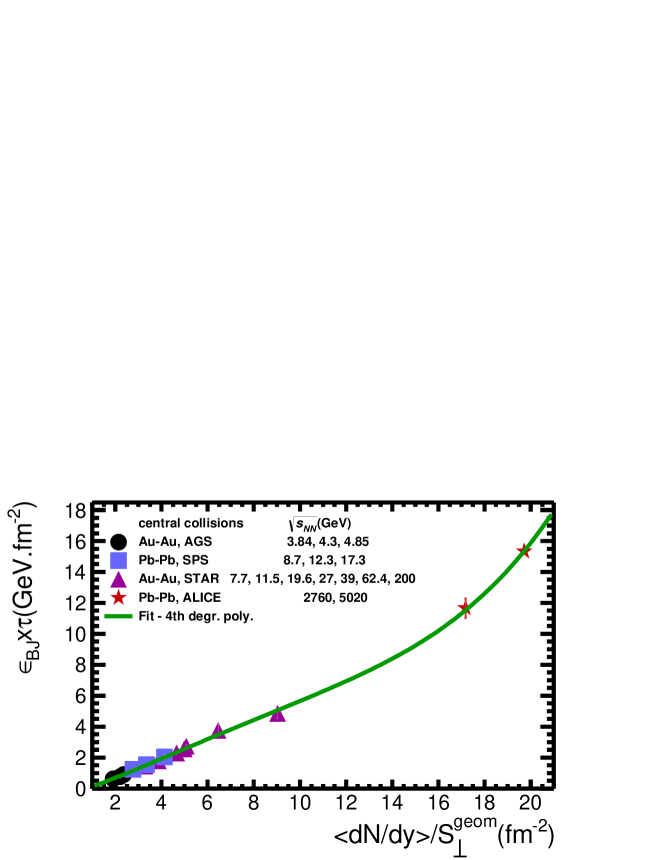
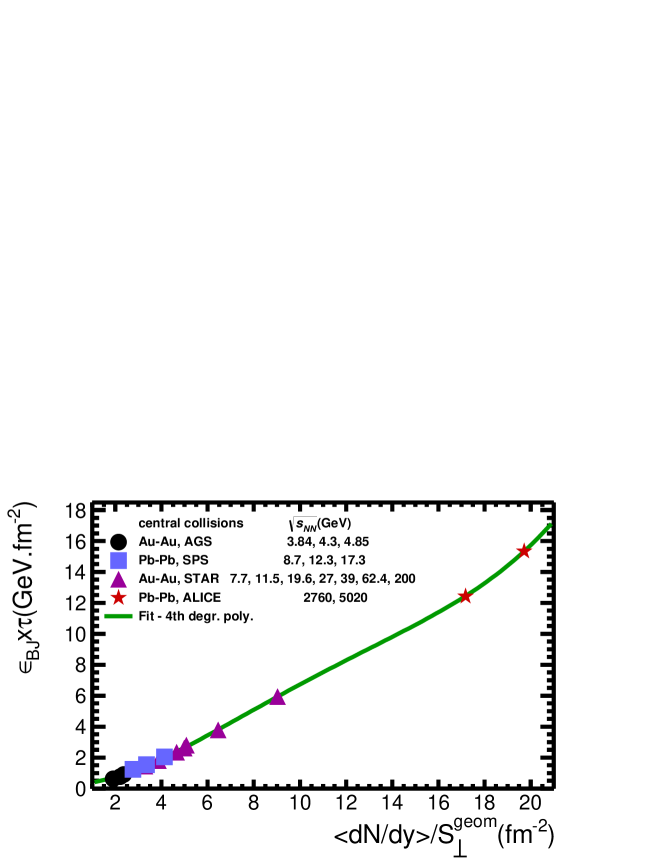
The Bjorken energy density times the interaction time (), i.e. , as a function of for the most central A-A collisions considered in the previous sections is presented in Fig. 11. The upper and bottom plots were obtained in case I and II as discussed in Chapters II and III.
The from AGS, SPS and RHIC energies has a linear dependence on the particle multiplicity per unit rapidity and unit transverse overlap area . The extrapolation to the values corresponding to the LHC energies falls below the experimental results. In Fig. 12 are represented the values for different centralities and collision energies. The upper and bottom plots were obtained for case I and II as explained in Sections II and III.
For each collision energy shows a linear dependence on . The values of the slope of this dependence, related to the temperature of the system, resulting from a linear fit of this correlation for each system and energy, as a function of collision energy are presented in Fig. 13.
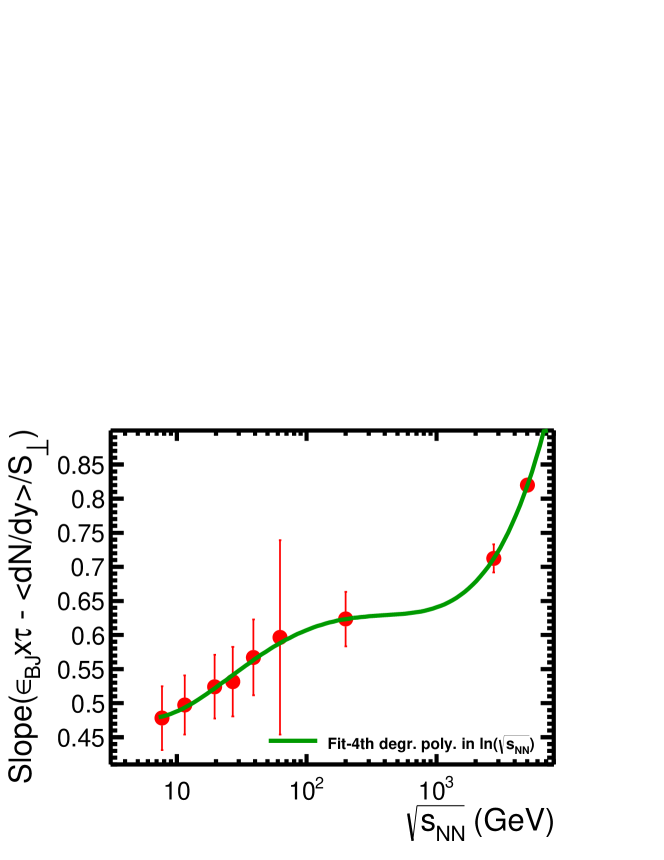
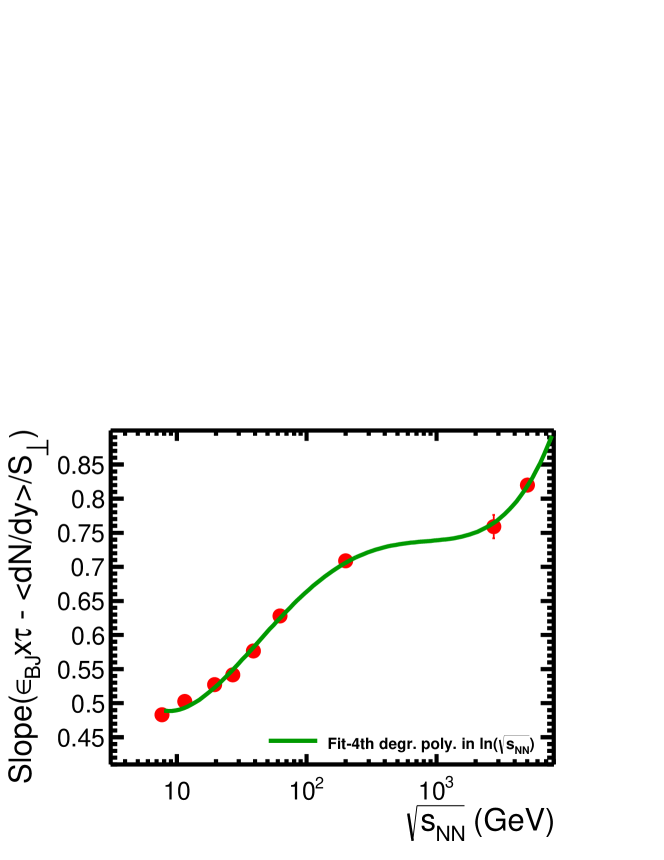
The slope values increase from AGS to the highest RHIC energy. The values for LHC energies are larger and not in-line with what should be expected from a simple extrapolation of the trend observed at lower collision energies, thus suggesting a saturation or an inflection point within the energy gap between RHIC and LHC energies. Following the considerations presented in Section II, the physics behind the increasing trend at LHC energies could be related to the large increase of the gluon density, therefore increasing the percolation probability, the ropes decay being at the origin of increased average transverse momentum.
VI Similar studies for MB for different collision energies and as a function of at LHC energies
The experimental data measured in pp MB collisions [48, 61, 79, 80, 81, 82] at = 62.4 GeV, 200 GeV, 2.76 TeV and 5.02 TeV were used for obtaining the - correlation considering only , , p and and the corresponding neutral hadrons in Eqs. 4 and 5. For the BES energies the spectra of the same particles, obtained with an interpolation procedure (INTP) from existing data in this range of energies [83] as explained in [78], were used. The transverse overlap area was estimated using the Glauber MC approach at subnucleonic level [84]. In Fig. 14 this correlation is presented on top of the results presented in Fig. 4, bottom plot. It is seen that the correlation in A-A collisions at different collision energies converges for very peripheral collisions, towards the one corresponding to the pp MB collisions. This is expected as far as towards peripheral A-A collisions the majority of interacting nucleons suffer only single nucleon-nucleon interactions.
At LHC energies, studies of pp collisions up to very high charged particle multiplicities, have shown similarities between pp and Pb-Pb in terms of the behaviour of different observables, like near-side long range pseudorapidity correlations [85], the ( - ) correlation as a function of charged particle multiplicity [86], azimuthal angular correlations [87], geometrical scaling [22, 23, 24], etc. Experimental data on transverse momentum spectra for light flavors as a function of the average charged particle multiplicity at LHC energies were published in [88, 89, 90]. The transverse overlap area for pp collisions, = as a function of charged particle multiplicity was estimated using the result of [91], computed in the IP-Glasma model, being the maximal radius for which the energy density of the Yang-Mills fields is above (). The model results were fitted with:
| (6) |
Using the same recipe we fitted the values from Ref. [91] for =10 with the following expression:
| (7) |
where x= and =1fm.
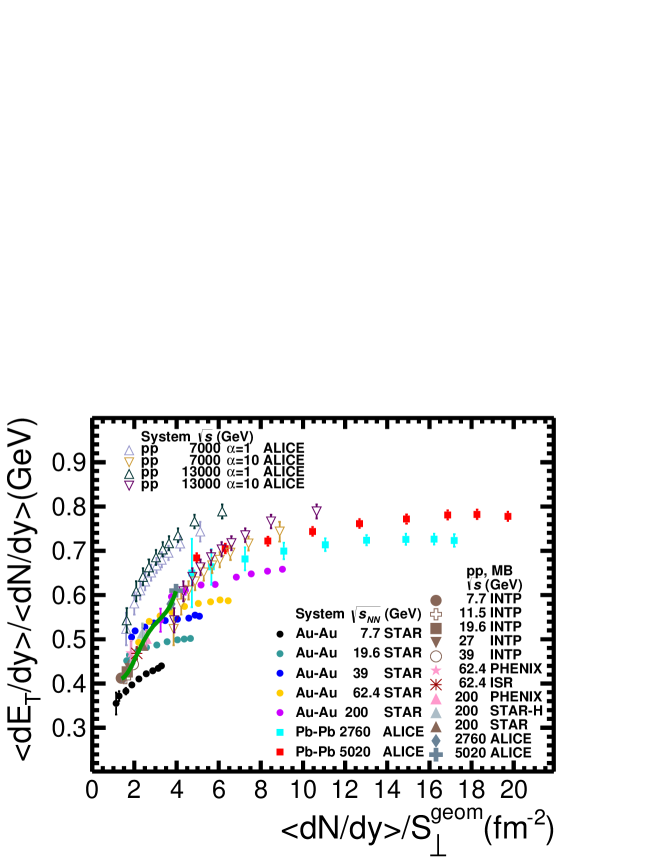
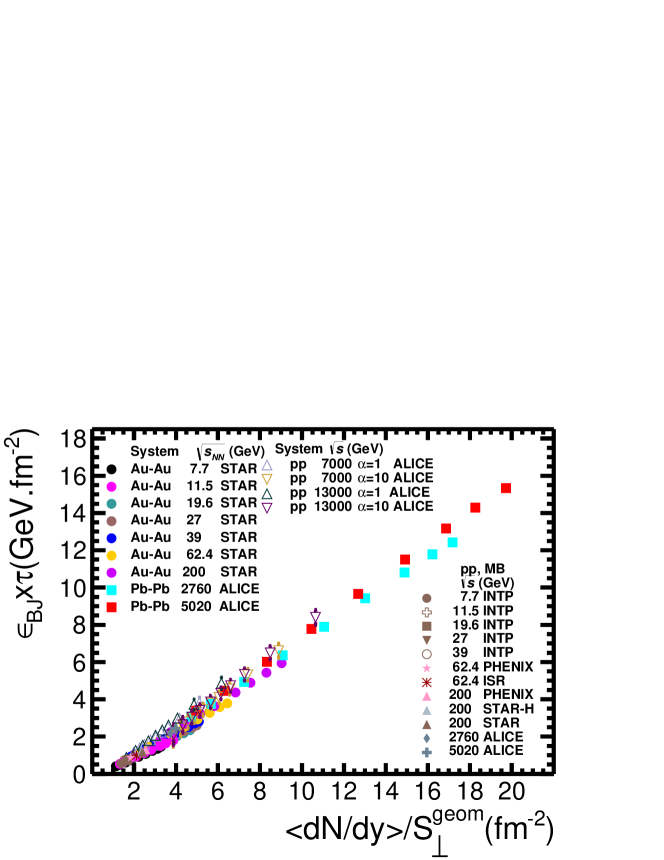
The transverse energy per unit rapidity has been estimated using the same procedure as the one used for A-A collisions at LHC explained in Chapter II. The result in terms of - correlations for pp collisions at =7 TeV and 13 TeV is presented in Fig. 14 for =10 and =1. The results corresponding to pp collision at =13 TeV were obtained within the assumption that the above parameterization of the transverse overlap area does not change significantly. It is seen that the trend of the - correlation for pp collisions at the LHC energies follows the one of Pb-Pb at =5.02 TeV, the quantitative agreement being good for =10 within the same range. For the same values of slightly larger values of in pp at =7 TeV relative to Pb-Pb at =5.02 TeV and in pp at =13 TeV relative to =7 TeV are seen. As mentioned in the previous chapters, this is in line with the expectations based on the string percolation approach. The Bjorken energy density times the interaction time values for pp collisions at the two LHC energies as a function of presented in Fig. 15, using the same symbols as in Fig. 14, are in very good agreement with the ones corresponding to Pb-Pb collision at =5.02 TeV. For pp collisions the slopes of as a function of are 0.890.09 at = 7 TeV and 0.920.07 at = 13 TeV, respectively, for =10, a bit larger values than that corresponding to the Pb-Pb collision at = 5.02 TeV.
VII Conclusions
The behaviour of as a function of the collision energy for a given centrality or as a function of centrality for a given collision energy supports the predictions of CGC and percolation based approaches. The dependence of the ratio of the energy density to the entropy density as a function of entropy density at different collision centralities for A-A collisions from AGS, SPS, RHIC and LHC energies reveals a tendency towards saturation starting with the largest RHIC energies and a steep rise at the LHC energies. A clear dependence of this behaviour on the size of the transverse overlap area is highlighted. The increase in at RHIC energies becomes steeper and the range, which corresponds to a trend close to a plateau, decreases from central to peripheral collisions, converging towards the behavior corresponding to MB pp collisions.
In a core-corona scenario, the corona contribution to the observed trends is removed and similar correlations are presented for the core in the case of the identified charged hadrons and their corresponding neutral particles.
The values of the energy density to the entropy density for the same entropy density increase with the collision energy, supporting the expectation based on the string percolation approach.
The Bjorken energy density times the interaction time has a linear dependence on the particle multiplicity per unit rapidity and unit transverse overlap area. The linear dependence also holds for the LHC energies, its slope increasing significantly at these energies which is an expected trend in the string percolation approach.
The observed trend of the slopes of the dependence on the entropy density , as a function of the collision energy, is similar with the ones evidenced in the - correlations.
The - and - correlations for pp collisions at =7 TeV and 13 TeV follow qualitatively the ones corresponding to Pb-Pb collisions at =5.02 TeV. Within the error bars, there is also a quantitative agreement if for for the pp collision as a function of particle density only the region of overlap zone characterized by an energy density larger than 2 GeV/ is considered. For pp collisions the slopes corresponding to the - correlation have a bit larger values than that corresponding to the Pb-Pb collision at = 5.02 TeV.
ACKNOWLEDGMENTS
This work was carried out under the contracts sponsored by the Ministry of Research, Innovation and Digitization: RONIPALICE-07/03.01.2022 (via IFA Coordinating Agency) and PN-19 06 01 03.
References
- Chapline and Kerman [1978] G. F. Chapline and A. K. Kerman, MIT report CTP-695 (1978).
- Collins and Perry [1975] J. C. Collins and M. J. Perry, Phys. Rev. Lett. 34, 1353 (1975).
- Cabibbo and Parisi [1975] N. Cabibbo and G. Parisi, Phys. Lett. B 59, 67 (1975).
- Shuryak [1978] E. V. Shuryak, Phys. Lett. B 78, 150 (1978).
- Baym [1979] G. Baym, Physica A 96, 131 (1979).
- Celik et al. [1980] T. Celik et al., Phys. Lett. B 97, 128 (1980).
- McLerran and Venugopalan [1994a] L. McLerran and R. Venugopalan, Phys. Rev. D 49, 2233 (1994a).
- McLerran and Venugopalan [1994b] L. McLerran and R. Venugopalan, Phys. Rev. D 49, 3352 (1994b).
- McLerran and Venugopalan [1994c] L. McLerran and R. Venugopalan, Phys. Rev. D 50, 2225 (1994c).
- Iancu et al. [2001] E. Iancu, A. Leonidov, and L. McLerran, Nucl. Phys. A 692, 583 (2001).
- Mazeliauskas [2019] A. Mazeliauskas, Nucl. Phys. A 982, 134 (2019), and references therein.
- Van Hove [1982] L. Van Hove, Phys. Lett. B 118, 138 (1982).
- Mohanty et al. [2003] B. Mohanty et al., Phys. Rev. C 68, 021901R (2003).
- Adamczyk et al. [2017] L. Adamczyk et al. (STAR Collaboration), Phys. Rev. C 96, 044904 (2017).
- Blaizot and Ollitrault [1986] J. P. Blaizot and J. Y. Ollitrault, Nucl. Phys. A 458, 745 (1986).
- Blaizot and Ollitrault [1987] J. P. Blaizot and J. Y. Ollitrault, Phys. Lett. B 191, 21 (1987).
- Adler et al. [2005] S. S. Adler et al. (PHENIX Collaboration), Phys. Rev. C 71, 034908 (2005).
- Adam et al. [2016] J. Adam et al. (ALICE Collaboration), Phys. Rev. C 94, 034903 (2016).
- Adare et al. [2016] A. Adare et al. (PHENIX Collaboration), Phys. Rev. C 93, 024901 (2016).
- Sharma [2018] B. Sharma, Transverse energy analysis of Au+Au collisions at 7.7, 11.5, 19.6, 27, and 39 GeV through the use of identified particles spectra, Master’s thesis, University of Tennessee (2018), https://trace.tennessee.edu/utk_gradthes/5118.
- Monnai and Ollitrault [2017] A. Monnai and J. Y. Ollitrault, Phys. Rev. C 96, 044902 (2017).
- Petrovici et al. [2018] M. Petrovici, A. Lindner, and A. Pop, Phys. Rev. C 98, 024904 (2018).
- Petrovici et al. [2019] M. Petrovici, A. Lindner, and A. Pop, AIP Conference Proceedings, 2076, 040001 (2019), EXOTIC NUCLEI AND NUCLEAR/PARTICLE ASTROPHYSICS (VII). PHYSICS WITH SMALL ACCELERATORS: Proceedings of the Carpathian Summer School of Physics 2018 (CSSP18).
- Lindner et al. [2021] A. Lindner, M. Petrovici, and A. Pop, Proceedings of Science (PoS), 380, 197 (2021), Particles and Nuclei International Conference (PANIC2021), https://pos.sissa.it/380/197/.
- Glauber [1955] R. J. Glauber, Phys. Rev. 100, 242 (1955).
- Franco and Glauber [1966] V. Franco and R. J. Glauber, Phys. Rev. 142, 119 (1966).
- Miller et al. [2007] M. L. Miller et al., Ann. Rev. Nucl. Part. Sci. 57, 205 (2007).
- Rybczynski et al. [2014] M. Rybczynski, G. Stefanek, W. Broniowski, and P. Bozek, Comput. Phys. Commun. 185, 759 (2014).
- Iancu et al. [2002] E. Iancu, A. Leonidov, and L. McLarren, e-print arXiv:hep-ph/0202270 (2002).
- Ferreiro et al. [2002] E. Ferreiro, E. Iancu, A. Leonidov, and L. McLarren, Nucl. Phys. A 703, 489 (2002).
- Kharzeev et al. [2004a] D. Kharzeev, E. Levin, and M. Nardi, Nucl. Phys. A 730, 448 (2004a).
- Kharzeev et al. [2004b] D. Kharzeev, E. Levin, and M. Nardi, Nucl. Phys. A 743, 329 (2004b).
- Kharzeev and Levin [2005] D. Kharzeev and E. Levin, Phys. Rev. C 71, 054903 (2005).
- Kharzeev and Nardi [2001] D. Kharzeev and M. Nardi, Phys. Lett. B 507, 121 (2001).
- Kharzeev et al. [2005] D. Kharzeev, E. Levin, and L. McLarren, Nucl. Phys. A 748, 627 (2005).
- Kharzeev et al. [2003] D. Kharzeev, E. Levin, and L. McLarren, Phys. Lett. B 561, 93 (2003).
- Dokshitzer et al. [1991] Y. L. Dokshitzer, V. A. Khoze, and S. Troian, J. Phys. G 17, 1585 (1991).
- Levin and Rezaeian [2011] E. Levin and A. H. Rezaeian, Phys. Rev. D 83, 114001 (2011).
- Lappi [2011] T. Lappi, Eur. Phys. J. C 71, 1699 (2011).
- Biro et al. [1984] T. S. Biro, H. B. Nielsen, and J. Knoll, Nucl. Phys. B 245, 449 (1984).
- J. Dias de Deus and C. Pajares [2011] J. Dias de Deus and C. Pajares, Phys. Lett. B 695, 211 (2011).
- V. Topor Pop and Petrovici [2018] V. Topor Pop and M. Petrovici, Phys. Rev. C 98, 064903 (2018).
- Mueller [2003] A. H. Mueller, Nucl. Phys. A 715, 20 (2003).
- Gribov et al. [1983] L. V. Gribov, E. M. Levin, and M. G. Ruskin, Phys. Rev. 100, 1 (1983), and references therein.
- H1 Collaboration [1996] H1 Collaboration, Nucl. Phys. B 470, 3 (1996).
- ZEUS Collaboration [1999] ZEUS Collaboration, Eur. Phys. J. C 7, 609 (1999), and references therein.
- H1 Collaboration [2009] H1 Collaboration, Eur. Phys. J. C 64, 561 (2009).
- Abelev et al. [2009] B. I. Abelev et al. (STAR Collaboration), Phys. Rev. C 79, 034909 (2009).
- R. Sahoo for the STAR Collaboration [2011] R. Sahoo for the STAR Collaboration, Indian J. Phys. 85, 897 (2011).
- Sahoo et al. [2006] R. Sahoo et al., Rom. Rep. Phys. 58, 055 (2006).
- Adams et al. [2004] J. Adams et al. (STAR Collaboration), Phys. Rev. C 70, 054907 (2004).
- Chatterjee et al. [2015] S. Chatterjee et al., Advances in High Energy Physics 2015, 349013 (2015).
- Adam et al. [2020] J. Adam et al. (STAR Collaboration), Phys. Rev. C 102, 034909 (2020).
- Aggarwal et al. [2011] M. M. Aggarwal et al. (STAR Collaboration), Phys. Rev. C 83, 024901 (2011).
- Adams et al. [2007] J. Adams et al. (STAR Collaboration), Phys. Rev. Lett. 98, 062301 (2007).
- Agakishiev et al. [2012] G. Agakishiev et al. (STAR Collaboration), Phys. Rev. Lett. 108, 072301 (2012).
- Abelev et al. [2013a] B. Abelev et al. (ALICE Collaboration), Phys. Rev. C 88, 044910 (2013a).
- Abelev et al. [2013b] B. Abelev et al. (ALICE Collaboration), Phys. Rev. Lett. 111, 222301 (2013b).
- Abelev et al. [2014a] B. Abelev et al. (ALICE Collaboration), Phys. Lett. B 728, 216 (2014a).
- Abelev et al. [2014b] B. Abelev et al. (ALICE Collaboration), Phys. Lett. B 734, 409 (2014b).
- Acharya et al. [2020a] S. Acharya et al. (ALICE Collaboration), Phys. Rev. C 101, 044907 (2020a).
- D. S. de Albuquerque [2019] D. S. de Albuquerque, Ph.D. thesis (2019), CERN-THESIS-2019-135.
- P. Kalinak for the ALICE Collaboration [2017] P. Kalinak for the ALICE Collaboration, European Physical Society Conference on High Energy Physics, 5-12 July 2017, Venice, Italy, PoS(EPS-HEP2017)168 (2017), https://pos.sissa.it/314/168/pdf.
- D. S. de Albuquerque for the ALICE Collaboration [2019] D. S. de Albuquerque for the ALICE Collaboration, Nucl. Phys. A 982, 823 (2019), XXVIIth International Conference on Ultrarelativistic Nucleus-Nucleus Collisions (Quark Matter 2018).
- Subrata Pal and Scott Pratt [2004] Subrata Pal and Scott Pratt, Phys. Lett. B 518, 310 (2004).
- Braun et al. [2006] J. Braun et al., Phys. Rev. D 73, 074010 (2006).
- Bo-Liu Li et al. [2019] Bo-Liu Li et al., Nucl. Phys. B 938, 298 (2019).
- Arnold et al. [1994] Z. Arnold et al., Solid State Communication 92, 807 (1994).
- Bozek [2005] P. Bozek, Acta Phys. Pol. B 36, 3071 (2005).
- Werner [2007] K. Werner, Phys. Rev. Lett. 98, 152301 (2007).
- Becattini and Manninen [2008] F. Becattini and J. Manninen, J. Phys. G 35, 104013 (2008).
- Aichelin and Werner [2009] J. Aichelin and K. Werner, Phys. Rev. C 79, 064907 (2009).
- Aichelin and Werner [2010a] J. Aichelin and K. Werner, Phys. Rev. C 81, 029902(E) (2010a).
- Aichelin and Werner [2010b] J. Aichelin and K. Werner, J. Phys. G 37, 094006 (2010b).
- Bozek [2009] P. Bozek, Phys. Rev. C 79, 054901 (2009).
- Gemard and Aichelin [2014] M. Gemard and J. Aichelin, Astronom. Nachr. 335, 660 (2014).
- Petrovici et al. [2017] M. Petrovici et al., Phys. Rev. C 96, 014908 (2017).
- [78] A. Pop and M. Petrovici, to be published.
- Adare et al. [2011] A. Adare et al. (PHENIX Collaboration), Phys. Rev. C 83, 064903 (2011).
- Adams et al. [2005] J. Adams et al. (STAR Collaboration), Phys. Lett. B 616, 8 (2005).
- Adams et al. [2006] J. Adams et al. (STAR Collaboration), Phys. Lett. B 637, 161 (2006).
- Abelev et al. [2014c] B. Abelev et al. (ALICE Collaboration), Phys. Lett. B 736, 196 (2014c).
- Alper et al. [1975] B. Alper et al. (British-Scandinavian Collaboration), Nucl. Phys. B 100, 237 (1975).
- Bozek et al. [2019] P. Bozek, W. Broniowski, M. Rybczynski, and G. Stefanek, Comput. Phys. Commun. 245, 106850 (2019).
- CMS Collaboration [2010] CMS Collaboration, J. High Energ. Phys. 9, 91 (2010).
- C. Andrei, ALICE Collaboration [2014] C. Andrei, ALICE Collaboration, Nucl. Phys. A 931, c888 (2014).
- CMS Collaboration [2017] CMS Collaboration, Phys. Lett. B 765, 193 (2017).
- Acharya et al. [2019] S. Acharya et al. (ALICE Collaboration), Phys. Rev. C 99, 024906 (2019).
- Acharya et al. [2020b] S. Acharya et al. (ALICE Collaboration), Eur. Phys. J. C 80, 693 (2020b).
- Acharya et al. [2020c] S. Acharya et al. (ALICE Collaboration), Eur. Phys. J. C 80, 167 (2020c).
- Bzdak et al. [2013] A. Bzdak et al., Phys. Rev. C 87, 064906 (2013).