DifferSketching: How Differently Do People Sketch 3D Objects?
Abstract.
Multiple sketch datasets have been proposed to understand how people draw 3D objects. However, such datasets are often of small scale and cover a small set of objects or categories. In addition, these datasets contain freehand sketches mostly from expert users, making it difficult to compare the drawings by expert and novice users, while such comparisons are critical in informing more effective sketch-based interfaces for either user groups. These observations motivate us to analyze how differently people with and without adequate drawing skills sketch 3D objects. We invited 70 novice users and 38 expert users to sketch 136 3D objects, which were presented as 362 images rendered from multiple views. This leads to a new dataset of 3,620 freehand multi-view sketches, which are registered with their corresponding 3D objects under certain views. Our dataset is an order of magnitude larger than the existing datasets. We analyze the collected data at three levels, i.e., sketch-level, stroke-level, and pixel-level, under both spatial and temporal characteristics, and within and across groups of creators. We found that the drawings by professionals and novices show significant differences at stroke-level, both intrinsically and extrinsically. We demonstrate the usefulness of our dataset in two applications: (i) freehand-style sketch synthesis, and (ii) posing it as a potential benchmark for sketch-based 3D reconstruction. Our dataset and code are available at https://chufengxiao.github.io/DifferSketching/.
1. Introduction
Using sketches to depict shape and form is a natural and intuitive choice for humans. Consequently, numerous sketch-based interfaces and systems have been proposed for 3D modeling (Li et al., 2017a; Lun et al., 2017; Han et al., 2017) and other content creation tasks. Many of them carry the claim of being friendly even for novice users, i.e., users with limited drawing training/experience. The extent to which such a claim holds is however questionable, since training sketches are predominately algorithm-generated due to a lack of large-scale datasets of paired sketches and 3D models. These pseudo-sketches, albeit being faithful to their corresponding 3D models, do not carry the appropriate level of abstraction and deformation common in novice user sketches. As a result, models trained often carry a strong bias for professional users, i.e., users with multiple years of professional drawing training/experience, who are more likely to produce sketches similar to algorithm-generated ones, while performing relatively poorly for novice users, as shown in Section 6.2.
This domain gap between freehand sketches and algorithm-gene-rated line drawings has been known to the community, and was first carefully investigated by Cole et al. (2008). They invited skilled artists to make line drawings given a dozen 3D models and then analyzed these drawings after registering them with the rendered images of the 3D models. More recently, Gryaditskaya et al. (2019) presented the OpenSketch dataset and by analyzing the collected sketches they aim to understand how professional designers sketch 3D CAD models from new views. These datasets lead to insightful findings on how professional artists sketch 3D objects. However, understanding how novice users sketch 3D objects is under explored. Perhaps more importantly, there is a lack of comprehensive study on how differently novice and expert users sketch 3D objects. Understanding the differences in how these two diverse groups of people sketch critically informs designs of sketch-based interactive systems that are friendly to both, or specific for either. Moreover, the aforementioned datasets are of small scale and involve only a dozen 3D objects. Collecting a larger-scale dataset of sketches covering a larger set of objects will not only help derive more general findings but also benefit the training and/or testing of learning-based systems.
To understand the difference between expert and novice users in drawing 3D objects, we need a new dataset where users with different drawing skills are asked to sketch the same set of 3D objects. A potential solution would be asking users to sketch an imagined 3D object and then asking professional 3D modelers to create the 3D object. The resulting sketch-model pairs might be useful for sketch-based 3D modeling. However, sketching upon imagination and modeling upon 2D sketches are both subjective tasks, hindering a comparison between experts’ and novices’ drawings, which are difficult to register with each other at a stroke level under such a setup. Another approach could be sketching a reference object from an unseen viewpoint, as done in (Gryaditskaya et al., 2019). However, this might not work well for novices, since they would not have the same skill to depict a new viewpoint as professionals. Aiming for a fair comparison, we follow the data collection approach by Cole et al. (2008), but recruit a larger group of users with different drawing skills and involve a significantly larger set of 3D models from 9 categories.
Specifically, we invited 70 novice users and 38 expert users to sketch 136 3D objects under 2-3 different views, leading to 362 reference images. Each reference image was sketched by 5 novice users and 5 expert users. We then recruited another group of participants to trace the reference images and utilized the resulting tracings as fiducials to register the freehand drawings of the same reference images. By recording the time information for each stroke in the drawing sessions, we obtained the temporal data along with the freehand sketches, to facilitate further temporal analysis. Our study results in a moderately large sketch dataset, involving 3,620 freehand sketches, paired with the corresponding reference images as well as the corresponding 3D models. Our dataset is an order of magnitude larger than the existing datasets for similar purposes (under the stroke-level group in Table 1).
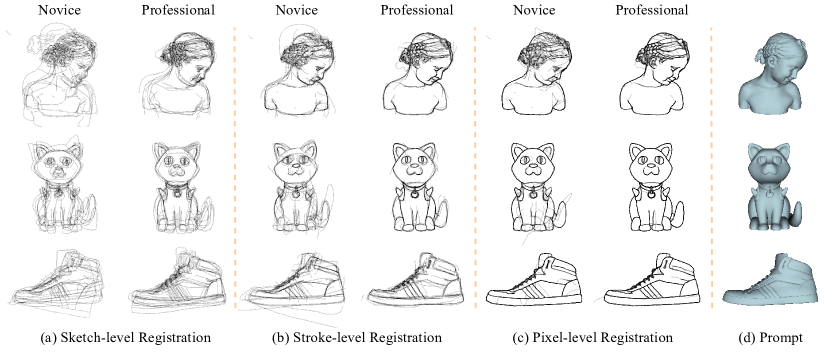
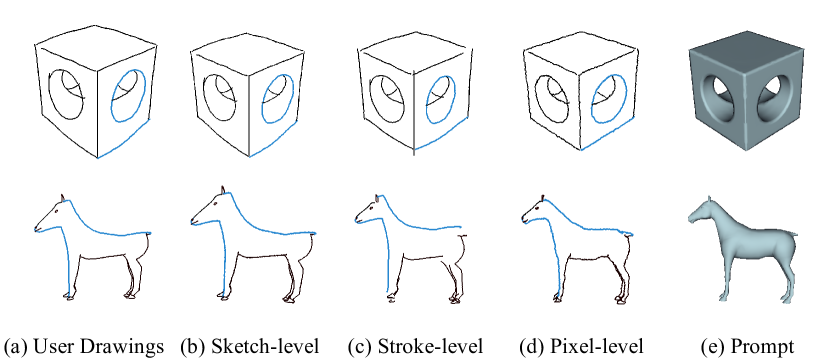
We provide a statistical analysis of the collected freehand sketches in both spatial and temporal perspectives, and within and across groups of users with similar levels of drawing skills. Following a three-level analysis, i.e., sketch-level analysis, stroke-level analysis, and pixel-level analysis (Figure 1), we show the characteristics of the collected sketches and compare their differences according to the drawing skills. Here we summarize our findings on the similarities and differences of freehand sketches depicted by professionals and novices. Spatially, we found that the two groups of users perceived and intended to draw the same content, while professional users depicted with more precise strokes in terms of intrinsic (shape and form) and extrinsic (scale, rotation, translation) attributes than the novices. Temporally, both groups of users tended to draw the representative regions before depicting the details. By comparing our collected sketches to widely adopted algorithm-generated drawings, we found that stroke-level registered sketches are potential good proxies for guiding such algorithms to generate freehand-like drawings.
Although it seems intuitive to conclude professionals draw better than novices, our analysis focuses on providing quantifiable proofs, benefiting various applications. We demonstrate how our collected sketches can be used for important applications such as freehand sketch synthesis, and a potential benchmark for sketch-based 3D reconstruction. With additional annotations, our collected data can further serve as new benchmarks for other sketch understanding tasks such as multi-view sketch correspondence prediction (Yu et al., 2020) and semantic segmentation (Yang et al., 2021). We hope these analysis and insights brought by our new dataset will inspire the design of future sketch-based systems for users with various drawing skills. We will make the dataset and the code for the synthesis method available to the research community upon the acceptance of this paper.
In summary, this paper makes the following contributions:
-
•
A new moderately large dataset of 3,620 sketches of 362 multi-view reference images rendered from 3D models by 70 novice and 38 professional users;
-
•
Quantitative comparisons between novice and professional drawings to illustrate the similarities and differences for inspiring the design of sketch-based interfaces and line drawing algorithms;
-
•
Two applications enabled by our dataset: 1) a novel freehand-style sketch synthesis method; 2) a potential benchmark for sketch-based 3D reconstruction.
2. Related Work
In this section, we will mainly focus on discussing the existing sketch collection studies. We will also briefly introduce the extensive efforts towards algorithm-generated line drawings and discuss how existing works for learning-based 3D understanding of sketches are trained and evaluated. Previous works study how people draw differently from the perspectives of perception and cognition. For instance, (Cohen and Bennett, 1997; Calabrese and Marucci, 2006) investigated the differences in drawings produced by people with various levels of expertise, and such methods evaluated the resulting drawings by letting graders rank them with respect to given aspects. These methods provided an empirical analysis of the differences of such drawings, while did not employ absolute measurements. To study the differences of drawings from the perspective of elemental components, several methods, e.g., (Matthews and Adams, 2008; Schmidt et al., 2009), asked their participants to depict specific primitive shapes and analyzed the depiction differences in stroke level. Tchalenko et al. (2009) further investigated the drawing differences by requesting participants to copy a long-simple-line artwork and analyzed the differences in stroke level. Such analysis-by-collecting methods only provided participants limited targets of drawing, and the accuracy analyses were conducted in stroke level only. Different to the above mentioned methods, we collected a relative large-scale sketches given 3D models of diverse categories and conducted more comprehensive qualitative and quantitative analysis on them to benefit applications.
| Granularity | Dataset | User | Temporal | Register | Prompt | Repetition | Quantity | Category | View |
| Symbolic | QuickDraw (Ha and Eck, 2017) | N/A | ✓ | ✗ | 345 | 75k | 25.9M | 345 | S |
| SlowSketch (Bhunia et al., 2020) | N/A | ✓ | ✗ | 20 | 84-96 | 1,702 | 20 | S | |
| TU-Berlin (Eitz et al., 2012a) | N/A | ✓ | ✗ | 250 | 80 | 20k | 250 | S | |
| Object-level | Sketchy (Sangkloy et al., 2016) | N/A | ✓ | ✗ | 12,500 | 6 | 75,471 | 125 | S |
| FG-SBIR (Yu et al., 2016) | N/A | ✗ | ✗ | 1,432 | 1 | 1,432 | 2 | S | |
| FG-SBSR (Qi et al., 2021) | N/A | ✗ | ✗ | 4,680 | 1 | 4,680 | 2 | M | |
| ShapeNet-Sketch (Zhang et al., 2021) | N/A | ✗ | ✗ | 1,300 | 1 | 1,300 | 13 | S | |
| ProSketch-3DChair (Zhong et al., 2020b) | P | ✗ | ✗ | 1,500 | 1 | 1,500 | 1 | M | |
| Stroke-level | Princeton (Cole et al., 2008) | P | ✗ | ✓ | 48 | 1-11 | 208 | N/A | M |
| OpenSketch (Gryaditskaya et al., 2019) | P | ✓ | ✓ | 24 | 12-30 | 357 | N/A | M | |
| SpeedTracer (Wang et al., 2021) | P | ✓ | ✓ | 70 | 3-5 | 288 | N/A | S | |
| DifferSketching (Ours) | P+N | ✓ | ✓ | 362 | 10 | 3,620 | 9 | M |
Algorithm-generated Line Drawings.
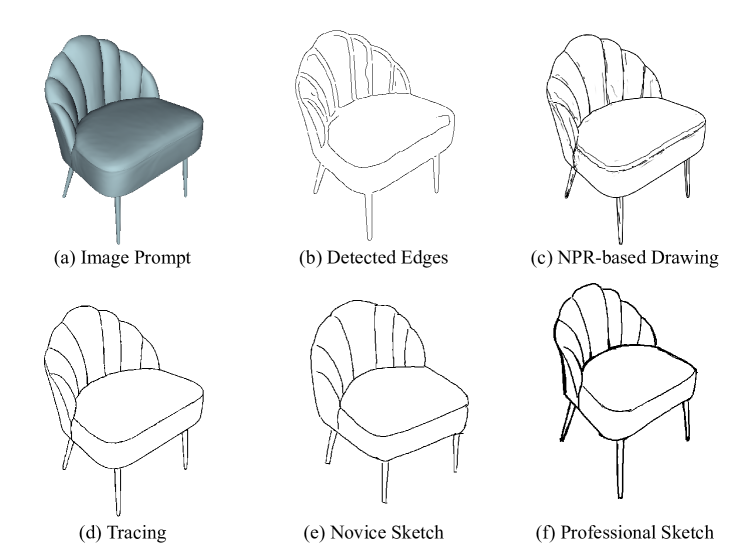
How to generate aesthetically pleasing line drawings from images (e.g., (Canny, 1986; Bertasius et al., 2015; Shen et al., 2015; Liu et al., 2017)) and 3D models ((DeCarlo et al., 2003; Ohtake et al., 2004; Judd et al., 2007; Liu et al., 2020) has been a long-standing research interest in the community of non-photorealistic rendering. Existing solutions for this task are already able to produce line drawings that are visually pleasing and well aligned with source images or 3D models. They can thus be directly adopted for generating large-scale datasets of pairs of line drawings and images/models, benefiting supervised training of various deep learning-based sketch understanding or sketch-based image/shape generation networks (Isola et al., 2017; Chen et al., 2020; Lun et al., 2017; Li et al., 2017a). However, as seen from Figure 2, since these algorithms aim to generate line drawings to strictly resemble the geometry features of source images or models, the resulting drawings (in (b) and (c)) are visually different from freehand sketches (in (e) and (f)), especially those by novice users. In fact, freehand sketches often exhibit various levels of abstraction and deformation. This explains why the networks trained on synthesized line drawings often generalize poorly to freehand drawings. Evaluations on synthesized line drawings also could not fully reflect the ability of the trained networks to handle freehand sketches. In recent years, a few techniques (e.g., (Bhunia et al., 2020; Ha and Eck, 2017; Li et al., 2017b)) have also been proposed to synthesize freehand-like sketches. Our collected dataset of paired sketches and tracing can potentially help design more effective sketch synthesis solutions.
Freehand Sketch Datasets.
The gap between algorithm-generated line drawings and freehand sketches motivated researchers to collect freehand sketches for various tasks such as sketch cleanup (Yan et al., 2020) and portrait sketching (Berger et al., 2013). Table 1 summarizes the differences between our DifferSketching and the existing, closely related sketch datasets from various perspectives. These datasets can be roughly categorized into three groups in terms of granularity levels: symbolic, object-level, and stroke-level.
A sketch dataset under the symbolic group contains sketches describing objects at the category level, and without reference images. Since such sketches are relatively easy to collect, their dataset scale can be very large. Representative datasets under this category include TU-Berlin (Eitz et al., 2012a) and QuickDraw (Ha and Eck, 2017), which contain thousands or even millions of freehand sketches, collected according to categorical text references via crowd-sourcing platforms or online games. The resulting drawings are usually highly abstract and only provide symbolic representations of the concerned object categories, instead of individual object instances. They are thus suitable for category-level sketch understanding tasks such as sketch classification (Yu et al., 2015; Li et al., 2020) and category-level sketch-based content retrieval (Eitz et al., 2012b).
Object-level sketch datasets (e.g., Sketchy (Sangkloy et al., 2016), ShapeNet-Sketch (Zhang et al., 2021)) contain sketches depicting specific object instances as a whole. This category of sketches has been demonstrated to be useful for various applications such as fine-grained sketch-based image retrieval (FG-SBIR) and sketch-based 3D modeling. To collect such sketches, objects in photos (Sangkloy et al., 2016; Yu et al., 2016) or rendered images of 3D models (Zhong et al., 2020b; Zhang et al., 2021; Qi et al., 2021) are used as prompts, instead of using categorical text references. Such datasets are generally more time-consuming to collect than symbolic sketches, since more strokes are needed to distinguish individual object instances from others. This explains why the scale of object-level sketch datasets is usually not as big as that of symbolic sketch datasets. From Table 1, it can also be seen that the number of times for each prompt drawn by different participants is very small given a large number of prompt numbers. Due to the low repetition of drawing and the lack of fine-grained correspondence between individual sketches and their corresponding objects, such datasets are not suitable for in-depth analysis of drawing characteristics.
Sketches in stroke-level datasets have their strokes registered with corresponding prompts and such datasets are thus collected and analyzed to understand how people draw objects. The seminal work by Cole et al. (2008) invited artists to draw a dozen 3D models under 2 views and 2 lighting conditions. Gryaditskaya et al. (2019) collected OpenSketch through a more challenging task by asking professional designers to draw 3D CAD models in new perspective views given their orthographic views. Wang et al. (2021) followed a data collection process similar to Cole et al.’s but focused on understanding the differences and similarities between tracings and freehand drawings. Our dataset falls into this group. Our data collection and analysis methods are largely inspired by (Wang et al., 2021; Cole et al., 2008). The key differences between our dataset and the above ones are: 1) while the existing datasets contain drawings by professional users only, our dataset consists of carefully registered sketches drawn by both professional and novice users, allowing us to analyze how differently these two groups of users draw 3D objects. 2) Our dataset covers a significantly larger set of 3D models from nine categories and is an order of magnitude larger than the existing ones.
Learning-based 3D Understanding of Sketches.
Previous works often utilize algorithm-generated line drawings to train and evaluate deep neural networks for various sketch understanding tasks (e.g., (Delanoy et al., 2018; Lun et al., 2017; Su et al., 2018; Isola et al., 2017)). One group of such methods (e.g., (Li et al., 2017a; Lun et al., 2017; Su et al., 2018)) predict shapes or intermediates from input line drawings with strict correspondence. In other words, such methods treat the inputs as hard constraints and generate shapes strictly corresponding to the inputs. Another group of methods adopt indirect reconstruction strategies: they generate shapes by deforming or refining intermediate shape proxies (Du et al., 2020; Zhang et al., 2021; Han et al., 2017; Guillard et al., 2021) to better approximate the geometric features contained in the input drawings. As mentioned earlier, the algorithm-generated line drawings strictly resemble the geometry features of source images or models. Training networks on the dataset of such line drawings makes the trained networks perform well on algorithm-generated line drawings. Generally, the larger deviation between testing sketches and algorithm-generated line drawings, the worse performance the trained networks have. Our collected drawings together with the corresponding line drawings can serve as testing data with different levels of difficulties for challenging the trained networks. We show an application of sketch synthesis and believe our dataset as well as our findings through data analysis might provide inspirations for designing new algorithms for synthesizing line drawings with similar natures to the sketches drawn by novice and professional users. Such synthesized sketches would help train the networks to have a better generalization ability for freehand sketches. Similar to our intention, Schmidt et al. (2009) explored the errors when making foreshortend projections of 3D curves for expert users in a qualitative perceptual study. We adopt the same strategy of comparing freehand drawings to the accurate references both qualitatively and quantitatively between the novices and the professionals, providing comparisons in more perspectives.
3. Data Collection
3.1. Reference Prompting
As discussed in Section 1, it seems there is no perfect sketch collection approach that exactly reflects how a user draws a desired 3D model in one’s mind during the ideation stage and meanwhile enables the stroke-level analysis of sketches by different users for the same objects. To facilitate applications requiring precise geometric correspondences between sketches and prompts, we adopt an observational drawing setup, following the approach in (Cole et al., 2008). Specifically, we provided participants with visual images rendered from 3D models under selected views as prompts and asked participants to depict the key shape details as much as possible, i.e., participants should make sure their final drawings contain enough shape information to represent given 3D models. To provide participants with clear targets to collect stroke-level sketches, we kept the prompt images visible during the drawing process, without trying to use noise maps to blur the perceptions of the targets (Sangkloy et al., 2016). Note that the prompt images are not traceable when collecting freehand drawings.
| Category | Animal | Animal Head | Chair | Human Face | Industrial Component | Lamp | Primitive | Shoe | Vehicle |
|---|---|---|---|---|---|---|---|---|---|
| Models | 10 | 20 | 20 | 6 | 14 | 13 | 10 | 20 | 15 |
| Views | 3 | 3 | 3 | 3 | 2-3 | 2-3 | 1-3 | 3 | 3 |
| References | 30 | 60 | 60 | 18 | 35 | 34 | 20 | 60 | 45 |
| Freehand Sketches | 300 | 600 | 600 | 180 | 350 | 340 | 200 | 600 | 450 |
We chose 136 3D models from 9 categories (Table 2). We covered the object categories (e.g., Chair, Vehicle) that were commonly used in existing sketch-based 3D modeling or shape reconstruction works (Zhang et al., 2021; Guillard et al., 2021) so that our collected sketches can be easily used for testing the performance of these works. For each category, we included models covering rich geometric shape variations as well as models used in the existing stroke-level sketch datasets (Cole et al., 2008; Wang et al., 2021). Each model was rendered under 2 or 3 representative viewpoints (except for the sphere model with 1 viewpoint in the Primitive category) in perspective projection, leading to in total 362 prompt reference images. For categories with consistent semantic parts (e.g., Chair, Vehicle), we first normalized their scales, aligned their semantics to the same axes, and then chose canonical views (front- and side-view), while for categories with free forms of shapes, i.e., those without similar structures (e.g., Industrial Components, Primitives), we chose other representative views. We generated the prompt images using trimesh2 library. The models were rendered using a diffuse cyan material under the Phong shader. For the categories (e.g. Chair, Vehicle, Animal Head) containing samples with axis-aligned models sharing similar structures, we rendered the representative views using the same viewpoint settings. In contrast, for those with large variations (like Industrial Component), we manually select the views using a simple interactive interface for camera manipulation. More details for the reference prompt images can be found in Table 2.
3.2. Sketching Constraints
Since we would like participants to capture the shape information, we requested participants to only depict the shape details and ignore the lighting/shading effects presented in the reference prompts. We did not set an exact time limit for each prompt while suggested each participant to limit the time for making each drawing within 10 minutes. We first gave the overall perception of each target model that participants were going to depict by showing an overall 3D view of the target using 3D viewing software. Then we asked participants to draw the rendered version of the 3D model with line drawings to capture the geometric details at their best.
To ensure the sketching quality and eliminate the variances caused by different drawing tools, we did not collect our dataset via online crowdsouring platforms, as done in (Eitz et al., 2012a). Instead, we invited the participants to our laboratory and asked them to make drawings on the same drawing device we provided. Our data collection was conducted in individual sessions, each of which lasted around 1 hour. To ensure the consistency of multi-view sketches from the same participants, each participant was required to draw all the assigned reference images during the session, though they might take optional short breaks. Each participant in one session was compensated with a cash coupon.
3.3. User Interface and Device
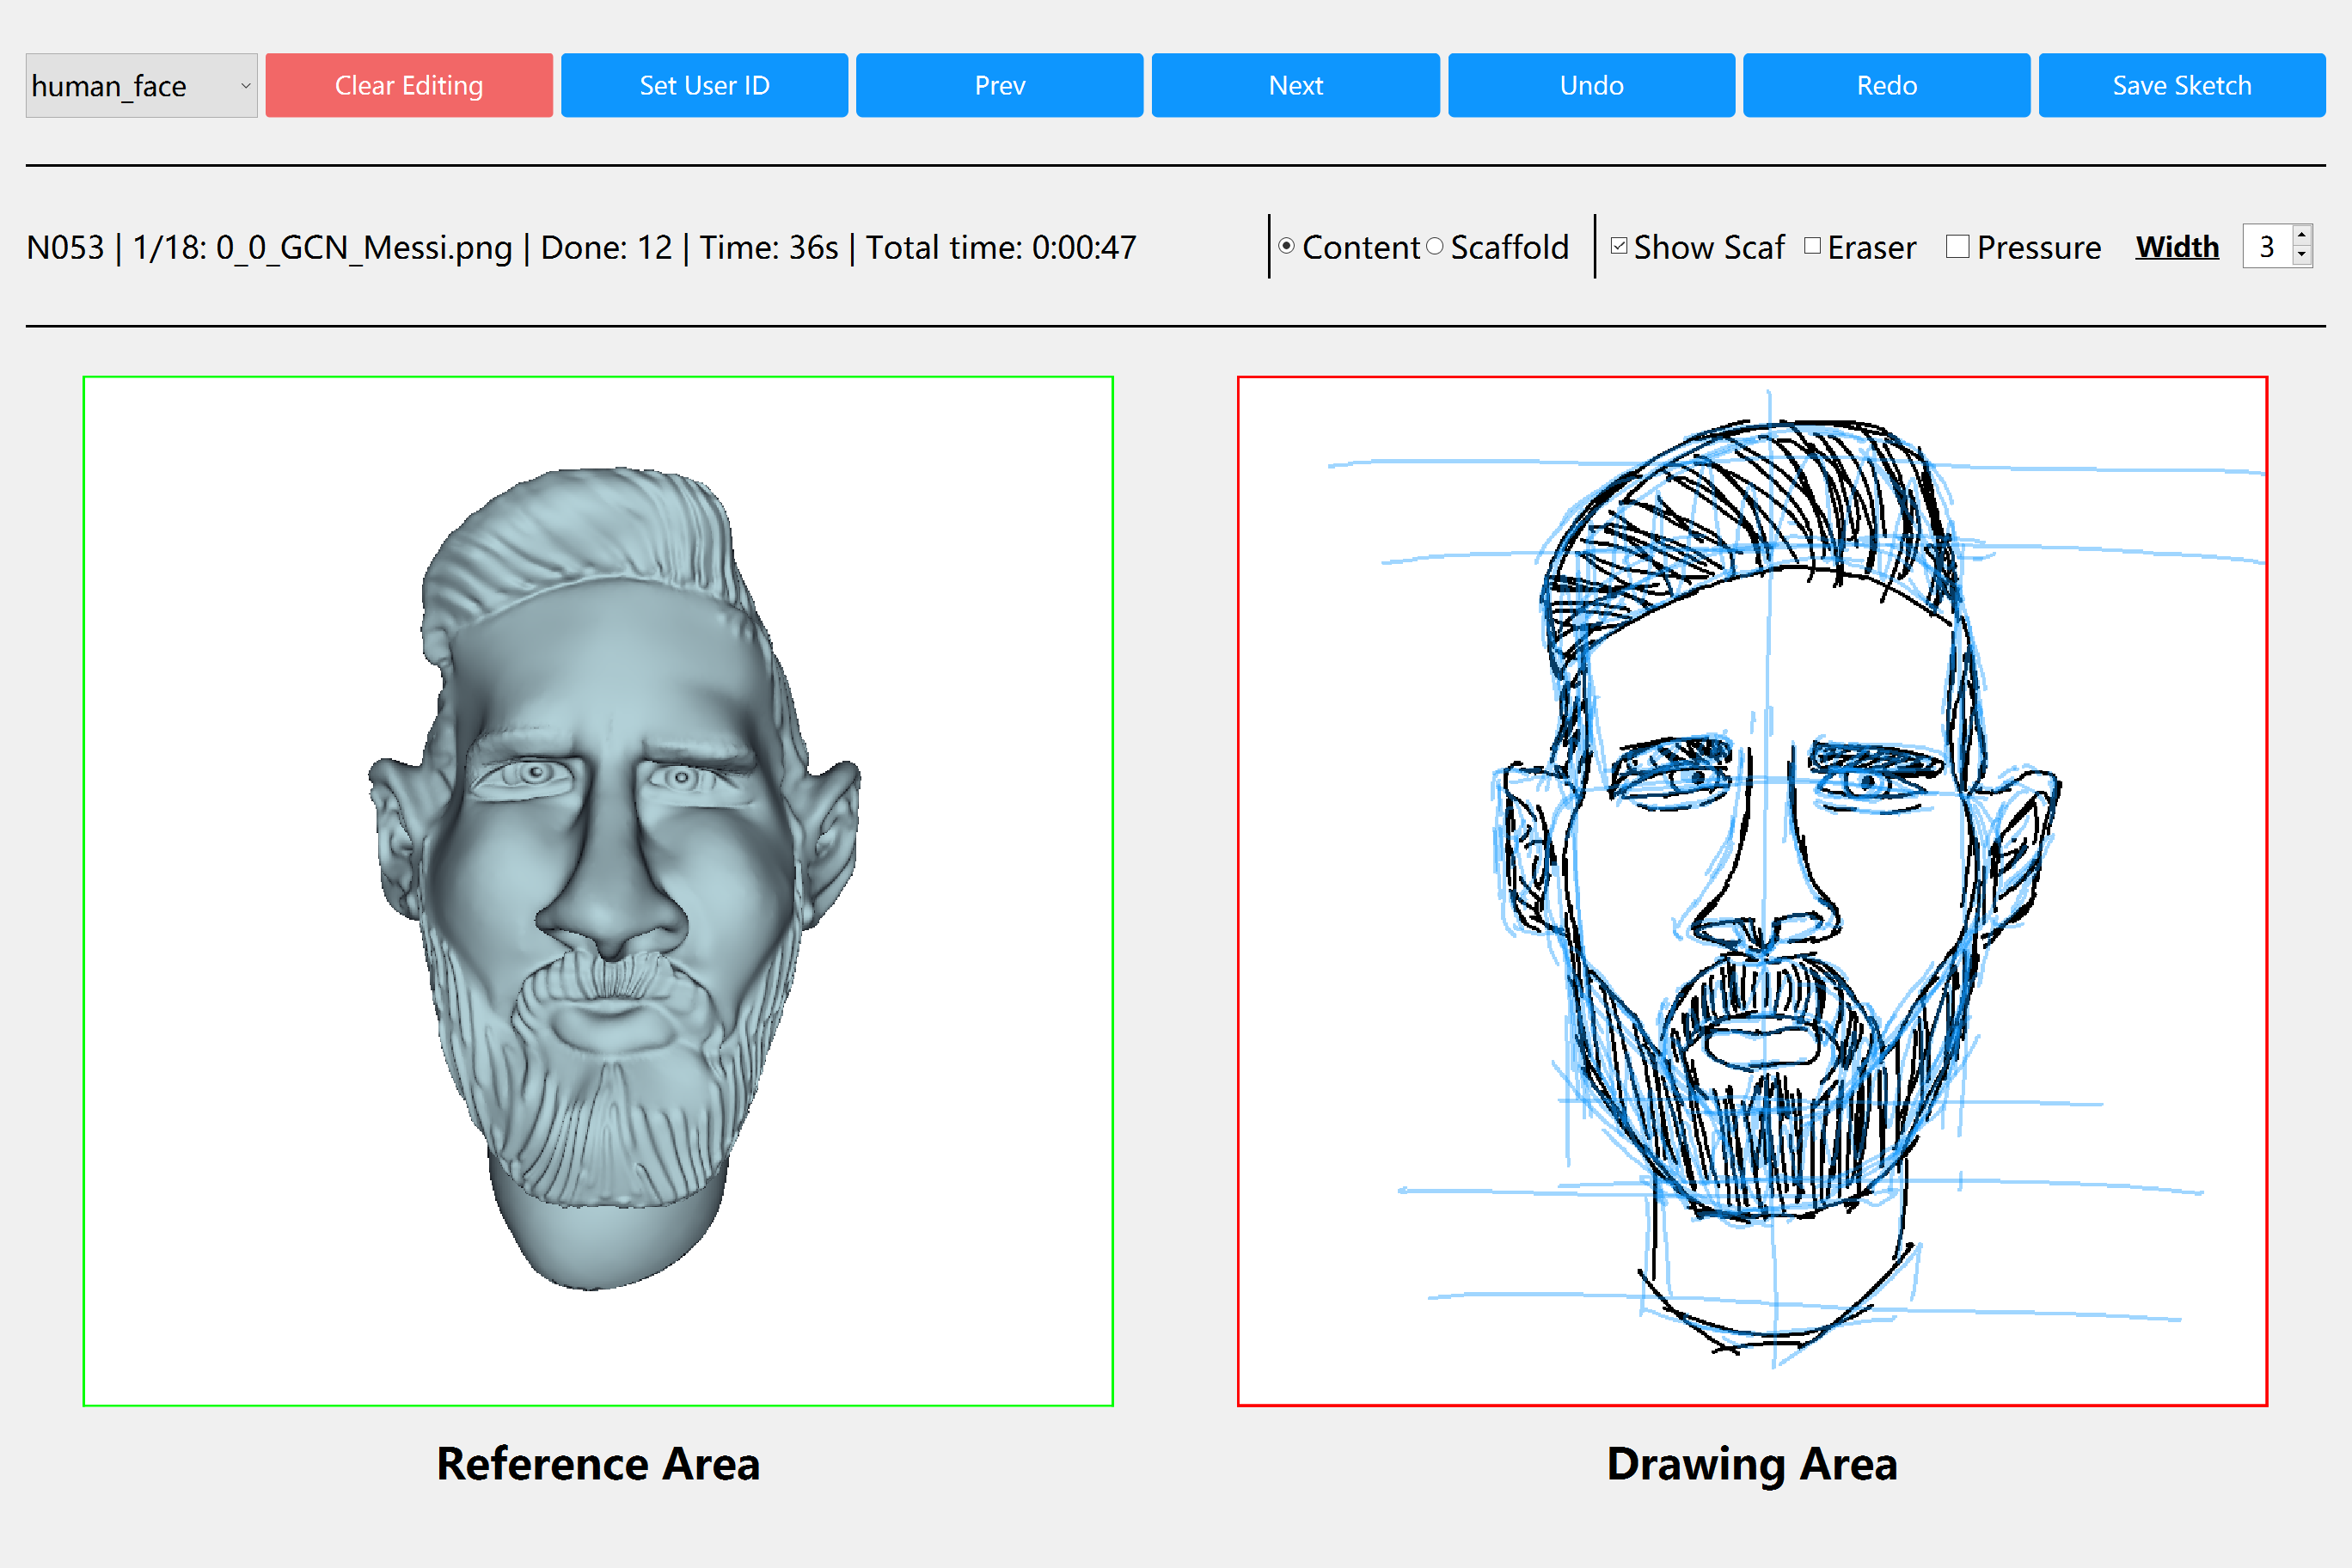
We developed a simple user interface for data collection, as shown in Figure 3. We showed a prompt image on the left panel of the interface and users created a corresponding sketch on the drawing canvas on the right. To assist users in drawing proper proportions of the sketches, we implemented an optional scaffold drawing mode in our interface besides the content drawing mode. As shown in Figure 3, the scaffold lines (created in the same way as the content lines) were rendered in light blue and users could choose to hide/show the scaffolds while previewing/drawing the current sketch. Both the content strokes and the scaffolds were recorded in separate vector sequences to facilitate their independent analysis in the individual stroke level. Users could change the stroke weights for their depiction. Additionally, with digital settings, the stroke weights could also be anchored to the drawing pressure by checking the “Pressure” checkbox above the drawing canvas. Note that we recorded the pen pressure data regardless of whether the checkbox was checked. We also provided the undo/redo option and an eraser tool for modifying the currently drawn sketch. Our interface ran on Microsoft Surface Pro 4 with a Surface pen to mimic a paper-and-pencil setting for the convenience of drawing.
3.4. Participants
We recruited two groups of in total 108 users to participate in our data collection task. One group of 38 participants were experienced users with at least 5 years of professional drawing training/experience. Hereafter, we denote them as “professional users”. The other group containing 70 users with less than 1 year of drawing experience, we denote them as “novice users”. The professional users aged from 18 to 38 and most of them were art school or design school students.
Compared to the professional group, the novice group had a more diverse background. The age range of the novice group was 18 to 46, and apart from the school students, the novice users also had more working experiences. Each professional user drew 3-188 sketches (47.63 on average), and each novice user drew 3-137 sketches (25.86 on average). Among all the participants, only two (one professional and one novice) were reported as left-hand dominant. All the other users were right-hand dominant. The demographic summary of the participants can be found in Table 3.
| Professional | Novice | |
|---|---|---|
| Gender | F: 28; M: 10 | F: 44; M: 26 |
| Age | 18-38 (26.61) | 18-46 (25.09) |
| # Drawings | 3-188 (47.63) | 3-137 (25.86) |
| # Sessions | 1-16 (4.47) | 1-9 (1.99) |
3.5. Dataset
After excluding the badly drawn sketches (in total 123 drawings almost without correspondences with the prompting shapes), we made up for the removed sketches from more users and finally got a dataset containing 3,620 freehand sketches with the resolution of . Each prompt image was drawn 10 times: 5 times by professional users and 5 times by novices. We got a sketch dataset containing samples from balanced skilled users. Apart from the shape information recorded, we also collected the time information in the stroke level, as well as the drawing pressure for each stroke. As discussed in (Wang et al., 2021), tracings provide precise representations of the shape information. We thus recruited another group of three users for tracing line drawings over the image prompts, resulting in a dataset containing 362 tracings for all the registration in the analysis stage. Each tracing was confirmed by presenting the resulting tracings to at least two users to avoid bias in our collection. When a user disagreed with a specific depiction, he/she directly modified the tracing and passed the modified tracing to additional users to check until no modification was needed, i.e., whether all the shape information of prompts was depicted in the tracings. Please find the thumbnails of the collected sketches as well as the corresponding prompts in the supplemental material.
4. Multi-level Registration
In this section, we first present our pixel-level registration method for our collected dataset and then introduce how to construct multi-level registration for analysis on entire sketches, strokes, and pixels.
4.1. Pixel-level Registration
To spatially analyze the individual sketches, the first step is to find the correspondence between the freehand sketches and their prompts. In our study, we resort to the sketch registration to find such correspondences. We treat the corresponding tracing (covering all of the shape details) as an accurate shape representation of each prompt image, as validated by (Wang et al., 2021). Thus, for each prompt, we can register the ten freehand sketches to align with the prompt by maximizing the correlation between the sketch and the corresponding tracing.
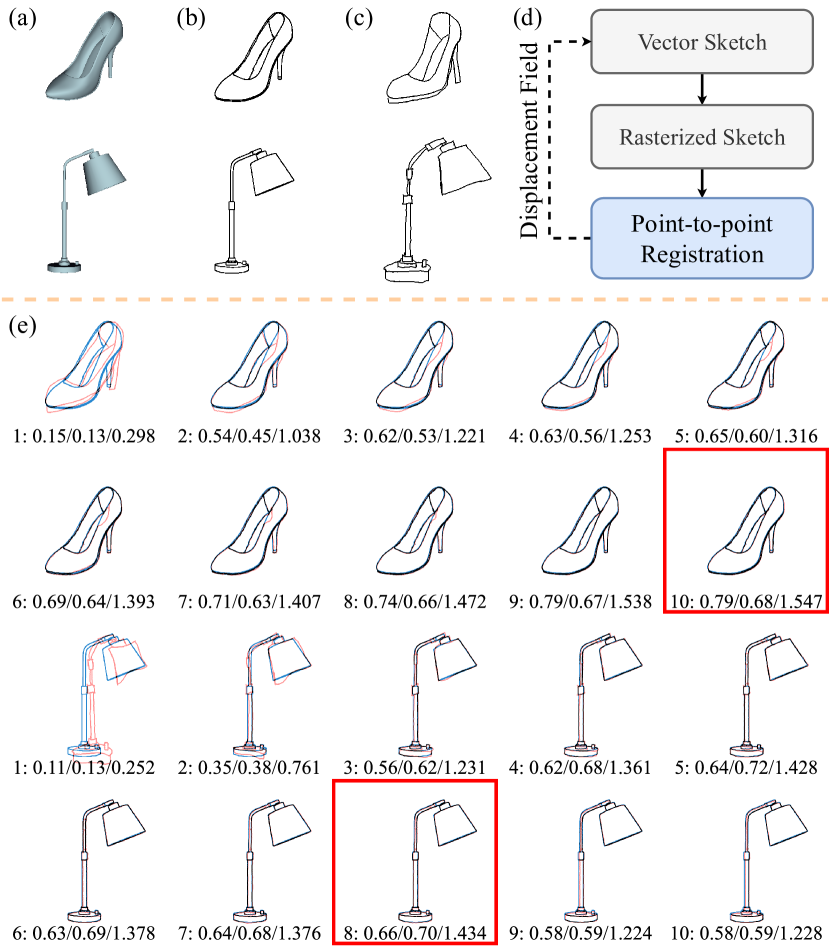
Wang et al. (2021) adopted a point-to-point optimization-based registration method based on SimpleITK (Yaniv et al., 2018) to register sketches to tracings. Although it works generally well on the sketches including texture and shading lines, it is not a good fit for our collected sketches with sparse lines (only shape information). Specifically, the point-to-point registration might ignore the point order within strokes, making the vector sketches fail to align with the targets (i.e., the tracings), as shown in the top-left of each group in Figure 4 (e). Unlike the previous works (Cole et al., 2008; Wang et al., 2021), which mainly study where people draw given the shape prompts in a single level (i.e., at the pixel level), we investigate the drawings in a multi-level manner (Section 4.2), and thus need to maintain the order of points in a stroke intact in the analysis.
To address the problem, we adopt an iterative rasterize-and-optimize process extended from the point-to-point registration method used in (Wang et al., 2021). See Figure 4 (d) for an illustration. Since the point-to-point registration easily stagnates when there are only minor differences between the input and target due to the sparsity of sketches (as shown in the 4th and 5th iteration results of the shoes in Figure 4 (e)), we dynamically increase line width for re-rasterizing the vector data to gradually enlarge the registered difference. At the initial pass, the point-to-point registration between the rasterized vector sketch (represented as a binary image) and the corresponding tracing produces a displacement field at full resolution (), by which we update the positions for the points of the original vector sketch. Then we re-rasterize the new vector sequences and feed the newly rasterized image to the optimization process to predict a new displacement map. Using this iterative process, we get the well-registered vector sketches.
In our implementation, to handle drawings of different complexity levels, we run ten iterations of the above process in total (which is empirically enough to accurately align the vector sketches to the tracings). Then, we adopt the precision and recall to automatically pick the optimal registered result corresponding to the -th iteration, and to avoid over-registration where different shape lines are merged together. Specifically, it is formulated as follows:
| (1) |
| (2) |
where and are respectively the numbers of filled pixels in the registered result and the tracing, while is the number of the overlapping pixels between them. For dynamic line width, we set for the first five iterations, and for the last five ones. Empirically, we set as . Figure 4 (e) shows the progressive registration results rasterized from the vector data by our method, where the first-iteration (top-left) results are equal to those generated by Wang et al.’s method. Since this way actually registers the sketches point-by-point, we denote it as pixel-level registration. Please find more details and examples of pixel-level registration in Section 2 of Supplement.
4.2. Multi-level Scheme
Prior works (Cole et al., 2008; Wang et al., 2021) study human drawings registered in the pixel level only. Although the pixel-level registration (Figure 5 (d)) is sufficient to investigate where people draw the content, it generally washes away the drawing characteristics of sketches in the stroke or sketch level, thus hindering research aiming at exploring how people draw the content and their performance variations, in the sketch and stroke levels. As shown in Figure 5 (a) and (d), some strokes (in blue) lose their original geometry after pixel-level registration, e.g., the curvature changes in lines, the ellipse radii difference, the ellipse perspective variation, etc. This is mainly because the highly nonlinear deformation induced by pixel-level registration factors out shape variations in freehand sketches.
To preserve the sketch-level and stroke-level shape from users, we use two additional registration schemes. We estimate a similarity transformation (i.e., involving a rigid transformation and uniforming scaling) over the whole sketch or an individual stroke, respectively. Given the pixel-level registered results and the original vector data, we have two matched point sets ( and ) to be fitted by an optimal similarity transformation. This can be formulated as the following minimization problem:
| (3) |
where indicates a matrix containing rotation and uniform scaling factors, and denotes a translation matrix. For sketch-level registration, we solve Equation 3 by setting and containing all the respective points in the original drawing and the corresponding pixel-level registered result for each sample, while for stroke-level registration, we process strokes individually by setting and in each stroke for one drawing. After the application of the transformation matrix to each drawing, we get the multi-level registered sketches for the subsequent analysis. As shown in Figure 5, a sketch-level transformation is the best to globally preserve user-drawn geometry and the pixel-level registration aligns the drawings almost perfectly fitting to the target shapes (prompts), while stroke-level registration is a compromise between them.
5. Data Analysis
In this section, we provide the statistics and comparisons between the drawings by novice users and professional users from both spatial and temporal aspects. We also conducted an analysis on the similarity between the synthetic drawings and the freehand sketches, hoping to provide more inspirations for further design of drawing-generation methods.
5.1. What Content Do People Draw?
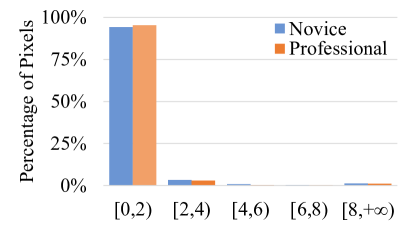
Following the previous work (Cole et al., 2008), we first investigate the common content drawn by novice and professional users upon pixel-level geometry, i.e. rasterizing the registered vector sketches using one pixel-wide strokes. Note that we only compute the valid drawings that can be correctly registered to the target, i.e., ¿1.2 (Eq. 1). To compare the individual drawings (after pixel-level registration) from the two groups, for each pixel in each drawing from the novice group, we find the closest pixels in all of the drawings from the professional group for the same prompt and compute their distance in pixel, and vice versa (i.e., from the drawings in the professional group to the drawings in the novice group). We plot histograms of the pixel-wise distances across all the categories respectively for the two groups. As shown in Figure 6 (a), the two histograms are similar to each other. We also visualize common contents from the two groups by superimposing the registered results (Figure 1 (c)). It reflects that for individual drawings, not only professional users drew similar contents among themselves (Cole et al., 2008), but also novice users drew contents which professional users tend to draw.
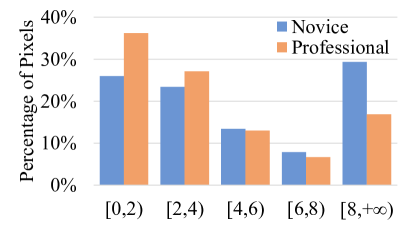
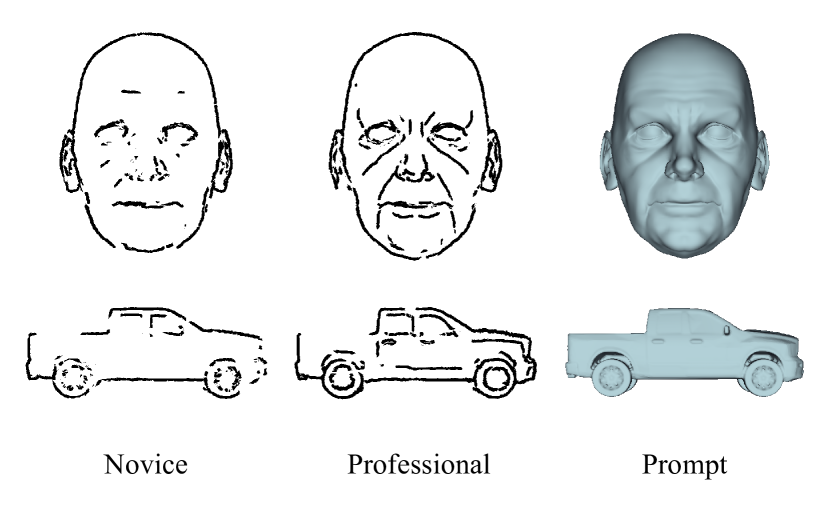
To find out how consistently the two groups drew the contents, inspired by (Wang et al., 2021), we extracted a binary commonly drawn region (CDR) drawn by all the users in each group. Similarly, we obtained a distribution of pixel-wise distances between CDR pixels for the novice and professional groups. The main gap between the two groups falls into the categories containing detailed contents, e.g., Human Face, Vehicle, and Shoes. Professional users have higher consistency in drawing detailed parts of 3D models than novices, though the two groups would commonly draw general shapes of objects, including obvious silhouettes and occluding contours, as shown in Figure 6 (c). The tendency is also reflected in the basic statistical analysis (see the differences of stroke count and path length in Section 3.1 of Supplement).
Conclusion: Both the novice and professional users perceived almost the same shape features from 3D models, but the professional users tended to draw more details given more complicated 3D models.
5.2. Where Does Key Difference Occur When Sketching?
Although novice and professional users would draw similar contents existing in 3D objects, where does the key difference occur? To understand how differently they sketch a given prompt, we analyze the errors between their original drawings and the prompts from three aspects (sketch-level, stroke-level, and pixel-level), with the help of multi-level registrations.
For qualitative comparisons, Figure 1 shows three groups of paired drawings by superimposing five drawings respectively from the novice and professional users for the same prompts after multi-level registrations. We found that sketch-level registered drawings by professionals were already very close to the 3D shapes both globally and locally. In contrast, those by novices are messy in local parts, though their main structures can still be recognized to be the prompting categories. It indicates that novice users could not maintain well part-by-part ratios among each other following the prompts. Compared between the next two levels (Figure 1 (b) and (c)), there is a larger improvement existing in the novice drawings from stroke-level to pixel-level registration. It means that unlike professional drawings, novice drawings require more nonlinear transformations for each stroke to change the original geometry drawn by novice users to match the targets. We will show quantitative comparisons below to support these findings. Note that for the sketch-level comparison, we only count the valid drawings like Sec. 5.1, while for the stroke-level and pixel-level ones, we only count the valid strokes that can be correctly registered to the tracings, i.e., the overlapping rate is higher than 80%.
From a sketch-level perspective, we explore how people organize their sketches globally by measuring the difference between the original drawings and the corresponding results after the sketch-level registration. We compute three histograms across all the categories for the novice and professional groups, respectively, including rotation angle (), translation distance (), scaling factor (), as shown in Figure 7 (a). Note that we compute the sketch-level translation to show the users’ habit of placing a drawing relative to an object center, but not to reflect the geometry error. To observe the difference on organizing individual strokes, we also evaluated the relative transformation parameters (, , ) for each stroke between sketch-level and stroke-level registration, i.e. the local error relative to the global error. Similarly, we plotted three histograms on the strokes across all the drawings for the novice and professional groups (Figure 7 (b)). To further evaluate the difference of stroke geometry between the two groups, we measure the distance between stroke-level registered results and pixel-level registered results for each drawing point, i.e. pixel-level translation, since pixel-level registration can produce the results highly aligned with the prompts. Figure 6 (b) shows the histograms of the novice and professional drawings. Please find more comparisons in Section 3.2 of Supplement.
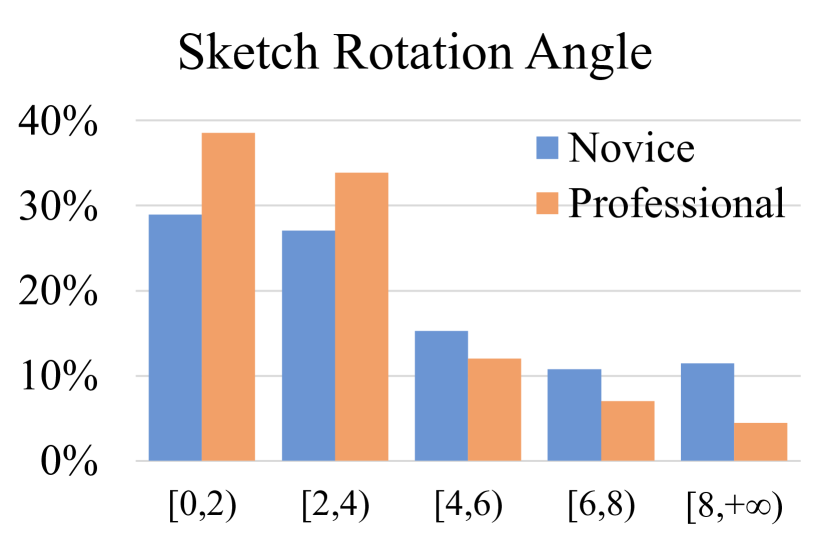
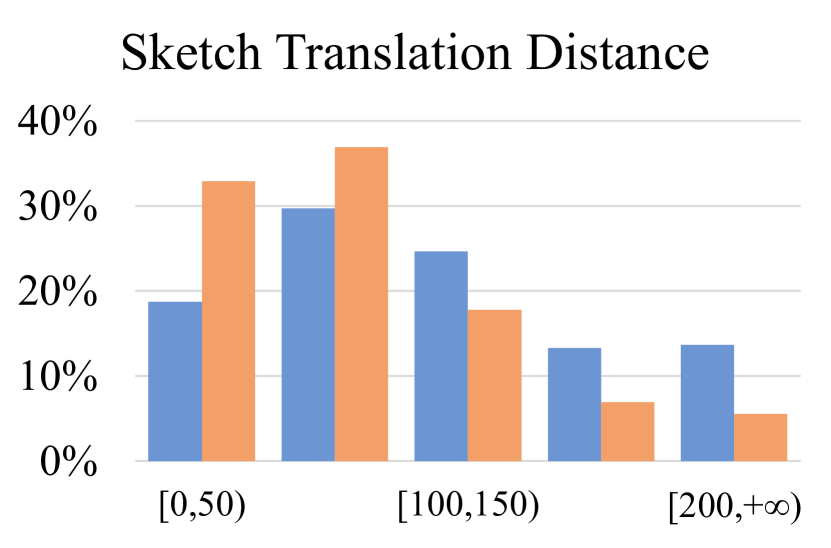
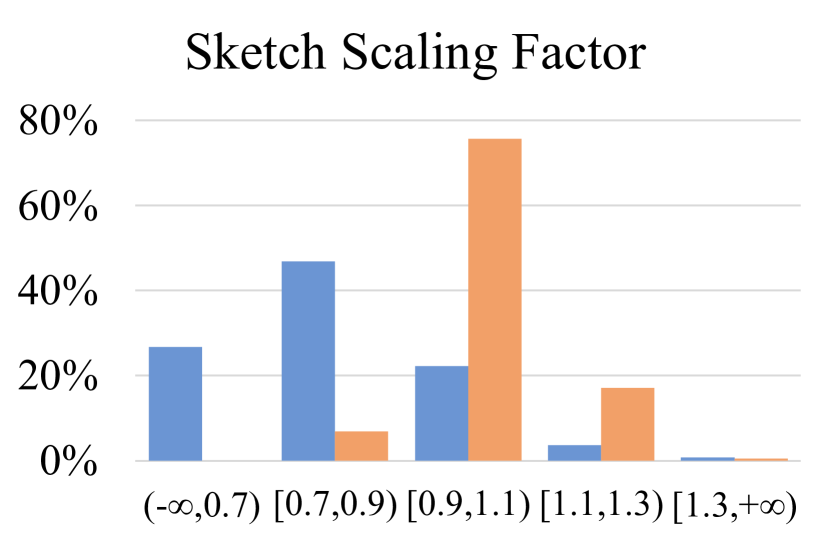
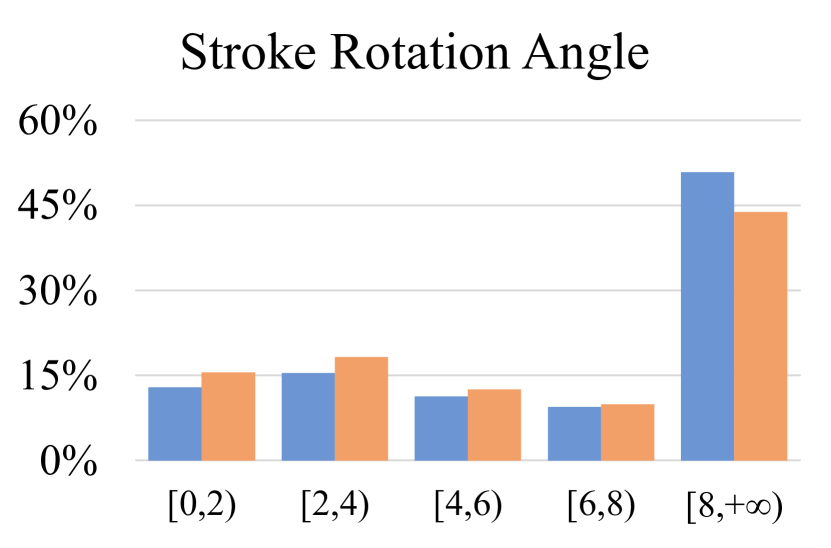
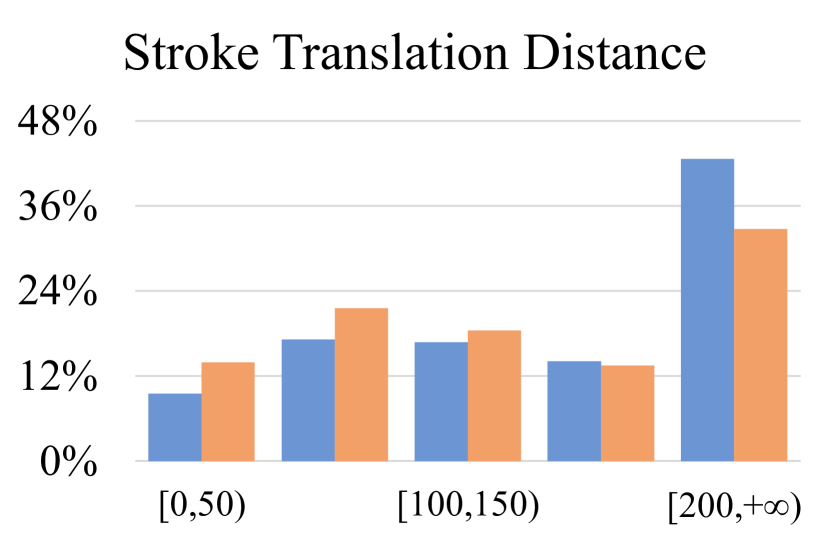
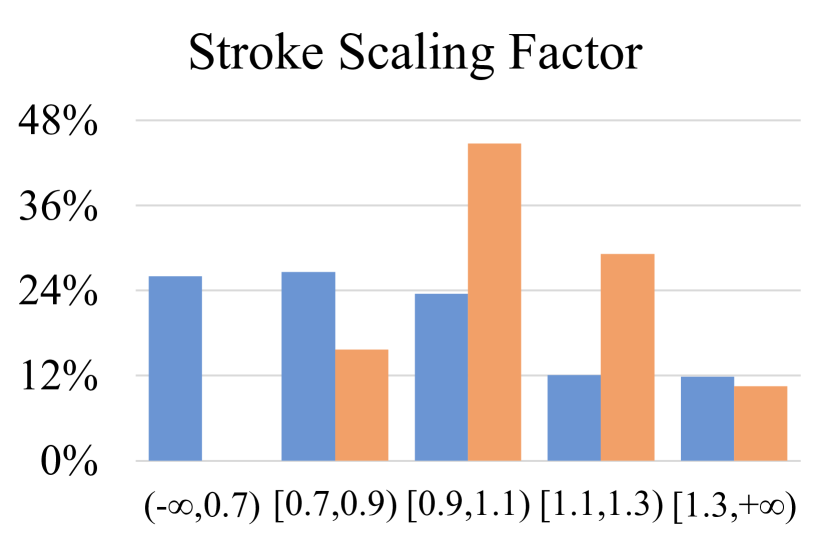
Conclusion: The novice and professional users had similar senses of understanding the global orientation of the prompting 3D models and tended to follow the geometry when sketching globally. The key difference between them is that the professional users performed significantly better on preserving the global layouts of the sketches as well as the extrinsic and intrinsic properties of the strokes, especially for scaling factors, to match with the prompts well.
5.3. Could Scaffold Lines Help Improve Sketches?
Gryaditskaya et al. (2019) show that the presence of scaffold lines has positive correlation with the accuracy of the professional sketches. Since we provided an option of scaffold drawing for users, we investigate whether scaffold lines could effectively help both novices and professionals improve their sketches and in which aspect the scaffold lines mainly contribute to. In our dataset, we found that more professional drawings (53.5%) were completed with the help of scaffold lines, compared to novice drawings (36.7%). Then, we evaluate the correlation between the accuracy of the two-group drawings and the usage of scaffold lines from global to local, i.e., sketch-level, stroke-level, and pixel-level.
For sketch-level and stroke-level, we utilize the respective transformation parameters (, , and , , ) (Section 5.2) to compute the drawing errors, including rotation error = ( indicating or ), translation error =, and scaling error =. For the pixel-level errors, we first compute the proportion of overlapping pixels between the stroke-level registered results and the corresponding tracings. Here, one stroke would be regarded as an incorrect drawing path if less than 50% its pixels are overlapped. We then evaluate the pixel-level inaccuracy of a drawing through the ratio of the incorrect strokes. We separately measure the above errors on the novice and professional drawings without and with the scaffold lines and conduct statistical tests using a linear mixed model (LMM) with the R-style formula, e.g., “ Condition + (1 — PromptID) + (1 — UserID)” for , to show the significance of the difference. Table 4 presents the average errors for the four conditions and the p-values of LMMs for the two groups. Please find more analysis in Section 3.3 of Supplement.
Conclusion: It is intuitive that scaffold lines effectively helped both the novice and professional users set up the global scale of the drawings as well as the local drawing paths (pixel-level) to approximate the prompt targets. It similarly provided useful guidance for the novices to place each stroke on its correct position, but contributed little on guiding orientation neither globally or locally. In addition, scaffolding worked less significantly for the professionals since their sufficient drawing skills could compensate the case without scaffold lines.
| Noivce | Professional | |||||
| Error | w/o | w/ | -value | w/o | w/ | -value |
| 5.14 | 4.68 | 0.02 | 3.58 | 3.22 | 0.006 | |
| 130.79 | 104.06 | ¡0.001 | 97.98 | 76.83 | ¡0.001 | |
| 0.18 | 0.14 | ¡0.001 | 0.12 | 0.09 | ¡0.001 | |
| 13.51 | 13.59 | 0.43 | 11.28 | 11.06 | 0.003 | |
| 242.01 | 245.80 | ¡0.001 | 199.04 | 196.63 | 0.004 | |
| 0.29 | 0.28 | 0.02 | 0.23 | 0.23 | 0.01 | |
| 0.41 | 0.36 | ¡0.001 | 0.31 | 0.27 | ¡0.001 | |
5.4. Do People Sketch 3D Shape Differently over Time?
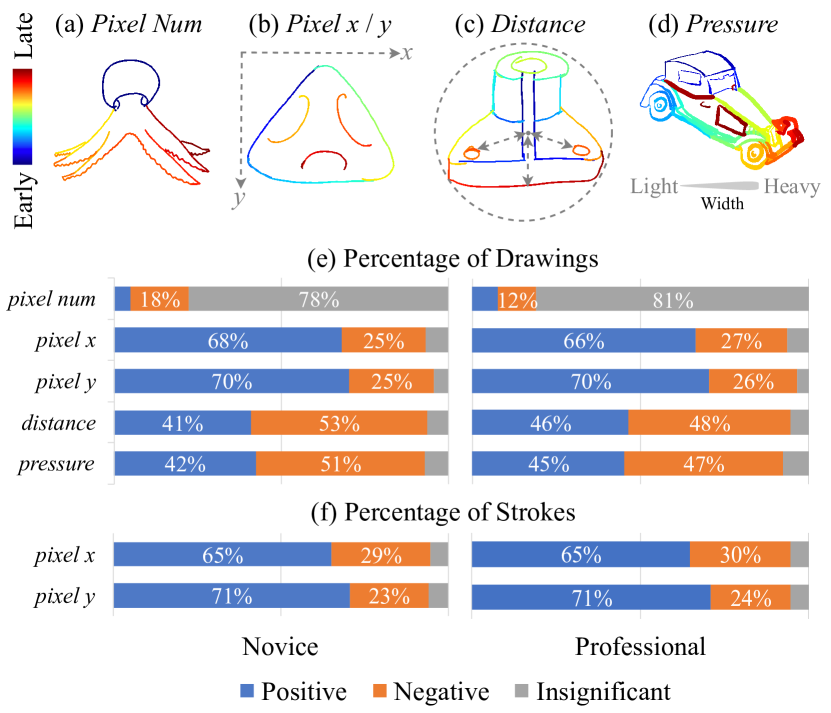
After evaluating the spatial differences between the two groups, now we evaluate their temporal differences. Similar to (Wang et al., 2021), we interpolated the timestamps for each pixel and assigned them into even temporal bins (25 bins) for each drawing. To observe the relationship between the number of human-drawn pixels and time, we computed Spearman correlation coefficient with a significance threshold ¡0.001 between them, respectively for the novice and professional groups (1,810 drawings in each group). We found in most of the drawings (more than 78%), the number of drawn pixel had no significant correlation with time. To study the relationship between spatial drawing location and time, we tested Spearman correlation coefficient on the pixel locations of raw user drawings over time, i.e., the coordinate and the distance to the drawing center. Figure 8 (a)-(d) present the examples with positive correlations between the features and time. Figure 8 (e) shows that both of the novices and professionals tended to draw pixels from left to right and from top to bottom on the canvas in most of the drawings (over 66%). Almost 50% of the drawings had positive or negative correlations between the distance to the center and time. It means that people tended to either draw from outside to inside or from inside to outside, depending on the structure of a target object. We further evaluated how people drew each stroke spatially over time, and found the similar tendency with the case they drew the whole sketches (Figure 8 (f)). It is natural that the right-handed users (99% in our user study) have such preferred drawing directions, as the stroke direction guideline documented by Fu et al. (2011). Please find more comparisons in Section 3.4 of Supplement.
To evaluate the difference of stroke ordering between novices and professionals, we examine the raw user drawings based on the ordering guidelines (Fu et al., 2011), including:
Simplicity. People first draw lines with simple shapes or smooth lines, and then more complex curves.
Proximity. People start the next stroke to the nearest element or the element along the trajectory they are following.
Collinearity. People follow the trajectory of interrupted lines for continuity.
Anchoring. People draw substrate strokes earlier than attachment strokes.
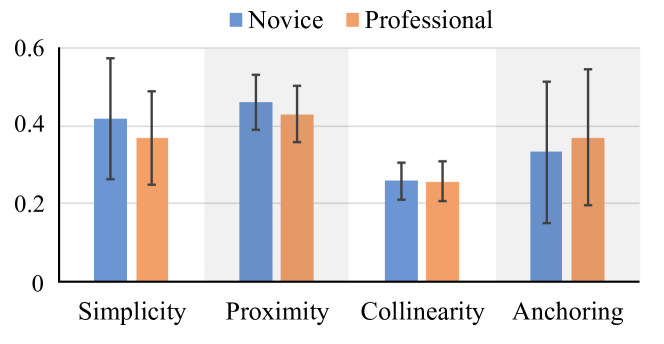
We computed the energy costs of the guidelines for each drawing, following Fu et al. (2011) (see the definition in Section 3.4 of our Supplement). Figure 9 shows the average cost of the human-drawn ordering over all the drawings from the novice or professional users for each of the above guidelines. It indicates that the professionals followed more on the simplicity and proximity guidelines than novices, while the novices followed more on the anchoring guideline. The two groups had similar ordering tendency on the collinearity. The -values of LMMs (as done in Section 5.3) between the two groups also show that there are significant differences (¡0.001) on the simplicity, proximity, and anchoring guidelines, but not on the collinearity (=0.006).
Conclusion: Both of the novice and professional users similarly tended to follow the drawing direction guideline, i.e., from left to right and from up to down over time. Also, the simplicity and proximity guidelines (Fu et al., 2011) provided more guidance for the professionals than the novices, while the anchoring guideline worked more for the novices.
5.5. How Similar are Freehand Drawings and Synthetic Sketches?
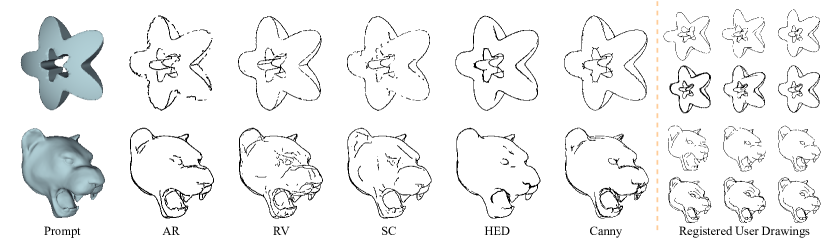
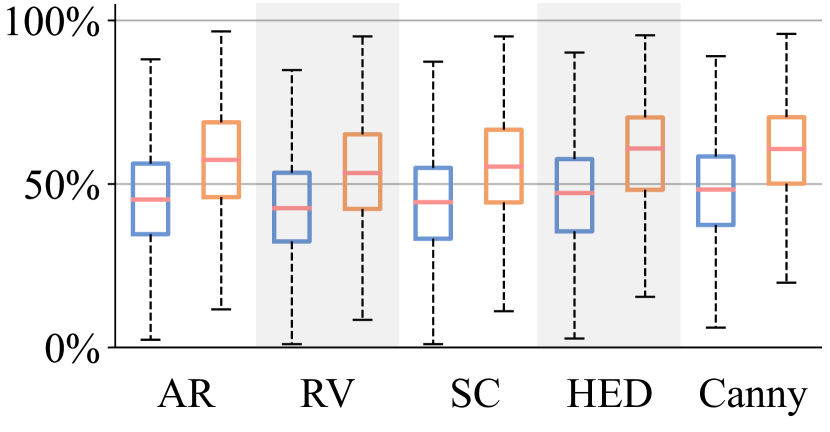
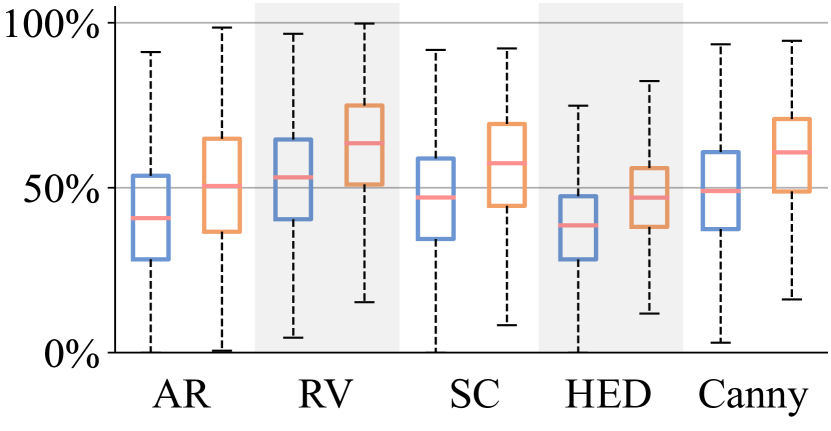
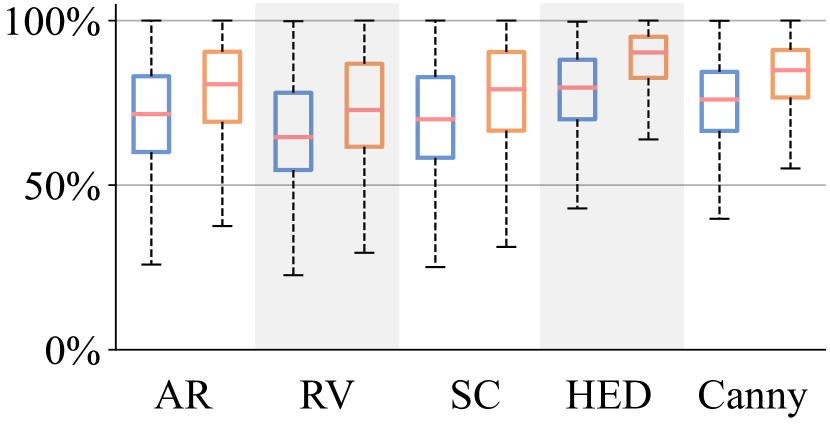
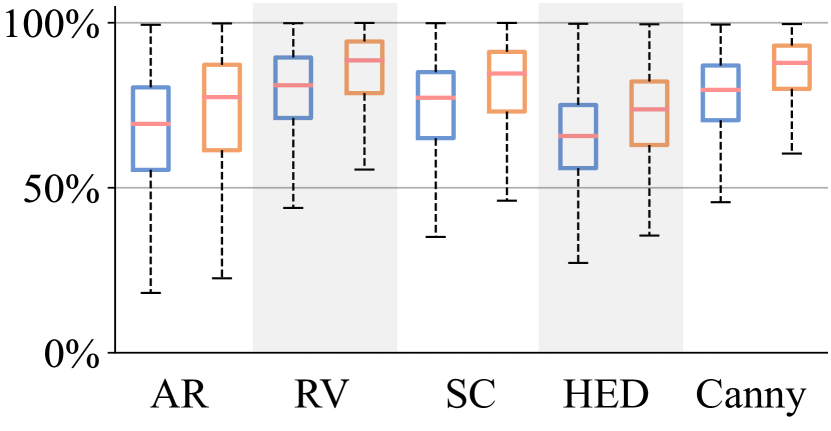
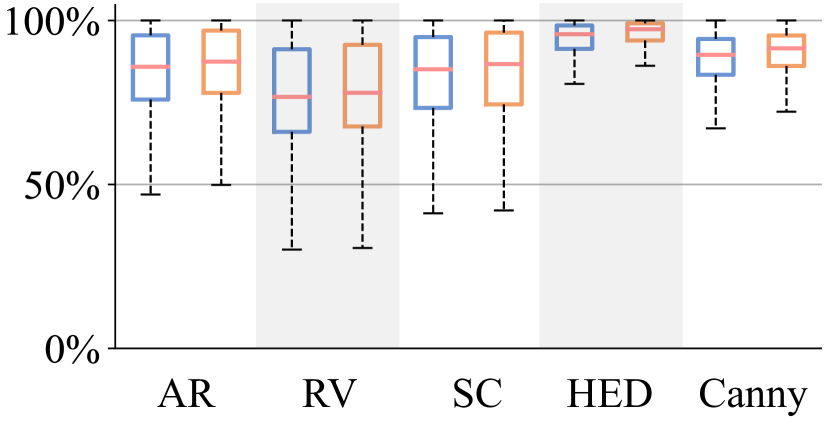
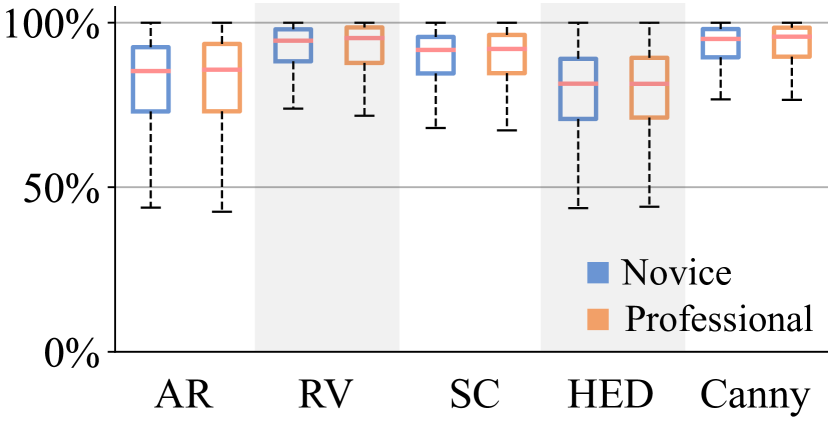
To facilitate potential applications of designing more effective algorithms for synthesizing freehand-like sketches, we analyzed the similarity between our collected freehand sketches (professional vs. novice) and line drawings generated by representative line drawing generation algorithms. We computed the precision and recall defined in Eq. 2 for the generated drawings of one human drawing under different registration strategies. We rasterized the vector sketches as one pixel width in the three levels of registration schemes as three groups of targets and considered the synthetic sketches to capture them according to the user drawing skills (professional vs. novice). We chose five representative algorithms for line drawing generation from two categories: NPR-based methods (apparent ridges (AR) (Judd et al., 2007), ridges and valleys (RV) (Ohtake et al., 2004), and suggestive contours (SC) (DeCarlo et al., 2003)) and edge detection-based methods (Canny (Canny, 1986) and holistically-nested edges (HED) (Xie and Tu, 2015)). We choose thresholds of the algorithms such that the number of generated pixel was the closest to the median number of filled pixels in user drawings, as done in (Wang et al., 2021). Figure 10 (a) shows the produced sketches and our registered drawings. We present the precision and recall on all the drawings using box plots to show the stability and plausibility of the algorithms on diverse models in Figure 10 (b), (c), and (d) for sketch-level, stroke-level, and pixel-level performance, respectively.
Conclusion: The professional sketches are more easily approximated by the synthetic drawings, but for the novice sketches, more efforts are still needed. The NPR-based methods sometimes lose the boundary lines or produce excessive lines, depending on the quality of 3D meshes. The Canny algorithm was the most stable to match the freehand drawings and synthetic ones. Considering the expressiveness and feasibility, the stroke-level registered sketches could be good targets for generating freehand sketch-like drawings using data-driven sketch synthesis algorithms.
6. Applications
Our main goal is to understand how differently novices and professionals sketch 3D objects and quantify their key differences. The analysis (Section 5) thus provides quantifiable proofs to benefit various applications (e.g., sketch synthesis and future research on sketch-based modeling), instead of directly improving sketch-based 3D modeling for novices. In this section, we first present a new approach for freehand-style sketch synthesis (Section 6.1) and then show a preliminary evaluation of existing sketch-based 3D reconstruction on our dataset as a testing set (Section 6.2).
6.1. Freehand-style Sketch Synthesis
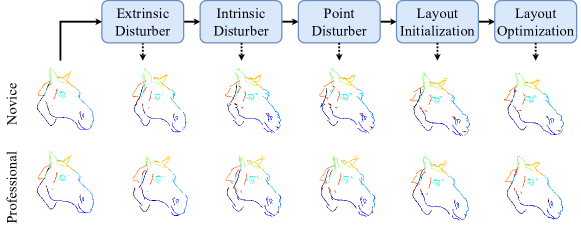
Although tracings have some similar features to freehand sketches (Wang et al., 2021), they could not substitute user drawings completely due to the difference from global to local (Section 5.2), hindering applying tracings or tracing-like sketches (e.g., contours of objects) to sketch-based applications expecting freehand sketches as input. To narrow the gap between them, we propose a learning-based framework to produce freehand-style sketches from tracings based on the collected drawings and their multi-level registered results. As shown in Figure 11 (a), we first reshape each stroke from global to local, i.e., disturbing its extrinsic and intrinsic parameters by three disturbers, and then re-group strokes following the relationship across them by layout refinement. The details of our synthesis method are as follows:
Preprocessing. We first fit the tracing strokes with unequal length to Bézier curves with fixed six control points as inputs.
Stroke Extrinsic Disturbing. We adopt an extrinsic disturber, i.e., a multilayer perceptron (MLP) with two hidden layers in our implementation, to predict a similarity transformation (, , ) for each stroke. The disturber is trained on the paired data, with each pair containing a sketch-level registered sketch and its corresponding stroke-level registered sketch, taking a Bézier curve as input and the transformation parameters , , (Section 5.2) as ground truth.
Stroke Intrinsic Disturbing. Next, the extrinsically reshaped Bézier curves are fed into an intrinsic disturber to approximate freehand-style stroke paths. The disturber (an MLP similar to that used for the extrinsic disturber) is trained on the paired pixel-level (input) and stroke-level (ground truth) results, with each stroke fitted to a Bézier curve.
Point Disturbing. Since the Bézier curve is too smooth to be like a human-drawn stroke with flutter points, we adopt Gaussian noise to model the random jittery and train one more disturber (an MLP) to add a normal noise into the rendered Bézier curve. The training dataset is paired sketch-level registered strokes and their fitted Bézier curves.
Layout Initialization. After the extrinsic and intrinsic disturbing, the changed strokes are messy spatially on canvas and thus hard to perceive a reasonable human-drawn drawings, as shown in Column 4 of Figure 11 (a). To refine the layout, we first translate the strokes one-by-one (similar to a stroke-by-stroke drawing process of a human artist) according to the positions of the previous strokes in the tracing layout, following
| (4) |
| (5) |
where and respectively indicate the -th tracing stroke and the disturbed stroke, and are the point indices of the two closest points between the two strokes and , and is the Euclidean distance between the two points.
Layout Optimization. With layout initialization for each stroke, the produced sketches have a stroke layout similar to the input tracings, but some strokes connected with each other in the tracings are still broken (Column 5 of Figure 11 (a)). To address the issue, we perform curve optimization on the problematic strokes, as done in (Ye et al., 2021). The objective function is defined as
| (6) |
where is the position term to guarantee the two strokes connected in the tracing stay connected, while the shape term and the smooth term help preserve the disturbed shape and stroke smoothness, respectively. Please refer to the paper (Ye et al., 2021) for a more detailed definition for each term. The optimized results (Figure 11 (a), Column 6) show that the optimization can effectively fix the broken issue.
We also introduce an extra input variable for the extrinsic disturber to control the noise level by computing the change magnitude between input and output. A similar variable is introduced for the intrinsic disturber. To simulate novice-style and professional-style drawings, we had the disturbers (i.e., the MLPs) respectively trained on the novice and professional datasets. Figure 11 (a) shows examples of the synthesized results.
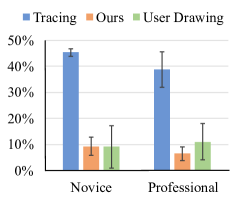
We conducted a perception user study to evaluate whether our synthesized results are close to human-drawn sketches or not. The evaluation was done by inviting participants to complete an online questionnaire. We prepared two sets of questions respectively for novices and professionals. Each set contained 9 groups, corresponding to the 9 categories we used for data collection. Each group corresponded to a prompt randomly picked from the concerned category, and consisted of its corresponding tracing, five user drawings (from either novices or professionals), and one synthesized result. Note that before the study, we had conducted a similar but preliminary study showing only one user drawing (randomly picked), but found people had different senses of recognizing freehand drawings, i.e., some preferred “noised-up” drawings while others preferred “aligned-well” ones. Instead of informing what the computer-generated sketches are like, for a fair comparison, in the final study we showed all the five drawings from the same group for users to form consistent criteria by themselves. We sampled the noise level and within [0,0.2] to synthesize freehand-style sketches. We asked each participant to pick out two options that were the least possible to be human-drawn sketches from the seven items given the corresponding image prompt. 48 participants helped with the study. Most of the participants had no professional drawing experience. In total, we got 48 (participants) 18 (questions) = 864 subjective evaluations.
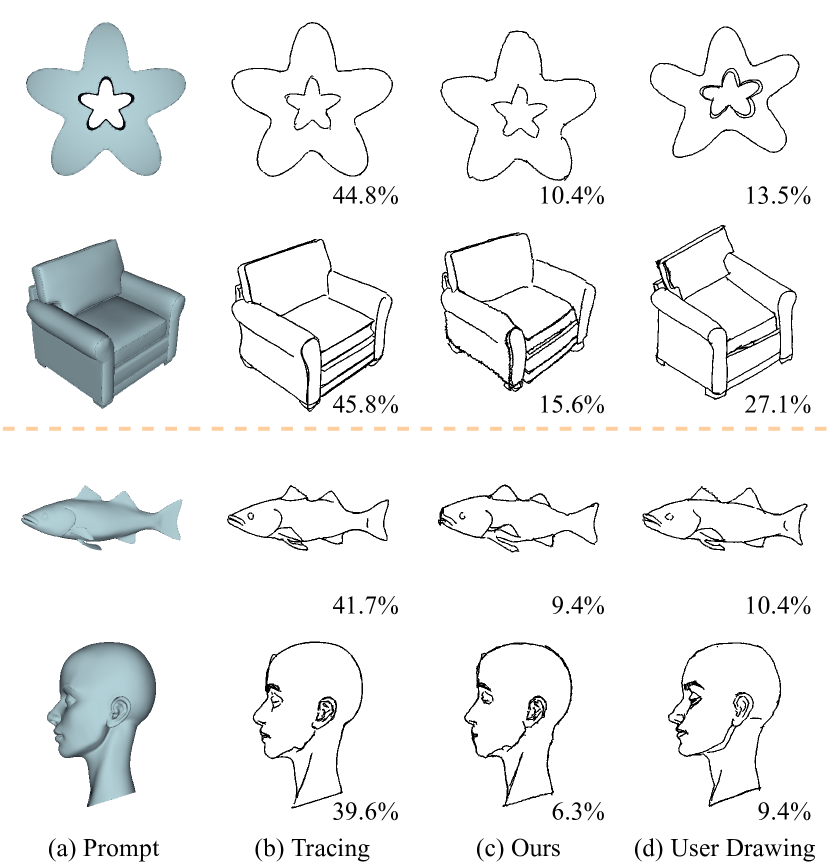
Figure 11 (b) visualizes the average voting rate for the three sketch types of options over 9 object groups for the novice and professional groups separately. Note that each human-drawn sketch got a voting rate and we computed the average voting rate of human-drawing type among the five drawings for each group. It is obvious that for both the novice and professional types, the tracings were easily recognized by the users, while the generated results had similar voting rates with the human drawings, meaning that our method could significantly fool the participants. The U-tests on all the 18 groups also support our results have a significant difference from tracings (=1.4e-7) but not from user drawings (=0.32). Figure 12 shows some examples of the perception study. Please find more implementation details and generated examples in Section 4.1 of Supplement.
| Method | Pixel2Mesh (N) | Pixel2Mesh (P) | R2N2 (N) | R2N2 (P) | PSGN (N) | PSGN (P) | Occ-Net (N) | Occ-Net (P) |
|---|---|---|---|---|---|---|---|---|
| IoU | 0.146 | 0.154 | 0.242 | 0.260 | - | - | 0.280 | 0.289 |
| CD () | 4.342 | 4.047 | 3.135 | 3.493 | 2.168 | 1.911 | 2.613 | 2.846 |
| NC | 0.620 | 0.628 | 0.584 | 0.598 | - | - | 0.728 | 0.734 |
6.2. Preliminary Evaluation of Sketch-based 3D Reconstruction
While it seems obvious that existing sketch-based 3D reconstruction methods would perform better with professional sketches, the reconstruction performance gap between professional and novice sketches has not been seriously studied before. Since we collected a dataset of freehand sketches from the two groups for 3D objects, one direct usage of our data is to test the performance of existing sketch-based 3D reconstruction methods. Although the volume of data we collected is moderately large (compared to the existing stroke-level sketch datasets), the samples in our dataset are far from sufficient to train any deep learning-based models from scratch. We thus performed a demonstrative experiment to show the simplest way of utilizing our collected data as testing samples in the shape reconstruction task. For simplicity, we focused on a single-view reconstruction (SVR) task tested on the Chair category, since Chair is known for its large variations in both geometry and structure.
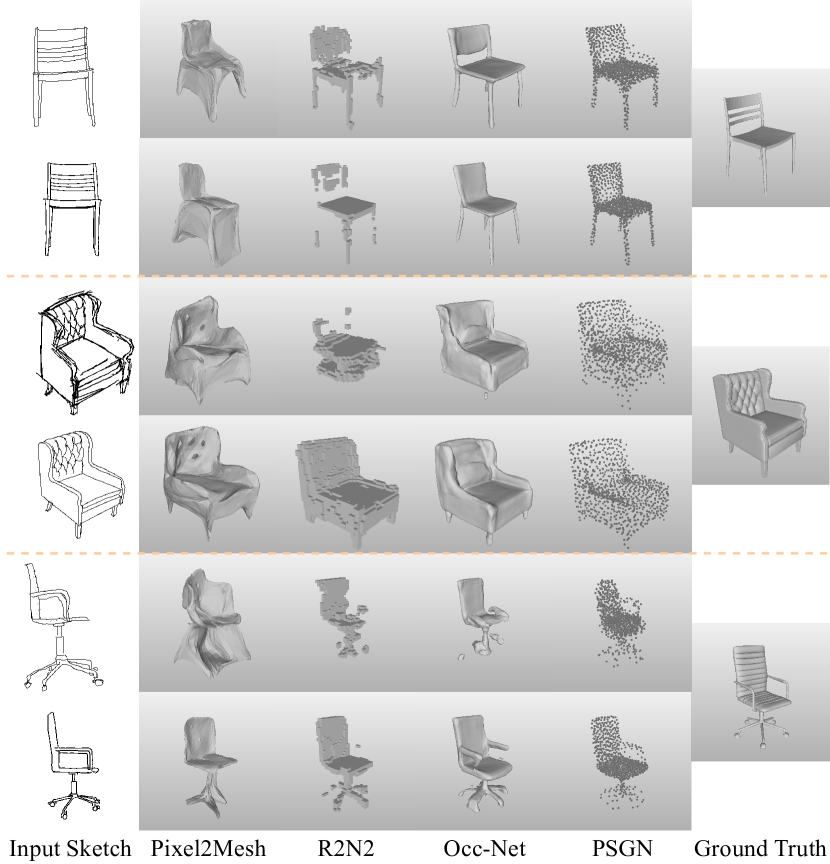
We chose four representative image-based shape reconstruction methods taking single-view sketches as input, including Pixel2Mesh (Wang et al., 2018), 3D-R2N2 (Choy et al., 2016), Occ-Net (Mescheder et al., 2019), and PSGN (Fan et al., 2017). Each of them respectively sets meshes, voxels, implicit functions, and point clouds as a 3D shape representation. For a fair comparison, we trained the four models with synthetic sketches from (Zhong et al., 2020a) and then tested them on 300 pairs of novice and professional sketches to obtain 600 reconstructed models for each method.
To compare the reconstruction performance of the four methods, we adopted three evaluation metrics to quantitatively measure the difference between the reconstructed meshes and the ground truth, including 3D Intersection over Union (IoU), Chamfer distance (CD), and Normal Consistency (NC) scores, as used by Mescheder et al. (2019). Table 5 presents the results averaged over the sketches from the novices and the professionals, separately. It shows that the reconstruction results from the professional sketches generally obtained better metric values. This is possibly because professional sketches are more similar to the synthetic sketches used in the training stage. PSGN received the lowest CD among all the four methods, mainly because CD was the only loss for used for training PSGN. Exceptionally, R2N2 and Occ-Net performed better on the novice sketches in terms of CD. We attribute this to no Chamfer loss being employed when training the two methods. Figure 13 shows qualitative results consistent to the metric values. Please find more setting details and visual comparisons in Section 4.2 of Supplement.
![[Uncaptioned image]](/html/2209.08791/assets/x26.png)
To further evaluate the effect of noise level on the synthesized sketches (Section 6.1), we tested the PSGN model with the synthesized sketches under different noise levels considering its consistent performance and simple input requirement (R2N2 and Occ-Net present inconsistent evaluation results while Pixel2Mesh requires an additional view angle input). We prepared the synthetic sketches with the noise levels = ranging from 0.05 to 0.3 with step size of 0.05 and calculated the CD values of the reconstructed results given the sketches of the two-group styles. Since sketches with noise larger than 0.3 exhibit severe stroke deformation, failing to preserve the target shape information, we exclude such sketches in this evaluation. We also tested the sketches with 0 noise level (i.e., tracings) using the same scheme. See the inset figure for the results. The two groups of synthetic sketches show an increasing trend with the rise of noise level. Generally, the synthetic professional sketches are more like the sketches used in training, showing lower CD values before noise level 0.25. All the synthesized sketches present lower CD values than our collected freehand sketches i.e., the dashed lines in the inset figure (professional and novice ), indicating that freehand sketches are more challenging for reconstruction techniques and needed for understanding their actual performance.
7. Conclusion and Discussion
In this paper, we conducted a study to investigate how differently professional and novice users sketch 3D objects on a newly collected dataset, called DifferSketching. By three levels of analysis, we found that (a) the professionals drew sketches more precisely as to the global variance (translation, rotation, scale) than the novices; (b) the professionals depicted strokes more fit to the underlying shapes than the novices; and (c) both the professional and novice users tended to depict the same contents given the same prompts, yet the professionals drew more consistently with each other and the novices’ depictions of the contents were more varied. By comparing the freehand sketches to various algorithm-generated drawings, we found converting the synthetic drawings to freehand-like ones by the guidance of stroke-level registered sketches are more effective and feasible. We believe the quantitative analysis could enlighten a new norm for sketch synthesis measurement.
We proposed a novel framework for freehand-style sketch synthesis trained on our collected dataset and the multi-level registered results. The evaluation shows our synthesis method and dataset are promising to be applied to (a) sketch style transfer between novices and professionals given the conclusion of Section 5.1; (b) model- or image-to-freehand sketch tasks by incorporating our method with the synthesis algorithms (e.g., those in Section 5.5); (c) sketch data augmentation, i.e., creating a large-scale sketch dataset to boost the performance and particularly generalization ability of sketch understanding techniques, e.g., for sketch-based shape reconstruction and sketch segmentation; etc. Also, it is interesting and potential to utilize deep learning techniques with our freehand-style sketch synthesis framework to produce higher-quality freehand drawings for diverse objects and introduce more types of disturbers (e.g., viewpoint) to obtain varied results.
We used our collected data as a testing set for preliminary evaluation of several state-of-the-art 3D reconstruction methods, and found that the professional sketches produced results with higher quality than the novice sketches by quantitative metrics. We directly applied our collected sketches to the generation modules to get the reconstruction results, which may suffer from the domain gap between the sketches we collected and the data that the generation models were trained on. In the future, we are interested in using our sketch synthesis method to create a large dataset of freehand-style sketches for re-training or fine-tuning the pre-trained networks. This approach could potentially improve the performance of current sketch-based 3D reconstruction methods.
We implemented the data collection user interface on tablets with styluses. It is convenient to record and process the data digitally while this setting may potentially incorporate the inaccuracies for non-digital drawing tool users to reflect their real drawing skills. Specifically, one artist claimed that she could not perform as well on the tablet as in the paper-and-pencil setting. In the sketch collection stage, we required the participants to depict the shape in the prompt images and ignore the lighting/shading effects. This limits our analysis only on the perception and depiction of shape information from the collected data. The analysis on perception and depiction of lighting/shading effects for people is an interesting subject and worthy of further efforts towards this direction, like (Wang et al., 2021).
For collecting relatively large-scale data, we chose the algorithmic registration to save enormous labor of the manual alignment as done by Cole et al. (2008). Although we believe our method (Section 4) could preserve most of users’ intentions in a low-cost way, it is potentially the best way to ask users to confirm whether their intentions are faithfully maintained after registration. The registration algorithm works smoothly for most of the sketches in our dataset. For the badly registered samples, we recruited users to manually assign the corresponding points of the sketches and the prompt images to provide initialization in the registration process (see Section 2 in Supplement. Despite all the efforts we made, there are still some samples that cannot be registered precisely (empirically, ¡1.2 in Eq. 1) to the prompts. Since the registration errors lead to the inaccuracies in our quantitative statistics, we excluded such samples in our dataset. There are some sketch samples with strokes that mismatch with the prompts severely in our dataset. Such sketches only take less than in our dataset. We hope to use more sophisticated registration methods to resolve such a problem.
In the future, our dataset can be further processed or annotated to serve as new benchmarks for various sketch understanding tasks. With the rich correspondence between our sketches and the 3D models, the inter-sketched tasks requiring 3D information previously could be evaluated effectively, such as sketch segmentation (Yang et al., 2021; Huang et al., 2014), multi-view sketch correspondence (Yu et al., 2020). By analyzing the difference between the drawings from novices and professionals, our study could be insightful for art training, as well as applications aiming at assisting the drawing process, like (Dixon et al., 2010). Our dataset can potentially help design more effective sketch-based modeling techniques for novice users, e.g., by utilizing more characteristics (like the stroke order) of sketches.
Besides, we summarize some future directions that could be possibly done with our current study. We did not set the time limit for completing one drawing in our current study. It is interesting to study the drawings with given a time limit and compare the drawing differences from people with different drawing skills. It is also interesting to study the perspective perception and depiction of users with different levels of drawing skills, with potential annotations on the 3D models as fiducials. In addition, we only adopted some low-level metrics to evaluate the accuracy of strokes and sketches in the analysis. It would be insightful to devise some high-level metrics, e.g., line parallelism, roundness, curvature monotonicity, to further study the difference of the drawings.
Acknowledgements.
We thank the anonymous reviewers from SIGGRAPH 2022 and SIGGRAPH Asia 2022 for the constructive comments, and the sketch data contributors for their time and effort. A special thank goes to Aaron Hertzmann, who provided great support to this project in its early stage. The work was supported by an unrestricted gift from Adobe, and grants from the Research Grants Council of the Hong Kong Special Administrative Region, China (No. CityU 11212119), City University of Hong Kong (No. 9229094), Beijing Nova Program of Science and Technology (No. Z191100001119077), and the Centre for Applied Computing and Interactive Media (ACIM) of School of Creative Media, CityU.References
- (1)
- Berger et al. (2013) Itamar Berger, Ariel Shamir, Moshe Mahler, Elizabeth Carter, and Jessica Hodgins. 2013. Style and abstraction in portrait sketching. ACM Transactions on Graphics (TOG) 32, 4 (2013), 1–12.
- Bertasius et al. (2015) Gedas Bertasius, Jianbo Shi, and Lorenzo Torresani. 2015. Deepedge: A multi-scale bifurcated deep network for top-down contour detection. In Proceedings of the IEEE conference on computer vision and pattern recognition. 4380–4389.
- Bhunia et al. (2020) Ayan Kumar Bhunia, Ayan Das, Umar Riaz Muhammad, Yongxin Yang, Timothy M Hospedales, Tao Xiang, Yulia Gryaditskaya, and Yi-Zhe Song. 2020. Pixelor: A Competitive Sketching AI Agent. So you think you can sketch? ACM Transactions on Graphics (TOG) 39, 6 (2020), 1–15.
- Calabrese and Marucci (2006) Lucia Calabrese and Francesco S Marucci. 2006. The influence of expertise level on the visuo-spatial ability: differences between experts and novices in imagery and drawing abilities. Cognitive Processing 7, 1 (2006), 118–120.
- Canny (1986) John Canny. 1986. A computational approach to edge detection. IEEE Transactions on pattern analysis and machine intelligence 6 (1986), 679–698.
- Chen et al. (2020) Shu-Yu Chen, Wanchao Su, Lin Gao, Shihong Xia, and Hongbo Fu. 2020. DeepFaceDrawing: Deep Generation of Face Images from Sketches. ACM Transactions on Graphics (Proceedings of ACM SIGGRAPH 2020) 39, 4 (2020), 72:1–72:16.
- Choy et al. (2016) Christopher B Choy, Danfei Xu, JunYoung Gwak, Kevin Chen, and Silvio Savarese. 2016. 3d-r2n2: A unified approach for single and multi-view 3d object reconstruction. In European conference on computer vision. Springer, 628–644.
- Cohen and Bennett (1997) Dale J Cohen and Susan Bennett. 1997. Why can’t most people draw what they see? Journal of Experimental Psychology: Human Perception and Performance 23, 3 (1997), 609.
- Cole et al. (2008) Forrester Cole, Aleksey Golovinskiy, Alex Limpaecher, Heather Stoddart Barros, Adam Finkelstein, Thomas Funkhouser, and Szymon Rusinkiewicz. 2008. Where do people draw lines? In ACM SIGGRAPH 2008 papers. 1–11.
- DeCarlo et al. (2003) Doug DeCarlo, Adam Finkelstein, Szymon Rusinkiewicz, and Anthony Santella. 2003. Suggestive contours for conveying shape. In ACM SIGGRAPH 2003 Papers. 848–855.
- Delanoy et al. (2018) Johanna Delanoy, Mathieu Aubry, Phillip Isola, Alexei A Efros, and Adrien Bousseau. 2018. 3d sketching using multi-view deep volumetric prediction. Proceedings of the ACM on Computer Graphics and Interactive Techniques 1, 1 (2018), 1–22.
- Dixon et al. (2010) Daniel Dixon, Manoj Prasad, and Tracy Hammond. 2010. icandraw: Using sketch recognition and corrective feedback to assist a user in drawing human faces. In Proceedings of the SIGCHI Conference on Human Factors in Computing Systems. 897–906.
- Du et al. (2020) Dong Du, Xiaoguang Han, Hongbo Fu, Feiyang Wu, Yizhou Yu, Shuguang Cui, and Ligang Liu. 2020. SAniHead: Sketching Animal-like 3D Character Heads Using a View-surface Collaborative Mesh Generative Network. IEEE Transactions on Visualization and Computer Graphics (2020).
- Eitz et al. (2012a) Mathias Eitz, James Hays, and Marc Alexa. 2012a. How do humans sketch objects? ACM Transactions on graphics (TOG) 31, 4 (2012), 1–10.
- Eitz et al. (2012b) Mathias Eitz, Ronald Richter, Tamy Boubekeur, Kristian Hildebrand, and Marc Alexa. 2012b. Sketch-based shape retrieval. ACM Transactions on graphics (TOG) 31, 4 (2012), 1–10.
- Fan et al. (2017) Haoqiang Fan, Hao Su, and Leonidas J Guibas. 2017. A point set generation network for 3d object reconstruction from a single image. In Proceedings of the IEEE conference on computer vision and pattern recognition. 605–613.
- Fu et al. (2011) Hongbo Fu, Shizhe Zhou, Ligang Liu, and Niloy J Mitra. 2011. Animated construction of line drawings. In Proceedings of the 2011 SIGGRAPH Asia Conference. 1–10.
- Gryaditskaya et al. (2019) Yulia Gryaditskaya, Mark Sypesteyn, Jan Willem Hoftijzer, Sylvia C Pont, Frédo Durand, and Adrien Bousseau. 2019. OpenSketch: a richly-annotated dataset of product design sketches. ACM Trans. Graph. 38, 6 (2019), 232–1.
- Guillard et al. (2021) Benoit Guillard, Edoardo Remelli, Pierre Yvernay, and Pascal Fua. 2021. Sketch2Mesh: Reconstructing and Editing 3D Shapes from Sketches. arXiv preprint arXiv:2104.00482 (2021).
- Ha and Eck (2017) David Ha and Douglas Eck. 2017. A neural representation of sketch drawings. arXiv preprint arXiv:1704.03477 (2017).
- Han et al. (2017) Xiaoguang Han, Chang Gao, and Yizhou Yu. 2017. Deepsketch2face: a deep learning based sketching system for 3d face and caricature modeling. ACM Transactions on graphics (TOG) 36, 4 (2017), 1–12.
- Huang et al. (2014) Zhe Huang, Hongbo Fu, and Rynson WH Lau. 2014. Data-driven segmentation and labeling of freehand sketches. ACM Transactions on Graphics (TOG) 33, 6 (2014), 1–10.
- Isola et al. (2017) Phillip Isola, Jun-Yan Zhu, Tinghui Zhou, and Alexei A Efros. 2017. Image-to-image translation with conditional adversarial networks. In Proceedings of the IEEE conference on computer vision and pattern recognition. 1125–1134.
- Judd et al. (2007) Tilke Judd, Frédo Durand, and Edward Adelson. 2007. Apparent ridges for line drawing. ACM transactions on graphics (TOG) 26, 3 (2007), 19–es.
- Li et al. (2017a) Changjian Li, Hao Pan, Yang Liu, Xin Tong, Alla Sheffer, and Wenping Wang. 2017a. Bendsketch: Modeling freeform surfaces through 2d sketching. ACM Transactions on Graphics (TOG) 36, 4 (2017), 1–14.
- Li et al. (2020) Lei Li, Changqing Zou, Youyi Zheng, Qingkun Su, Hongbo Fu, and Chiew-Lan Tai. 2020. Sketch-r2cnn: An rnn-rasterization-cnn architecture for vector sketch recognition. IEEE transactions on visualization and computer graphics (2020).
- Li et al. (2017b) Yi Li, Yi-Zhe Song, Timothy M Hospedales, and Shaogang Gong. 2017b. Free-hand sketch synthesis with deformable stroke models. International Journal of Computer Vision 122, 1 (2017), 169–190.
- Liu et al. (2020) Difan Liu, Mohamed Nabail, Aaron Hertzmann, and Evangelos Kalogerakis. 2020. Neural contours: Learning to draw lines from 3d shapes. In Proceedings of the IEEE/CVF Conference on Computer Vision and Pattern Recognition. 5428–5436.
- Liu et al. (2017) Yun Liu, Ming-Ming Cheng, Xiaowei Hu, Kai Wang, and Xiang Bai. 2017. Richer convolutional features for edge detection. In Proceedings of the IEEE conference on computer vision and pattern recognition. 3000–3009.
- Lun et al. (2017) Zhaoliang Lun, Matheus Gadelha, Evangelos Kalogerakis, Subhransu Maji, and Rui Wang. 2017. 3d shape reconstruction from sketches via multi-view convolutional networks. In 2017 International Conference on 3D Vision (3DV). IEEE, 67–77.
- Matthews and Adams (2008) William J Matthews and Amy Adams. 2008. Another reason why adults find it hard to draw accurately. Perception 37, 4 (2008), 628–630.
- Mescheder et al. (2019) Lars Mescheder, Michael Oechsle, Michael Niemeyer, Sebastian Nowozin, and Andreas Geiger. 2019. Occupancy networks: Learning 3d reconstruction in function space. In Proceedings of the IEEE/CVF Conference on Computer Vision and Pattern Recognition. 4460–4470.
- Ohtake et al. (2004) Yutaka Ohtake, Alexander Belyaev, and Hans-Peter Seidel. 2004. Ridge-valley lines on meshes via implicit surface fitting. In ACM SIGGRAPH 2004 Papers. 609–612.
- Qi et al. (2021) Anran Qi, Yulia Gryaditskaya, Jifei Song, Yongxin Yang, Yonggang Qi, Timothy M Hospedales, Tao Xiang, and Yi-Zhe Song. 2021. Toward Fine-Grained Sketch-Based 3D Shape Retrieval. IEEE Transactions on Image Processing 30 (2021), 8595–8606.
- Sangkloy et al. (2016) Patsorn Sangkloy, Nathan Burnell, Cusuh Ham, and James Hays. 2016. The sketchy database: learning to retrieve badly drawn bunnies. ACM Transactions on Graphics (TOG) 35, 4 (2016), 1–12.
- Schmidt et al. (2009) Ryan Schmidt, Azam Khan, Gord Kurtenbach, and Karan Singh. 2009. On expert performance in 3D curve-drawing tasks. In Proceedings of the 6th eurographics symposium on sketch-based interfaces and modeling. 133–140.
- Shen et al. (2015) Wei Shen, Xinggang Wang, Yan Wang, Xiang Bai, and Zhijiang Zhang. 2015. Deepcontour: A deep convolutional feature learned by positive-sharing loss for contour detection. In Proceedings of the IEEE conference on computer vision and pattern recognition. 3982–3991.
- Su et al. (2018) Wanchao Su, Dong Du, Xin Yang, Shizhe Zhou, and Hongbo Fu. 2018. Interactive sketch-based normal map generation with deep neural networks. Proceedings of the ACM on Computer Graphics and Interactive Techniques 1, 1 (2018), 1–17.
- Tchalenko (2009) John Tchalenko. 2009. Segmentation and accuracy in copying and drawing: Experts and beginners. Vision research 49, 8 (2009), 791–800.
- Wang et al. (2018) Nanyang Wang, Yinda Zhang, Zhuwen Li, Yanwei Fu, Wei Liu, and Yu-Gang Jiang. 2018. Pixel2mesh: Generating 3d mesh models from single rgb images. In Proceedings of the European conference on computer vision (ECCV). 52–67.
- Wang et al. (2021) Zeyu Wang, Sherry Qiu, Nicole Feng, Holly Rushmeier, Leonard McMillan, and Julie Dorsey. 2021. Tracing Versus Freehand for Evaluating Computer-Generated Drawings. ACM Trans. Graph. 40, 4 (Aug. 2021), 12 pages. https://doi.org/10.1145/3450626.3459819
- Xie and Tu (2015) Saining Xie and Zhuowen Tu. 2015. Holistically-nested edge detection. In Proceedings of the IEEE international conference on computer vision. 1395–1403.
- Yan et al. (2020) Chuan Yan, David Vanderhaeghe, and Yotam Gingold. 2020. A benchmark for rough sketch cleanup. ACM Transactions on Graphics (TOG) 39, 6 (2020), 1–14.
- Yang et al. (2021) Lumin Yang, Jiajie Zhuang, Hongbo Fu, Xiangzhi Wei, Kun Zhou, and Youyi Zheng. 2021. SketchGNN: Semantic Sketch Segmentation with Graph Neural Networks. ACM Transactions on Graphics (TOG) 40, 3 (2021), 1–13.
- Yaniv et al. (2018) Ziv Yaniv, Bradley C Lowekamp, Hans J Johnson, and Richard Beare. 2018. SimpleITK image-analysis notebooks: a collaborative environment for education and reproducible research. Journal of digital imaging 31, 3 (2018), 290–303.
- Ye et al. (2021) Hui Ye, Kin Chung Kwan, and Hongbo Fu. 2021. 3D curve creation on and around physical objects with mobile AR. IEEE Transactions on Visualization & Computer Graphics 01 (2021), 1–1.
- Yu et al. (2020) Deng Yu, Lei Li, Youyi Zheng, Manfred Lau, Yi-Zhe Song, Chiew-Lan Tai, and Hongbo Fu. 2020. SketchDesc: Learning local sketch descriptors for multi-view correspondence. IEEE Transactions on Circuits and Systems for Video Technology 31, 5 (2020), 1738–1750.
- Yu et al. (2016) Qian Yu, Feng Liu, Yi-Zhe Song, Tao Xiang, Timothy M Hospedales, and Chen-Change Loy. 2016. Sketch me that shoe. In Proceedings of the IEEE Conference on Computer Vision and Pattern Recognition. 799–807.
- Yu et al. (2015) Qian Yu, Yongxin Yang, Yi-Zhe Song, Tao Xiang, and Timothy Hospedales. 2015. Sketch-a-net that beats humans. arXiv preprint arXiv:1501.07873 (2015).
- Zhang et al. (2021) Song-Hai Zhang, Yuan-Chen Guo, and Qing-Wen Gu. 2021. Sketch2Model: View-Aware 3D Modeling from Single Free-Hand Sketches. In Proceedings of the IEEE/CVF Conference on Computer Vision and Pattern Recognition. 6012–6021.
- Zhong et al. (2020a) Yue Zhong, Yulia Gryaditskaya, Honggang Zhang, and Yi-Zhe Song. 2020a. Deep sketch-based modeling: Tips and tricks. In 2020 International Conference on 3D Vision (3DV). IEEE, 543–552.
- Zhong et al. (2020b) Yue Zhong, Yonggang Qi, Yulia Gryaditskaya, Honggang Zhang, and Yi-Zhe Song. 2020b. Towards practical sketch-based 3d shape generation: The role of professional sketches. IEEE Transactions on Circuits and Systems for Video Technology 31, 9 (2020), 3518–3528.
See pages - of ./Supp_DifferSketching.pdf